GDF15 is required for cold-induced thermogenesis and contributes to improved systemic metabolic health following loss of OPA1 in brown adipocytes
- Fraternal Order of Eagles Diabetes Research Center and Division of Endocrinology and Metabolism, Roy J. and Lucille A. Carver College of Medicine, University of Iowa, United States
- Department of Internal Medicine, University of Michigan, United States
Figures
Figure 1 with 1 supplement
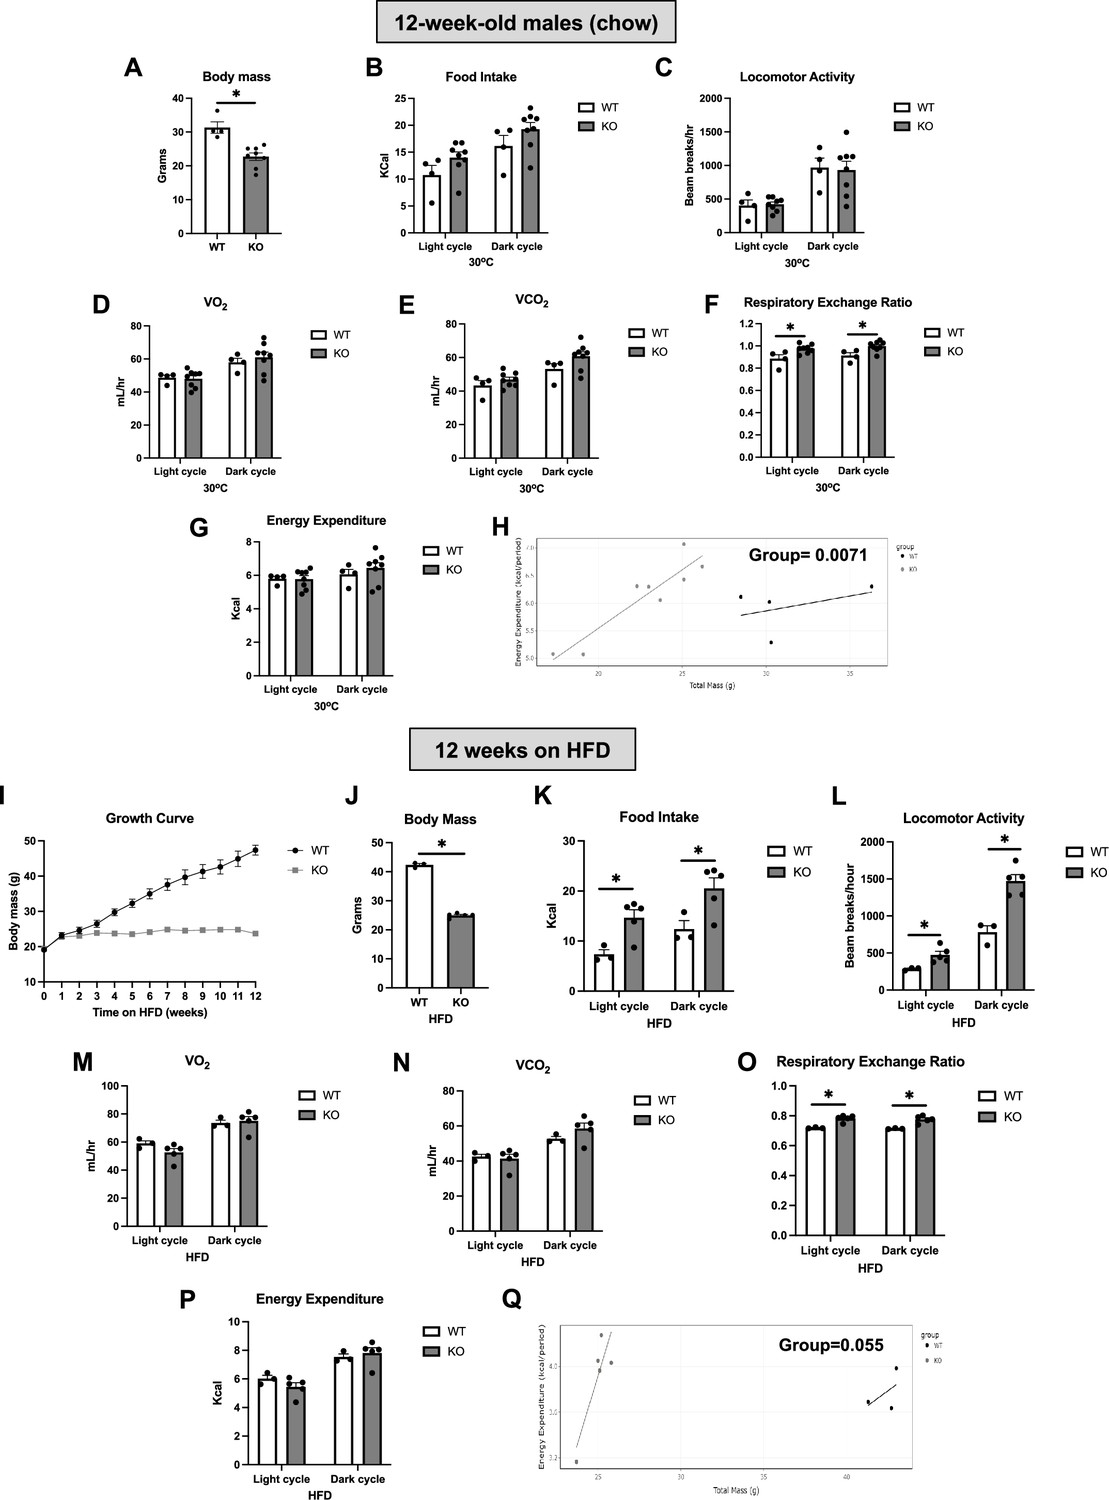
OPA1 BKO mice have higher resting metabolic rates and are completely resistant to diet-induced obesity (DIO).
(A–D) Data collected on 12-week-old male OPA1 BKO mice. (A) Body mass. (B–G) Indirect calorimetry data represented as the average for the light and dark cycles during the last 48 hr of data recording. (B) Food intake. (C) Locomotor activity. (D) Oxygen consumption (VO2). (E) Carbon dioxide production (VCO2). (F) Respiratory exchange ratio. (G) Energy expenditure. (H) ANCOVA of energy expenditure as a function of body mass. (I–Q) Data collected on 18-week-old male OPA1 BKO mice fed high-fat diet (60% calories from fat) for 12 wk (diet started at 6 wk of age). (I) Body weight curve. (J) Final body weight (cohort used for indirect calorimetry data collection). (K–Q) Indirect calorimetry data represented as the average for the light and dark cycles during the last 48 hr of data recording. (K) Food intake. (L) Locomotor activity. (M) Oxygen consumption (VO2). (N) Carbon dioxide production (VCO2). (O) Respiratory exchange ratio. (P) Energy expenditure. (Q) ANCOVA of energy expenditure as a function of body mass. Data are expressed as means ± SEM. Significant differences were determined by Student’s t-test using a significance level of p<0.05. *Significantly different vs. wild-type (WT) mice.
Figure 1—figure supplement 1

Food consumption, locomotor activity, and energy expenditure in OPA1 BAT knockout (KO) mice under baseline conditions and following high-fat feeding.
(A–D) Hourly indirect calorimetry data during the light and dark cycles in the last 48 hr of data recording. Data was collected from 12-week-old male OPA1 BAT KO and control mice, consuming normal chow. (A) Hourly food consumed. (B) Locomotor activity. (C) Respiratory exchange ratio. (D) Energy expenditure. (E–I) Hourly indirect calorimetry data during the light and dark cycles in the last 48 hr of data recording. Data was collected from 18-week-old male OPA1 BAT KO and wild-type (WT) control mice fed high-fat diet (HFD – 60% calories from fat) for 12 wk (diet started at 6 wk of age). (E) Hourly food consumption. (F) Cumulative food consumption. (G) Locomotor activity. (H) Respiratory exchange ratio. (I) Energy expenditure. (J) ANCOVA of oxygen consumption as a function of body mass for HFD mice. (K) Serum GDF15 levels in OPA1 BKO mice under baseline conditions, after cold exposure (3 d at 4°C) and after 12 wk of high-fat feeding. Data are expressed as means ± SEM. Significant differences for the group effect were determined by ANCOVA using a significance level of p<0.05. One-Way ANOVA was used to determine the differences in GDF15 serum levels using a significance level of p<0.05. ** p <0.01. **** p <0.0001. Significantly different vs. WT RT.
Figure 2
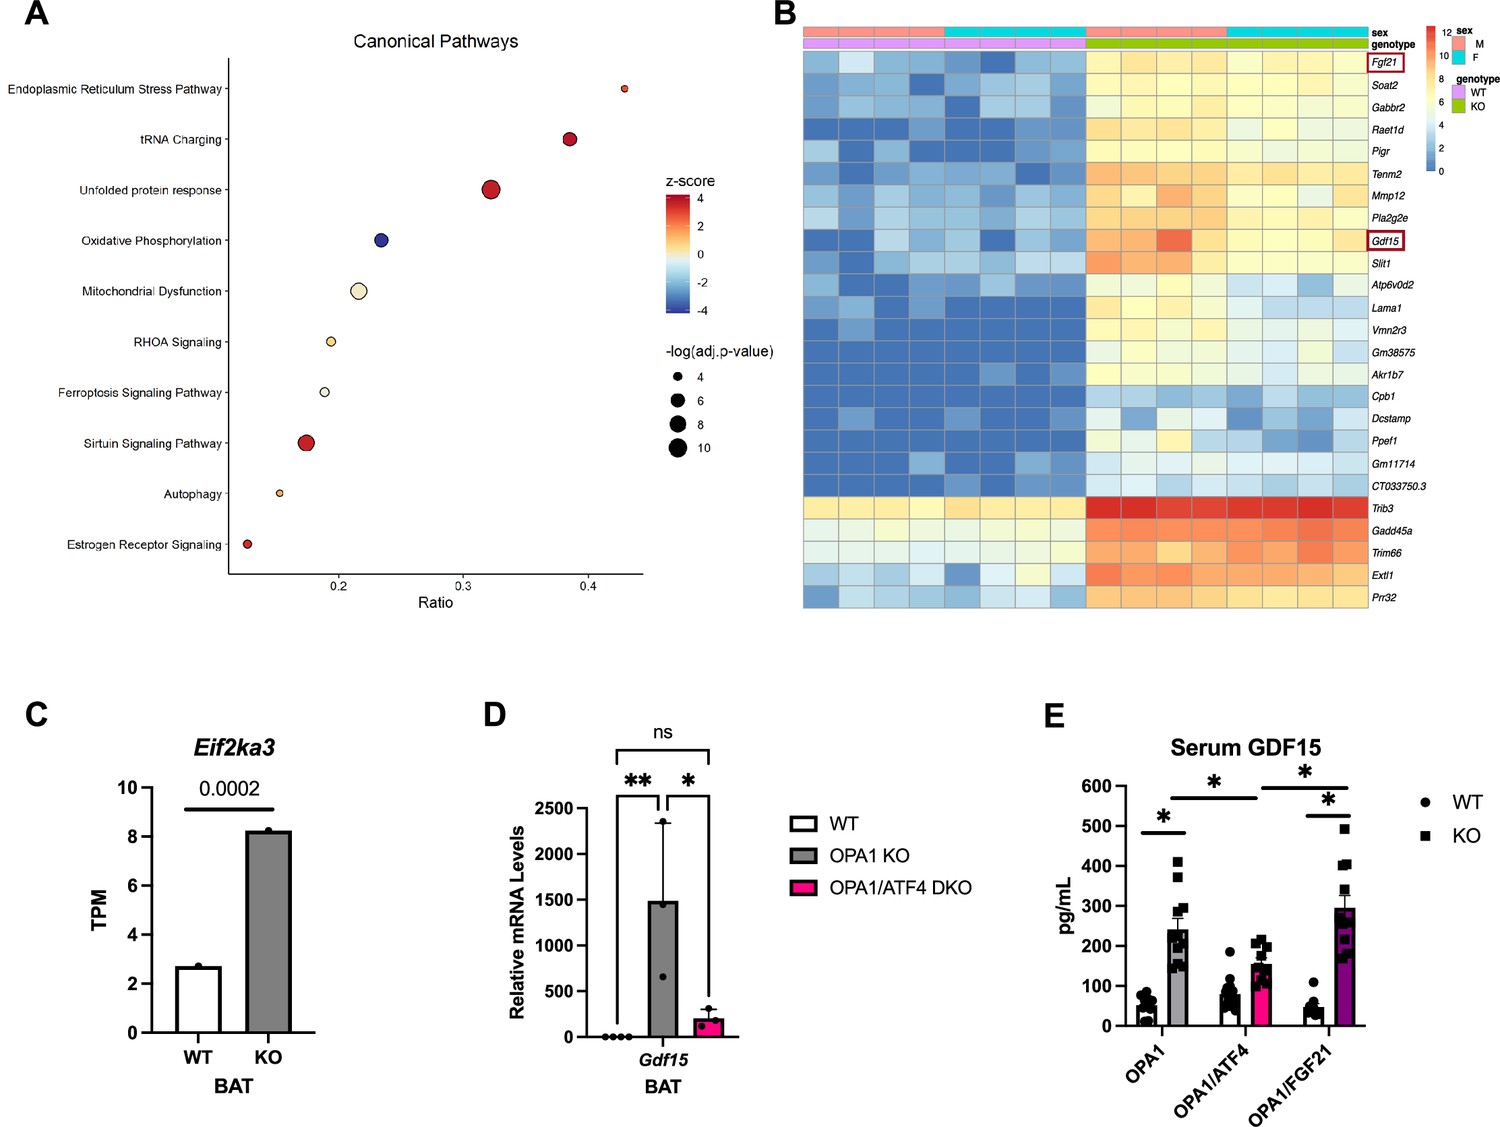
Transcriptome analysis reveals induction of the unfolded protein response (UPR) and GDF15 in mice lacking OPA1 in brown adipose tissue (BAT).
(A–C) Data collected from BAT of 7-week-old male and female OPA1 BKO mice. (A) Bubble plot showing the top 10 canonical pathways from the Ingenuity Pathway Analysis (IPA) database containing genes with a significant overlap (adjusted p-value≤0.05) to those differentially expressed in OPA1 BKO mice. Size of the bubble indicates the -log of the adjusted p-value (Benjamini–Hochberg) from the pathway analysis. Plotted on the x-axis is the ratio of differentially expressed genes relative to the number of genes in the pathway. The bubble color indicates the z-score, which indicates the predicted activation (positive) or inhibition (negative) of the pathway based on the directionality of the gene changes in OPA1 BKO relative to wild-type (WT) mice. (B) Heatmap of the top 25 differentially expressed genes in OPA1 BKO mice. (C) Bar graph showing the Log2 transcript per million (TPM) for the Eif2ka3 gene (encoding PERK). (D) Relative mRNA expression of Gdf15 in BAT of OPA1 BKO and in OPA1/ATF4 BAT DKO mice normalized to tata box protein (Tbp) expression. (E) GDF15 serum levels in OPA1 BKO, OPA1/ATF4 BAT DKO, and OPA1/FGF21 BAT DKO mice. Data are expressed as means ± SEM. Significant differences were determined by Student’s t-test using a significance level of p<0.05. * p <0.05; ** p <0.01. Significantly different vs. WT mice or from OPA1 KO.
Figure 3
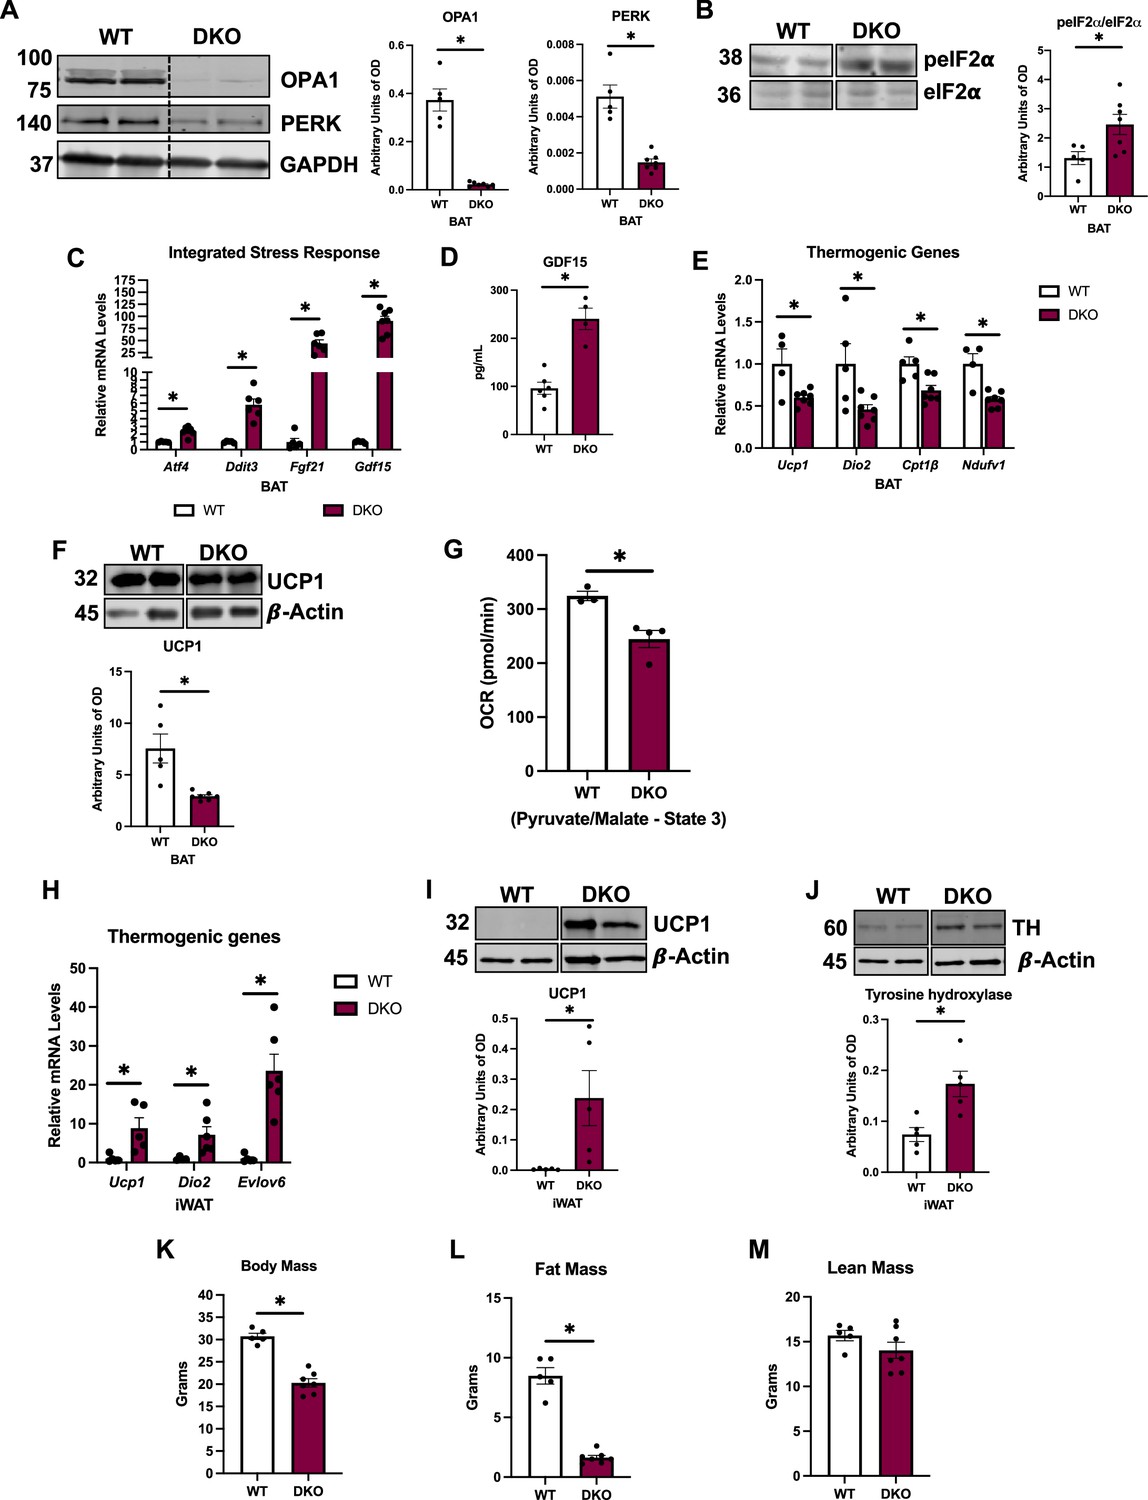
PERK is dispensable for the integrated stress response (ISR) activation in OPA1 BKO mice.
(A–G) Data collected from 8-week-old OPA1/PERK BAT double-knockout (DKO) male and female mice. (A) Representative immunoblots for OPA1 and PERK protein in brown adipose tissue (BAT) normalized to GAPDH and their respective densitometric quantification. (B) Representative immunoblots for phospho-eIF2α (peIF2α) normalized to total eIF2α protein levels in BAT and the respective densitometric quantification. Optical density (OD). (C) Relative mRNA expression of the ISR genes Atf4, Ddit3, Fgf21, and Gdf15 normalized to Tbp expression in BAT. (D) GDF15 serum levels (ad libitum-fed conditions). (E) Relative mRNA expression of the thermogenic genes normalized to tata box protein (Tbp) expression in BAT. (F) Representative immunoblots for uncoupling protein 1 (UCP1) protein levels in BAT normalized to β-actin and the respective densitometric quantification. (G) ADP-stimulated (state 3) pyruvate-malate-supported oxygen consumption rates (OCRs) in mitochondria isolated from BAT. (H) Relative mRNA expression of the thermogenic genes normalized to Tbp expression in inguinal white adipose tissue (iWAT). (I) Representative immunoblots for UCP1 in iWAT normalized to β-actin and the respective densitometric quantification. (J) Representative immunoblots for tyrosine hydroxylase (TH) protein levels in iWAT normalized to β-actin and the respective densitometric quantification. OD, optical density. (K–M) Data collected in 20-week-old male DKO mice. (K) Body mass. (L) Total fat mass. (M) Total lean mass. Data are expressed as means ± SEM. Significant differences were determined by Student’s t-test using a significance level of p<0.05. *Significantly different vs. wild-type (WT) mice.
-
Figure 3—source data 1
PERK is dispensable for the integrated stress response (ISR) activation in OPA1 BKO mice.
(A) Full immunoblot images for OPA1, PERK, and GAPDH in brown adipose tissue (BAT) (uncropped blots with the relevant bands labeled). (B) Full immunoblot images for pEif2a and Eif2a in BAT. (F) Full immunoblot images for UCP1 and β-actin in BAT. (I) Full immunoblot images for UCP1 and β-actin in inguinal white adipose tissue (iWAT). (J) Full immunoblot images for tyrosine hydroxylase (TH) and β-actin in iWAT.
- https://cdn.elifesciences.org/articles/86452/elife-86452-fig3-data1-v1.zip
-
Figure 3—source data 2
Original file with the full raw unedited blot for OPA1 in brown adipose tissue (BAT) of OPA1/PERK double-knockout (DKO) mice.
- https://cdn.elifesciences.org/articles/86452/elife-86452-fig3-data2-v1.zip
-
Figure 3—source data 3
Original file with the full raw unedited blot for PERK in brown adipose tissue (BAT) of OPA1/PERK double-knockout (DKO) mice.
- https://cdn.elifesciences.org/articles/86452/elife-86452-fig3-data3-v1.zip
-
Figure 3—source data 4
Original file with the full raw unedited blot for GAPDH in brown adipose tissue (BAT) of OPA1/PERK double-knockout (DKO) mice.
- https://cdn.elifesciences.org/articles/86452/elife-86452-fig3-data4-v1.zip
-
Figure 3—source data 5
Original file with the full raw unedited blot for peIF2α in brown adipose tissue (BAT) of OPA1/PERK double-knockout (DKO) mice.
- https://cdn.elifesciences.org/articles/86452/elife-86452-fig3-data5-v1.zip
-
Figure 3—source data 6
Original file with the full raw unedited blot for total eIF2α in brown adipose tissue (BAT) of OPA1/PERK double-knockout (DKO) mice.
- https://cdn.elifesciences.org/articles/86452/elife-86452-fig3-data6-v1.zip
-
Figure 3—source data 7
Original file with the full raw unedited blot for total UCP1 in brown adipose tissue (BAT) of OPA1/PERK double-knockout (DKO) mice.
- https://cdn.elifesciences.org/articles/86452/elife-86452-fig3-data7-v1.zip
-
Figure 3—source data 8
Original file with the full raw unedited blot for β-actin for UCP1 in brown adipose tissue (BAT) of OPA1/PERK double-knockout (DKO) mice.
- https://cdn.elifesciences.org/articles/86452/elife-86452-fig3-data8-v1.zip
-
Figure 3—source data 9
Original file with the full raw unedited blot for total UCP1 in inguinal white adipose tissue (iWAT) of OPA1/PERK double-knockout (DKO) mice.
- https://cdn.elifesciences.org/articles/86452/elife-86452-fig3-data9-v1.zip
-
Figure 3—source data 10
Original file with the full raw unedited blot for β-actin for UCP1 in inguinal white adipose tissue (iWAT) of OPA1/PERK double-knockout (DKO) mice.
- https://cdn.elifesciences.org/articles/86452/elife-86452-fig3-data10-v1.zip
-
Figure 3—source data 11
Original file with the full raw unedited blot for total tyrosine hydroxylase (TH) in inguinal white adipose tissue (iWAT) of OPA1/PERK double-knockout (DKO) mice.
- https://cdn.elifesciences.org/articles/86452/elife-86452-fig3-data11-v1.zip
-
Figure 3—source data 12
Original file with the full raw unedited blot for β-actin for tyrosine hydroxylase (TH) in inguinal white adipose tissue (iWAT) of OPA1/PERK double-knockout (DKO) mice.
- https://cdn.elifesciences.org/articles/86452/elife-86452-fig3-data12-v1.zip
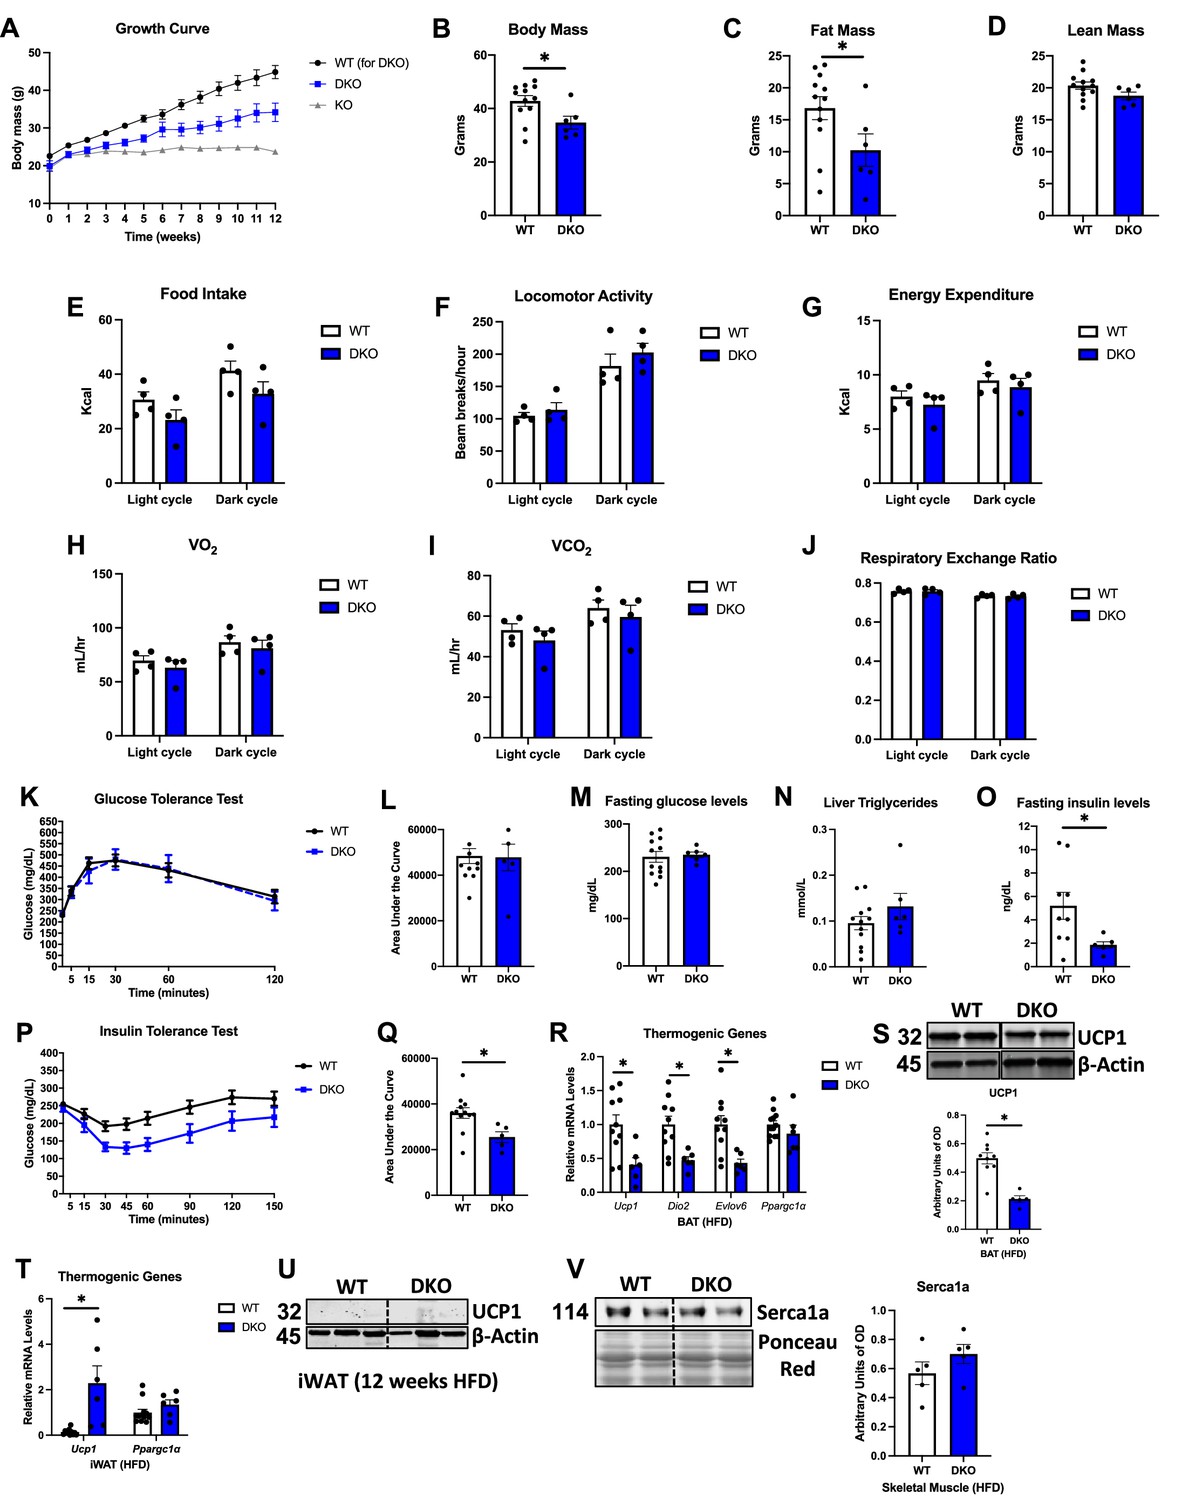
Figure 4 with 1 supplement
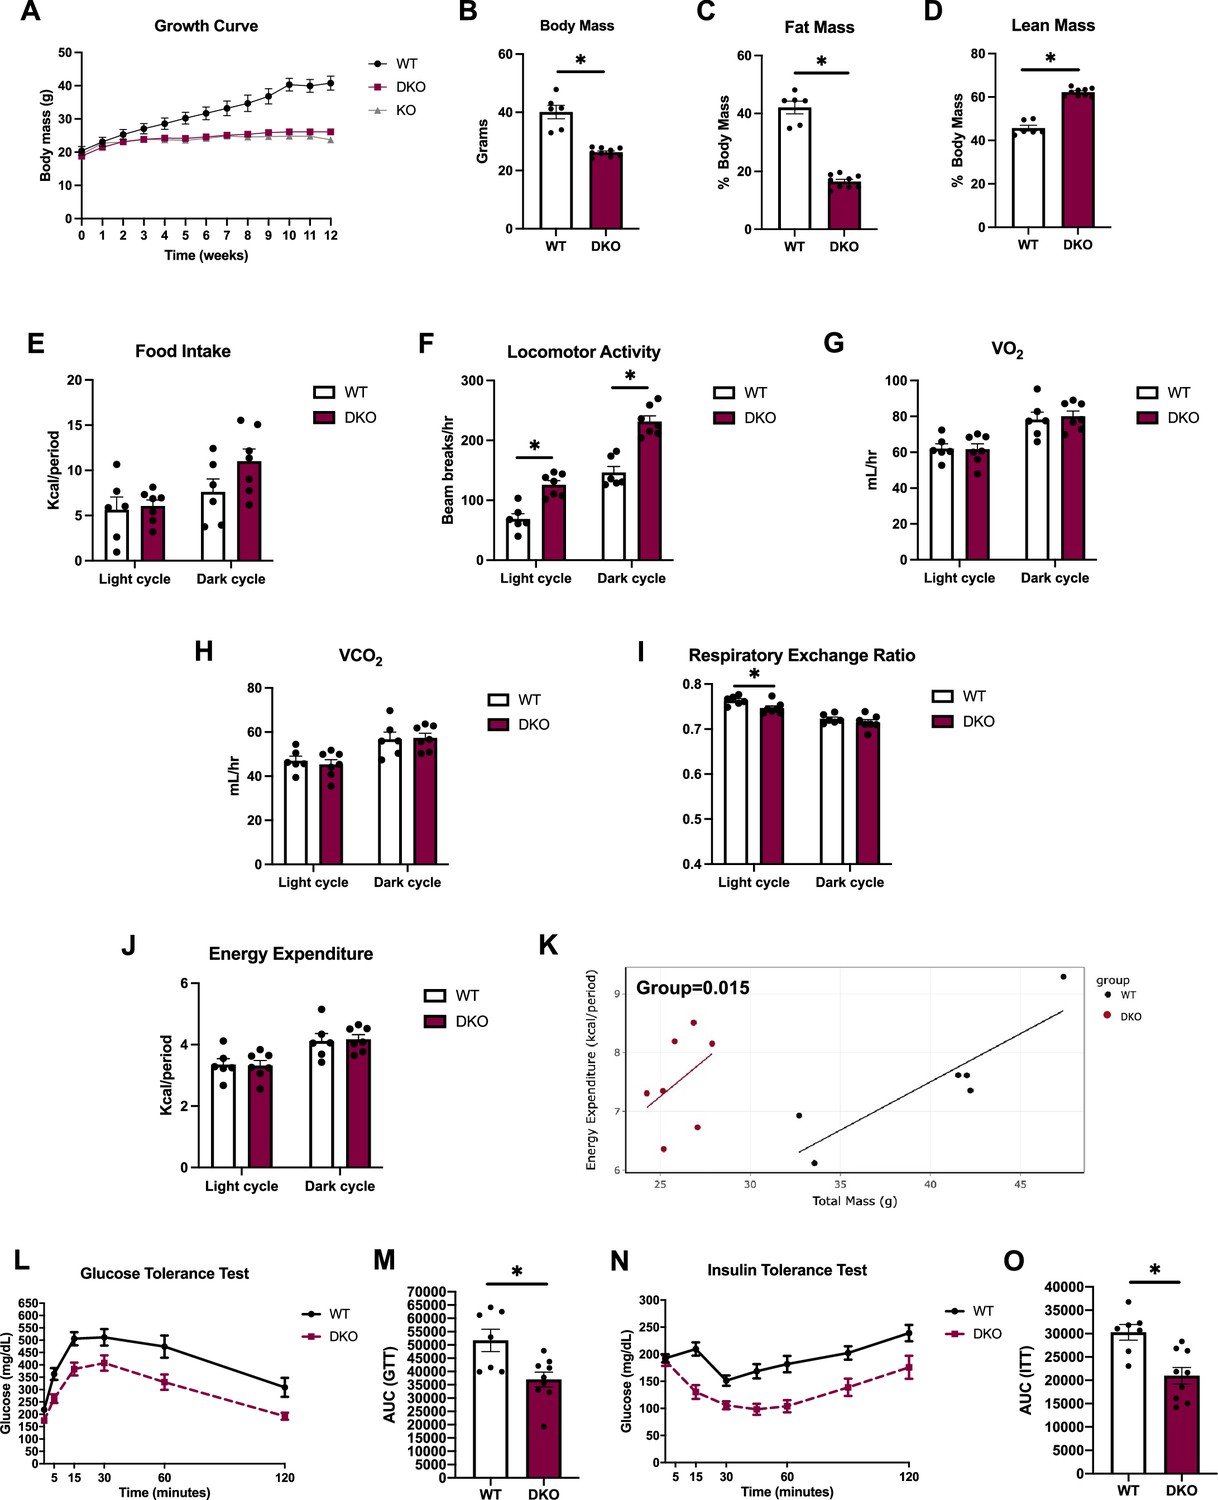
OPA1/PERK brown adipose tissue (BAT) double-knockout (DKO) mice are resistant to DIO and insulin resistance.
(A–O) Data collected in OPA1/PERK BAT DKO male mice fed a high-fat diet (HFD) for 12 wk. (A) Body weight curve comparing wild-type (WT), OPA1 BKO, and OPA1/PERK BAT DKO mice. (B) Final body weight. (C) Percent fat mass. (D) Percent lean mass. (E–K) Indirect calorimetry data represented as the average for the light and dark cycles during the last 48 hr of data recording. (E) Food intake. (F) Locomotor activity. (G) Oxygen consumption (VO2). (H) Carbon dioxide production (VCO2). (I) Respiratory exchange ratio. (J) Energy expenditure. (K) ANCOVA of energy expenditure as a function of body mass. (L) Glucose tolerance test (GTT). (M) Area under the curve (AUC) for the GTT. (N) Insulin tolerance test (ITT). (O) AUC for the ITT. Data are expressed as means ± SEM. Significant differences were determined by Student’s t-test using a significance level of p<0.05. *Significantly different vs. WT mice.
Figure 4—figure supplement 1
Food consumption locomotor activity and energy expenditure in OPA1/PERK brown adipose tissue (BAT) double-knockout (DKO) mice.
(A–F) Hourly indirect calorimetry data during the light and dark cycles in the last 48 hr of data recording. Data was collected from 18-week-old male OPA1/PERK BAT DKO and wild-type (WT) control mice fed high-fat diet (60% calories from fat) for 12 wk (diet started at 6 wk of age). (A) Hourly food consumption. (B) Cumulative food consumption. (C) Locomotor activity. (D) Cumulative distance in the cage. (E) Respiratory exchange ratio. (F) Energy expenditure. Data are expressed as means ± SEM.
Figure 5 with 2 supplements
OPA1/GDF15 double-knockout (DKO) mice have similar metabolic phenotype as OPA1 BKO mice under baseline conditions.
(A–O) Data collected in OPA1/GDF15 brown adipose tissue (BAT) DKO mice under baseline conditions (room temperature or 30°C/regular chow). (A) Relative mRNA expression of Opa1 and Gdf15 in BAT normalized to tata box protein (Tbp) expression. (B). GDF15 serum levels (ad libitum-fed conditions). (C) BAT mass relative to body mass in 8-week-old mice. (D) Representative images of H&E-stained histological sections of BAT (n = 3). Scale bar = 50 µm. (E) Electron micrographs of BAT. Scale bar = 2 µm. (F) Relative mRNA expression of the thermogenic genes in BAT normalized to Tbp expression. (G) Representative immunoblots for UCP1 in BAT normalized to β-actin, and their respective densitometric quantification. Optical density (OD). (H) ADP-stimulated (state 3) pyruvate-malate-supported oxygen consumption rates (OCRs) in mitochondria isolated from BAT. (I) Relative mRNA expression of the integrated stress response (ISR) genes Atf4, Ddit3, and Fgf21 normalized to Tbp expression. (J) FGF21 serum levels (ad libitum-fed conditions). (K) Representative images of H&E-stained histological sections of inguinal white adipose tissue (iWAT) (n = 3). Scale bar = 50 µm. (L) Relative mRNA expression of the thermogenic genes in iWAT normalized to Tbp expression. (M) Representative immunoblots for UCP1 in iWAT normalized to β-actin and their respective densitometric quantification. (N) Representative immunoblots for tyrosine hydroxylase (TH) in iWAT normalized to β-actin and their respective densitometric quantification. OD, optical density. (O) Body mass at 8, 10, and 20 wk of age. (P–U) Indirect calorimetry data represented as the average for the light and dark cycles during the last 48 hr of data recording in male mice around 10–12 wk of age. (P) Food intake. (Q) Locomotor activity. (R) Energy expenditure. (S) Oxygen consumption (VO2). (T) Carbon dioxide production (VCO2). (U) Respiratory exchange ratio. Data are expressed as means ± SEM. Significant differences were determined by Student’s t-test using a significance level of p<0.05. *Significantly different vs. wild-type (WT) mice.
-
Figure 5—source data 1
OPA1/GDF15 double-knockout (DKO) mice have similar metabolic phenotype as OPA1 BKO mice under baseline conditions (uncropped blots with the relevant bands labeled).
(G) Full immunoblot images for UCP1 and β-actin in BAT. (M) Full immunoblot images for UCP1 and β-actin in inguinal white adipose tissue (iWAT). (N) Full immunoblot images for tyrosine hydroxylase (TH) and β-actin in iWAT.
- https://cdn.elifesciences.org/articles/86452/elife-86452-fig5-data1-v1.zip
-
Figure 5—source data 2
Original file with the full raw unedited blot for UCP1 in BAT of OPA1/GDF15 double-knockout (DKO mice).
- https://cdn.elifesciences.org/articles/86452/elife-86452-fig5-data2-v1.zip
-
Figure 5—source data 3
Original file with the full raw unedited blot for β-actin for UCP1 in BAT of OPA1/GDF15 double-knockout (DKO) mice.
- https://cdn.elifesciences.org/articles/86452/elife-86452-fig5-data3-v1.zip
-
Figure 5—source data 4
Original file with the full raw unedited blot for UCP1 in inguinal white adipose tissue (iWAT) of OPA1/GDF15 double-knockout (DKO) mice.
- https://cdn.elifesciences.org/articles/86452/elife-86452-fig5-data4-v1.zip
-
Figure 5—source data 5
Original file with the full raw unedited blot for β-actin for UCP1 in inguinal white adipose tissue (iWAT) of OPA1/GDF15 double-knockout (DKO) mice.
- https://cdn.elifesciences.org/articles/86452/elife-86452-fig5-data5-v1.zip
-
Figure 5—source data 6
Original file with the full raw unedited blot for tyrosine hydroxylase (TH) in inguinal white adipose tissue (iWAT) of OPA1/GDF15 double-knockout (DKO) mice.
- https://cdn.elifesciences.org/articles/86452/elife-86452-fig5-data6-v1.zip
-
Figure 5—source data 7
Original file with the full raw unedited blot for β-actin for tyrosine hydroxylase (TH) in inguinal white adipose tissue (iWAT) of OPA1/GDF15 double-knockout (DKO) mice.
- https://cdn.elifesciences.org/articles/86452/elife-86452-fig5-data7-v1.zip
Figure 5—figure supplement 1

GDF15 expression in wild-type thermogenic adipocytes does not influence energy metabolism, glucose homeostasis and core body temperature under baseline conditions.
(A–J) Data collected in 6-week-old GDF15 BKO male mice and their wild-type (WT) control fed regular chow and under ambient temperature conditions. (A) Relative mRNA expression of Gdf15 in brown adipose tissue (BAT) normalized to tata box protein (Tbp). (B) Relative mRNA expression of Gdf15 in inguinal white adipose tissue (iWAT) normalized to Tbp. (C) GDF15 serum levels. (D) Core body temperatures measured with a rectal probe. (E) Body mass. (F) Total fat mass. (G) Total lean mass. (H) Glucose tolerance test (GTT). (I) Area under the curve (AUC) for the GTT. (J) Fasting blood glucose levels. Data are expressed as means ± SEM. Significant differences were determined by Student’s t-test using a significance level of p<0.05. *Significantly different vs. wild-type (WT) mice.
Figure 5—figure supplement 2
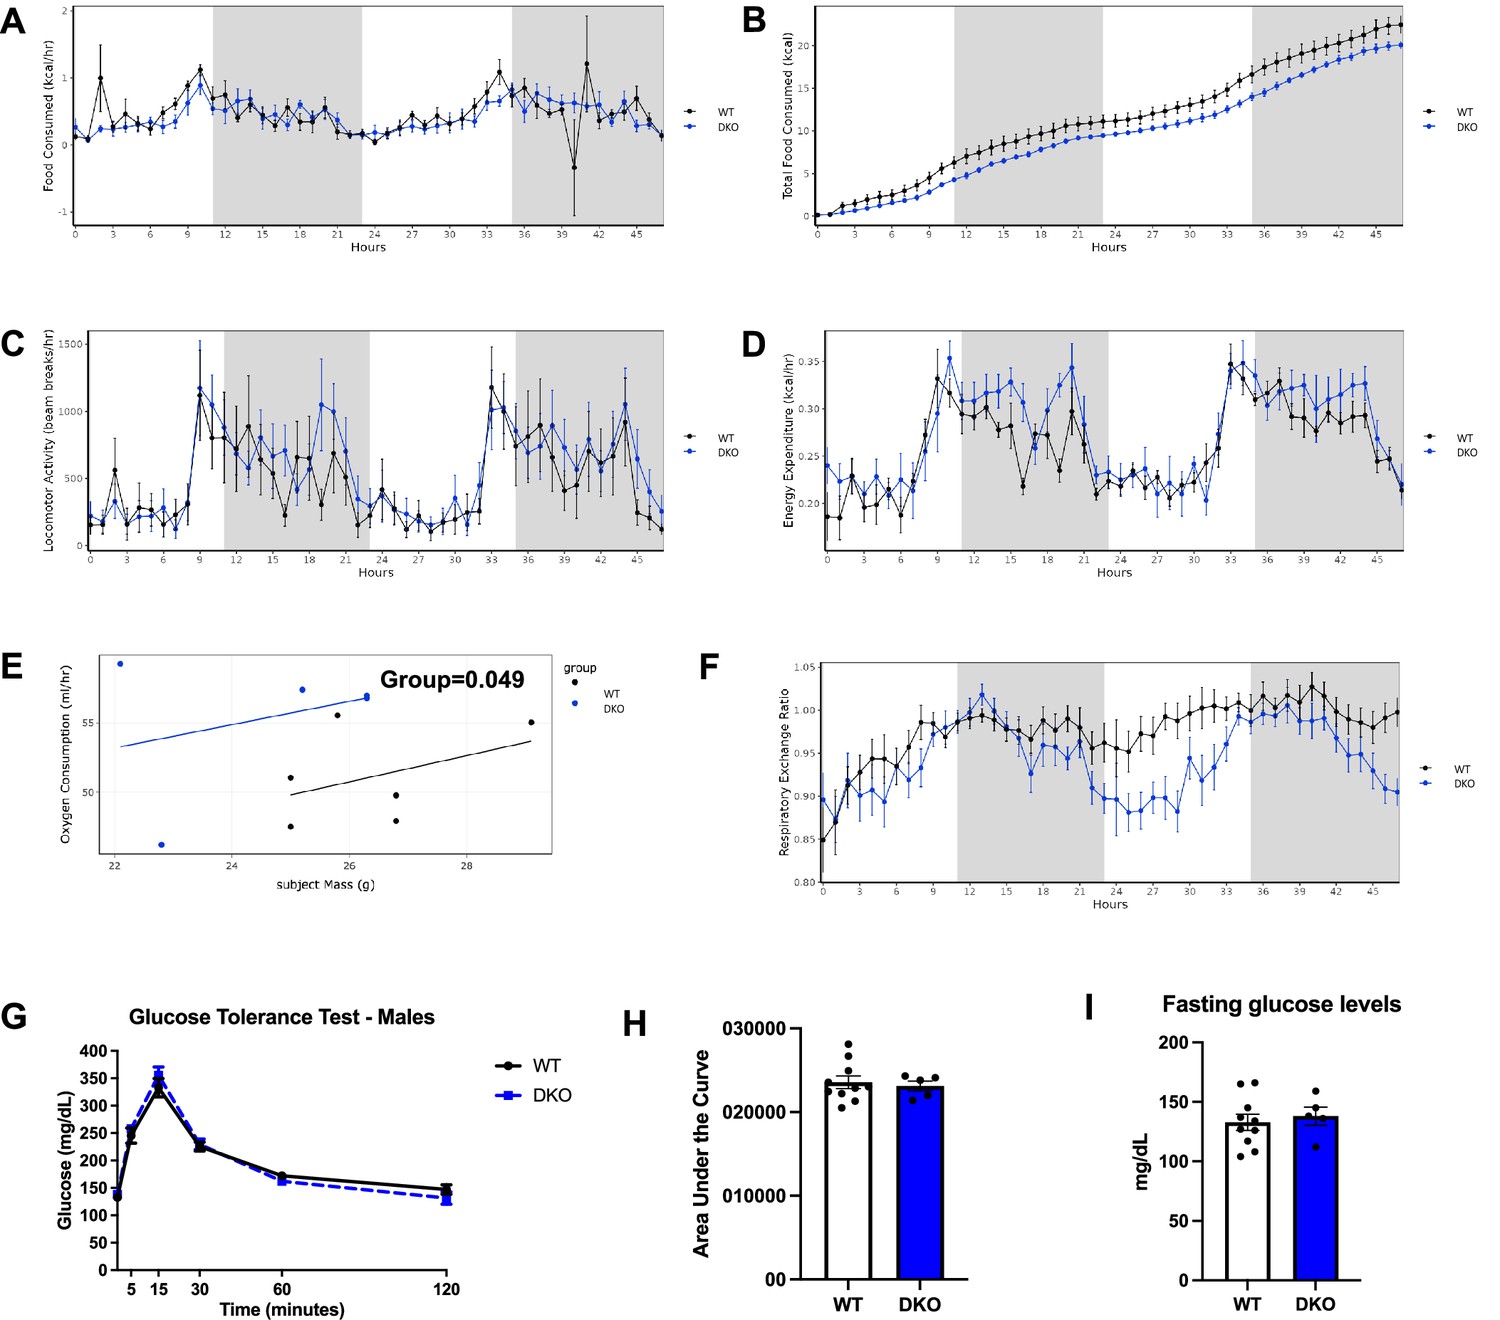
Metabolic phenotyping of OPA1/GDF15 double-knockout (DKO) mice under baseline conditions.
(A–F) Hourly indirect calorimetry data in the light and dark cycles during the last 48 hr of data recording. Data were collected in male DKO and wild-type (WT) control mice between 10–12 wk of age (baseline conditions). (A) Hourly food intake. (B) Cumulative food consumption. (C) Locomotor activity. (D) Energy expenditure. (E) ANCOVA of oxygen consumption as a function of body mass. (F) Respiratory exchange ratio. (G) Glucose tolerance test (GTT). (H) Area under the curve (AUC) for the GTT. (I) Fasting glucose levels. Data are expressed as means ± SEM. Significant differences for the group effect were determined by ANCOVA using a significance level of p<0.05.
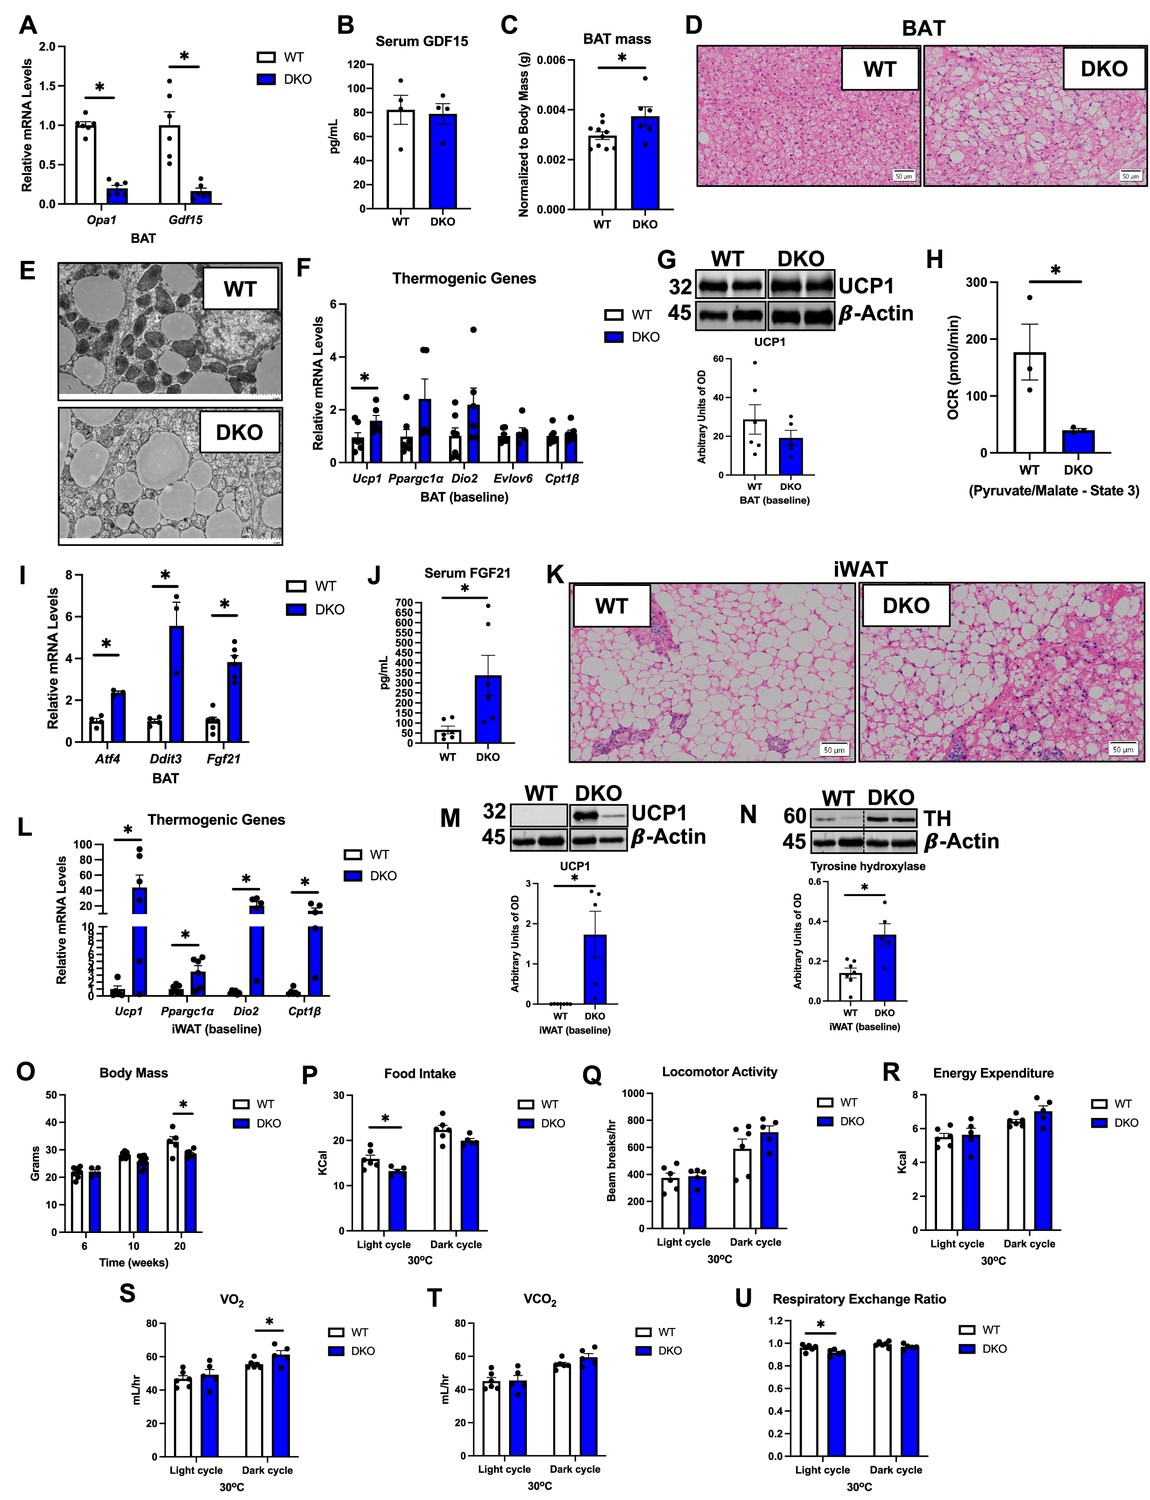
Figure 6 with 1 supplement
GDF15 partially mediates the resistance to diet-induced obesity (DIO) and is required to improve glucose homeostasis in OPA1 BKO mice.
(A–O) Data collected in OPA1/GDF15 brown adipose tissue (BAT) double-knockout (DKO) male mice fed a high-fat diet (HFD) for 12 wk. (A) Body weight curve comparing wild-type (WT), OPA1 BKO, and OPA1/GDF15 BAT DKO mice. (B) Final body mass. (C) Total fat mass. (D) Total lean mass. (E–J) Indirect calorimetry data represented as the average for the light and dark cycles during the last 48 hr of data recording. (E) Food intake. (F) Locomotor activity. (G) Energy expenditure. (H) Oxygen consumption (VO2). (I) Carbon dioxide production (VCO2). (J) Respiratory exchange ratio. (K) Glucose tolerance test (GTT). (L) Area under the curve (AUC) for the GTT. (M) Fasting glucose levels. (N) Liver triglycerides levels. (O) Fasting insulin levels. (P) Insulin tolerance test (ITT). (Q) AUC for the ITT. (R) Relative mRNA expression of thermogenic genes in BAT normalized to tata box protein (Tbp) expression. (S) Representative immunoblots for UCP1 in BAT normalized to β-actin and their respective densitometric quantification. Optical Density (OD). (T) Relative mRNA expression of thermogenic genes in inguinal white adipose tissue (iWAT) normalized to Tbp expression. (U) Representative immunoblots for UCP1 in iWAT normalized to β-actin. OD, optical density. (V) Representative immunoblots for Serca1a in gastrocnemius muscle normalized to Ponceau red staining and their respective densitometric quantification. OD, optical density. Data are expressed as means ± SEM. Significant differences were determined by Student’s t-test using a significance level of p<0.05. *Significantly different vs. WT mice.
-
Figure 6—source data 1
GDF15 partially mediates the resistance to diet-induced obesity (DIO) and is required to improve glucose homeostasis in OPA1 BKO mice (uncropped blots with the relevant bands labeled).
(S) Full immunoblot images for UCP1 and β-actin in brown adipose tissue (BAT). (U) Full immunoblot images for UCP1 and β-actin in inguinal white adipose tissue (iWAT). (V) Full immunoblot for Serca1a in gastrocnemius muscle and Ponceau red staining.
- https://cdn.elifesciences.org/articles/86452/elife-86452-fig6-data1-v1.zip
-
Figure 6—source data 2
Original file with the full raw unedited blot for UCP1 in brown adipose tissue (BAT) of OPA1/GDF15 double-knockout (DKO) mice after 12 wk on a high-fat diet.
- https://cdn.elifesciences.org/articles/86452/elife-86452-fig6-data2-v1.zip
-
Figure 6—source data 3
Original file with the full raw unedited blot for β-actin for UCP1 in brown adipose tissue (BAT) of OPA1/GDF15 double-knockout (DKO) mice after 12 wk on a high-fat diet.
- https://cdn.elifesciences.org/articles/86452/elife-86452-fig6-data3-v1.zip
-
Figure 6—source data 4
Original file with the full raw unedited blot for UCP1 in inguinal white adipose tissue (iWAT) of OPA1/GDF15 double-knockout (DKO) mice after 12 wk on a high-fat diet.
- https://cdn.elifesciences.org/articles/86452/elife-86452-fig6-data4-v1.zip
-
Figure 6—source data 5
Original file with the full raw unedited blot for β-actin for UCP1 in inguinal white adipose tissue (iWAT) of OPA1/GDF15 double-knockout (DKO) mice after 12 wk on a high-fat diet.
- https://cdn.elifesciences.org/articles/86452/elife-86452-fig6-data5-v1.zip
-
Figure 6—source data 6
Original file with the full raw unedited blot for Serca1 in gastrocnemius muscle of OPA1/GDF15 double-knockout (DKO) mice after 12 wk on a high-fat diet.
- https://cdn.elifesciences.org/articles/86452/elife-86452-fig6-data6-v1.zip
-
Figure 6—source data 7
Original file with the full raw unedited blot for Ponceau red staining for Serca1a in gastrocnemius muscle of OPA1/GDF15 double-knockout (DKO) mice after 12 wk on a high-fat diet.
- https://cdn.elifesciences.org/articles/86452/elife-86452-fig6-data7-v1.zip
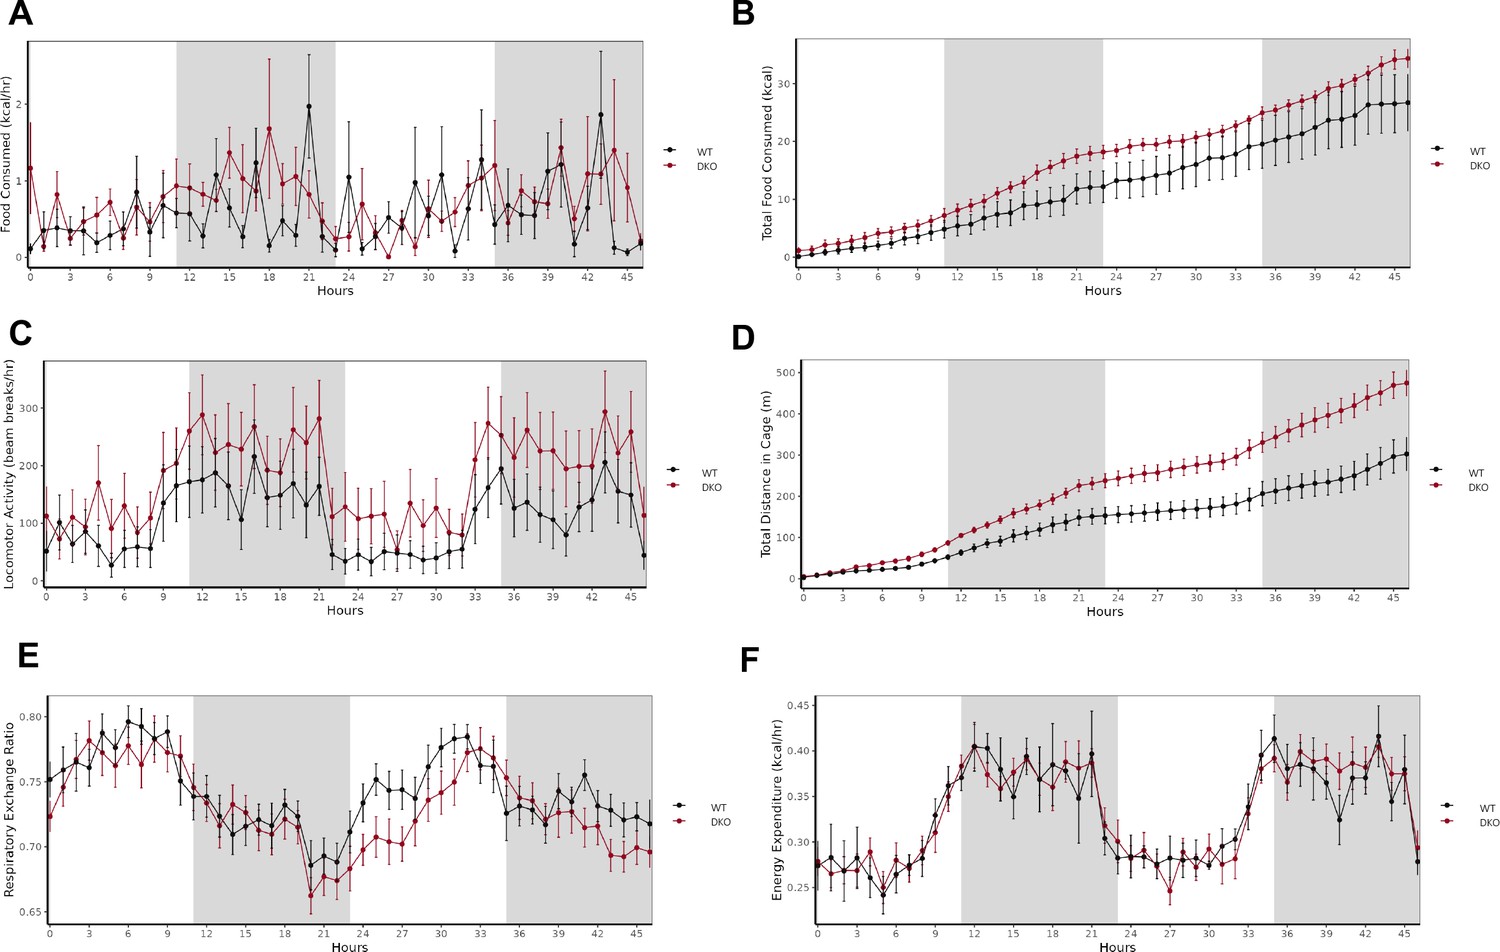
Figure 6—figure supplement 1
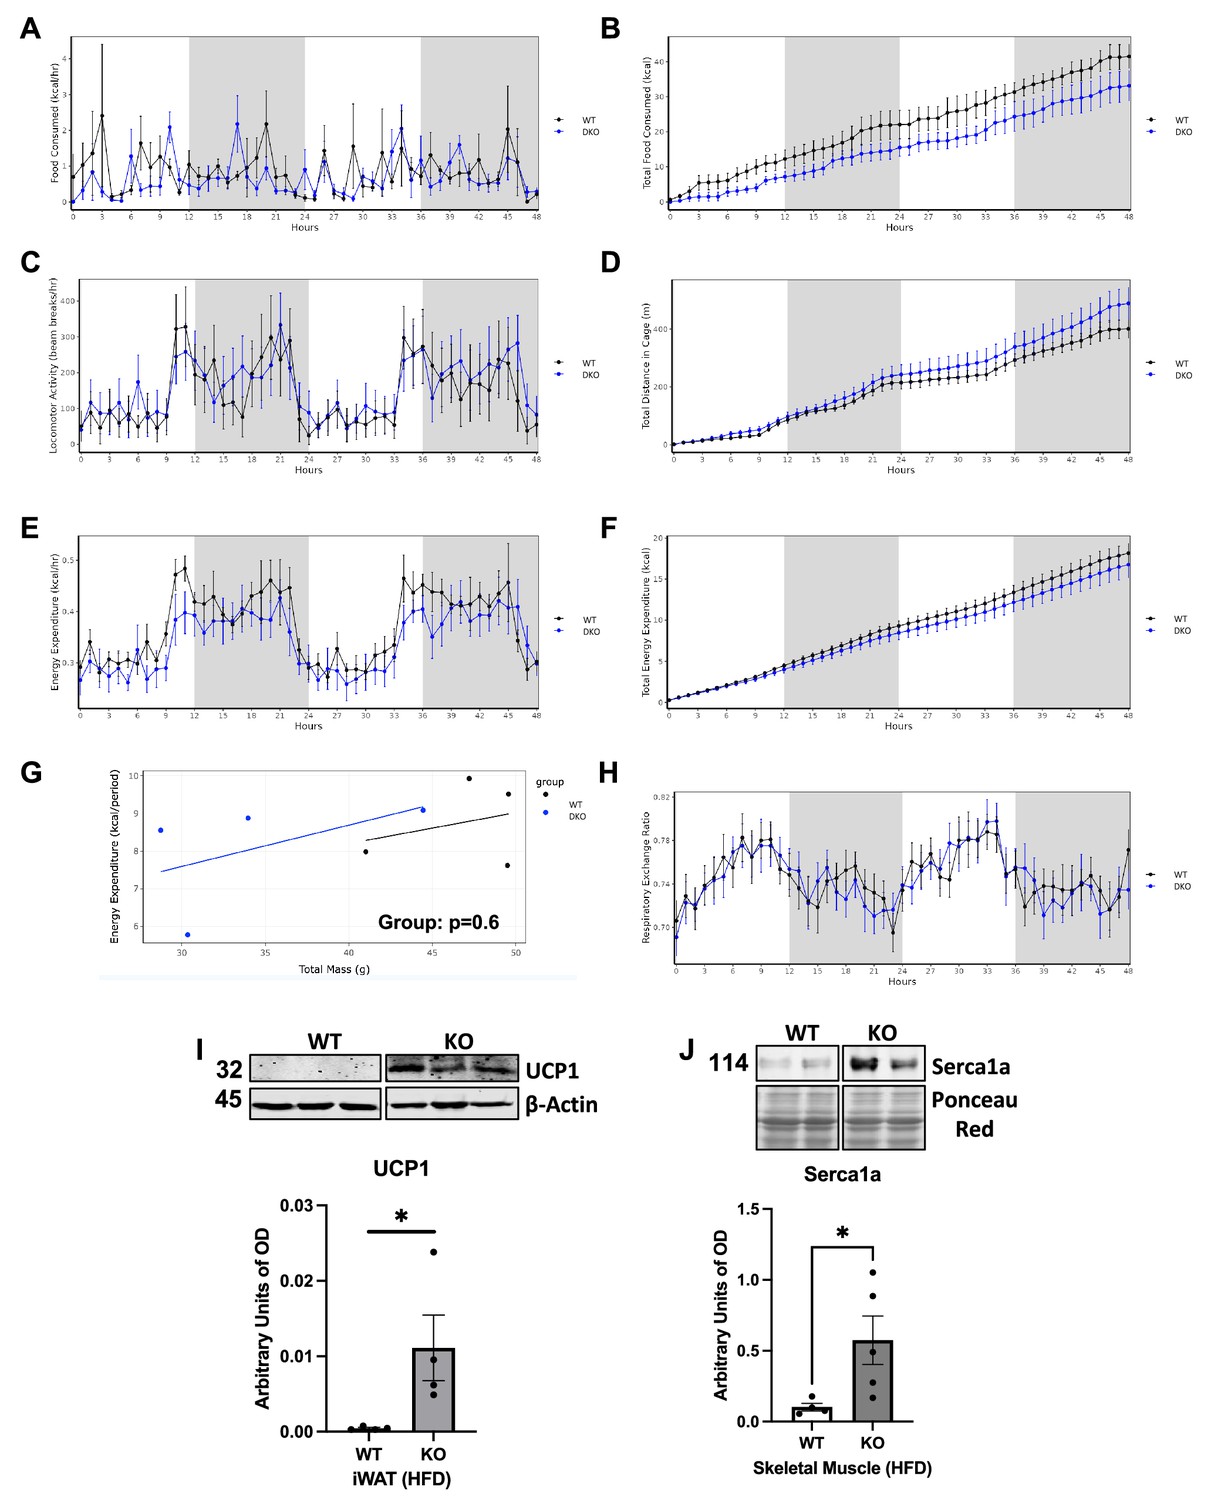
Indirect calorimetry data and immunoblot for thermogenic markers in white adipose tissue (iWAT) and skeletal muscle.
(A–H) Hourly indirect calorimetry data during the light and dark cycles in the last 48 hr of data recording. Data was collected from 18-week-old male OPA1/GDF15 brown adipose tissue (BAT) double-knockout (DKO) and wild-type (WT) control mice fed high-fat diet (HFD) (60% calories from fat) for 12 wk (diet started at 6 wk of age). (A) Hourly food consumption. (B) Cumulative food consumption. (C) Locomotor activity. (D) Cumulative distance in the cage. (E) Hourly energy expenditure. (F) Cumulative energy expenditure. (G) ANCOVA of oxygen consumption as a function of body mass. (H) Respiratory exchange ratio. (I) Representative immunoblots for UCP1 in iWAT normalized to β-actin in OPA1 BAT KO mice after 12 wk of HFD and their respective densitometric quantification. (J) Representative immunoblots for Serca1a in gastrocnemius muscle normalized to Ponceau red staining in OPA1 BAT KO mice after 12 wk of HFD and their respective densitometric quantification. Optical density (OD). Data are expressed as means ± SEM. Significant differences were determined by ANCOVA for the group effect and by Student’s t-test for the immunoblots using a significance level of p<0.05. *Significantly different vs. WT mice.
-
Figure 6—figure supplement 1—source data 1
Immunoblots for thermogenic markers in iWAT and gastrocnemius muscle.
(I) Full immunoblot images for UCP1 and β-actin in inguinal white adipose tissue (iWAT) of wild-type (WT) and OPA1 brown adipose tissue (BAT) knockout (KO) mice. (J) Full immunoblot images for Serca1a and Ponceau red staining in gastrocnemius muscle of WT and OPA1 BAT KO mice.
- https://cdn.elifesciences.org/articles/86452/elife-86452-fig6-figsupp1-data1-v1.zip
-
Figure 6—figure supplement 1—source data 2
Original immunoblot image for UCP1 in inguinal white adipose tissue (iWAT) of wild-type (WT) and OPA1 brown adipose tissue (BAT) knockout (KO) mice.
- https://cdn.elifesciences.org/articles/86452/elife-86452-fig6-figsupp1-data2-v1.zip
-
Figure 6—figure supplement 1—source data 3
Original immunoblot image for β-actin for UCP1 in inguinal white adipose tissue (iWAT) of wild-type (WT) and OPA1 brown adipose tissue (BAT) knockout (KO) mice.
- https://cdn.elifesciences.org/articles/86452/elife-86452-fig6-figsupp1-data3-v1.zip
-
Figure 6—figure supplement 1—source data 4
Original immunoblot image for Serca1a in gastrocnemius of wild-type (WT) and OPA1 brown adipose tissue (BAT) knockout (KO) mice.
- https://cdn.elifesciences.org/articles/86452/elife-86452-fig6-figsupp1-data4-v1.zip
-
Figure 6—figure supplement 1—source data 5
Original immunoblot image for Ponceau red staining for Serca1a in gastrocnemius of wild-type (WT) and OPA1 brown adipose tissue (BAT) knockout (KO) mice.
- https://cdn.elifesciences.org/articles/86452/elife-86452-fig6-figsupp1-data5-v1.zip
Figure 7 with 1 supplement
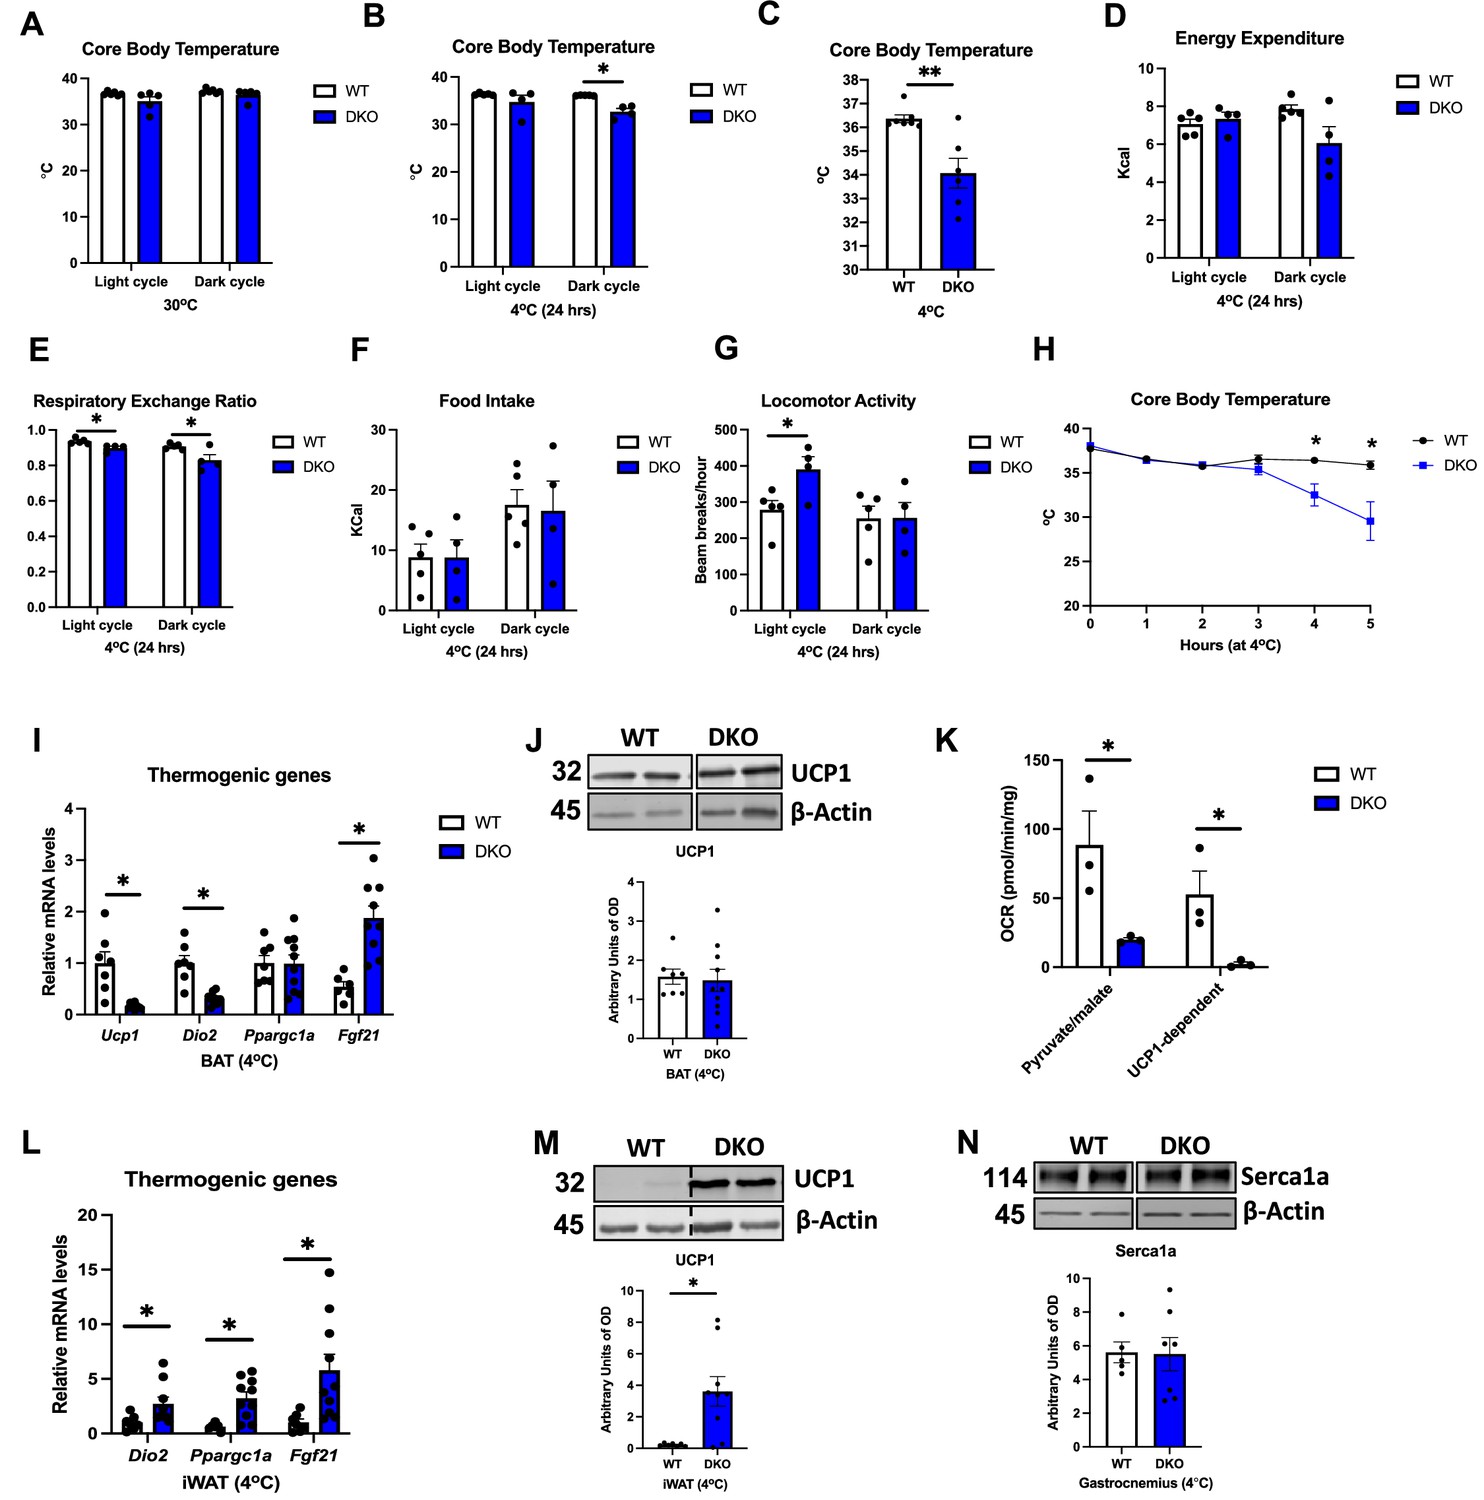
GDF15 is required to regulate core body temperature in cold-exposed OPA1 BKO mice.
(A) Averaged core body temperature (light and dark cycles) collected from 12-week-old wild-type (WT) and OPA1/GDF15 brown adipose tissue (BAT) double-knockout (DKO) mice after 7 d at 30°C. (B) Averaged core body temperature (light and dark cycles) in mice cold exposed for 24 hr (4°C). (C) Final core body temperature recorded by telemetry in mice exposed to 4°C in the CLAMS system. (D–G) Indirect calorimetry data represented as the average for the light and dark cycles during the first 24 hr of data recording (4°C). (D) Energy expenditure. (E) Respiratory exchange ratio. (F) Food intake. (G) Locomotor activity. (H) Hourly core body temperatures collected from 12-week-old WT and DKO mice during cold exposure (4°C). (I–N) Data collected after 5 hr of cold exposure. (I) Relative mRNA expression of thermogenic genes in BAT after 5 hr of cold exposure normalized to tata box protein (Tbp). (J) Representative immunoblots for UCP1 in BAT normalized to β-actin and their respective densitometric quantification. (K) Pyruvate-malate-supported oxygen consumption rates (OCRs) and UCP1-dependent respirations in mitochondria isolated from BAT (baseline conditions). (L) Relative mRNA expression of thermogenic genes in inguinal white adipose tissue (iWAT) normalized to Tbp expression. (M) Representative immunoblots for UCP1 in iWAT normalized to β-actin and their respective densitometric quantification. (N) Representative immunoblots for Serca1a in gastrocnemius muscle normalized to Ponceau red staining and their respective densitometric quantification. Optical density (OD). Data are expressed as means ± SEM. Significant differences were determined by Student’s t-test using a significance level of p<0.05. * p <0.05; ** p <0.01. Significantly different vs. WT mice.
-
Figure 7—source data 1
GDF15 is required to regulate core body temperature in cold-exposed OPA1 BKO mice (uncropped blots with the relevant bands labeled).
(G) Full immunoblot images for UCP1 and β-actin in brown adipose tissue (BAT). (M) Full immunoblot images for UCP1 and β-actin in inguinal white adipose tissue (iWAT). (N) Full immunoblot for Serca1a and β-actin in gastrocnemius muscle.
- https://cdn.elifesciences.org/articles/86452/elife-86452-fig7-data1-v1.zip
-
Figure 7—source data 2
Original file with the full raw unedited blot for UCP1 in brown adipose tissue (BAT) of OPA1/GDF15 double-knockout (DKO) mice after cold exposure.
- https://cdn.elifesciences.org/articles/86452/elife-86452-fig7-data2-v1.zip
-
Figure 7—source data 3
Original file with the full raw unedited blot for β-actin for UCP1 in brown adipose tissue (BAT) of OPA1/GDF15 double-knockout (DKO) mice after cold exposure.
- https://cdn.elifesciences.org/articles/86452/elife-86452-fig7-data3-v1.zip
-
Figure 7—source data 4
Original file with the full raw unedited blot for UCP1 in inguinal white adipose tissue (iWAT) of OPA1/GDF15 double-knockout (DKO) mice after cold exposure.
- https://cdn.elifesciences.org/articles/86452/elife-86452-fig7-data4-v1.zip
-
Figure 7—source data 5
Original file with the full raw unedited blot for β-actin for UCP1 in inguinal white adipose tissue (iWAT) of OPA1/GDF15 double-knockout (DKO) mice after cold exposure.
- https://cdn.elifesciences.org/articles/86452/elife-86452-fig7-data5-v1.zip
-
Figure 7—source data 6
Original file with the full raw unedited blot for Serca1 in gastrocnemius muscle of OPA1/GDF15 double-knockout (DKO) mice after cold exposure.
- https://cdn.elifesciences.org/articles/86452/elife-86452-fig7-data6-v1.zip
-
Figure 7—source data 7
Original file with the full raw unedited blot for β-actin for Serca1a in gastrocnemius muscle of OPA1/GDF15 double-knockout (DKO) mice after cold exposure.
- https://cdn.elifesciences.org/articles/86452/elife-86452-fig7-data7-v1.zip
Figure 7—figure supplement 1
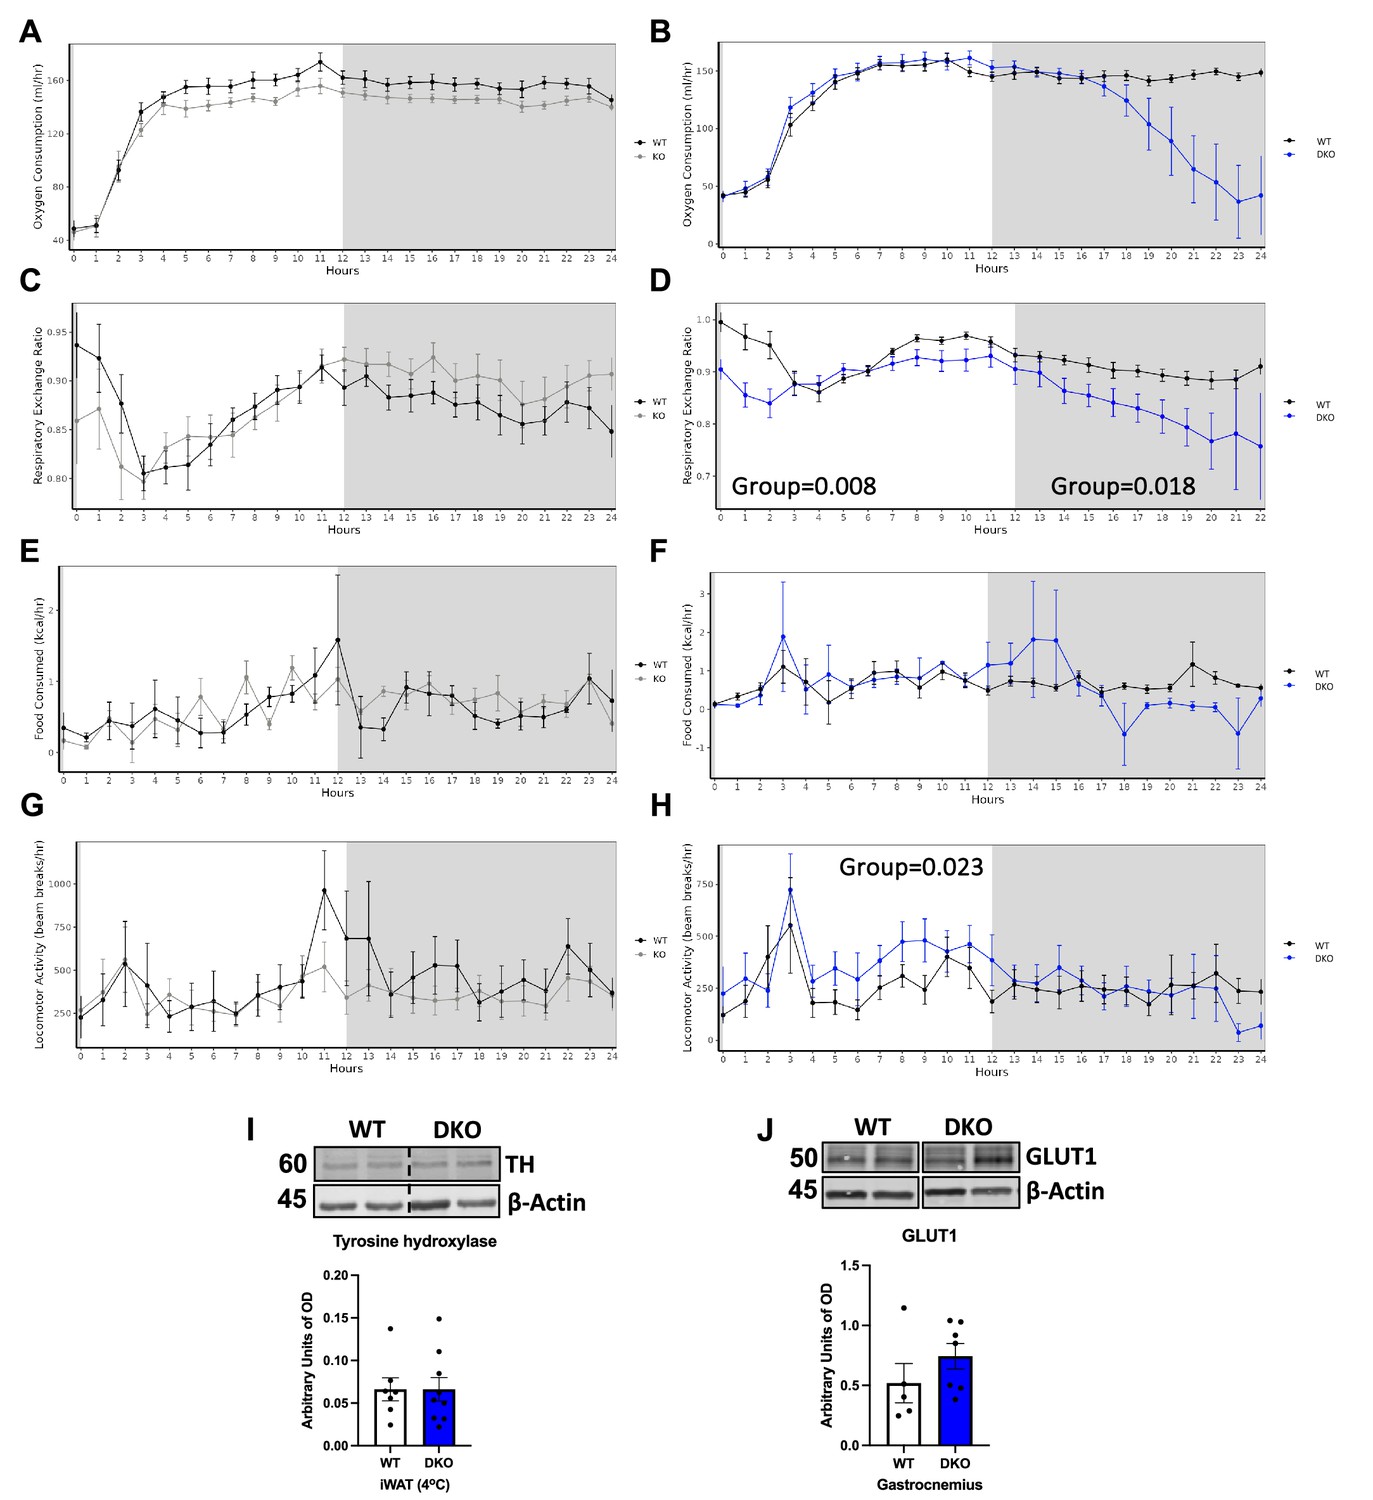
Indirect calorimetry, food intake, locomotor activity, and skeletal muscle characterization of cold-exposed OPA1/GDF15 brown adipose tissue (BAT) double-knockout (DKO) and OPA1 BAT knockout (KO) mice.
(A–H) Hourly indirect calorimetry data collected in OPA1 BKO and OPA1/GDF15 BAT DKO mice and their respective wild-type (WT) controls during the first 24 hr of cold exposure. (A) Oxygen consumption in OPA1 BKO mice. (B) Oxygen consumption in DKO mice. (C) Respiratory exchange ratio in OPA1 BKO mice. (D) Respiratory exchange ratio in DKO mice. (E) Food consumed in OPA1 BKO mice. (F) Food consumed in DKO mice. (G) Locomotor activity in OPA1 BKO mice. (H) Locomotor activity in DKO mice. (I) Representative immunoblots for tyrosine hydroxylase (TH) in inguinal white adipose tissue (iWAT) from mice exposed to 4°C for 5 hr normalized to β-actin and their respective densitometric quantification. (J) Representative immunoblots for GLUT1 in skeletal muscle from mice exposed to 4°C for 5 hr normalized to β-actin and their respective densitometric quantification. Optical density (OD). Data are expressed as means ± SEM. Significant differences were determined by ANCOVA for the group effect.
-
Figure 7—figure supplement 1—source data 1
I Full immunoblot images for tyrosine hydroxylase (TH) and β-actin in inguinal white adipose tissue (iWAT) of wild-type (WT) and OPA1/GDF15 brown adipose tissue (BAT) double-knockout (DKO) mice.
(J) Full immunoblot images for GLUT1 and β-actin in skeletal muscle of WT and OPA1/GDF15 BAT DKO mice.
- https://cdn.elifesciences.org/articles/86452/elife-86452-fig7-figsupp1-data1-v1.zip
-
Figure 7—figure supplement 1—source data 2
Original immunoblot image for tyrosine hydroxylase in inguinal white adipose tissue (iWAT) of wild-type (WT) and OPA1/GDF15 brown adipose tissue (BAT) double-knockout (DKO) mice.
- https://cdn.elifesciences.org/articles/86452/elife-86452-fig7-figsupp1-data2-v1.zip
-
Figure 7—figure supplement 1—source data 3
Original immunoblot image for β-actin for tyrosine hydroxylase in inguinal white adipose tissue (iWAT) of wild-type (WT) and OPA1/GDF15 brown adipose tissue (BAT) double-knockout (DKO) mice.
- https://cdn.elifesciences.org/articles/86452/elife-86452-fig7-figsupp1-data3-v1.zip
-
Figure 7—figure supplement 1—source data 4
Original immunoblot image for GLUT1 in gastrocnemius muscle of wild-type (WT) and OPA1/GDF15 brown adipose tissue (BAT) double-knockout (DKO) mice.
- https://cdn.elifesciences.org/articles/86452/elife-86452-fig7-figsupp1-data4-v1.zip
-
Figure 7—figure supplement 1—source data 5
Original immunoblot image for β-actin for GLUT1 in gastrocnemius muscle of wild-type (WT) and OPA1/GDF15 brown adipose tissue (BAT) double-knockout (DKO) mice.
- https://cdn.elifesciences.org/articles/86452/elife-86452-fig7-figsupp1-data5-v1.zip
Tables
Appendix 1—key resources table
| Reagent type (species) or resource | Designation | Source or reference | Identifiers | Additional information |
|---|---|---|---|---|
| Strain, strain background (mouse, C57Bl/6J) | Murine Models | Jackson Laboratories | JAX Stock #025124 | Tag (Ucp1-cre)1Evdr; male and female |
| Strain, strain background (mouse, C57Bl/6J) | Murine Models | Jackson Laboratories | JAX Stock #023066 | Eif2ak3tm1.2Drc/J; male and female |
| Antibody | Anti-OPA1 (mouse polyclonal) | BD Biosciences | #612606 | WB 1:1000, primary |
| Antibody | Anti-GAPDH (rabbit monoclonal) | Cell Signaling Technology | #2118 | WB 1:1000, primary |
| Antibody | Anti-UCP1 (mouse monoclonal) | Abcam | #Ab10983 | WB 1:1000, primary |
| Antibody | Anti-Tyrosine hydroxylase (rabbit polyclonal) | Cell Signaling Technology | #2792 | WB 1:1000, primary |
| Antibody | Anti-β-actin (rabbit polyclonal) | Sigma | #A2066 | WB 1:1000, primary |
| Antibody | Anti-phosphorylated eIF2α serine 51 (rabbit monoclonal) | Cell Signaling Technology | #3597 | WB 1:1000, primary |
| Antibody | Anti-eIF2α (mouse monoclonal) | Santa Cruz Biotechnology | #SC81261 | WB 1:1000, primary |
| Antibody | Anti-PERK (rabbit monoclonal) | Cell Signaling Technology | #C33E10 | WB 1:1000, primary |
| Antibody | Anti-Serca1a (mouse monoclonal) | Santa Cruz Biotechnology | #SC515162 | WB 1:1000, primary |
| Antibody | Anti-GLUT1 (rabbit polyclonal) | Millipore | #07-1401 | WB 1:1000, primary |
| Antibody | IRDye 800CW anti-mouse | LI-COR | #925-32212 | WB 1:10,000, secondary |
| Antibody | Alexa Fluor anti-rabbit 680 | Invitrogen | #A27042 | WB 1:10,000, secondary |
| Commercial assay or kit | RNeasy kit | QIAGEN Inc | #74104 | |
| Commercial assay or kit | EnzyChrom Triglyceride Assay Kit | BioAssay Systems | #ETGA-200 | |
| Commercial assay or kit | Mouse/Rat Fibroblast Growth Factor 21 ELISA | Biovendor | #RD291108200R | |
| Commercial assay or kit | Quantikine GDF15 ELISA | R&D Systems | #MGD150 | |
| Commercial assay or kit | Ultra-Sensitive Mouse Insulin ELISA Kit | Chrystal Chem | #90080 | |
| Commercial assay or kit | High-Capacity cDNA reverse Transcription Kit | Applied Biosystems | #4368814 | |
| Software, algorithm | GraphPad Prism Software | GraphPad Software, La Jolla, CA | Version 8.0.0 for Windows | |
| Other | Chow, standard | Harlan Teklad | 2920X | As described under ‘Mouse models’ |
| Other | Chow, 60% HFD | Research Diets | D12492 | As described under ‘Mouse models’ |
Additional files
Download links
A two-part list of links to download the article, or parts of the article, in various formats.
Downloads (link to download the article as PDF)
Open citations (links to open the citations from this article in various online reference manager services)
Cite this article (links to download the citations from this article in formats compatible with various reference manager tools)
GDF15 is required for cold-induced thermogenesis and contributes to improved systemic metabolic health following loss of OPA1 in brown adipocytes
eLife 12:e86452.
https://doi.org/10.7554/eLife.86452


