DNA damage signaling in Drosophila macrophages modulates systemic cytokine levels in response to oxidative stress
- Institute of Neuropathology, Faculty of Medicine, Medical Center, University of Freiburg, Germany
- Faculty of Biology, University of Freiburg, Germany
- Institute for Transfusion Medicine and Gene Therapy, Medical Center-University of Freiburg, Germany
- MRC Centre for Molecular Bacteriology and Infection, Imperial College London, United Kingdom
- Department of Life Sciences, Imperial College London, United Kingdom
- Department of Oncology, Haematology and Rheumatology, University Hospital Bonn, Germany
- Institute of Clinical Chemistry and Clinical Pharmacology, University Hospital Bonn, Germany
- Center for Basics in NeuroModulation (NeuroModulBasics), Faculty of Medicine, University of Freiburg, Germany
- Signalling Research Centres BIOSS and CIBSS, University of Freiburg, Germany
- Hilde-Mangold-Haus, Faculty of Biology, University of Freiburg, Germany
- CIBSS-Centre for Integrative Biological Signalling Studies, University of Freiburg, Germany
Figures
Figure 1 with 1 supplement
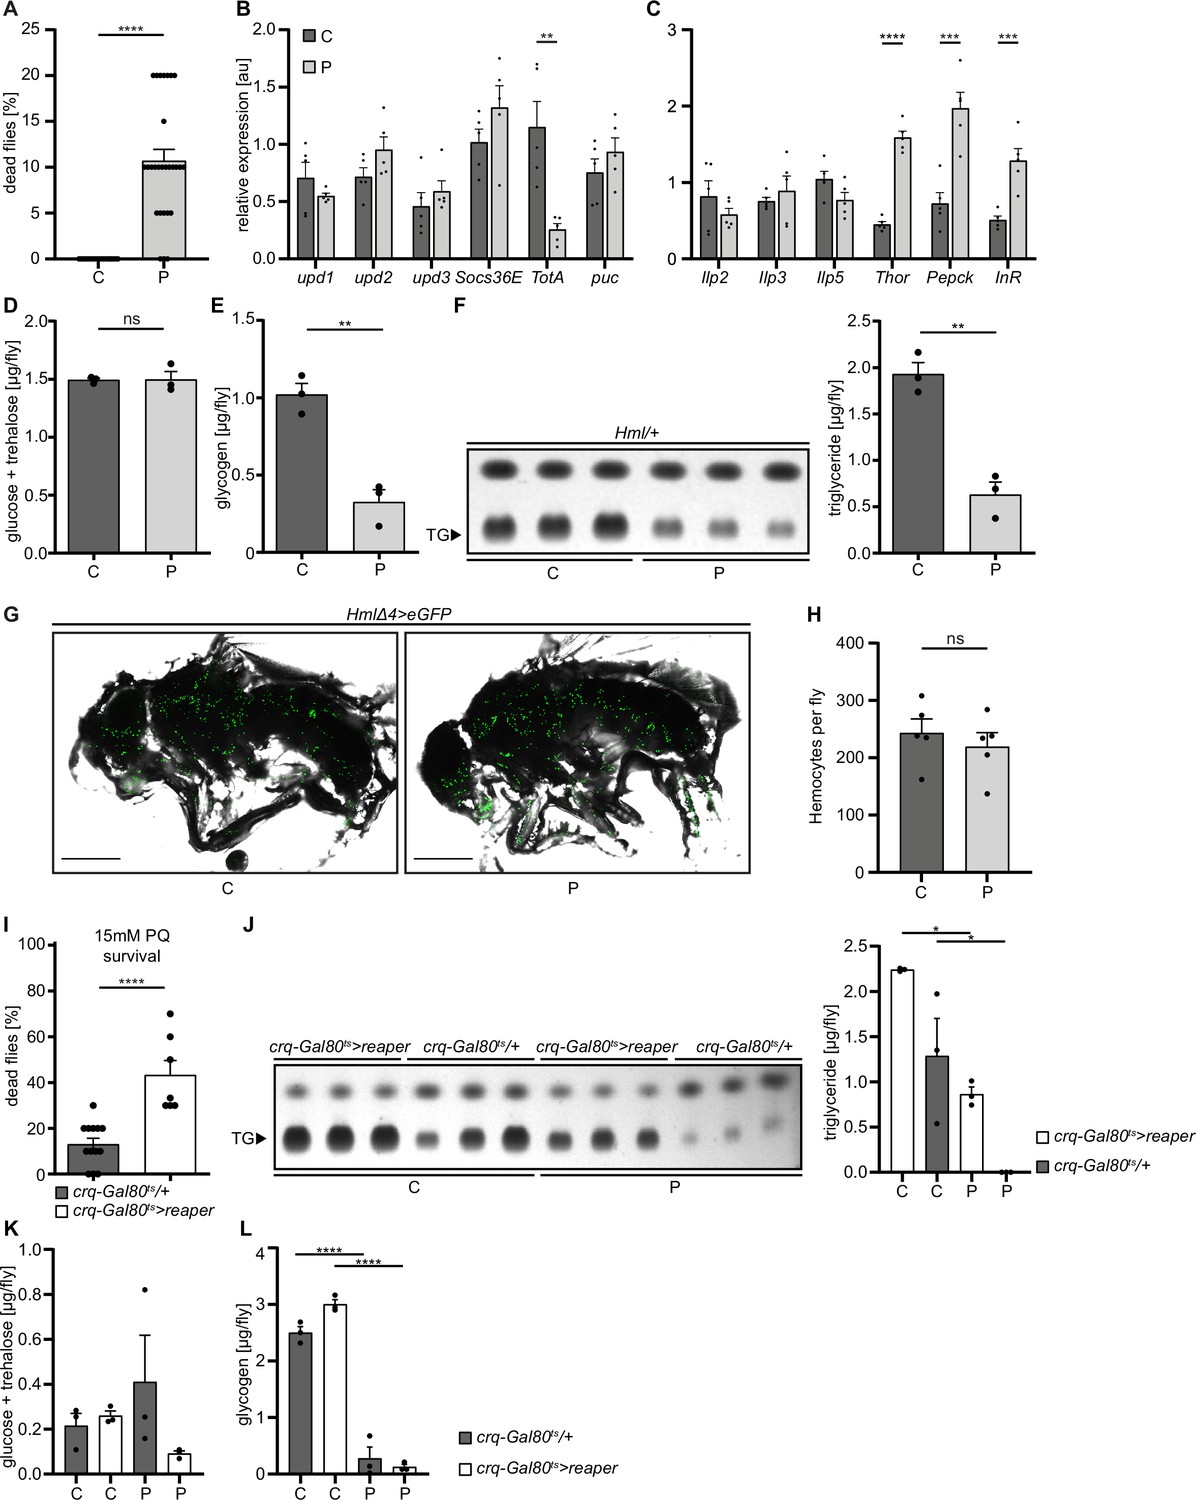
Loss of hemocytes increases the susceptibility of adult Drosophila to oxidative stress by Paraquat feeding.
(A) Survival of Hml/+ flies with control food (C) (n=20) and 15 mM Paraquat (P) (n=28) at 29 °C. Five independent experiments were performed. Student’s unpaired t-test: ****p<0.0001, each data point represents a sample with 10 flies. (B–C) RT-qPCR of whole flies were performed to investigate gene-expressions of the JAK-STAT-signaling pathway (B) and insulin-signaling pathway (C). All transcript levels were normalized to the expression of the loading control Rpl1 and are shown in arbitrary units [au]. Each data point (n=5) represents a sample of three whole flies. Student’s unpaired t-tests were performed for each transcript to compare the gene-expression between control and treated flies: **p<0.01; ***p<0.001; ****p<0.0001. (D) Glucose and (E) glycogen levels of whole flies were measured in control and PQ-treated flies. Each dot (n=3) represents a sample containing three flies. Student’s unpaired t-test: **p<0.01. (F) Triglyceride (TG) amounts were determined via thin-layer chromatography (TLC). Left panel: Representative image of a TLC plate, each band represents a sample with ten flies. Right panel: Quantification thereof. n=3 per group were analyzed. Student’s unpaired t-test: **p<0.01. (G) Representative images of 7 days old HmlΔ4>eGFP flies treated with 5% sucrose solution and 15 mM PQ, respectively. Scale bars = 500 µm. (H) Hemocyte quantification of 7 days old HmlΔ4>eGFP flies treated with control food (5% sucrose solution) (n=5) or 15 mM Paraquat (n=5). Each data point represents one fly. Statistical significance was tested using student’s unpaired t-test: p=0.508. (I) Survival of crq-Gal80ts/+ control flies (n=13) and hemocyte depleted crq-Gal80ts>reaper flies (n=7) on control food (n=20) and 15 mM Paraquat (n=28) at 29 °C. Student’s unpaired t-test: ****p<0.0001, each data point represents a sample with 10 flies. (J) TG amounts in crq-Gal80ts/+ control flies and hemocyte-deficient crq-Gal80ts>reaper flies on control food or Paraquat food. Left panel: Representative image of a TLC plate, each band represents a sample with ten flies. Right panel: Quantification thereof. n=3 per group were analyzed. One-way ANOVA: *p<0.05. (K) Glucose and (L) Glycogen levels of whole flies were measured in crq-Gal80ts/+ control flies and hemocyte-deficient crq-Gal80ts>reaper flies. Each dot (n=3) represents a sample with three whole flies. One-way ANOVA: ****p<0.0001.
Figure 1—figure supplement 1
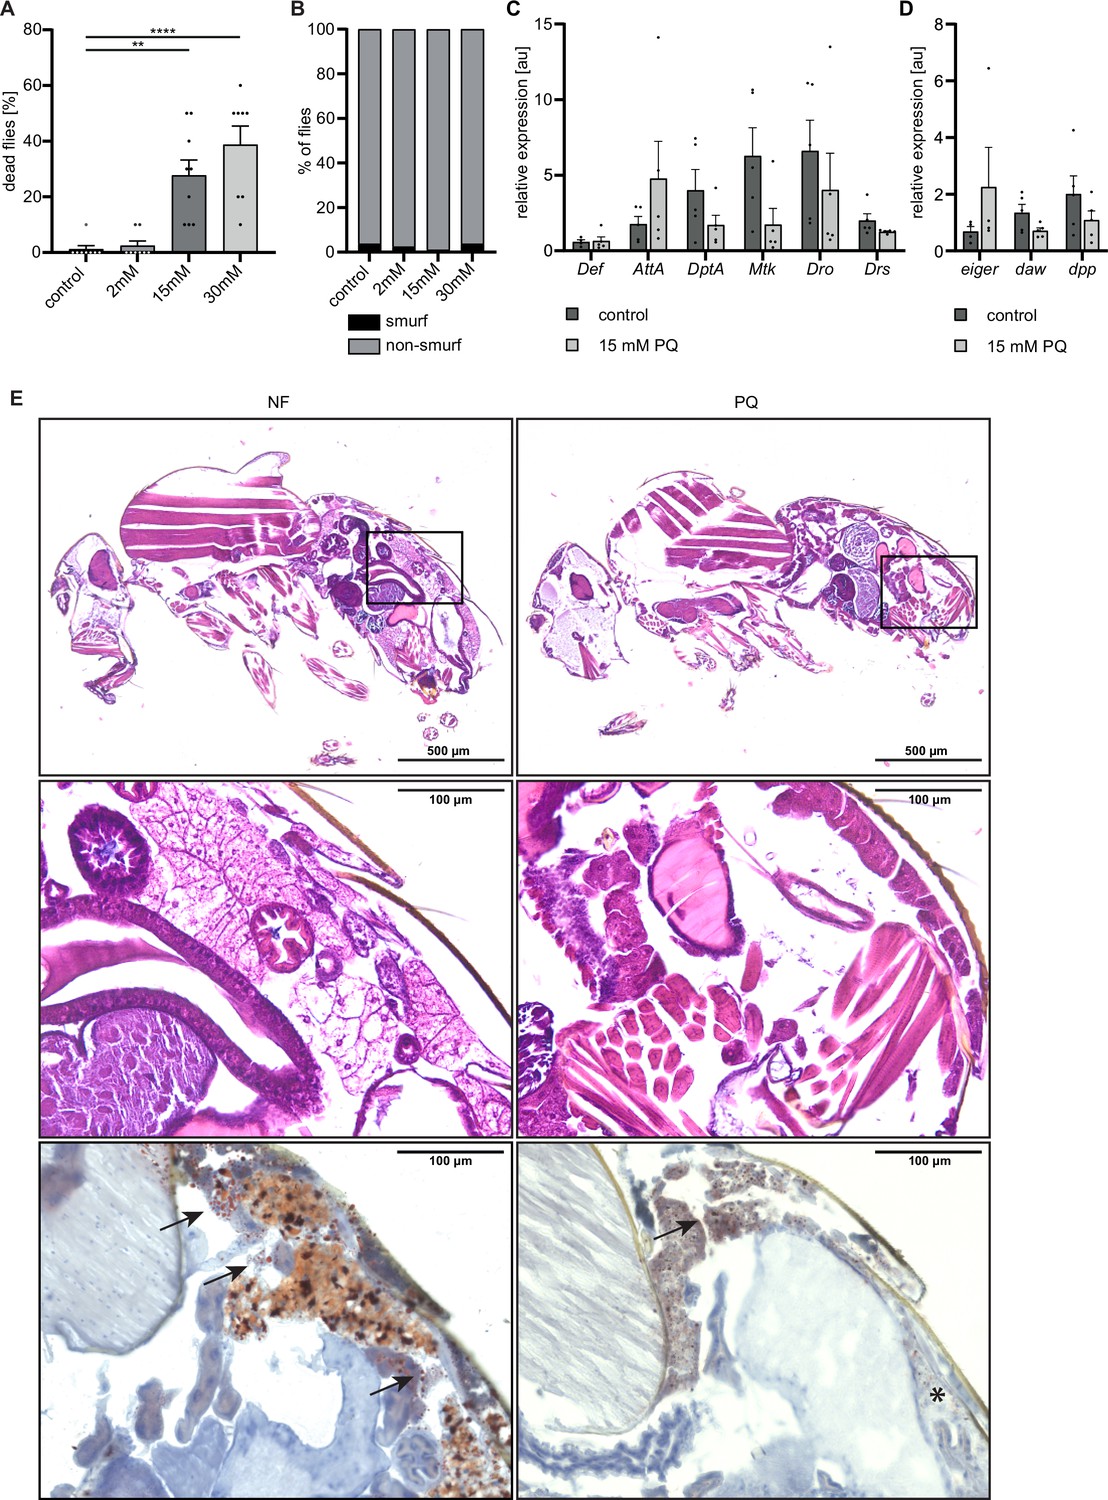
Paraquat-induced oxidative stress does not cause gut leakage, but detrimental changes in triglyceride storage in the fat body.
(A) Survival of Hml/+ flies treated with control food (n=8), 2 mM PQ (n=8), 15 mM PQ (n=9) and 30 mM PQ (n=8). Each data point represents a sample of 10 flies. Mean ± SEM is shown. One-way ANOVA: **p<0.01; ****p<0.0001. (B) Smurf assay to test the gut integrity of 7 days old Hml/+ flies treated with 2 mM PQ (n=79), 15 mM PQ (n=90), 30 mM PQ (n=80) and controls (n=80). Data was pooled from two independent experiments. (C) Gene expression analysis for AMP genes via RT-qPCR in whole flies on control food (C) and 15 mM Paraquat (P). All transcript levels were normalized to the expression of the loading control Rpl1 and are shown in arbitrary units [au]. Each data point (n=5) represents a sample of three individual flies. Mean ± SEM is shown. (D) Gene expression analysis for dpp, daw and eiger via RT-qPCR in whole flies on control food (C) and 15 mM Paraquat (P). All transcript levels were normalized to the expression of the loading control Rpl1 and are shown in arbitrary units [au]. Each data point (n=5) represents a sample of three individual flies. Mean ± SEM is shown. (E) Representative light microscopic images of HE stained control flies (left panels) and flies treated with 15 mM PQ (right panels). Inserts indicate location of higher magnification images below. Scale bar (overview) = 500 µm, scale bar (inserts) = 100 µm. Representative light microscopic images of Oil Red O stained control flies (left panels) and flies treated with 15 mM PQ (right panels). Arrows indicate stained fat droplets. Scale bar = 100 µm.
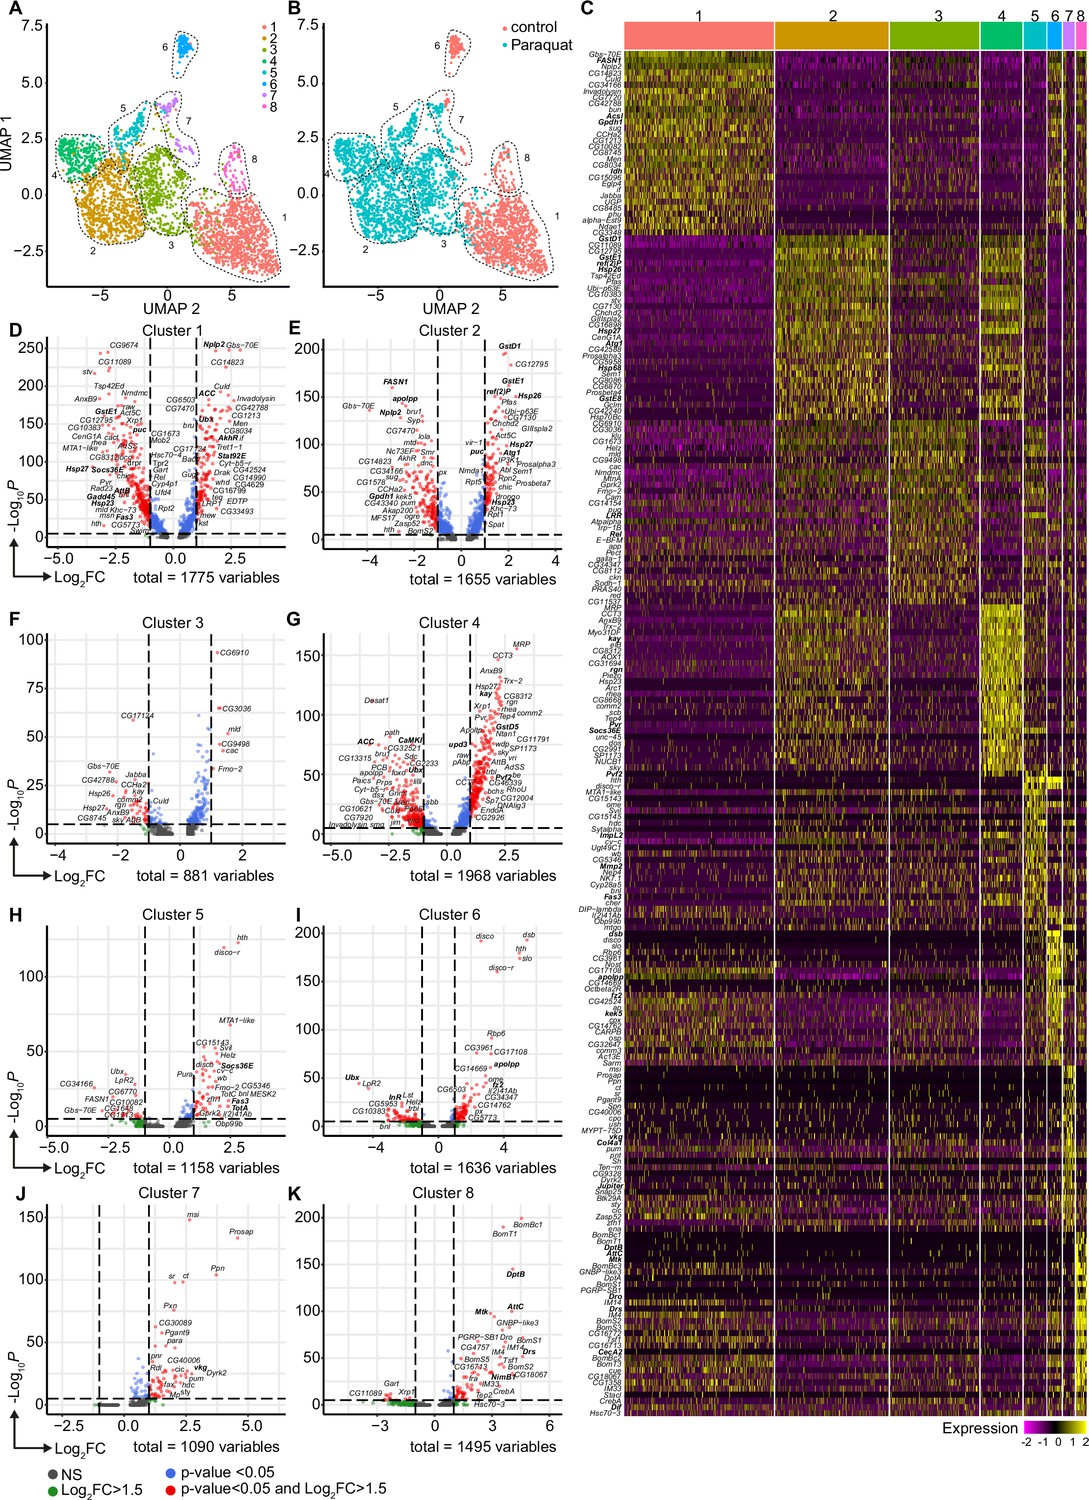
Figure 2 with 3 supplements
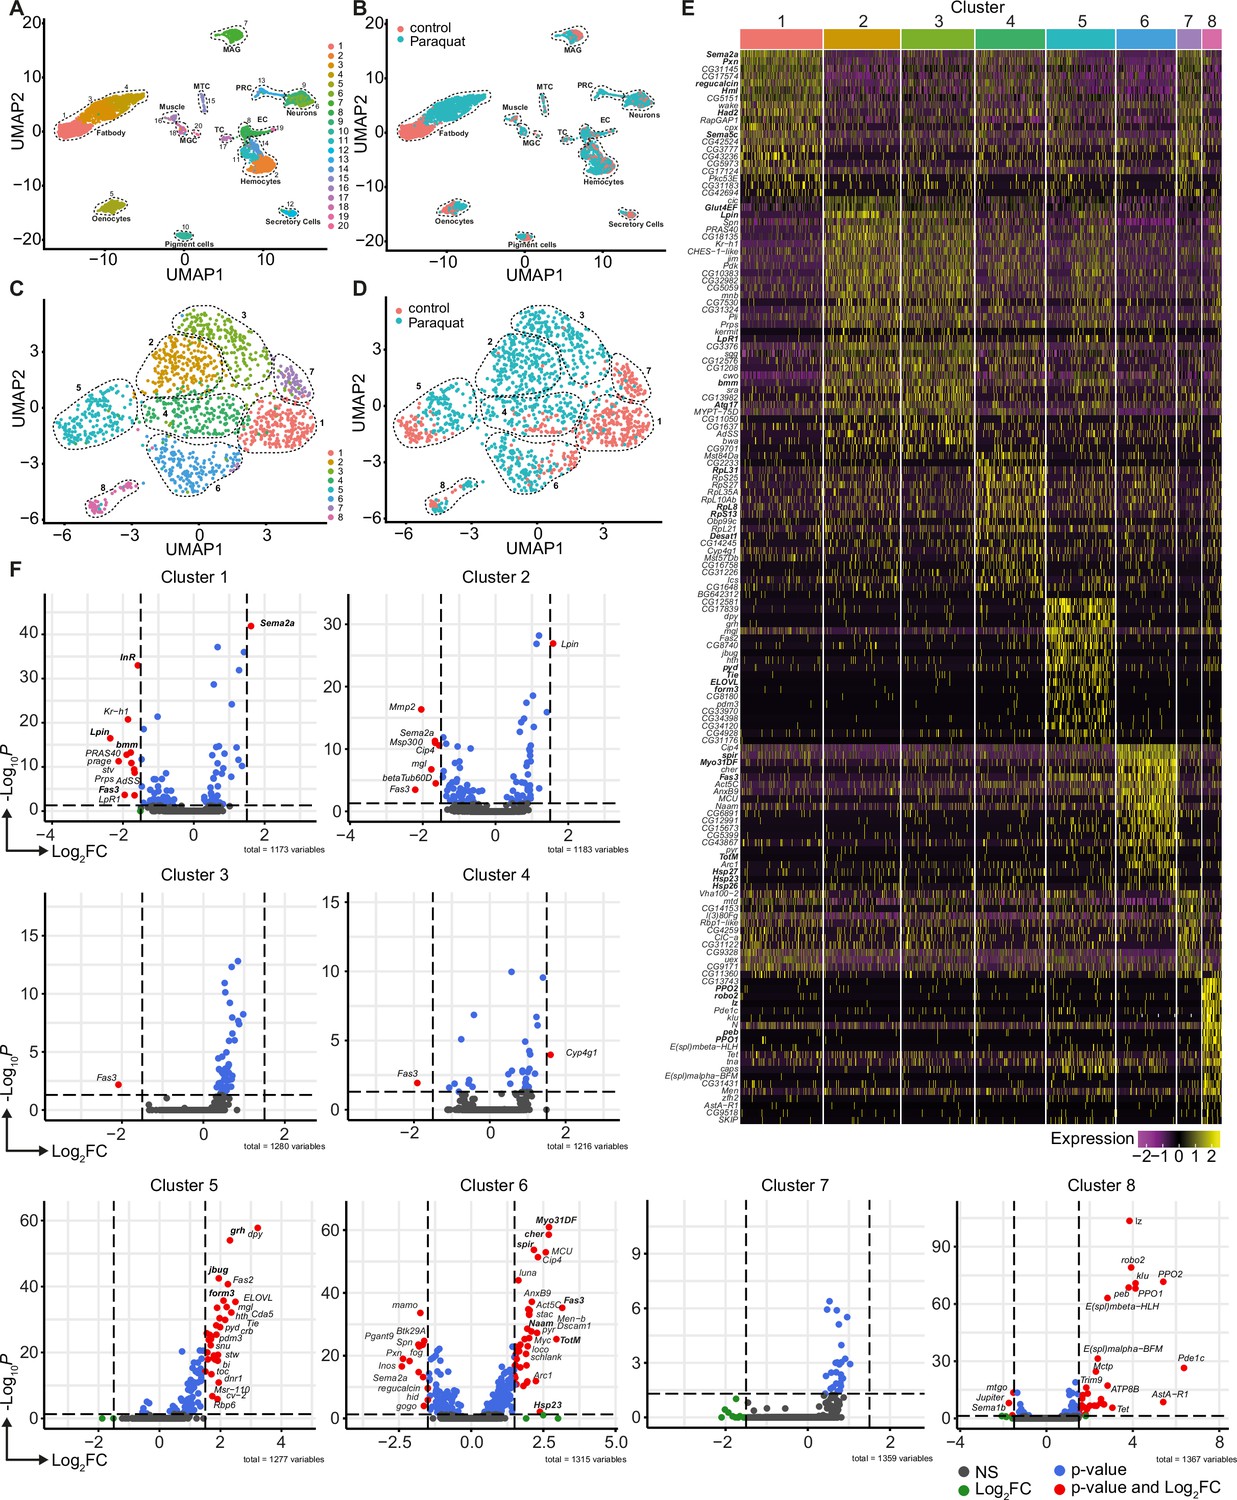
Unbiased single nuclei transcriptomic profiling identified diverse transcriptomic states of hemocytes associated with oxidative stress response.
(A) Uniform Manifold Approximation and Projection (UMAP) visualization of single nucleus states from flies exposed to 15 mM PQ containing or control food. Dashed lines indicate the broad cell types. Male accessory gland main cells (MAG), Malpighian tubule principal cells (MTC), male germline cells (MGC), outer photoreceptor cells (PRC), tracheolar cells (TC), epithelial cells (EC). Colors indicate distinct clusters. n=11,839 nuclei are shown. (B) UMAP visualization of nuclei from (A) colored by treatment. Nuclei from control group are labeled in red and nuclei from PQ group are labeled in blue. Dashed lines indicate the broad cell type as (A). (C) UMAP visualization of hemocytes from (A) after sub-setting and re-clustering. Colors and dashed lines indicate distinct clusters. n=1354 nuclei are shown. (D) UMAP visualization of hemocyte clusters colored by treatment. Nuclei from control group are labeled in red and nuclei from PQ group are labeled in blue. Dashed lines indicate distinct clusters. n=1354 nuclei are shown. (E) Heat map of top 20 DE genes for each hemocyte cluster. Gene names are indicated on the left. Colors in the heat map correspond to normalized scaled expression. (F) Volcano plots comparing pseudo bulk gene expression of individual hemocyte cluster vs. all hemocytes. The –log10-transformed adjusted P value (P adjusted, y-axis) is plotted against the log2-transformed fold change (FC) in expression between the indicated cluster vs remaining hemocytes (x-axis). Non-regulated genes are shown in grey, not significantly regulated genes are shown in green, significantly regulated genes with a FC <1.5 are shown in blue and significantly regulated genes with a FC >1.5 are shown in red.
Figure 2—figure supplement 1
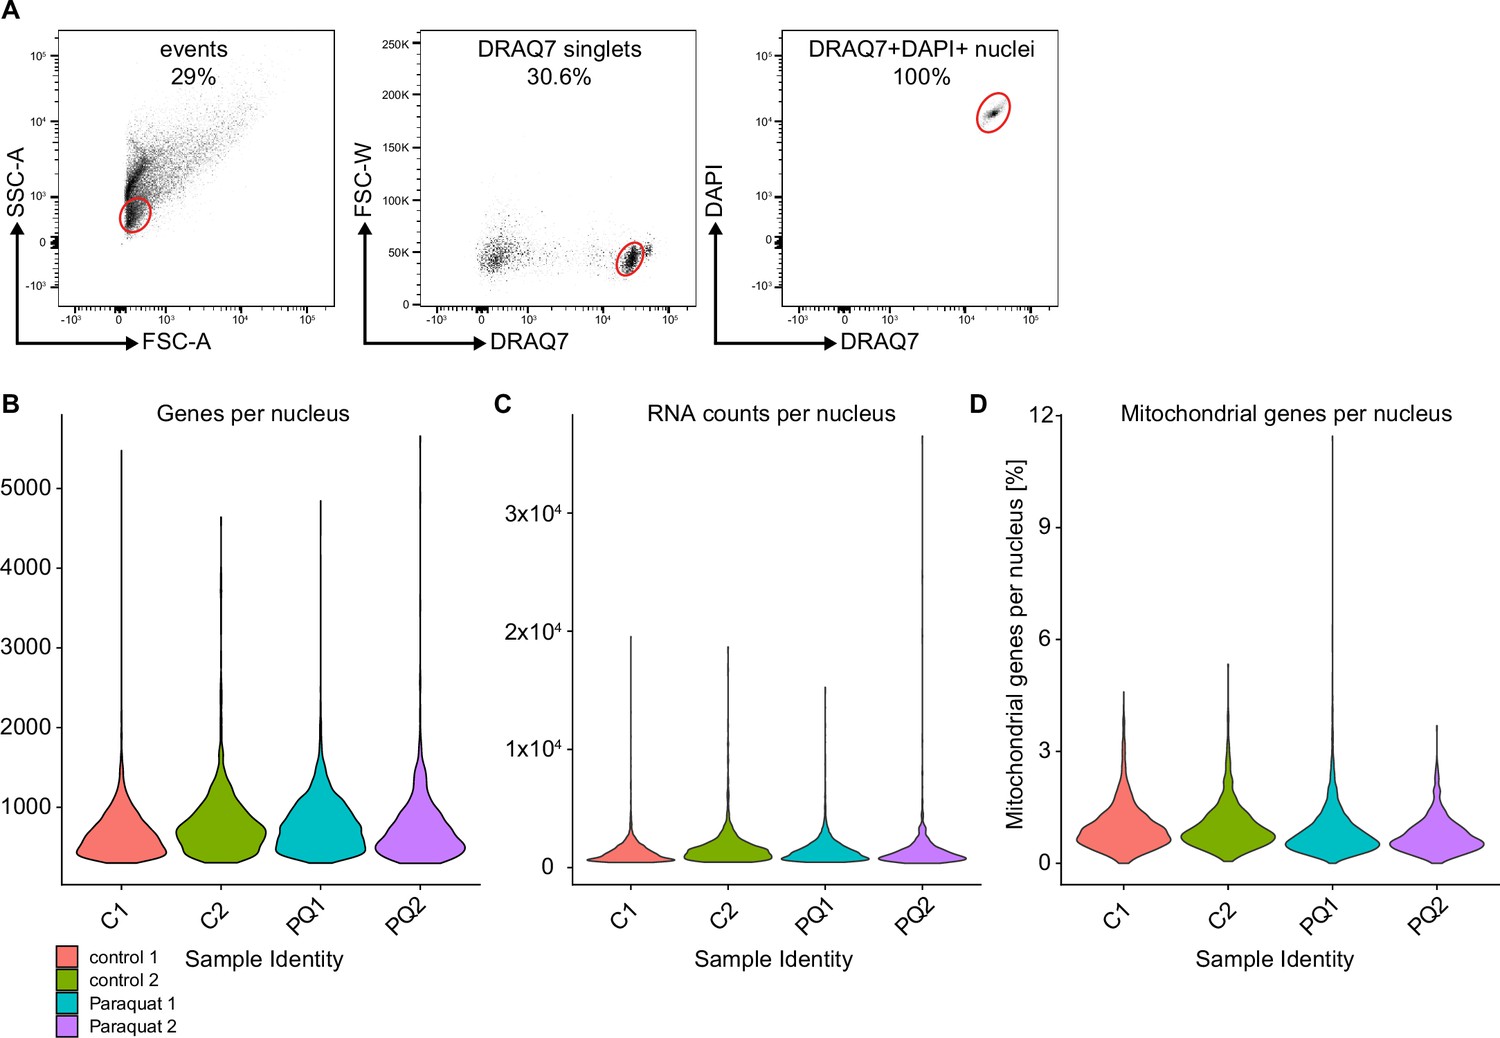
Gating strategy for the FACS isolation of nuclei from control and PQ-treated flies.
(A) Flow cytometric sorting strategy of nuclei used for the snRNA-seq. Doublet exclusion was performed via gating on DRAQ7 single positive nuclei. DRAQ7+DAPI+ double positive events were considered to be nuclei and were sorted for the snRNA-seq as previously described (Hersperger et al., 2024). (B) Violin plot indicating number of genes identified in analyzed nuclei of the sorted samples. Color code is indicated in legend. (C) Violin plot indicating RNA counts of the analyzed nuclei of each sorted sample. Color code is indicated in legend. (D) Violin plot indicating percentage of mitochondrial genes detected in the nuclei of each sorted samples. Color code is indicated in legend.
Figure 2—figure supplement 2
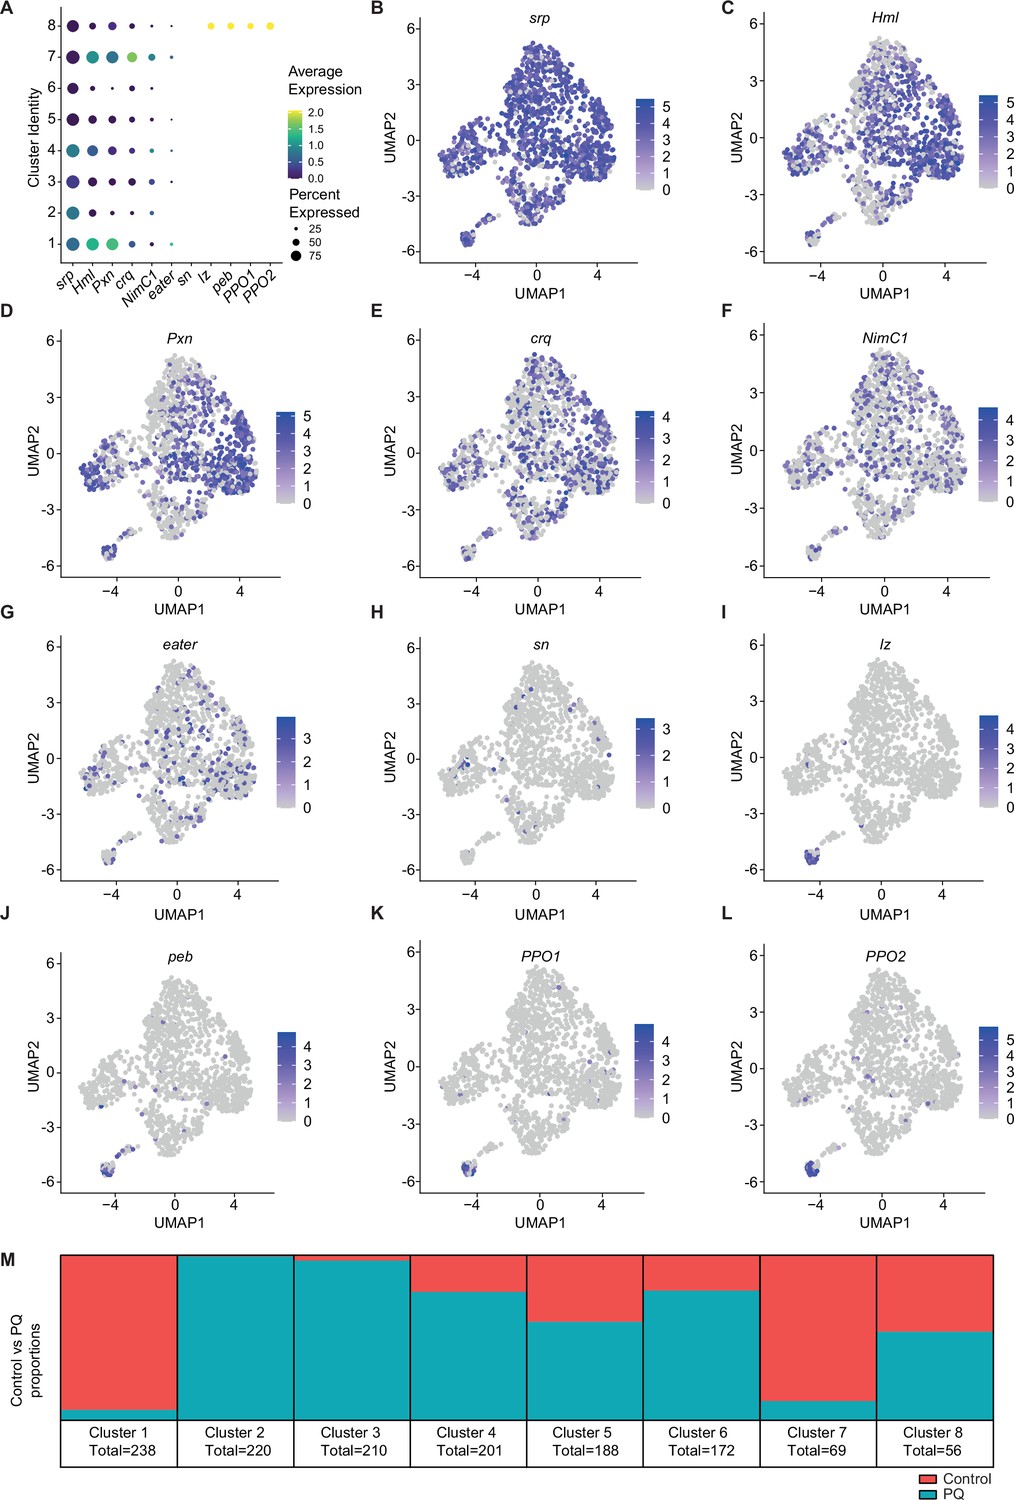
Specific signature genes identify plasmatocyte and crystal cell clusters within the eight identified hemocyte clusters.
(A) Dot plot of hemocyte signature gene expression according to Cattenoz et al., 2020. Color code is indicated in legend. (B-L) Feature plots for expression levels of respective hemocyte signature genes across all hemocyte clusters. Color-code, indicating the expression levels of the respective genes, is shown on the right side of each graph. Gene names are indicated above plots shown. (M) Bar plot representing distribution of nuclei derived from flies under control condition (red) and flies treated with 15 mM PQ (turquoise) across all eight identified hemocyte clusters. Each cluster is shown as one bar. Total number of hemocytes in the respective cluster is indicated below.
Figure 2—figure supplement 3
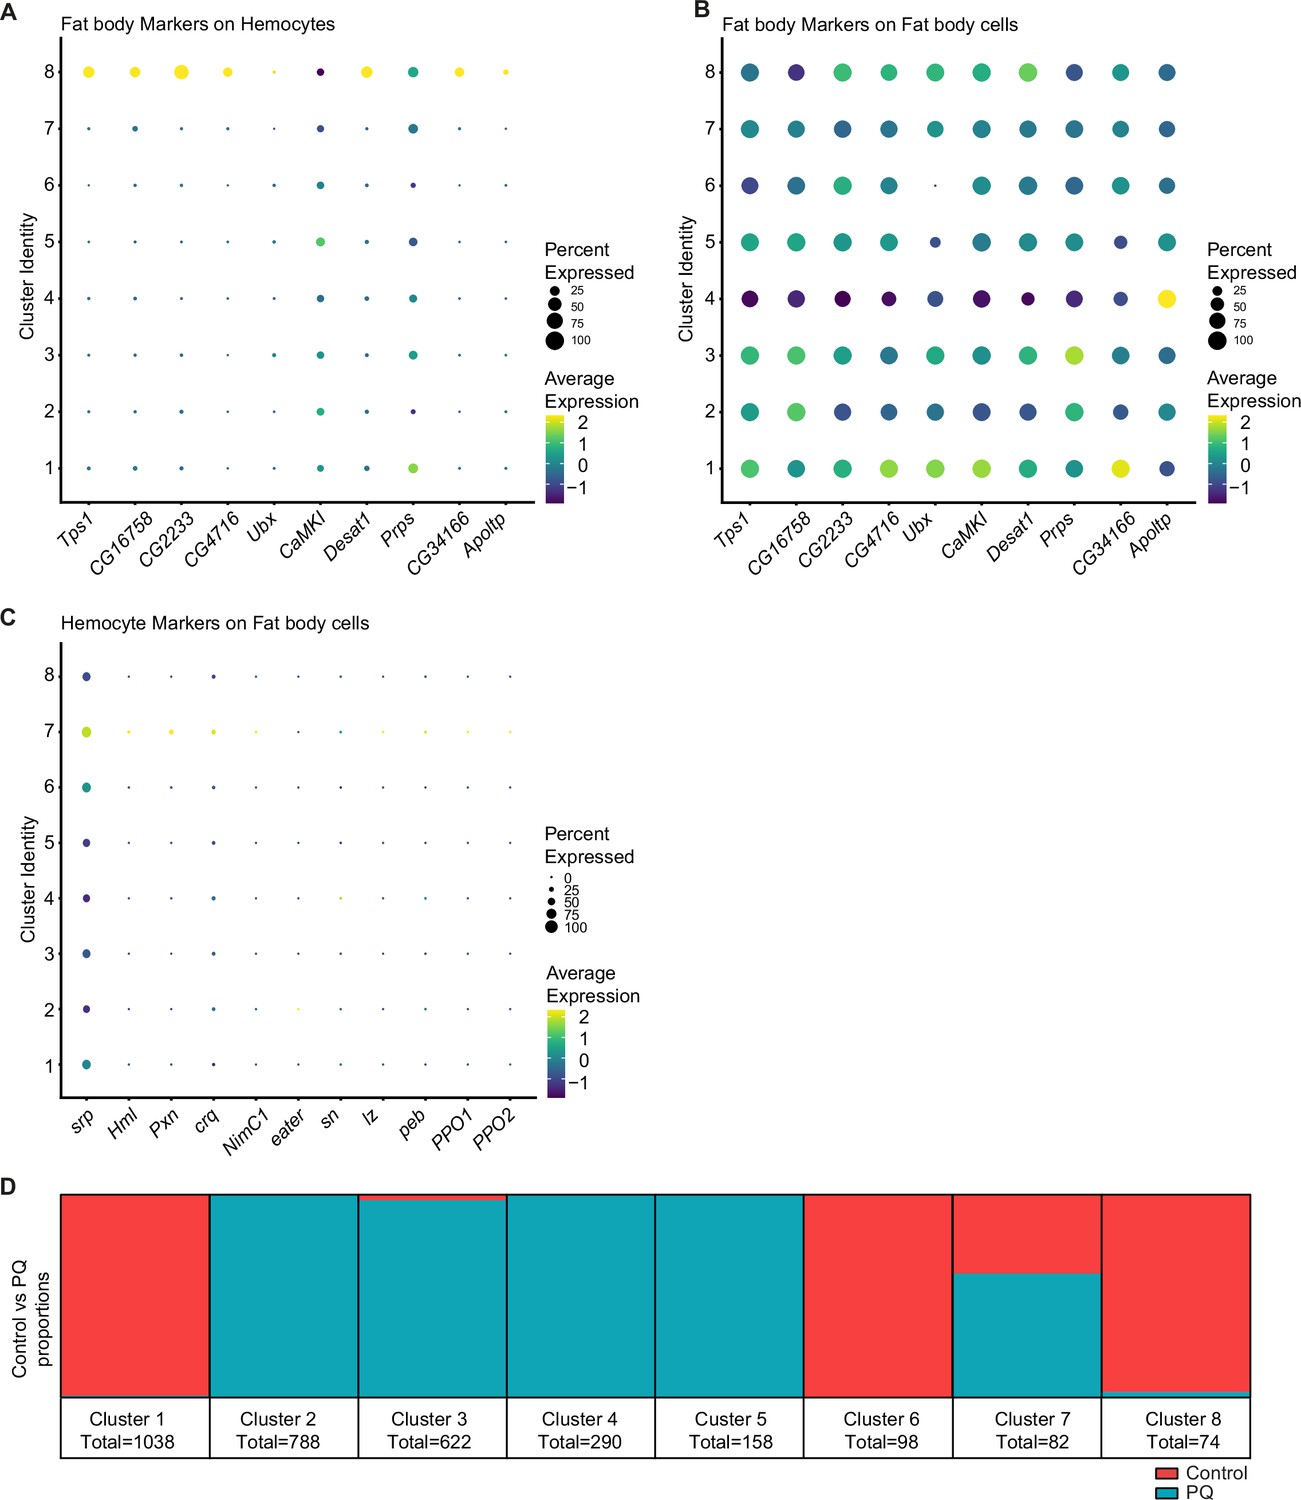
Fat body signature genes are highly expressed across the eight distinct fat body cell clusters and are absent in hemocyte cell clusters.
(A) Dot plot of fat body signature gene expression according to the Fly Cell Atlas signature (Li et al., 2022) on the eight identified hemocytes clusters. Color code is indicated in legend. (B) Dot plot of fat body signature gene expression on the eight identified fat body clusters. Color code is indicated in the legend. (C) Dot plot of hemocyte signature gene expression according to Cattenoz et al., 2020 on the eight identified fat body clusters. Color code is indicated in the legend. (D) Bar plot representing distribution of nuclei derived from flies under control condition (red) and flies treated with 15 mM PQ (turquoise) across all eight identified fat body clusters. Each cluster is shown as one bar. Total number of fat body cells in the respective cluster is indicated below.
Figure 3 with 1 supplement
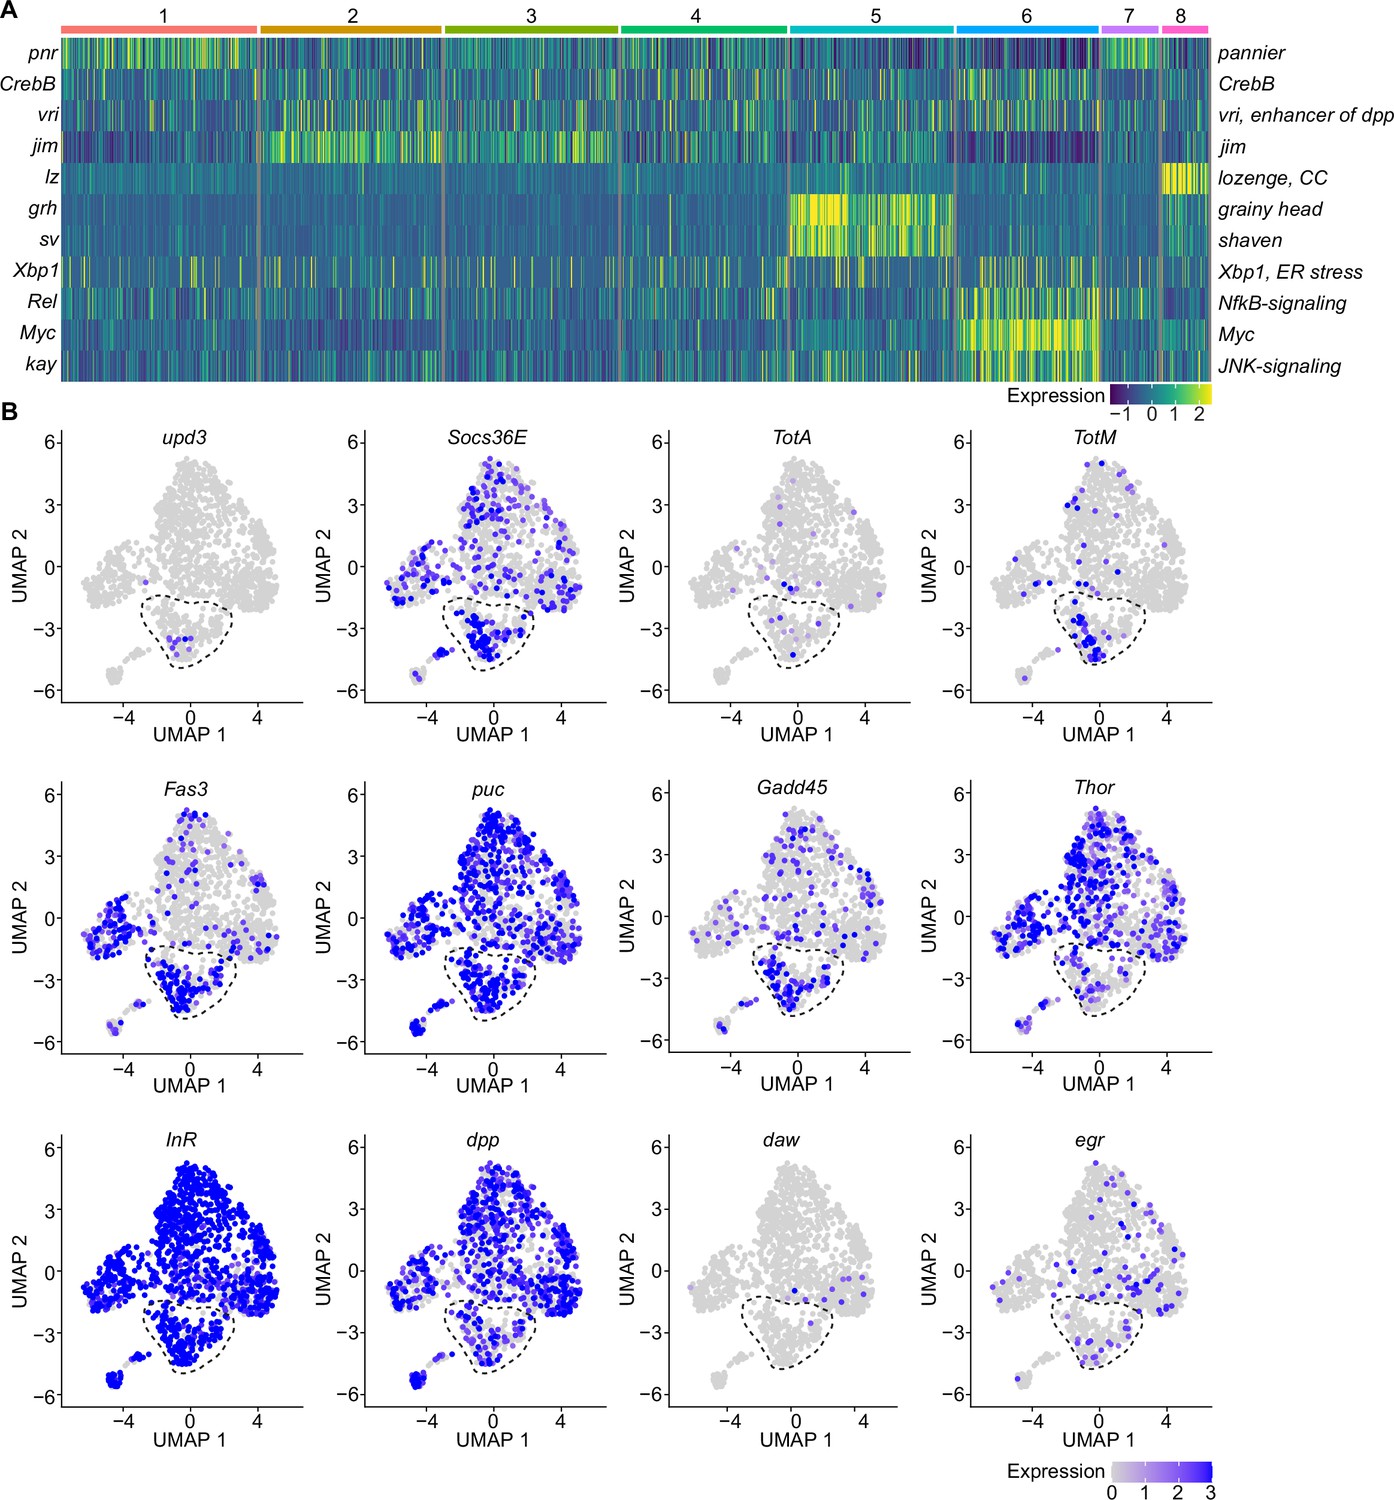
A specific cluster of plasmatocytes responds to oxidative stress with immune activation by Jak/STAT, DDR, and JNK signaling.
(A) Key transcription factors (TFs) regulating hemocyte states. Heat map of scaled TF activity at a single-cell level in hemocyte states from Figure 2C. Colors in the heat map correspond to scaled expression. Numbers on top indicate the cluster identity. Labels on the left and right indicate the TFs. (B) Feature plots showing scaled expression of selected genes associated with JAK/STAT signaling (upd3, Socs36E, TotA, TotM, Fas3), JNK and DNA damage signaling (puc, Gadd45), insulin signaling (Thor, InR), TGFβ signaling (dpp, daw), and TNF signaling (egr).
Figure 3—figure supplement 1
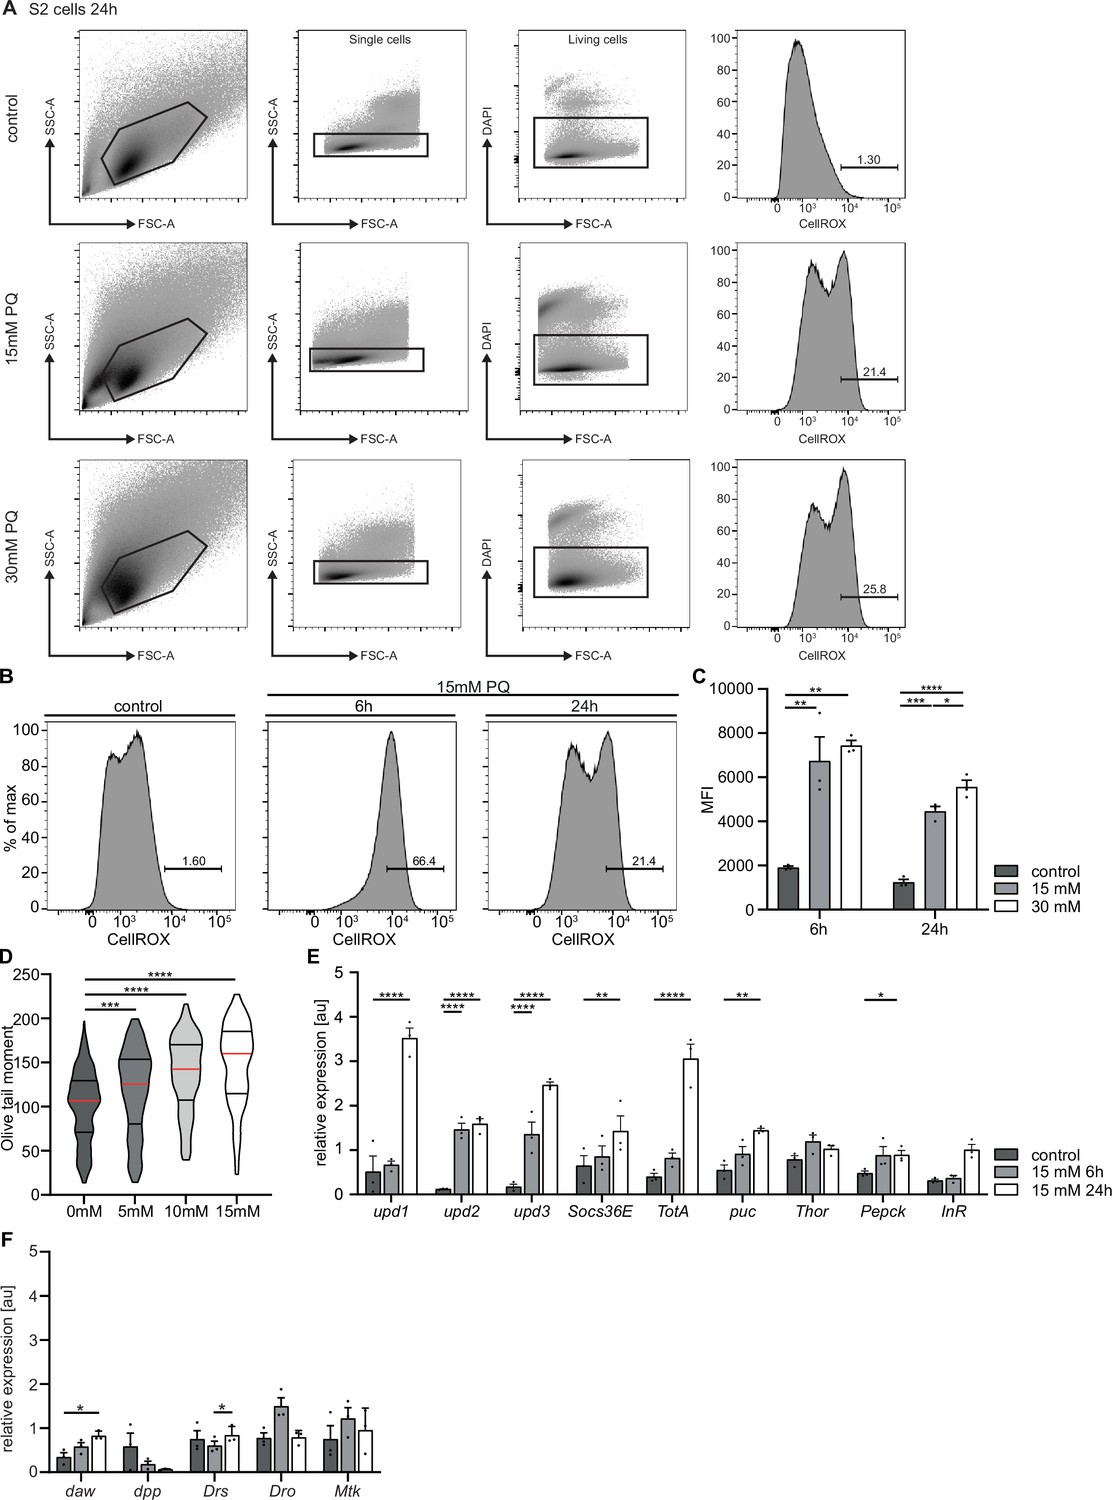
PQ treatment of S2 cells in vitro induces reactive oxygen species, immune activation and DNA damage.
(A) Gating strategy of flow cytometric analysis of control or PQ-treated S2 cells stained for reactive oxygen species (ROS) with CellROX. Control cells, 15 mM PQ treated and 30 mM PQ treated cells are shown in the first, second and third row, respectively. After doublet exclusion, dead cells were excluded via DAPI staining. The amount of ROS was determined in the last gate were the CellROX staining is shown. (B) Representative FACS histograms of cells treated with PQ and analyzed via CellROX staining. Gates indicate the cut-off for determining CellROX+ cells. (C) Mean fluorescence intensity (MFI) of FACS analyzed, CellROX+ cells. Data were generated from three independent experiments (n=3). One-way ANOVA: *p<0.05; **p<0.01; ***p<0.001; ****p<0.0001. (D) Comet assay of S2 cells treated without PQ (n=351), 5 mM PQ (n=208), 10 mM PQ (n=129), and 15 mM PQ (n=71). Assay was performed in two independent experiments. Data of one representative assay are shown as violin plots with median (red), second and third quartile. One-way ANOVA: ***p<0.001; ****p>0.0001. (E–F) Gene expression analysis of genes associated with JAK-STAT signaling, JNK signaling, insulin signaling is shown in (E) and TGFβ signaling and AMPs is shown in (F). S2 cells treated with 15 mM PQ for six or 24 hours. Controls were untreated. Each dot represents a sample containing RNA of 50,000 cells. One-way ANOVA: *p<0.05; **p<0.01; ***p<0.001; ****p<0.0001.
Figure 4
Oxidative stress induced different transcriptomic states in fat body cells, including cells with a distinct Jak/STAT activation signature.
(A) UMAP visualization of fat body cells from Figure 2A by unsupervised clustering. Colors and dashed lines indicate different clusters. Each dot represents one nucleus. n=3150 nuclei are shown. (B) UMAP of fat body cell clusters split by treatment. Nuclei from control flies are labeled in red and nuclei from PQ treated flies are labeled in blue. Dashed lines indicate different clusters. Each dot represents one nucleus. n=3150 nuclei are shown. (C) Heat map of top 20 DE genes for each fat body cluster. Gene names indicated on the left. Fold change of gene expression is color coded as indicated in legend. (D-K) Volcano plots comparing pseudo bulk gene expression of individual fat body cluster vs. all fat body cells. The –log10-transformed adjusted p-value (p adjusted, y-axis) is plotted against the log2-transformed fold change (FC) in expression between the indicated cluster vs remaining hemocytes (x-axis). Non-regulated genes are shown in grey, not significantly regulated genes are shown in green, significantly regulated genes with a FC <1.5 are shown in blue and significantly regulated genes with a FC >1.5 are shown in red.
Figure 5 with 1 supplement
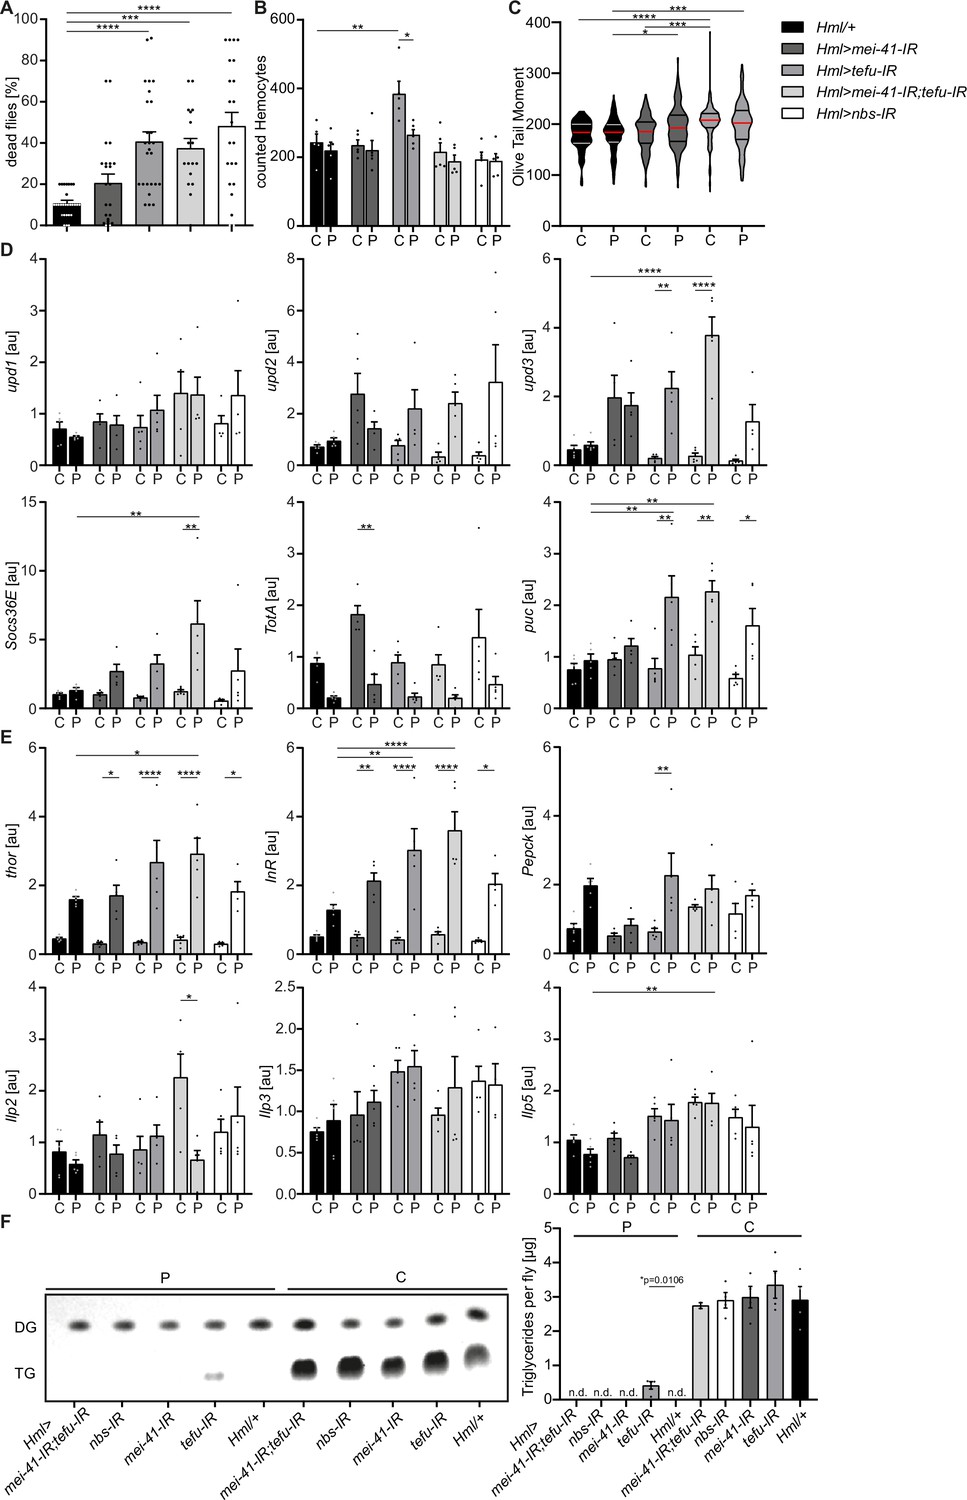
Loss of DNA damage signaling activity in hemocytes leads to an increase in systemic upd3 levels and a higher susceptibility to oxidative stress.
(A) Survival of Hml/+ (n=28), Hml >mei41 IR (n=23); Hml >tefu IR (n=24); Hml >mei41 IR,tefu-IR (n=16) and Hml >nbs IR (n=22) flies on control food and PQ. Each data point represents a sample of 10 flies. Mean ± SEM is shown. Three independent experiments were performed. One-way ANOVA: ***p<0.001; ****p<0.0001. (B) Hemocyte quantification of Hml/+ control flies and DDR-knockdowns on control food (C) and 15 mM Paraquat (P). Each data point represents one fly (n=5 for all groups). Mean ± SEM is shown. One-way ANOVA: Hml/+ (C) vs Hml >tefu IR (C), **p=0.0052; Hml >tefu IR (C) vs Hml >tefu IR (P), *p=0.03. (C) Comet assay of isolated hemocytes from Hml/+ (C: n=73; P: n=129), Hml >mei41 IR (C: n=119; P: n=132) and Hml >tefu IR (C: n=175; P: n=125) - flies on control food and PQ. Olive tail moment of comet assays of sorted hemocyte nuclei is shown. One-way ANOVA: *p<0.05; ***p<0.001; ****p<0.0001. (D) Gene expression analysis for Jak/STAT target genes via RT-qPCR in Hml/+ control flies and DDR-knockdowns on control food (C) and 15 mM Paraquat (P). All transcript levels were normalized to the expression of the loading control Rpl1 and are shown in arbitrary units [au]. Each data point (n=5) represents a sample of three individual flies. Mean ± SEM is shown. Two-way ANOVA: *p<0.05; **p<0.01; *** p<0.001; ****p<0.0001. (E) Gene expression analysis for insulin signaling target genes and Ilps via RT-qPCR in Hml/+ control flies and DDR-knockdowns on control food (C) and 15 mM Paraquat (P). All transcript levels were normalized to the expression of the loading control Rpl1 and are shown in arbitrary units [au]. Each data point (n=5) represents a sample of three individual flies. Mean ± SEM is shown. Two-way ANOVA: *p<0.05; **p<0.01; *** p<0.001; ****p<0.0001. (F) Triglyceride (TG) levels of Hml/+, Hml >mei41 IR, Hml >tefu IR, Hml >mei41 IR,tefu-IR and Hml >nbs IR flies on control food and PQ determined via thin-layer chromatography (TLC). One representative TLC is shown (left panel). Quantification thereof is shown on the right. Each data point (n=4 per group) represents a sample of 10 individual flies. Mean ± SEM is shown. n.d.=not detectable. One-way ANOVA was performed for both groups (15 mM PQ and control) separately: *p=0.0106.
Figure 5—figure supplement 1

Loss of DNA damage, upd3 or JNK signaling in hemocytes alters susceptibility to oxidative stress but not overall lifespan.
(A) Representative images of Hml/+ flies and DDR-Knockdown flies on control food (left panels) and treated with 15 mM PQ (right panels). Five individual flies per group were analyzed. (B) Lifespan analysis of Hml/+ (n=251), Hml >mei-41-IR (n=231), Hml >tefu IR (n=219), Hml >mei-41-IR;tefu-IR (n=144) and Hml >nbs IR flies (n=299). Hml/+ vs. Hml >mei-41-IR: Log-rank test ****p<0.0001, Χ2=172.2; Wilcoxon test ****p<0.0001, Χ2=155.9. Hml/+ vs. Hml >tefu-IR: Log-rank test ****p<0.0001, Χ2=56.09; Wilcoxon test ****p<0.0001, Χ2=50.95. Hml/+ vs. Hml >mei-41-IR;tefu-IR: Log-rank test ns, Χ2=3.1; Wilcoxon test ***p=0.0005, Χ2=12.11. Hml/+ vs Hml >nbs-IR: Log-rank test ****p<0.0001, Χ2=60.90; Wilcoxon test ****p<0.0001, Χ2=50.21. Data was obtained from three independent experiments. (C) Starvation survival of Hml/+ (n=607), Hml >mei-41-IR (n=421), Hml >tefu IR (n=480), Hml >mei-41-IR;tefu-IR (n=266) and Hml >nbs IR (n=341) flies. Hml/+ vs. Hml >mei-41-IR: Log-rank test **p=0.0052, Χ2=7.81; Wilcoxon test ns, Χ2=0.02. Hml/+ vs. Hml >tefu-IR: Log-rank test ns, Χ2=0.03; Wilcoxon test *p=0.0153, Χ2=5.88. Hml/+ vs. Hml >mei-41-IR;tefu-IR: Log-rank test ns, Χ2=0.21; Wilcoxon test *p=0.019, Χ2=5.51. Hml/+ vs Hml >nbs-IR: Log-rank test ***p=0.0003, Χ2=13.30; Wilcoxon test ns, Χ2=1.24. Data was obtained from two independent experiments. (D) Lifespan analysis of Hml-Gal80ts/+ (n=127), Hml-Gal80ts>mei-41-IR (n=140), Hml-Gal80ts>tefu IR (n=164), Hml-Gal80ts>mei-41-IR;tefu-IR (n=101) and Hml-Gal80ts>nbs IR flies (n=157). Hml-Gal80ts/+ vs. Hml-Gal80ts>mei-41-IR: Log-rank test ****p<0.0001, chi2=21.80; Wilcoxon test ****p<0.0001, Χ2=18.48. Hml-Gal80ts/+ vs. Hml-Gal80ts>tefu-IR: Log-rank test ***p=0.0003, Χ2=13.20; Wilcoxon test *p=0.033, Χ2=4.56. Hml-Gal80ts/+ vs. Hml-Gal80ts>mei-41-IR;tefu-IR: Log-rank test *p=0.0429, Χ2=4.10; Wilcoxon test ***p=0.0001, Χ2=14.95. Hml-Gal80ts/+ vs Hml-Gal80ts>nbs-IR: Log-rank test **p=0.0047, Χ2=7.99; Wilcoxon test ns, Χ2=1.68. Data was obtained from five independent experiments. (E) Survival of Hml-Gal80ts/+ (n=23), Hml-Gal80ts>mei-41-IR (n=28), Hml-Gal80ts>tefu IR (n=18), Hml-Gal80ts>mei-41-IR;tefu-IR (n=13) and Hml-Gal80ts>nbs IR flies (n=31) on PQ food. Each dot represents a sample with ten flies. Mean ± SEM is shown. One-way ANOVA *p<0.05; ****p<0.0001. Data was obtained from five independent experiments. (F) Representative images of Hml/+, Hml >upd3 IR and Hml >upd3 flies on control food (left panels) and treated with 15 mM PQ (right panels). Six individual flies per group were analyzed. (G) Lifespan analysis of Hml/+ (n=266), Hml >upd3 IR (n=269), and Hml >upd3 flies (n=193). Hml/+ vs. Hml >upd3-IR: Log-rank test ****p<0.0001, Χ2=96.03; Wilcoxon test ****p<0.0001, Χ2=81.16. Hml/+ vs. Hml >upd3: Log-rank test ****p<0.0001, Χ2=15.33; Wilcoxon test *p=0.0124, Χ2=6.26. Results are shown from two independent experiments. (H) Lifespan analysis of Hml/+ (n=281), Hml >hep[act] (n=117), and Hml >bsk DN (n=273) flies. Hml/+ vs. Hml >hep[act]; Log-rank test: n.s.; p=0.69, Χ2=0.16; Wilcoxon test: n.s. p=0.18, Χ2=1.77. Hml/+ vs. Hml >bsk-DN: Log-rank test: ****p<0.0001, Χ2=25.31; Wilcoxon test: ****p<0.0001, Χ2=23.61. Data was obtained from two independent experiments.
Figure 6
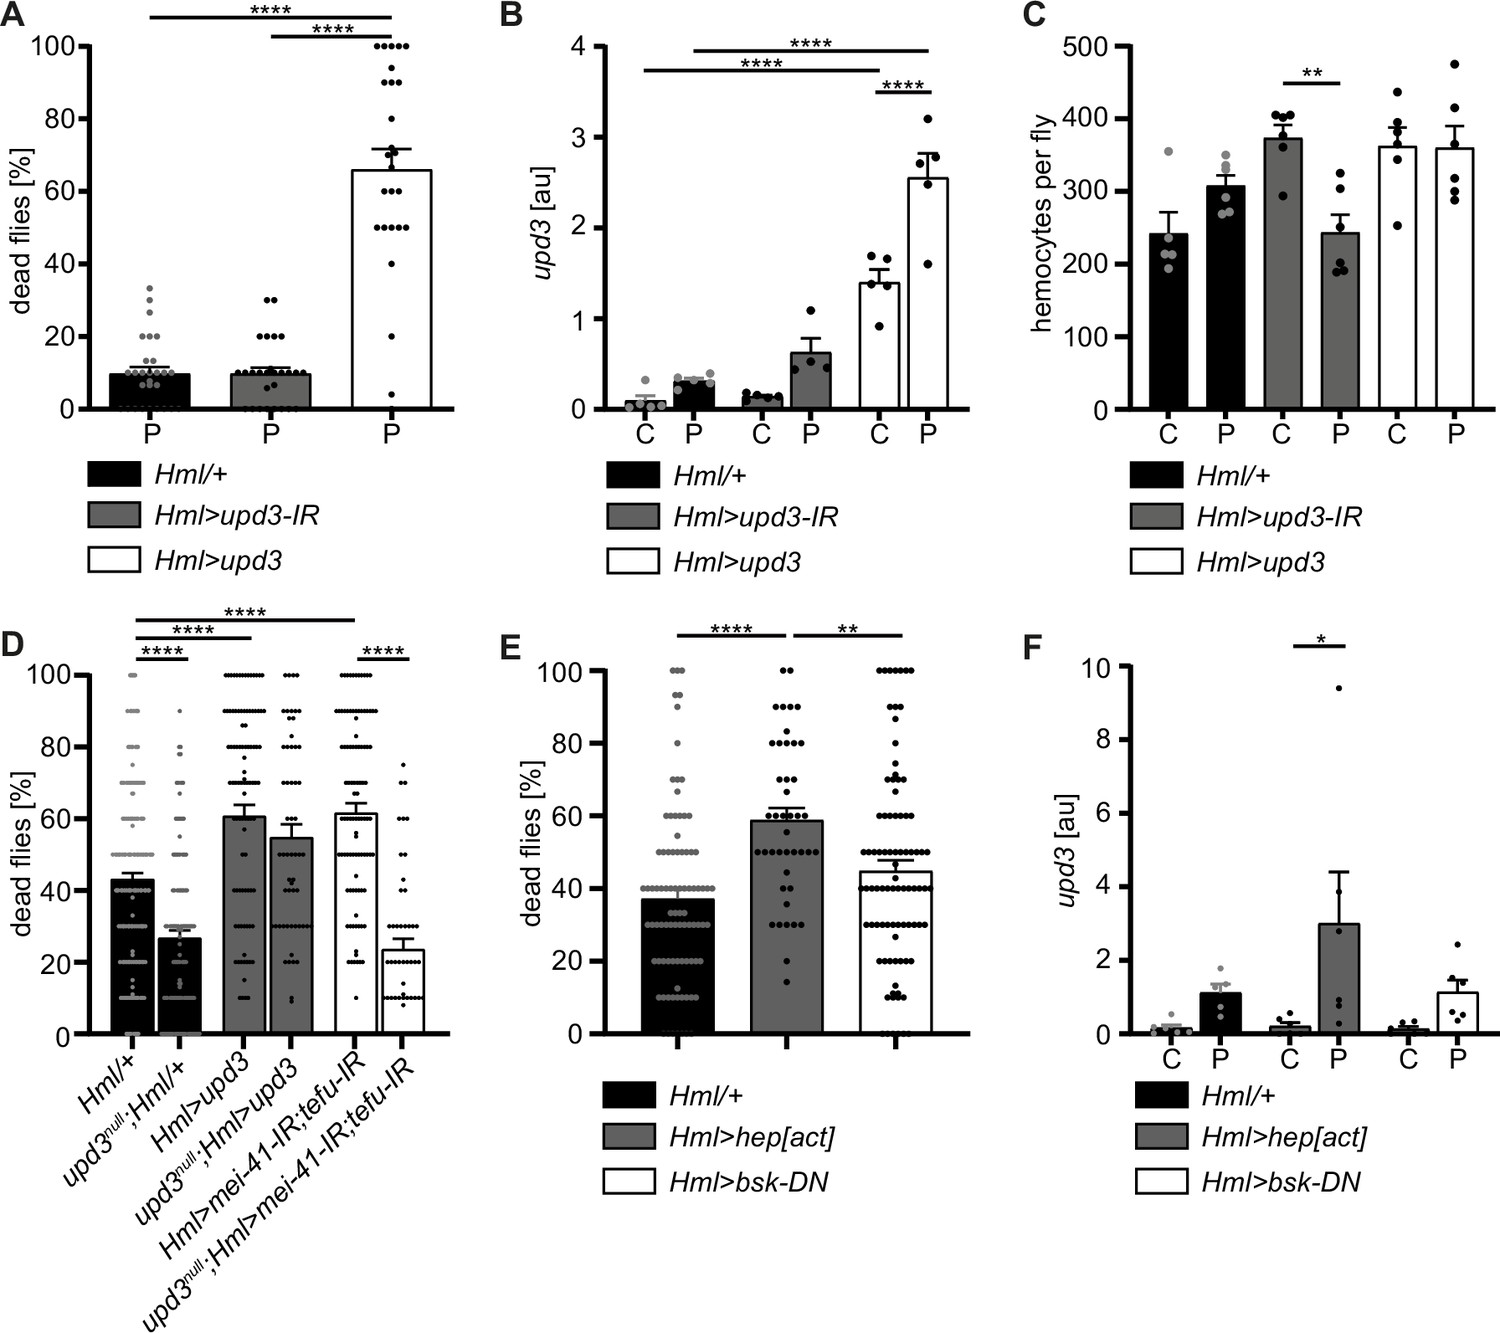
Hemocyte-derived upd3 controls susceptibility to oxidative stress in adult Drosophila.
(A) Survival of Hml/+ (n=28), Hml>upd3-IR (n=27) and Hml>upd3 (n=26) flies on 15 mM PQ food. Each data point represents a sample of 10–15 flies. Mean ± SEM is shown. Three independent experiments were performed. One-way ANOVA: ****p<0.0001. (B) Gene expression analysis for upd3 via RT-qPCR in Hml/+, Hml>upd3-IR and Hml>upd3 flies on control food (C) and 15 mM Paraquat (P). Each data point (n=5–6) represents a sample of three individual flies. Mean ± SEM is shown. Two-way ANOVA: ****p<0.0001. (C) Hemocyte quantifications in Hml/+, Hml>upd3-IR and Hml>upd3 flies on control food and 15 mM PQ food. Each data point represents one fly (n=5–6). Mean ± SEM is shown. One-way ANOVA: **p<0.01. (D) Survival of Hml/+ (n=241), upd3null;Hml/+ (n=122), Hml>upd3 (n=104), upd3null;Hml>upd3 (n=57), Hml>mei-41-IR;tefu-IR (n=103) and upd3null;Hml>mei-41-IR;tefu-IR (n=50) flies on 15 mM PQ food at 29 °C. Each data point represents a sample with 10–15 flies. Mean ± SEM is shown. One-way ANOVA: ****p<0.0001. (E) Survival of Hml/+ (n=78), Hml>hep[act] (n=38) and Hml>bsk-DN (n=80) flies on 15 mM PQ food. Each data point represents a sample with 10 flies. Mean ± SEM is shown. One-way ANOVA: **p<0.01; ****p<0.0001. (F) Gene expression analysis for upd3 via RT-qPCR of Hml/+, Hml>hep[act] and Hml>bsk-DN flies on control food (-) and 15 mM Paraquat (+). Each data point (n=5–6) represents a sample of three individual flies. Mean ± SEM is shown. Two-way ANOVA: *p<0.05.
Figure 7
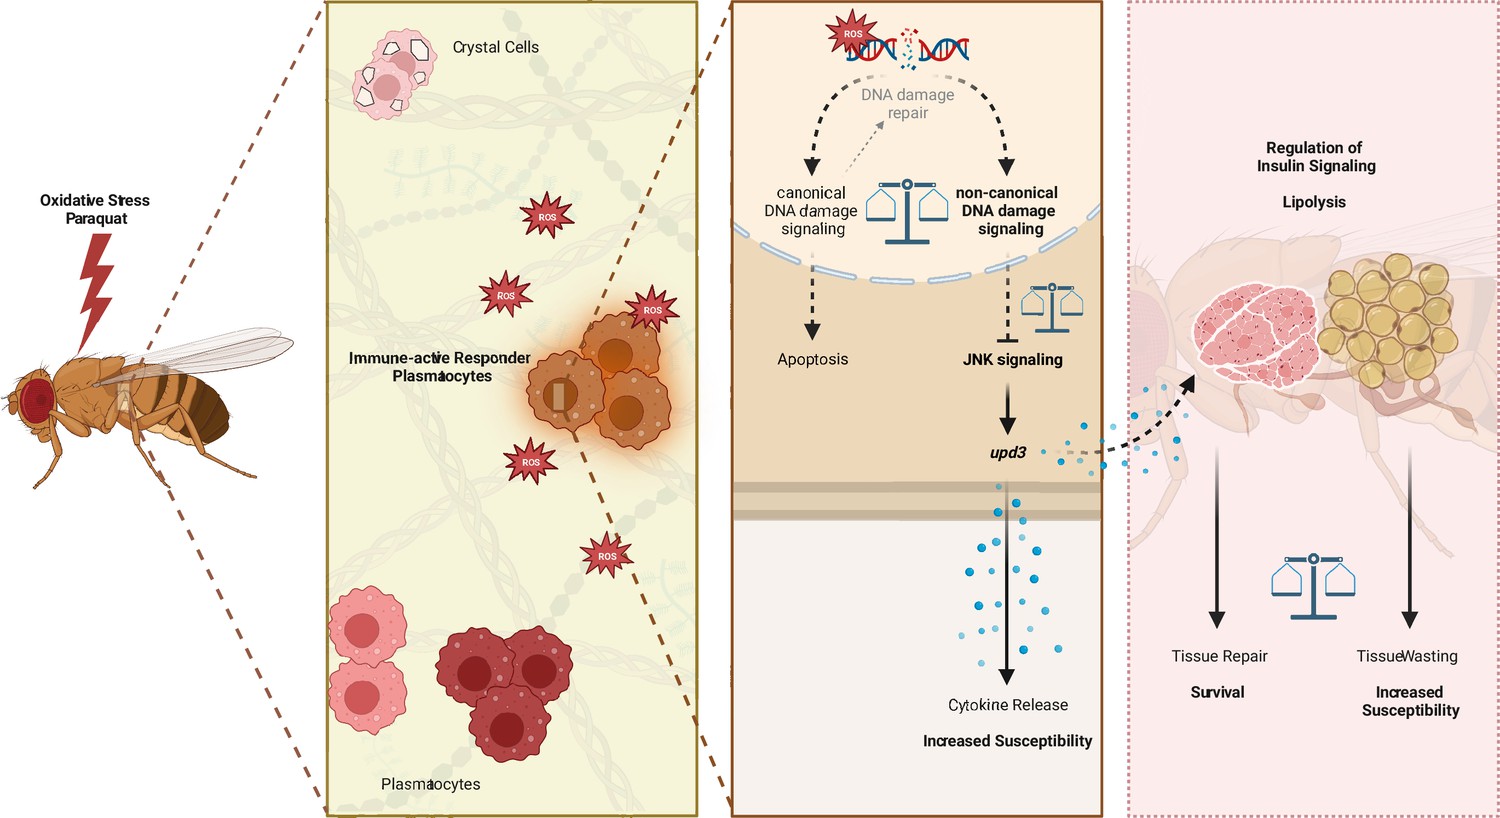
Graphical summary of the results.
Additional files
-
Supplementary file 1
Differentially expressed genes in hemocyte clusters C1-C8.
- https://cdn.elifesciences.org/articles/86700/elife-86700-supp1-v1.xlsx
-
Supplementary file 2
Differentially expressed genes in fat body cell clusters C1-C8.
- https://cdn.elifesciences.org/articles/86700/elife-86700-supp2-v1.xlsx
-
Supplementary file 3
Transgenic Drosophila lines and primers used in the study.
- https://cdn.elifesciences.org/articles/86700/elife-86700-supp3-v1.xlsx
-
MDAR checklist
- https://cdn.elifesciences.org/articles/86700/elife-86700-mdarchecklist1-v1.pdf
Download links
A two-part list of links to download the article, or parts of the article, in various formats.
Downloads (link to download the article as PDF)
Open citations (links to open the citations from this article in various online reference manager services)
Cite this article (links to download the citations from this article in formats compatible with various reference manager tools)
DNA damage signaling in Drosophila macrophages modulates systemic cytokine levels in response to oxidative stress
eLife 12:RP86700.
https://doi.org/10.7554/eLife.86700.3


