Fetal influence on the human brain through the lifespan
- Center for Lifespan Changes in Brain and Cognition, University of Oslo, Norway
- Computational Radiology and Artificial Intelligence, Department of Radiology and Nuclear Medicine, Oslo University Hospital, Norway
- Department of Neuromedicine and Movement Science, Faculty of Medicine and Health Sciences, Norwegian University of Science and Technology, Norway
Figures
Figure 1 with 6 supplements
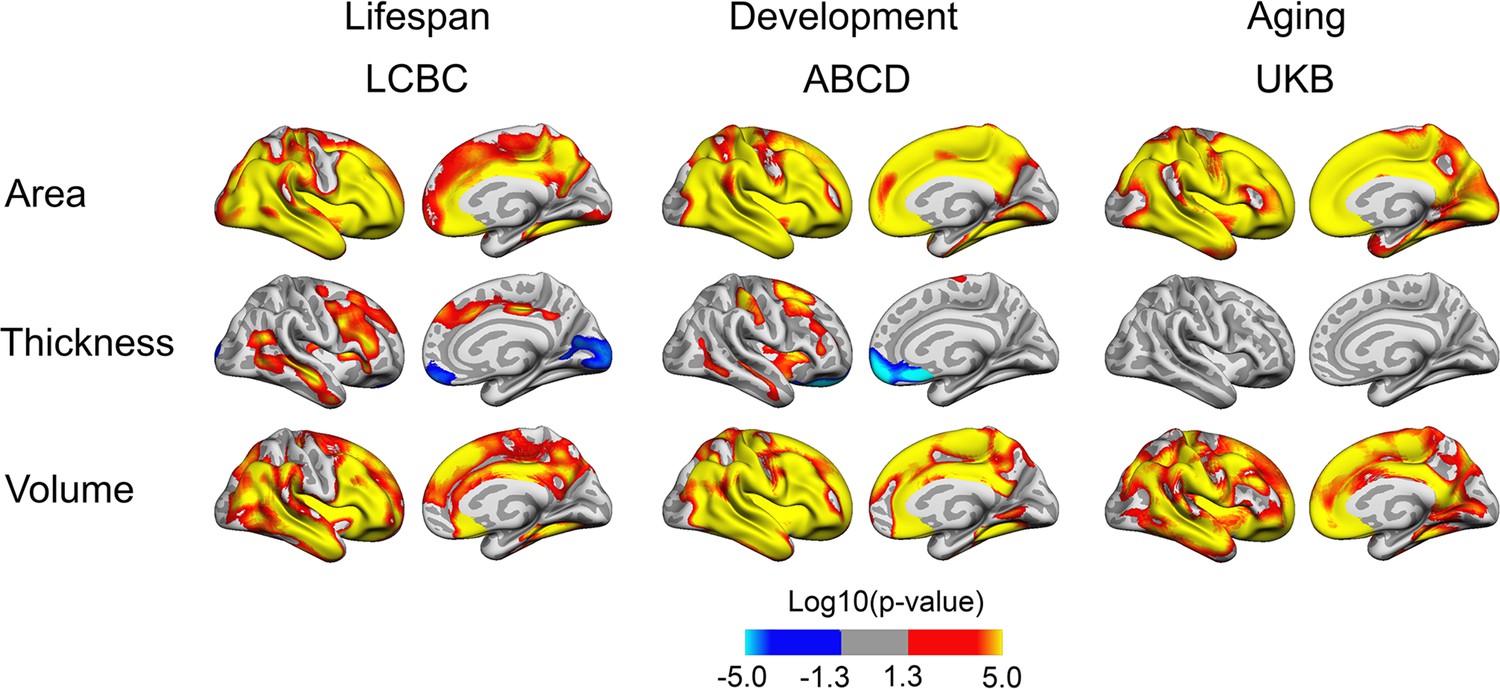
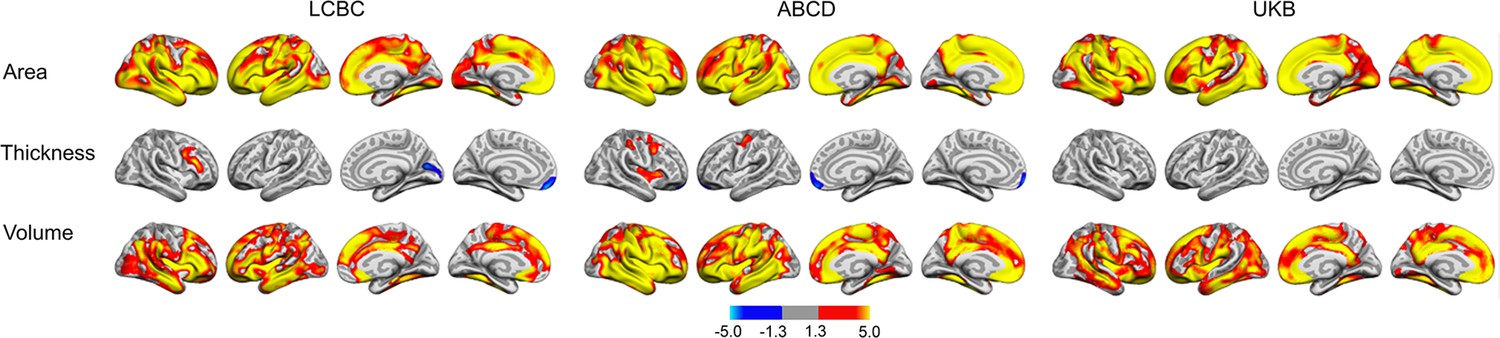
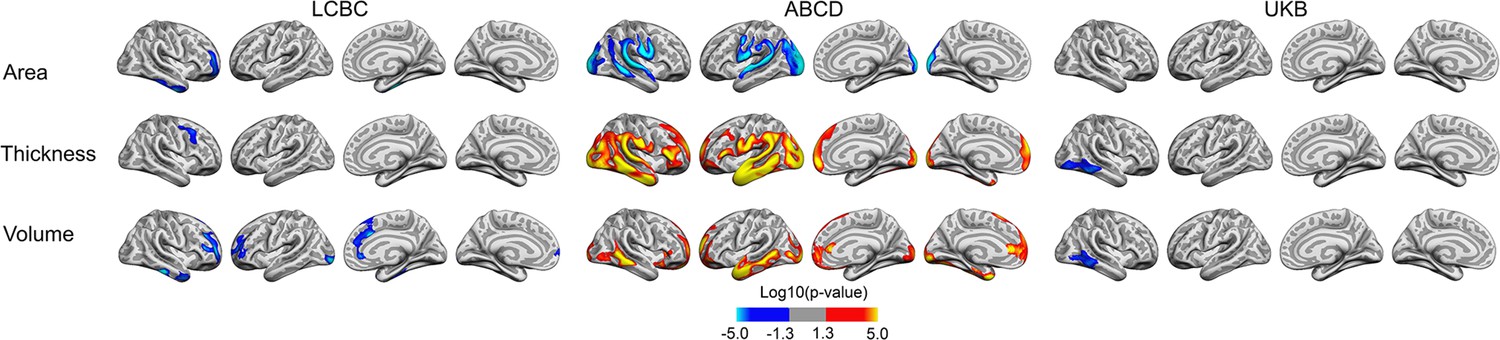
Relationships of birth weight and cortical characteristics across Lifespan Changes in Brain and Cognition (LCBC), Adolescent Brain Cognitive Development (ABCD), and UK Biobank (UKB) samples.
Age, sex, time (interval since baseline), and scanner site (as well as ethnicity in the ABCD) were controlled for. Significant relationships are shown for area, thickness, and volume for each sample, from left to right: lateral view and medial view, right hemisphere.
Figure 1—figure supplement 1
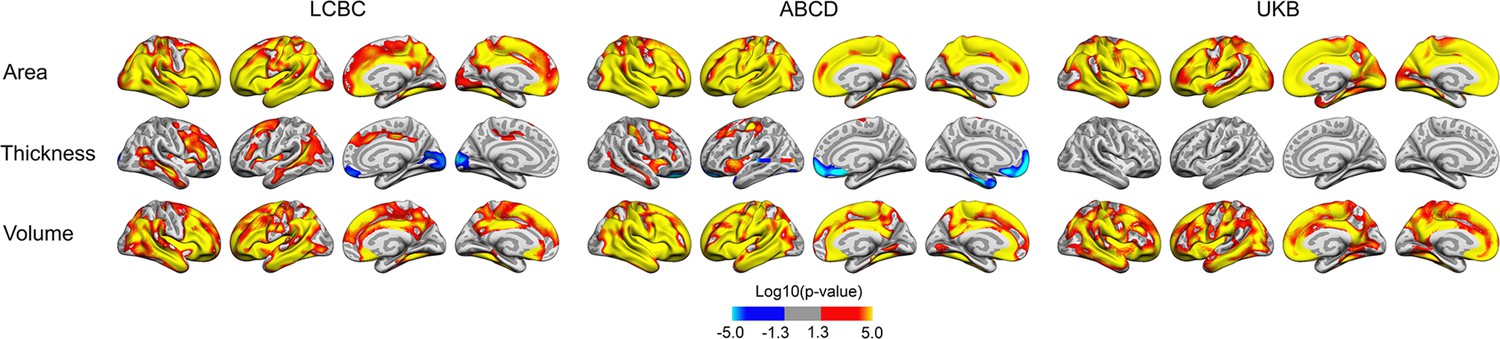
Relationships of birth weight and cortical characteristics in both hemispheres across Lifespan Changes in Brain and Cognition (LCBC), Adolescent Brain Cognitive Development (ABCD), and UK Biobank (UKB) samples when controlling for age, sex, time (interval since baseline), and scanner site (as well as ethnicity in the ABCD).
Significant relationships are shown from left to right: lateral view, right and left hemisphere; and medial view, right and left hemisphere.
Figure 1—figure supplement 2
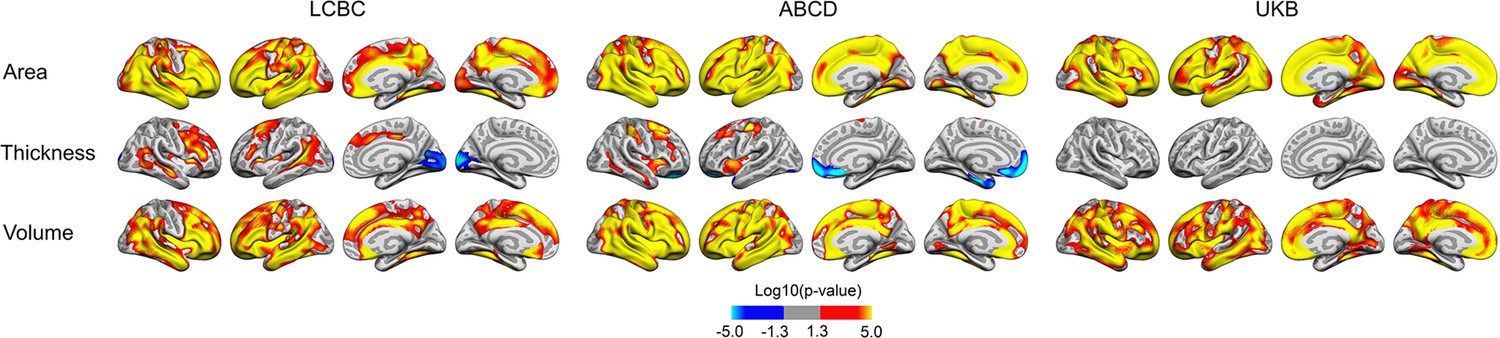
Relationships of birth weight and cortical characteristics across Lifespan Changes in Brain and Cognition (LCBC), Adolescent Brain Cognitive Development (ABCD), and UK Biobank (UKB) samples when controlling for education, age, sex, time (interval since baseline), and scanner site (as well as ethnicity in the ABCD).
Significant relationships are shown from left to right: lateral view, right and left hemisphere; and medial view, right and left hemisphere.
Figure 1—figure supplement 3
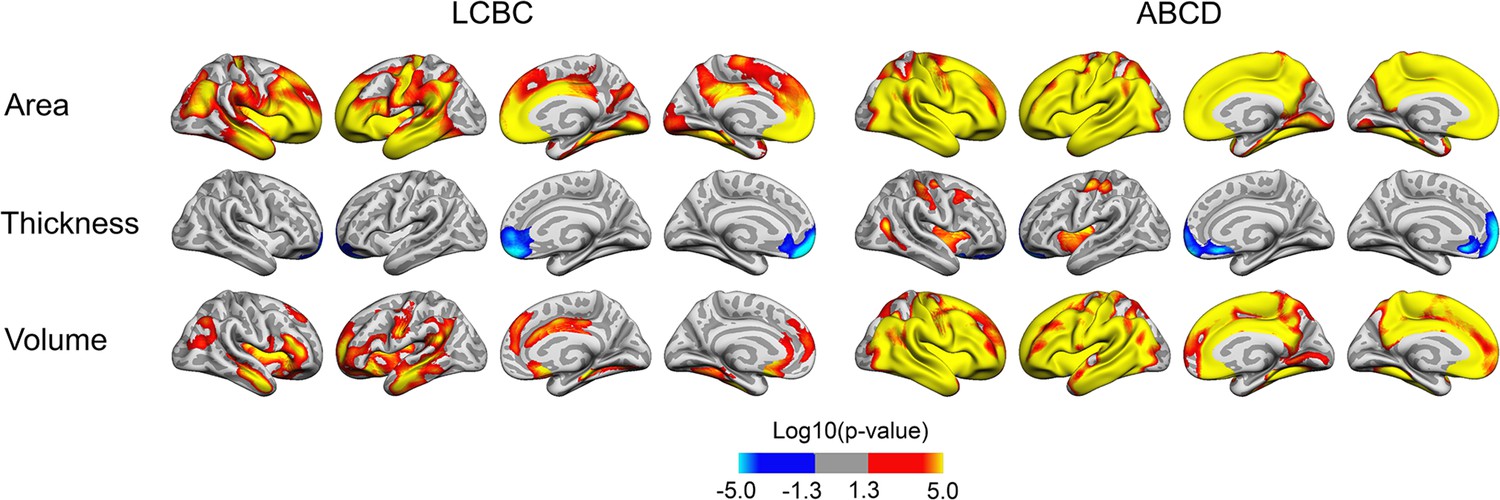
Relationships of birth weight and cortical characteristics across Lifespan Changes in Brain and Cognition (LCBC) and Adolescent Brain Cognitive Development (ABCD) samples when controlling for gestational length in weeks (LCBC) or weeks born prematurely (ABCD), age, sex, time (interval since baseline), and scanner site (as well as ethnicity in the ABCD).
Significant relationships are shown from left to right: lateral view, right and left hemisphere; and medial view, right and left hemisphere.
Figure 1—figure supplement 4
Relationships of birth weight and cortical characteristics across Lifespan Changes in Brain and Cognition (LCBC), Adolescent Brain Cognitive Development (ABCD), and UK Biobank (UKB) when restricting the samples to participants with birth weights between 2.5 and 5.0 kg, controlling for age, sex, time (interval since baseline), and scanner site (as well as ethnicity in the ABCD).
Compare to Figure 1. Significant relationships are shown from left to right: lateral view, right and left hemisphere; and medial view, right and left hemisphere.
Figure 1—figure supplement 5
Relationships of birth weight and cortical characteristics across Lifespan Changes in Brain and Cognition (LCBC), Adolescent Brain Cognitive Development (ABCD), and UK Biobank (UKB) samples when controlling for intracranial volume (ICV), age, sex, time (interval since baseline), and scanner site (as well as ethnicity in the ABCD).
Significant relationships are shown from left to right: lateral view, right and left hemisphere; and medial view, right and left hemisphere.
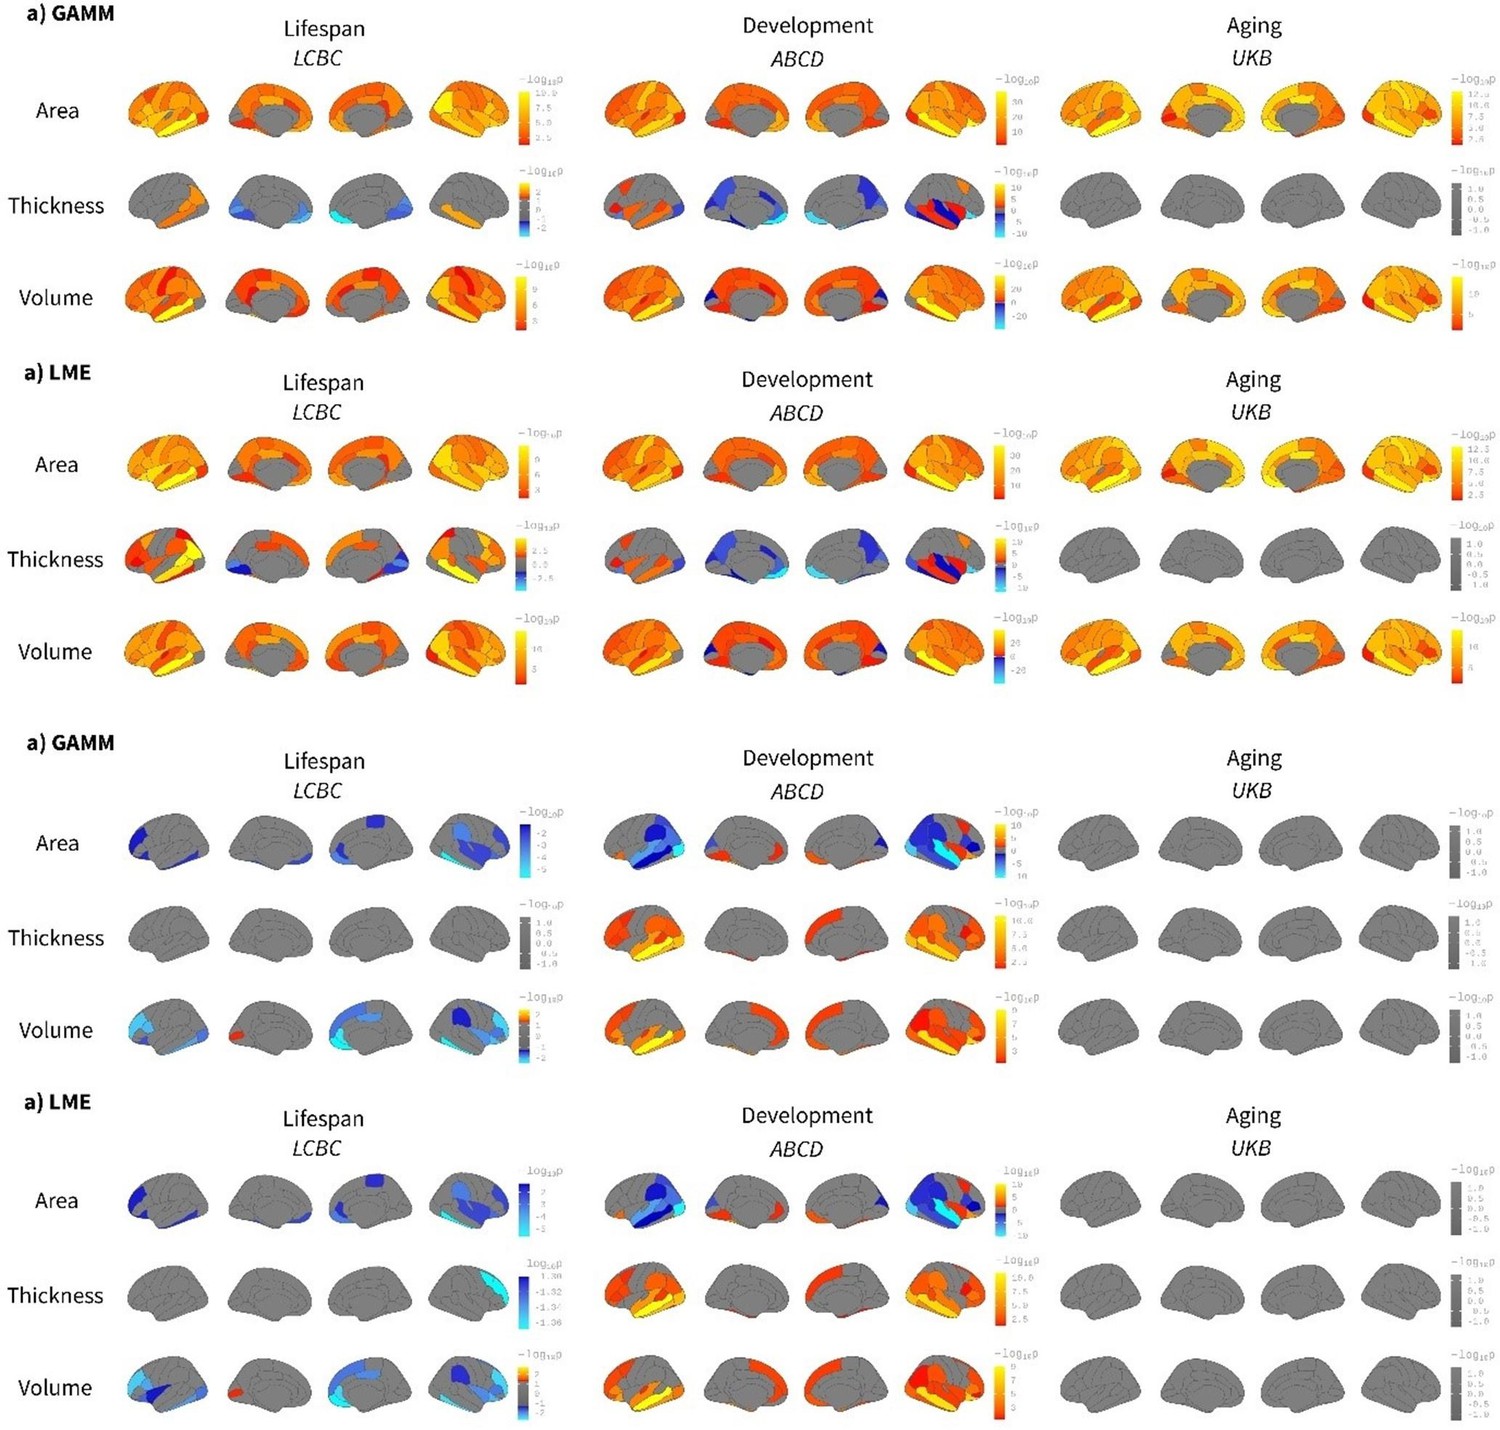
Figure 1—figure supplement 6
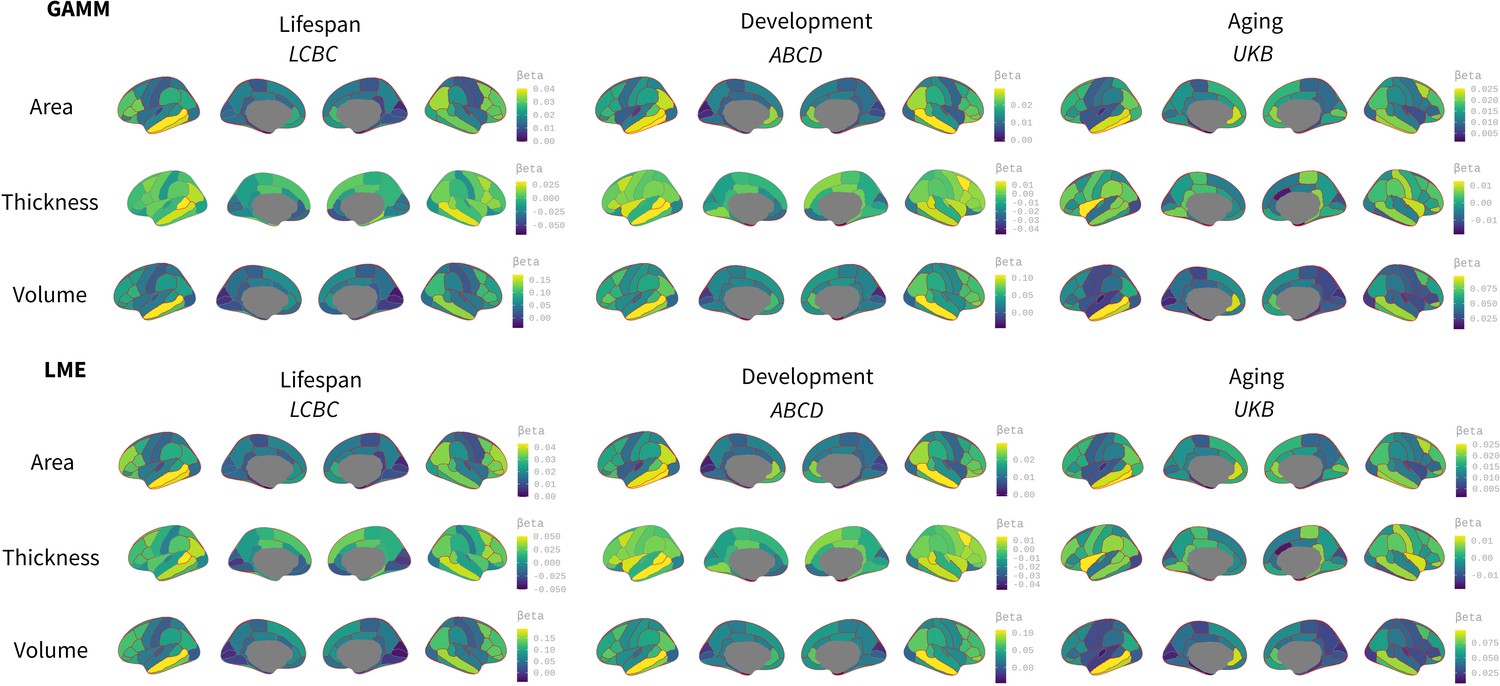
Comparison between spline (generalized additive mixed model [GAMM]) and linear (linear mixed model [LME]) models on the effect of birth weight on cortical characteristics.
Age was fitted either as a smoothing spline using GAMM (mgcv r-package) or a linear regressor with an LME (lmer r-package) framework. The analyses were performed region of interest (ROI) -based using the Desikan–Killiany atlas. Significance was considered at a false discovery rate (FDR) -corrected threshold of p<0.04. All the remaining parameters were comparable to the main analyses shown in Figure 1. The viridis-yellow scale represents the lower-higher beta regressors. Red contour displays regions showing significant effects of birth weight. Note the high correspondence with both fitting models. Differences are only noticeable in the Lifespan Changes in Brain and Cognition (LCBC) sample due to the datasets’ wider age range (i.e., lifespan dataset).
Figure 2 with 6 supplements
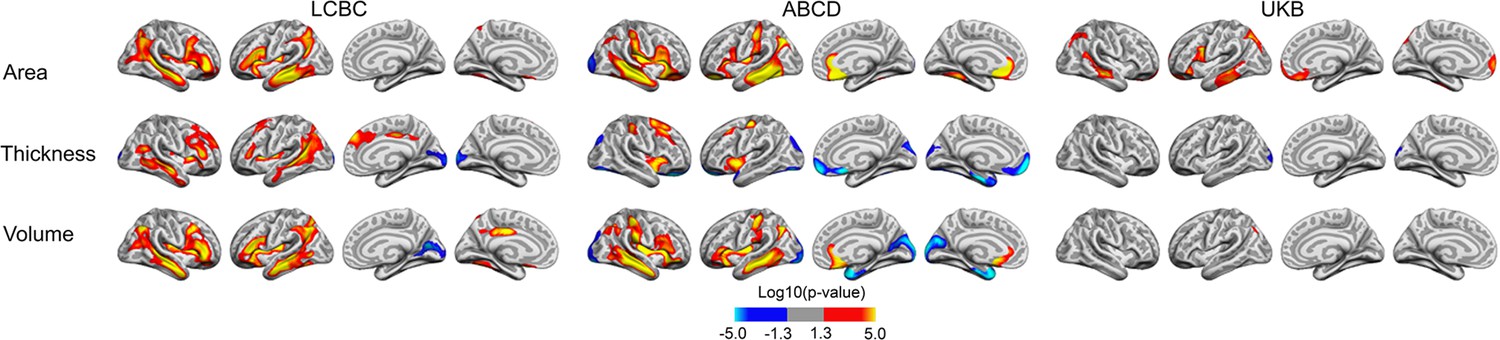
Interactions of birth weight (BW) and time on cortical characteristics across Lifespan Changes in Brain and Cognition (LCBC), Adolescent Brain Cognitive Development (ABCD), and UK Biobank (UKB) samples.
Age, sex, scanner site, time, and BW (as well as ethnicity in the ABCD) were controlled for. Significant relationships are shown, from left to right: lateral view, right and left hemisphere; and medial view, right and left hemisphere.
Figure 2—figure supplement 1
Interactions of birth weight (BW) and time on cortical characteristics in both hemispheres across Lifespan Changes in Brain and Cognition (LCBC), Adolescent Brain Cognitive Development (ABCD), and UK Biobank (UKB) samples when controlling for age, sex, scanner site, time, birth weight, and the interaction of baseline age and time (as well as ethnicity in the ABCD).
Significant relationships are shown from left to right: lateral view, right and left hemisphere; and medial view, right and left hemisphere.
Figure 2—figure supplement 2
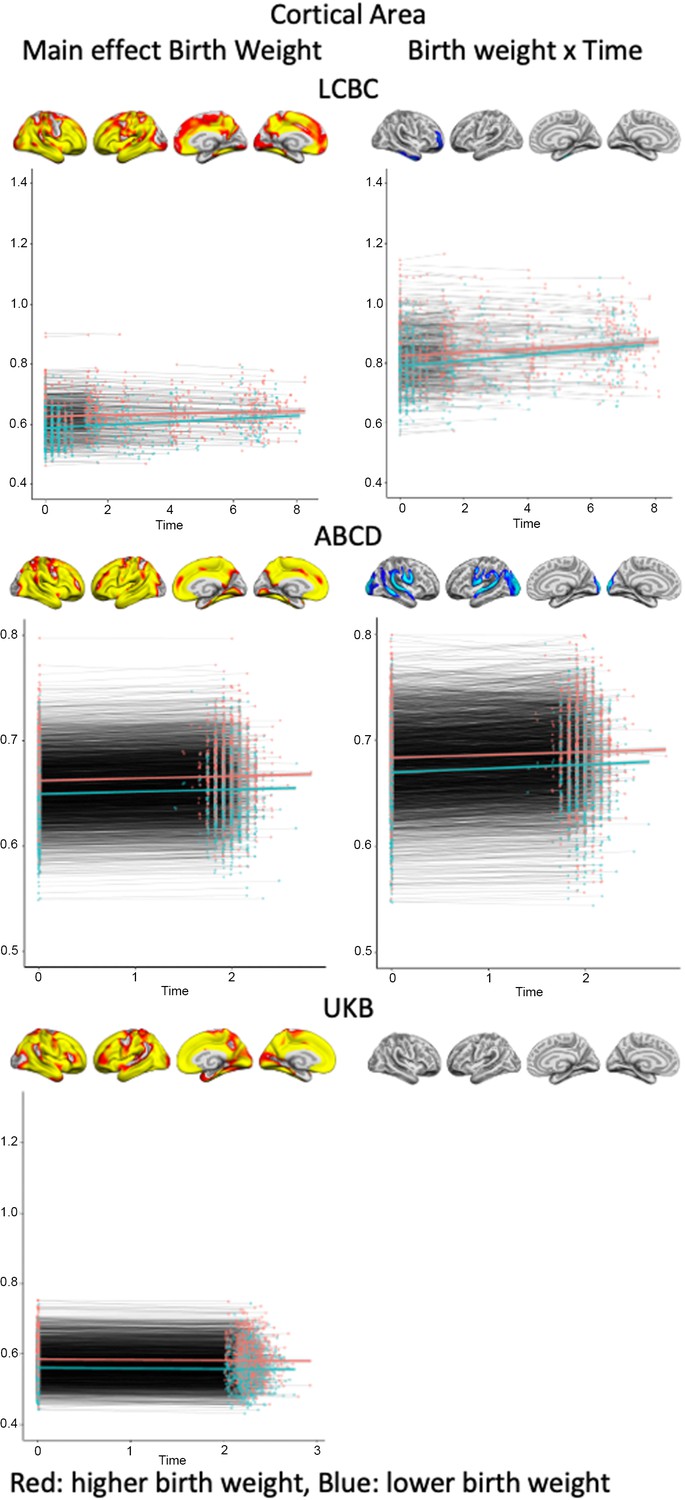
Plots showing individual data points and expected trajectories for cortical area within the significant regions (refer to Figures 1 and 2) of each sample split into two based on birth weight (BW) (higher BW in red color = upper half, lower BW in blue color = lower half of BW distribution).
Y-axis: cortical area: mm2, thickness; X-axis: time in years.
Figure 2—figure supplement 3
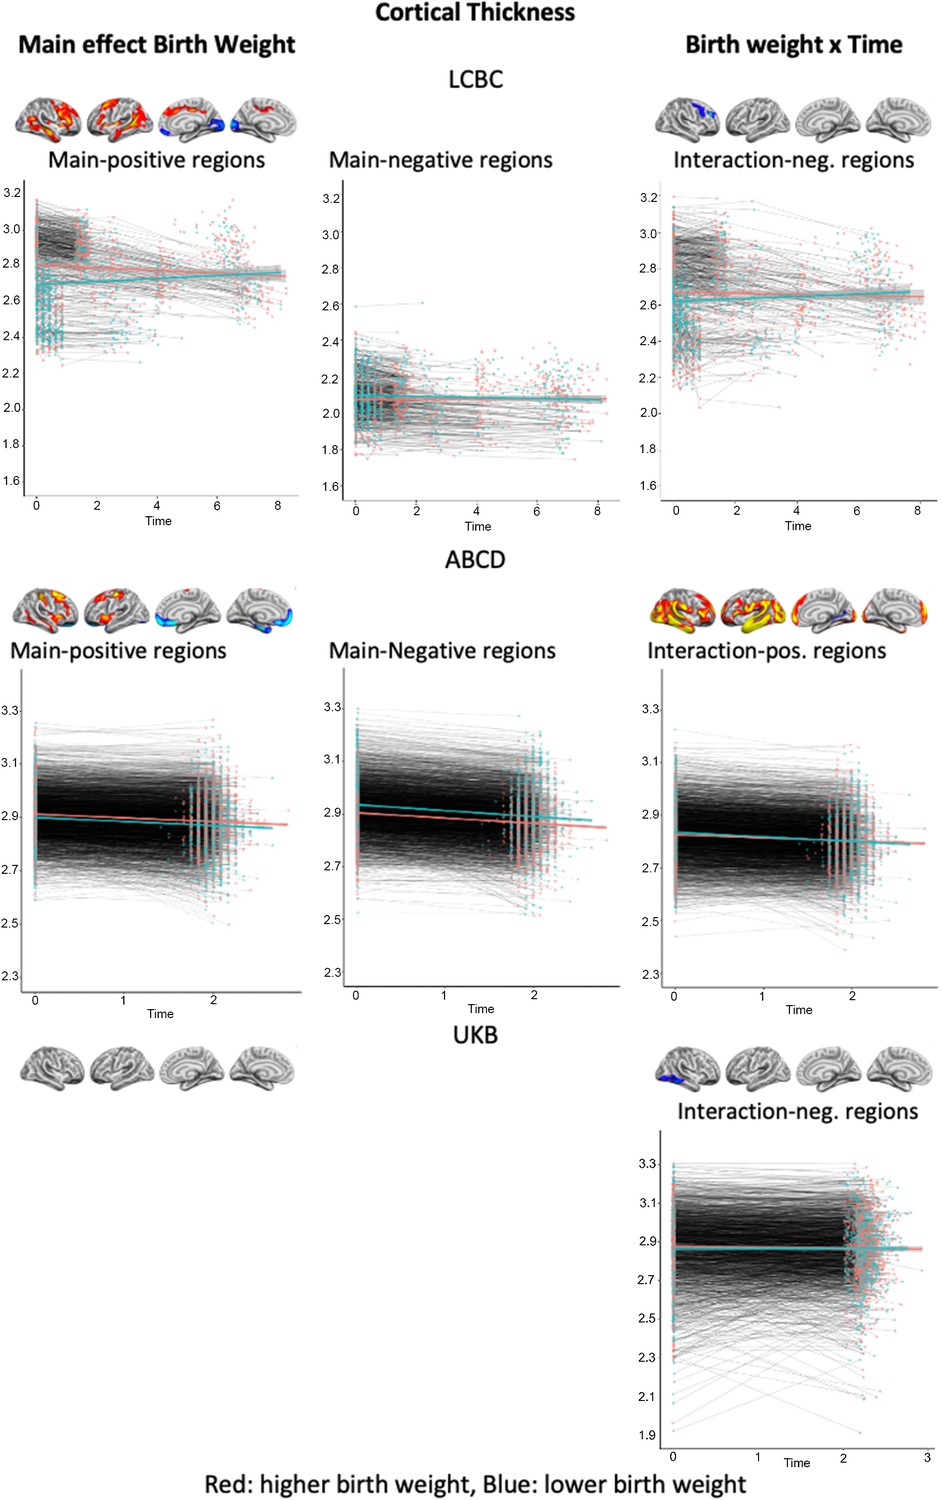
Plots showing individual data points and expected trajectories for cortical thickness within the significant regions (refer to Figures 1 and 2) of each sample split into two based on birth weight (BW) (higher BW in red color = upper half, lower BW in blue color = lower half of BW distribution).
Y-axis: cortical thickness: mm; X-axis: time in years.
Figure 2—figure supplement 4
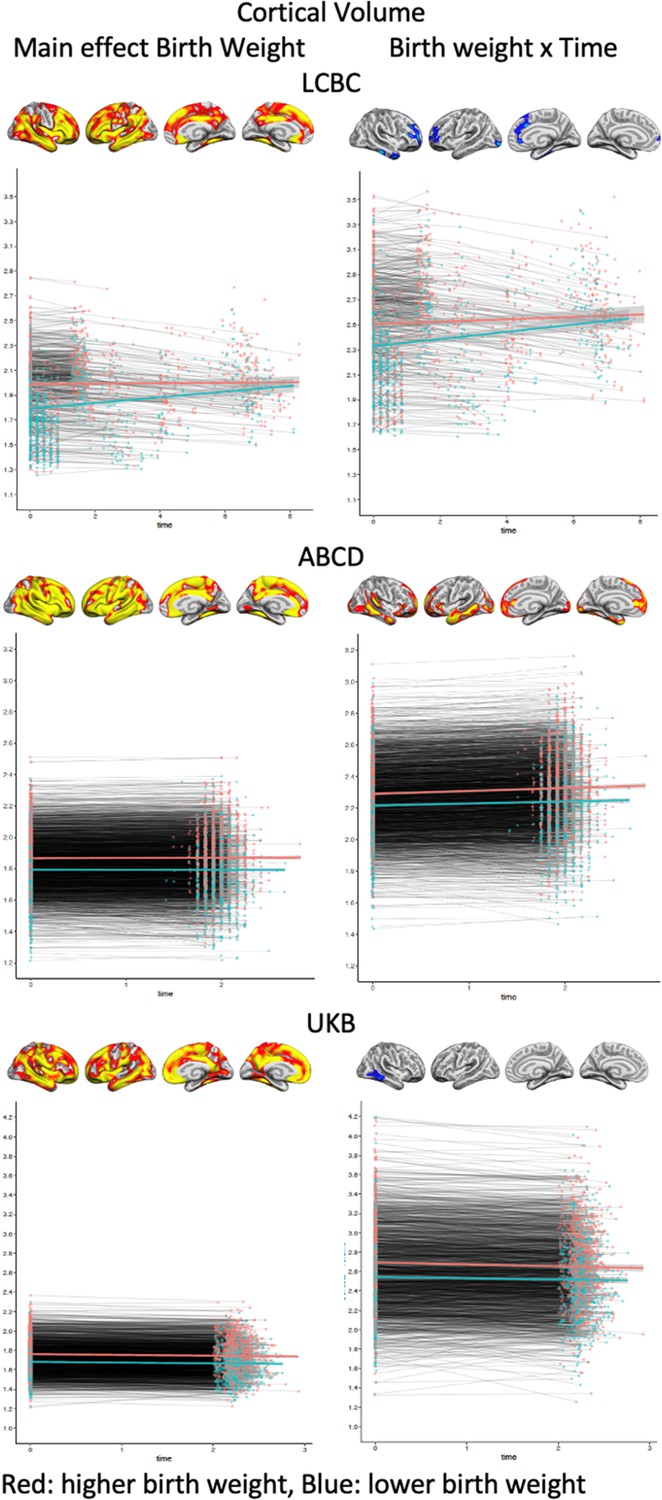
Plots showing individual data points and expected trajectories for cortical volume within the significant regions (refer to Figures 1 and 2) of each sample split into two based on birth weight (BW) (higher BW in red color = upper half, lower BW in blue color = lower half of BW distribution).
Y-axis: cortical thickness: mm; X-axis: time in years.
Figure 2—figure supplement 5
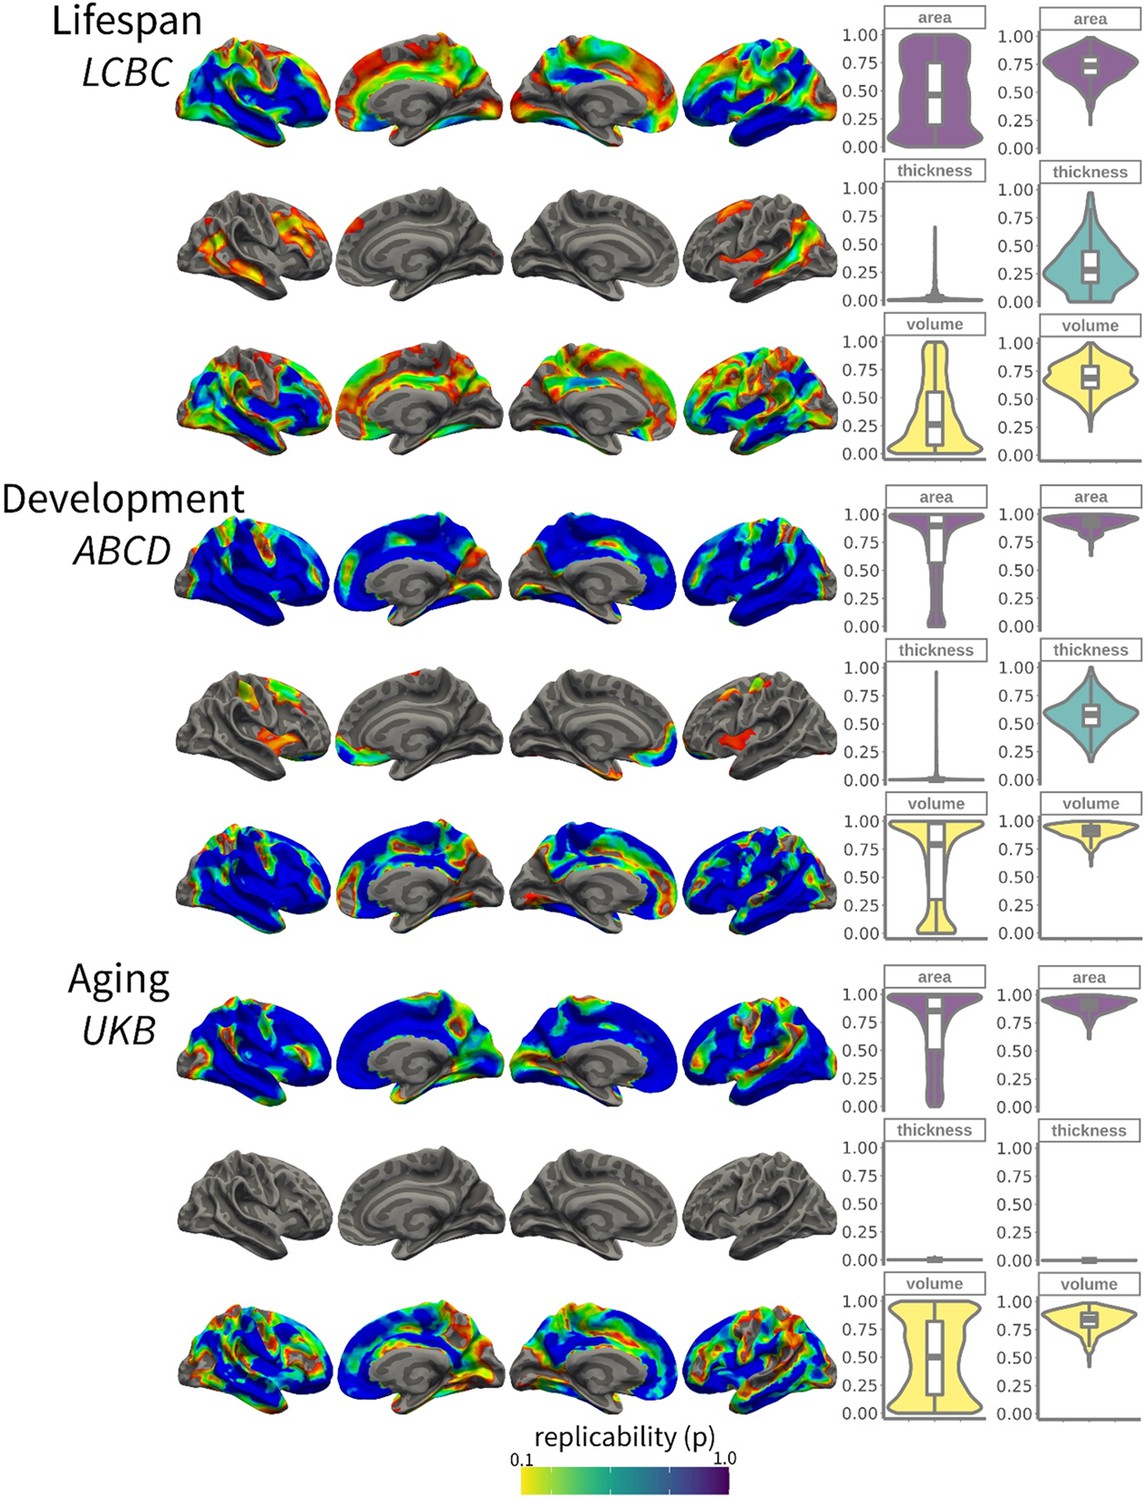
The degree of within-sample replicability of birth weight (BW) effects on cortical structure for Lifespan Changes in Brain and Cognition (LCBC), Adolescent Brain Cognitive Development (ABCD), and UK Biobank (UKB).
Brain images show the exploratory replicability analyses; that is, the proportion of results (refer to Figure 1) that are significant across different subsamples (50% of the original sample; |N| = 500 subsamples). The overlay is thresholded at replicability (p) = 0.1. For visual purposes, data has been upsampled and smoothed (full width half maximum, FWHM = 5) on fsaverage space. Left-side violin plots show the exploratory replicability; that is, the proportion of significant results across the different subsamples (unit = voxel). Right-side plots show the confirmatory replicability; that is, for each sample, the proportion of results (p<0.01; family wise error, FWE-corrected) that also pass significance criteria (p<0.05) in a test subsample (|N| = 500 subsamples) (unit = analysis). Embedded boxplots display median, interquartile range, and range.
Figure 2—figure supplement 6
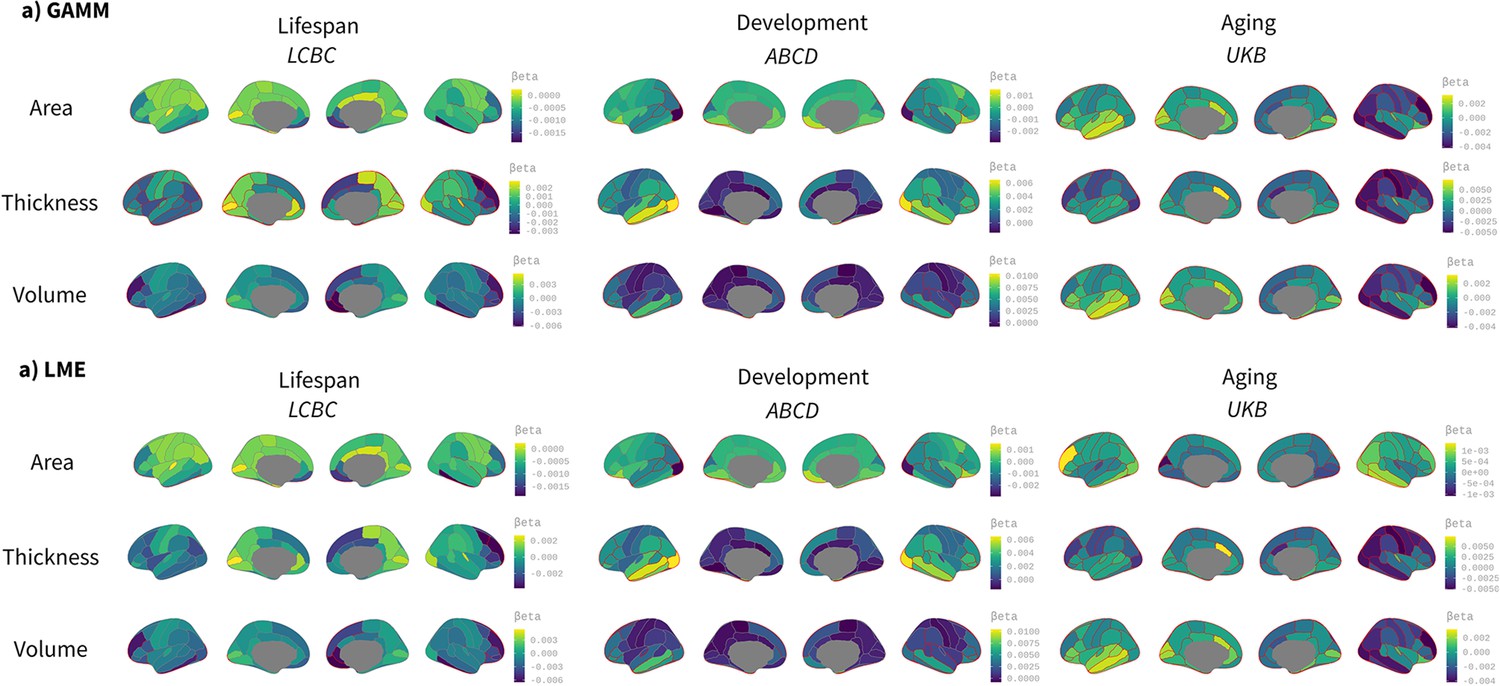
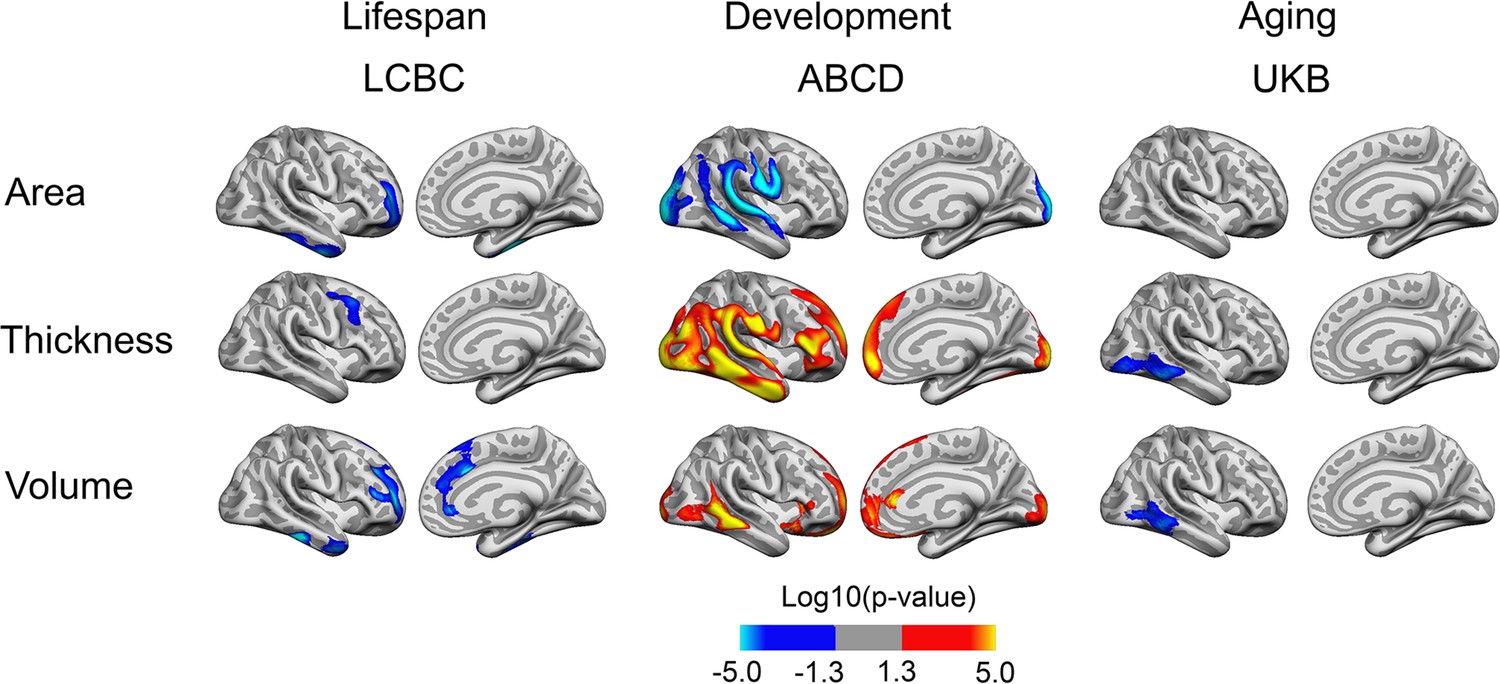
Comparison between spline (generalized additive mixed model [GAMM]) and linear (linear mixed model [LME]) models on the effect of birth weight on cortical change.
Age was fitted either as a smoothing spline using GAMM (mgcv r-package) or a linear regressor with an LME (lmer r-package) framework. The analyses were performed on ROI-based using the Desikan–Killiany atlas. Significance was considered at a FDR-corrected threshold of p<0.04. All the remaining parameters were comparable to the main analyses shown in Figure 1. The viridis-yellow scale represents the lower-higher beta regressors. Red contour displays regions showing significant effects of birth weight. Note the high correspondence with both fitting models. Differences are only noticeable in the Lifespan Changes in Brain and Cognition (LCBC) sample due to the datasets’ wider age range (i.e., lifespan dataset).
Figure 3 with 1 supplement
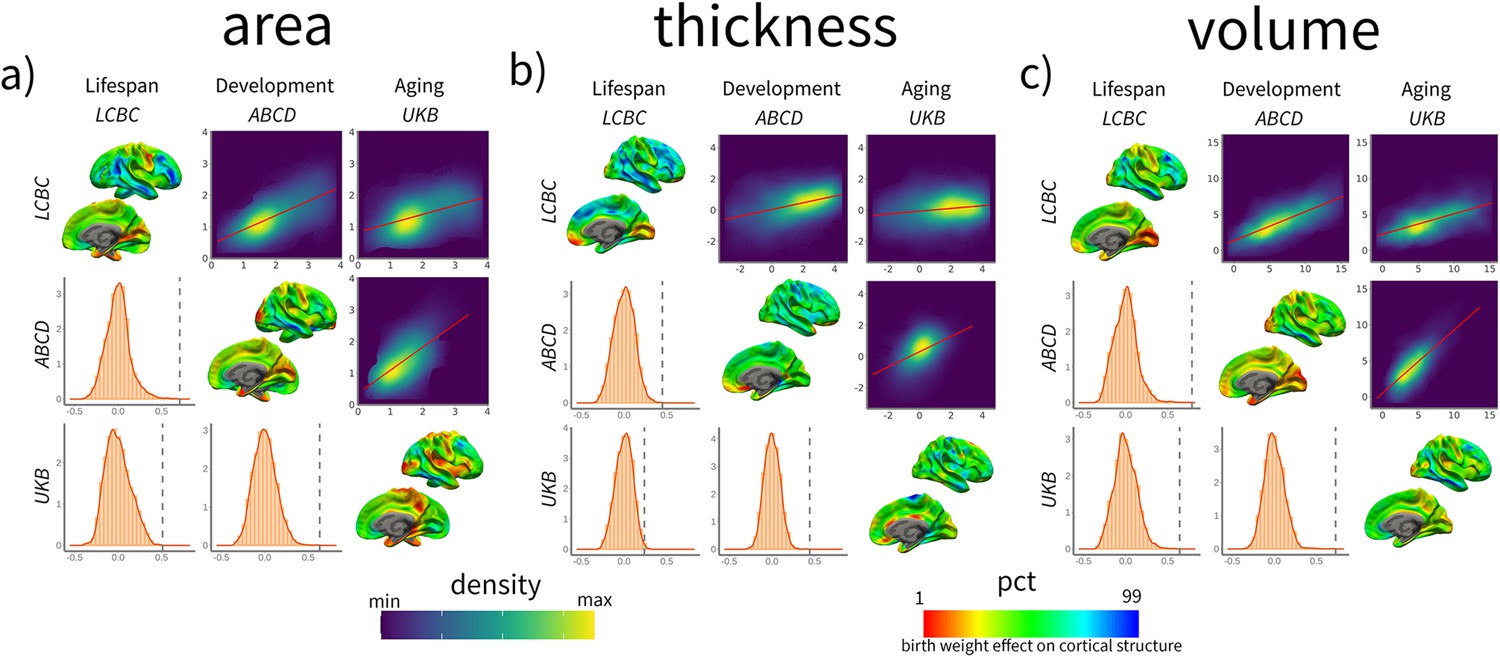
Spatial correlation of birth weight (BW) effects on brain structure across datasets for cortical (a) area, (b) thickness, and (c) volume.
Spatial correlation of BW effects on brain structure across datasets. For each panel, the upper triangular matrix shows Pearson’s (r) pairwise spatial correlation between the different cohorts’ cortical maps. Data is shown as a color-density plot. The red line represents the fitting between the two maps. The lower triangular matrix shows the significance testing. The dashed-gray line shows the empirical correlation, while the orange histogram represents the null distribution based on the spin test. The diagonal shows the effect of BW on cortical structure (right hemisphere shown only). Note that the βeta-maps are shown as a percentile red–green–blue scale, where red represents a lower (or more negative) effect of BW on cortical structure and vice versa. Units in the density maps represent BW effects as mm/g, mm2/g, and mm3/g (10e–5) for cortical thickness, area, and volume, respectively.
Figure 3—figure supplement 1
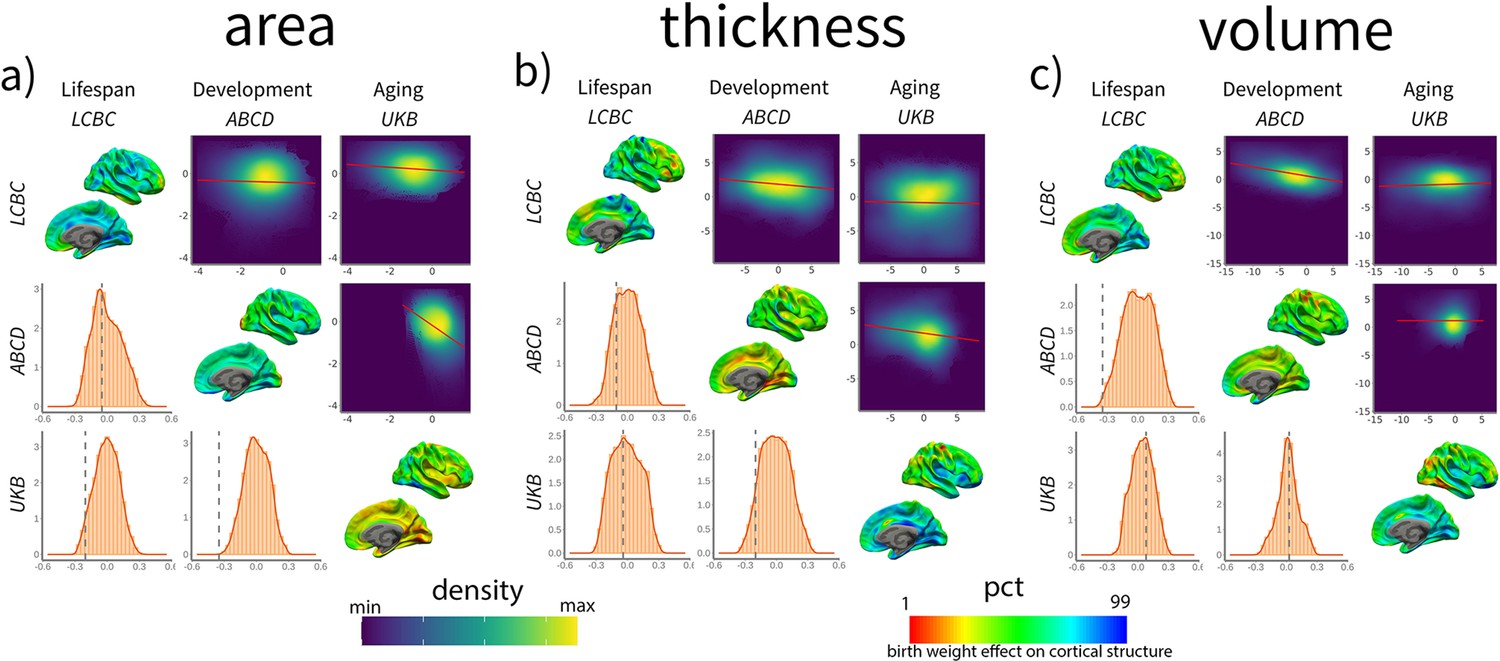
Spatial correlation of birth weight effects on brain structure change across datasets.
For each panel, the upper triangular matrix shows Pearson’s (r) pairwise spatial correlation between the different cohorts’ cortical maps. Data is shown as a color-density plot. The red line represents the fitting between the two maps. The lower triangular matrix shows the significance testing. The dashed-gray line shows the empirical correlation, while the orange histogram represents the null distribution based on the spin test. The diagonal shows the effect of birth weight on cortical structure (right hemisphere shown only). Note that the βeta-maps are shown as a percentile red–green–blue scale, where red represents a lower (or more negative) effect of birth weight on cortical structure and vice versa. See Supplementary file 1 for stats. The different panels show the spatial correlation of birth weight effects on cortical (a) area, (b) thickness, and (c) volume. Units in the density maps represent birth weight effects as mm/g, mm2/g, and mm3/g (10e-5) for cortical thickness, area, and volume, respectively.
Figure 4
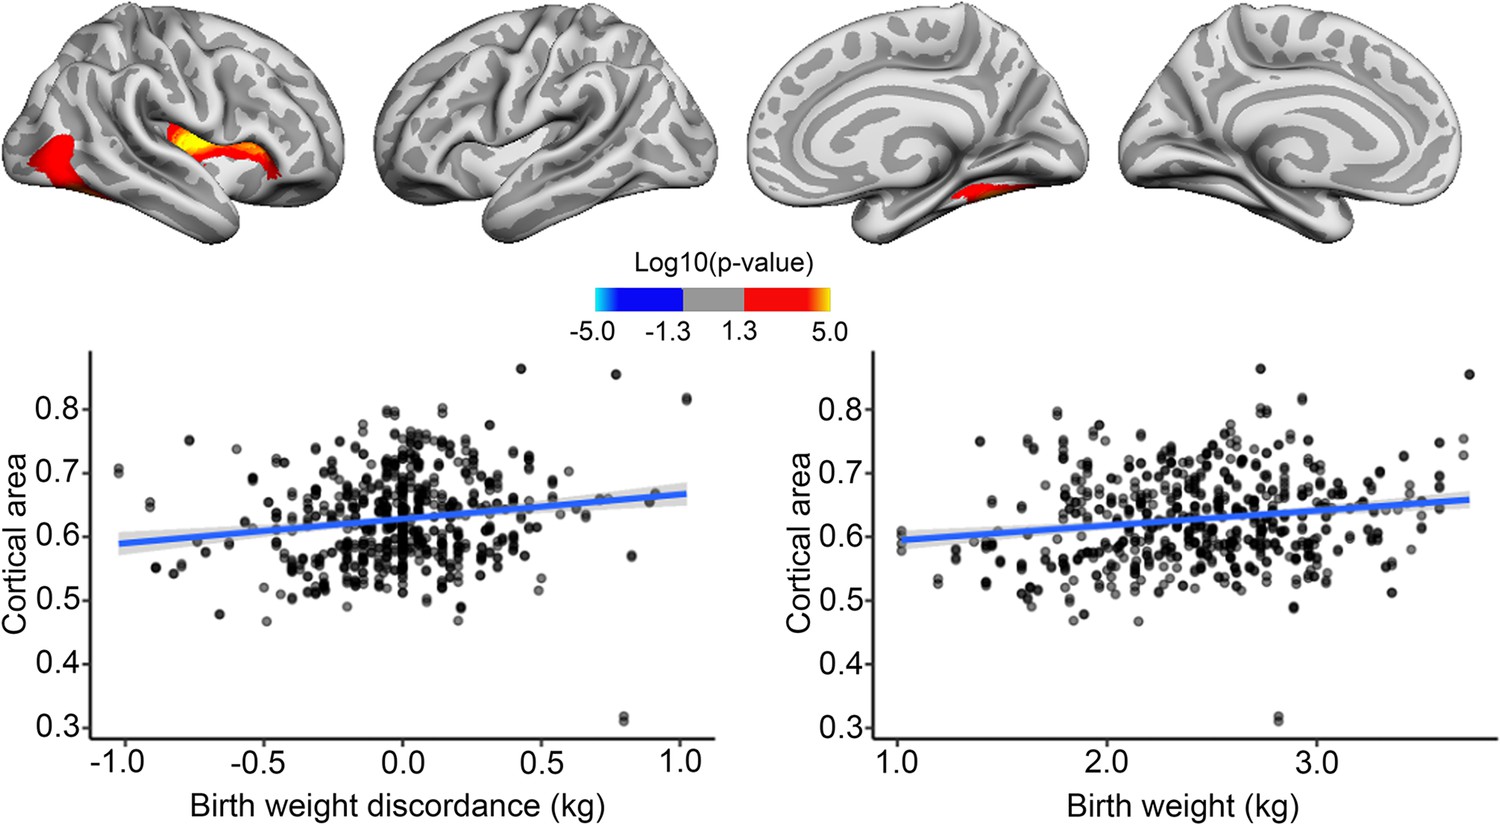
Effects of birth weight (BW) discordance on cortical area in the sample of monozygotic (MZ) twins.
Significant relationships are shown from left to right: lateral view, right and left hemisphere; and medial view, right and left hemisphere. Plots are showing – for illustrative purposes – individual data points and expected trajectories for cortical area in mm (Y-axis) within the significant regions according to BW discordance (left panel) and BW (right panel) in kilograms (X-axis).
Figure 5 with 1 supplement
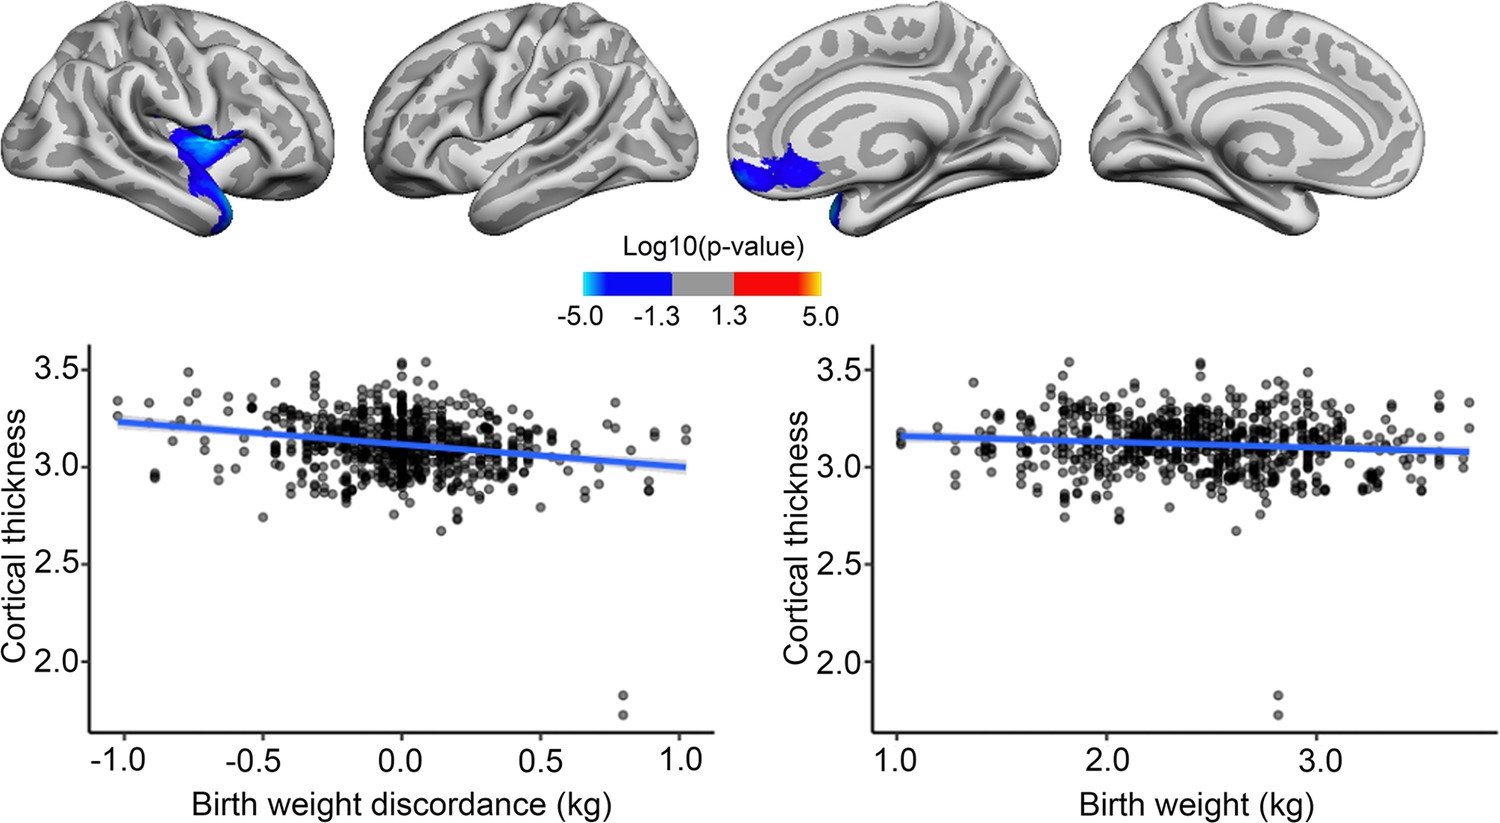
Effects of birth weight (BW) discordance on cortical thickness in the sample of monozygotic (MZ) twins.
Relationships significantly corrected with cluster-forming threshold of 2.0 (p<0.01) are shown from left to right: lateral view, right and left hemisphere; and medial view, right and left hemisphere. Plots are showing – for illustrative purposes – individual data points and expected trajectories for cortical thickness in mm (Y-axis) within the significant regions according to BW discordance (left panel) and BW (right panel) in kilograms (X-axis).
Figure 5—figure supplement 1
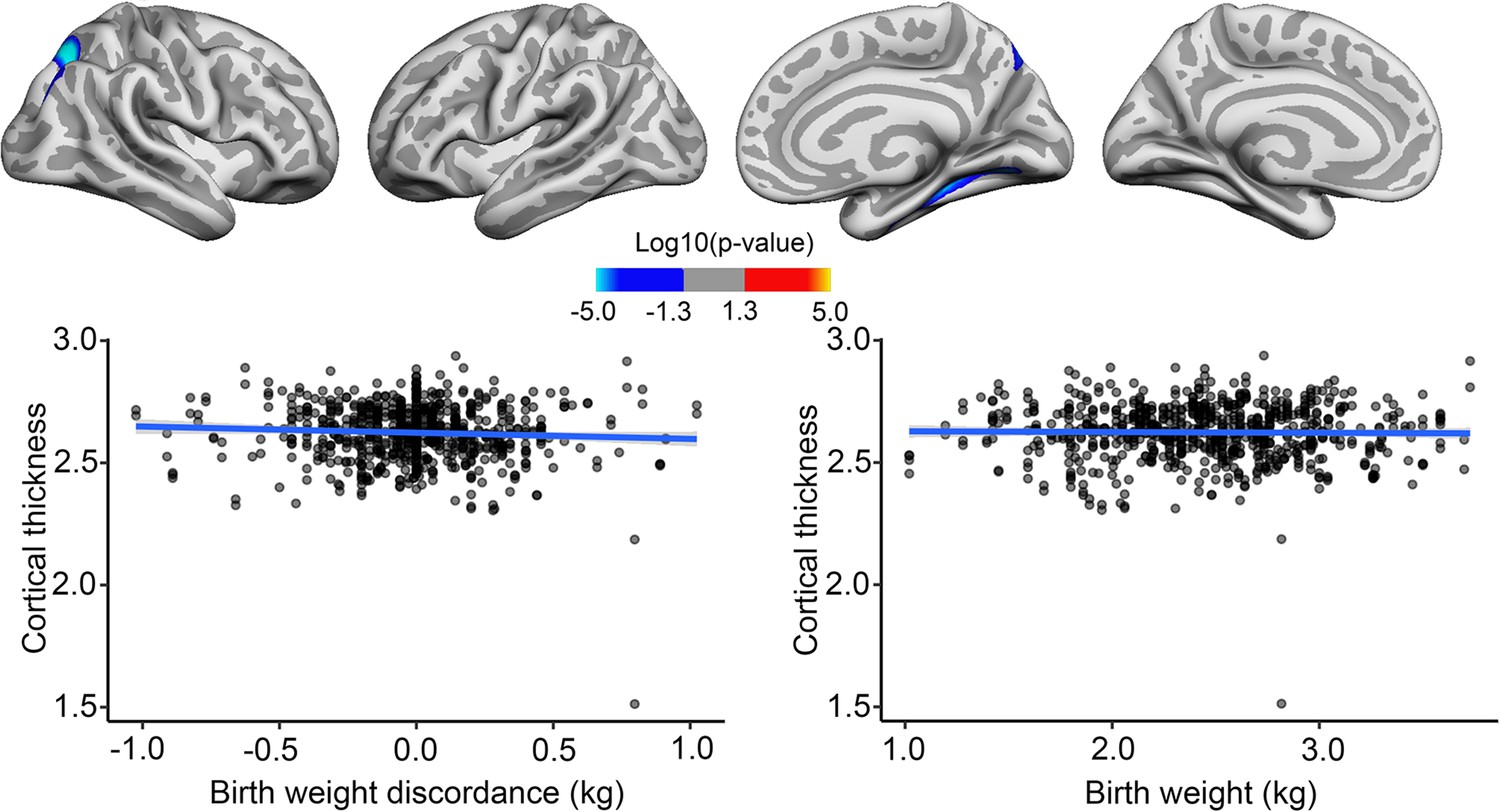
Interaction effects of birth weight (BW) discordance and time on cortical thickness in the sample of monozygotic (MZ) twins.
Significant relationships are shown from left to right: lateral view, right and left hemisphere; and medial view, right and left hemisphere. Plots showing individual data points and expected trajectories for cortical thickness in mm (Y-axis) within the significant regions according to BW discordance (left panel) and BW (right panel) in kilograms (X-axis).
Author response image 1
Tables
Table 1
Descriptive statistics for the longitudinal samples.
F = number of females in the sample, M = mean, SD = standard deviation; LCBC = Lifespan Changes in Brain and Cognition; ABCD = Adolescent Brain Cognitive Development; UKB = UK Biobank. Numbers are given in years for baseline age, time since baseline, and education, birth weight is given in kilograms. For LCBC, only 584 participants had information on education. Parental education was used in ABCD, and in LCBC when the participant was below 18 y of age, and also if no other education information was available for participants up to 21 y.
| Study | N | F | Scans | Baseline age | Time since baseline | Birth weight | Education | ||||||||
|---|---|---|---|---|---|---|---|---|---|---|---|---|---|---|---|
| M | SD | Range | M | SD | Range | M | SD | Range | M | SD | Range | ||||
| LCBC | 635 | 350 | 1922 | 19.1 | 20.7 | 4.1–81.9 | 2.6 | 2.4 | 0.1–8.3 | 3.5 | 0.6 | 0.9–6.0 | 17.1 | 2.4 | 9–24 |
| ABCD | 3324 | 1562 | 6648 | 10.0 | 0.6 | 8.9–11.1 | 2.0 | 0.1 | 1.4–2.8 | 3.2 | 0.7 | 1.0–6.7 | 16.0 | 2.6 | 6–21 |
| UKB | 1759 | 1009 | 3518 | 62.0 | 7.1 | 47–80.3 | 2.3 | 0.1 | 2.0–2.9 | 3.4 | 0.6 | 0.9–6.4 | 14.2 | 2.4 | 7–16 |
Table 2
MR acquisition parameters.
| Sample | Scanner | Field strength (T) | Acquisition parameters* |
|---|---|---|---|
| LCBC | Avanto Siemens | 1.5 | TR: 2400 ms, TE: 3.61 ms, TI: 1000 ms, flip angle: 8°, slice thickness: 1.2 mm, FoV: 240 × 240 mm, 160 slices, iPat = 2 |
| Avanto Siemens | 1.5 | TR: 2400 ms, TE = 3.79 ms, TI = 1000 ms, flip angle = 8°, slice thickness: 1.2 mm, FoV: 240 x 240 mm, 160 slices | |
| Skyra Siemens | 3.0 | TR: 2300 ms, TE: 2.98 ms, TI: 850 ms, flip angle: 8°, slice thickness: 1 mm, FoV: 256 × 256 mm, 176 slices | |
| Prisma Siemens | 3.0 | TR: 2400 ms, TE: 2.22 ms, TI: 1000 ms, flip angle: 8°, slice thickness: 0.8 mm, FoV: 240 × 256 mm, 208 slices, iPat = 2 | |
| ABCD | Prisma Siemens | 3.0 | TR: 2500 ms, TE: 2.88 ms, TI: 1060 ms, flip angle: 8°, slice thickness: 1 mm, FoV: 256 × 256 mm, 176 slices, parallel imaging = 2 |
| Achieva/ dStream/ Ingenia Phillips | 3.0 | TR: 6.31 ms, TE: 2.9 ms, TI: 1060 ms, flip angle: 8°, slice thickness: 1 mm, FoV: 256 × 240 mm, 225 slices, parallel imaging = 1.5 × 2.2 | |
| MR750/ DV25-26 GE | 3.0 | TR: 2500 ms, TE: 2 ms, TI: 1060 ms, flip angle: 8°, slice thickness: 1 mm, FoV: 256 × 256 mm, 208 slices, parallel imaging = 2× | |
| UKB | Skyra Siemens | 3.0 | TR: 2000 ms, TI: 880 ms, slice thickness: 1 mm, FoV: 208 × 256 mm, 256 slices, iPat = 2 |
-
TR = repetition time; TE = echo time; TI = inversion time; FoV = field of view; iPat = in-plane acceleration; GRAPPA = GRAPPA acceleration factor; LCBC = Lifespan Changes in Brain and Cognition; ABCD = Adolescent Brain Cognitive Development; UKB = UK Biobank.
-
*
Customized.
Additional files
-
MDAR checklist
- https://cdn.elifesciences.org/articles/86812/elife-86812-mdarchecklist1-v1.pdf
-
Supplementary file 1
Spatial correlation of birth weight effects on brain structure across datasets.
- https://cdn.elifesciences.org/articles/86812/elife-86812-supp1-v1.docx
-
Supplementary file 2
Exploratory and confirmatory replicability of birth weight on cortical change within datasets.
- https://cdn.elifesciences.org/articles/86812/elife-86812-supp2-v1.docx
-
Supplementary file 3
Exploratory and confirmatory replicability across datasets.
- https://cdn.elifesciences.org/articles/86812/elife-86812-supp3-v1.docx
Download links
A two-part list of links to download the article, or parts of the article, in various formats.
Downloads (link to download the article as PDF)
Open citations (links to open the citations from this article in various online reference manager services)
Cite this article (links to download the citations from this article in formats compatible with various reference manager tools)
Fetal influence on the human brain through the lifespan
eLife 12:RP86812.
https://doi.org/10.7554/eLife.86812.3


