Wandering albatrosses exert high take-off effort only when both wind and waves are gentle
- Atmosphere and Ocean Research Institute, The University of Tokyo, Japan
- Information and Technology Center, The University of Tokyo, Japan
- Graduate School of Environmental Studies, Nagoya University, Japan
- Centre d’Etudes Biologiques de Chize (CEBC), UMR 7372 CNRS, Université de La Rochelle, France
- Aeronautical Technology Directorate, Japan Aerospace Exploration Agency (JAXA), Japan
Figures
Figure 1
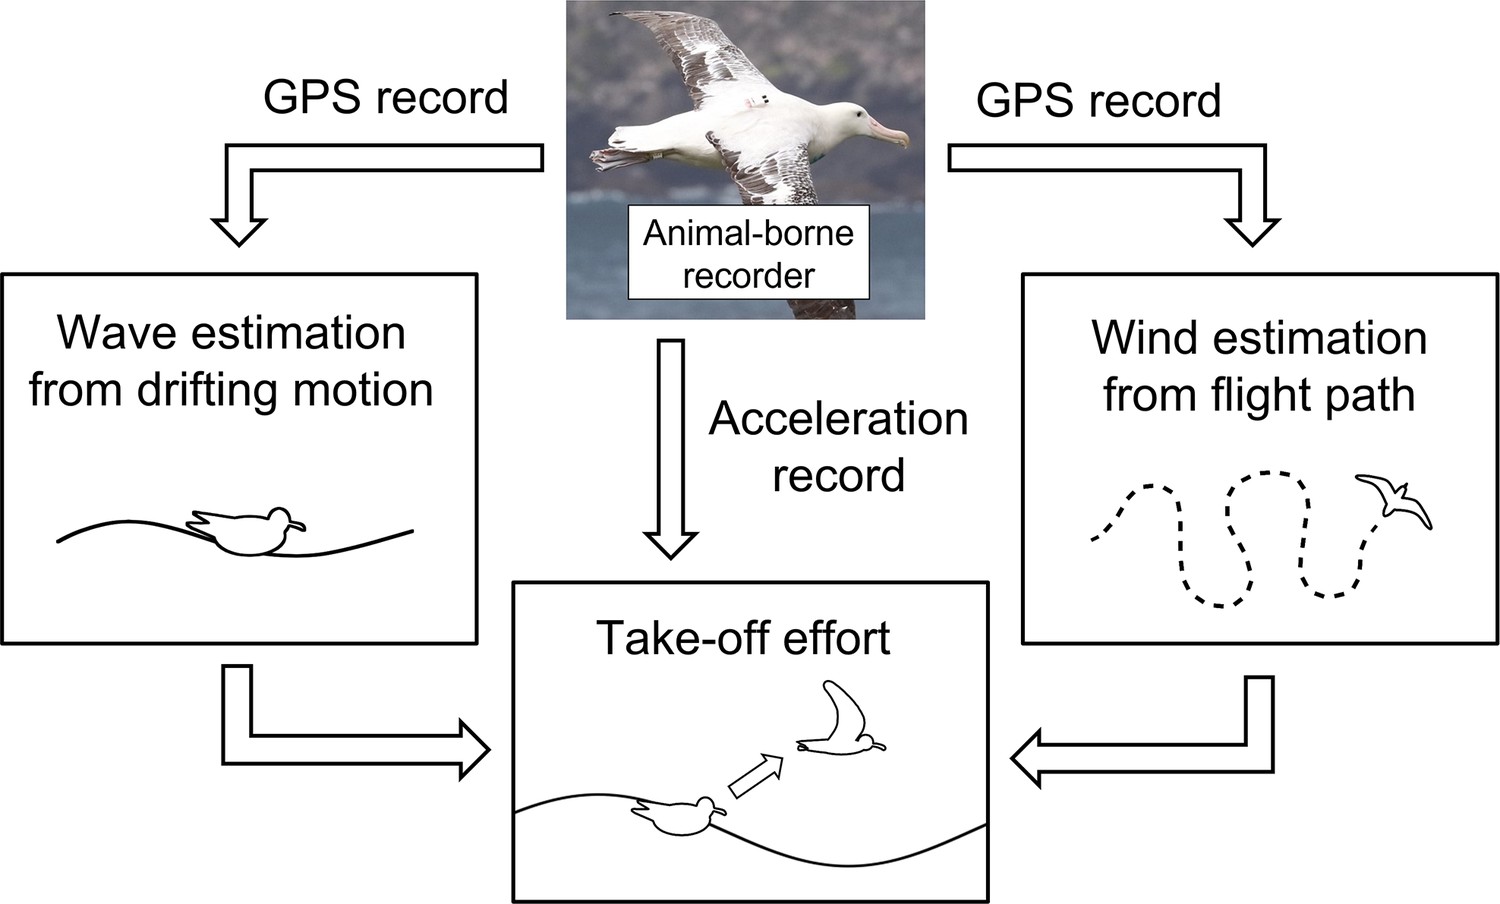
Conceptual framework of the study estimating environmental conditions experienced by studied individual.
Figure 2
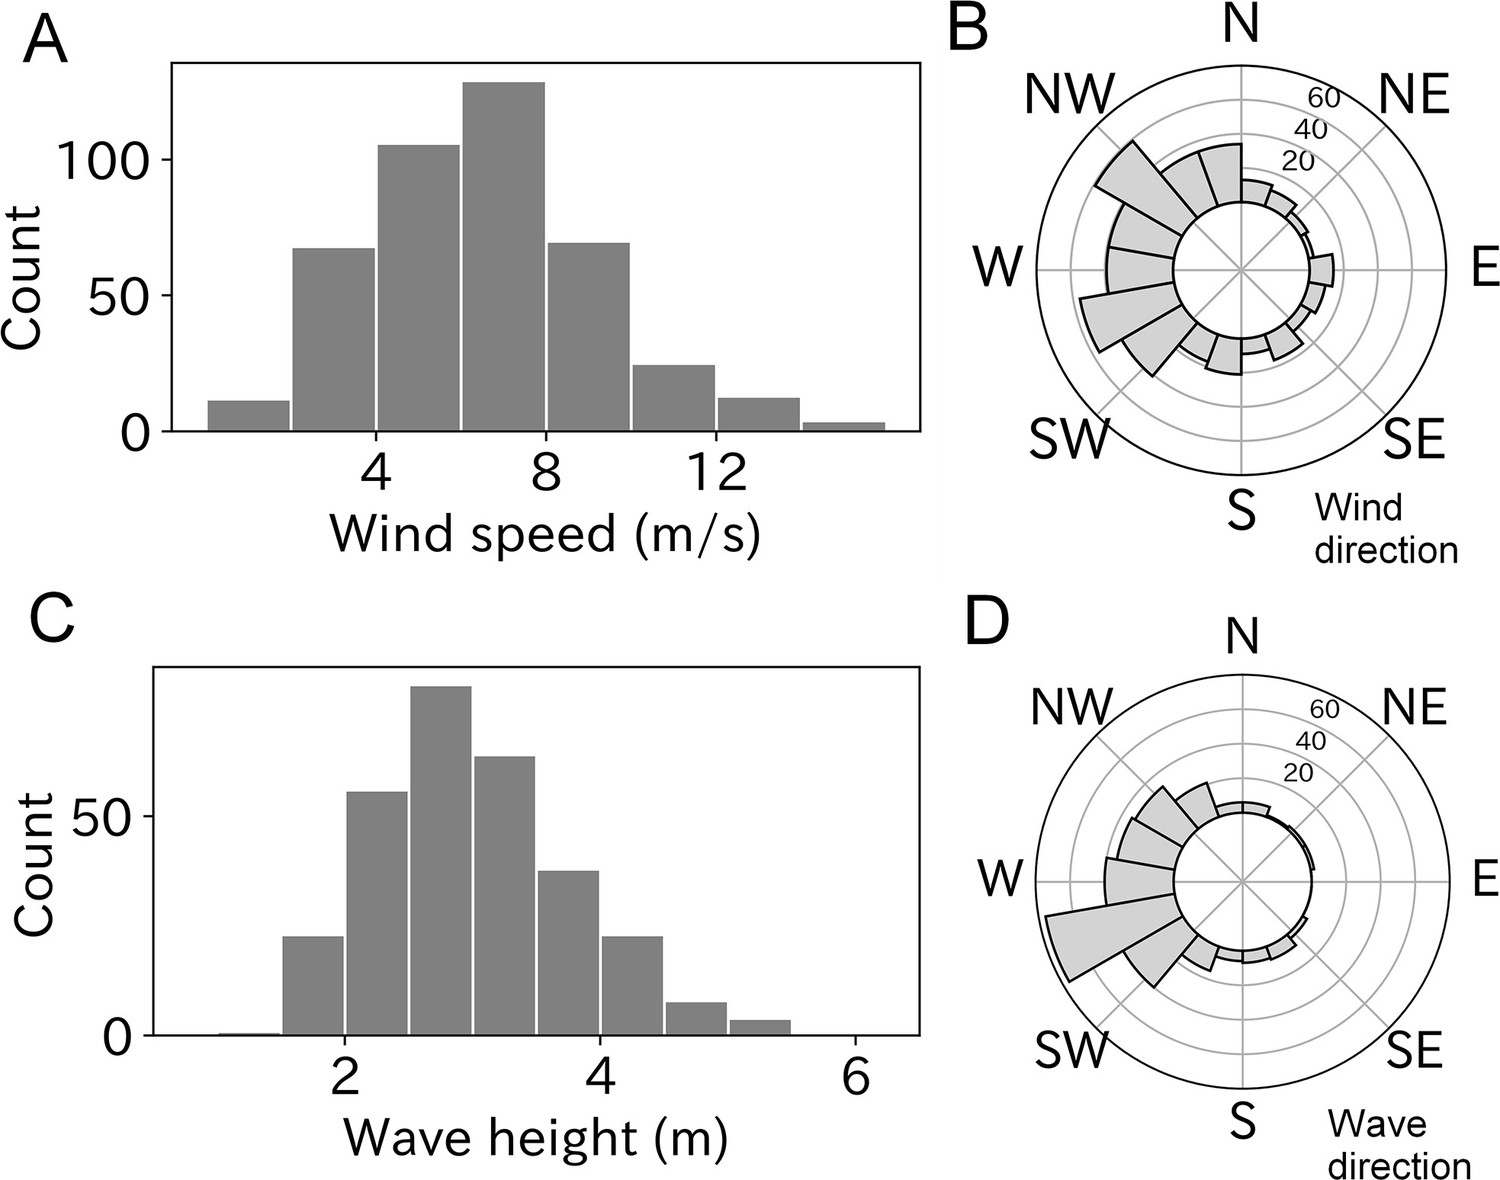
Wind and wave conditions experienced by taking-off wandering albatrosses.
(A, B) Histogram of windspeed and wind direction (n = 427). (C, D) Histogram of wave height and wave direction (n = 299).
Figure 3 with 2 supplements
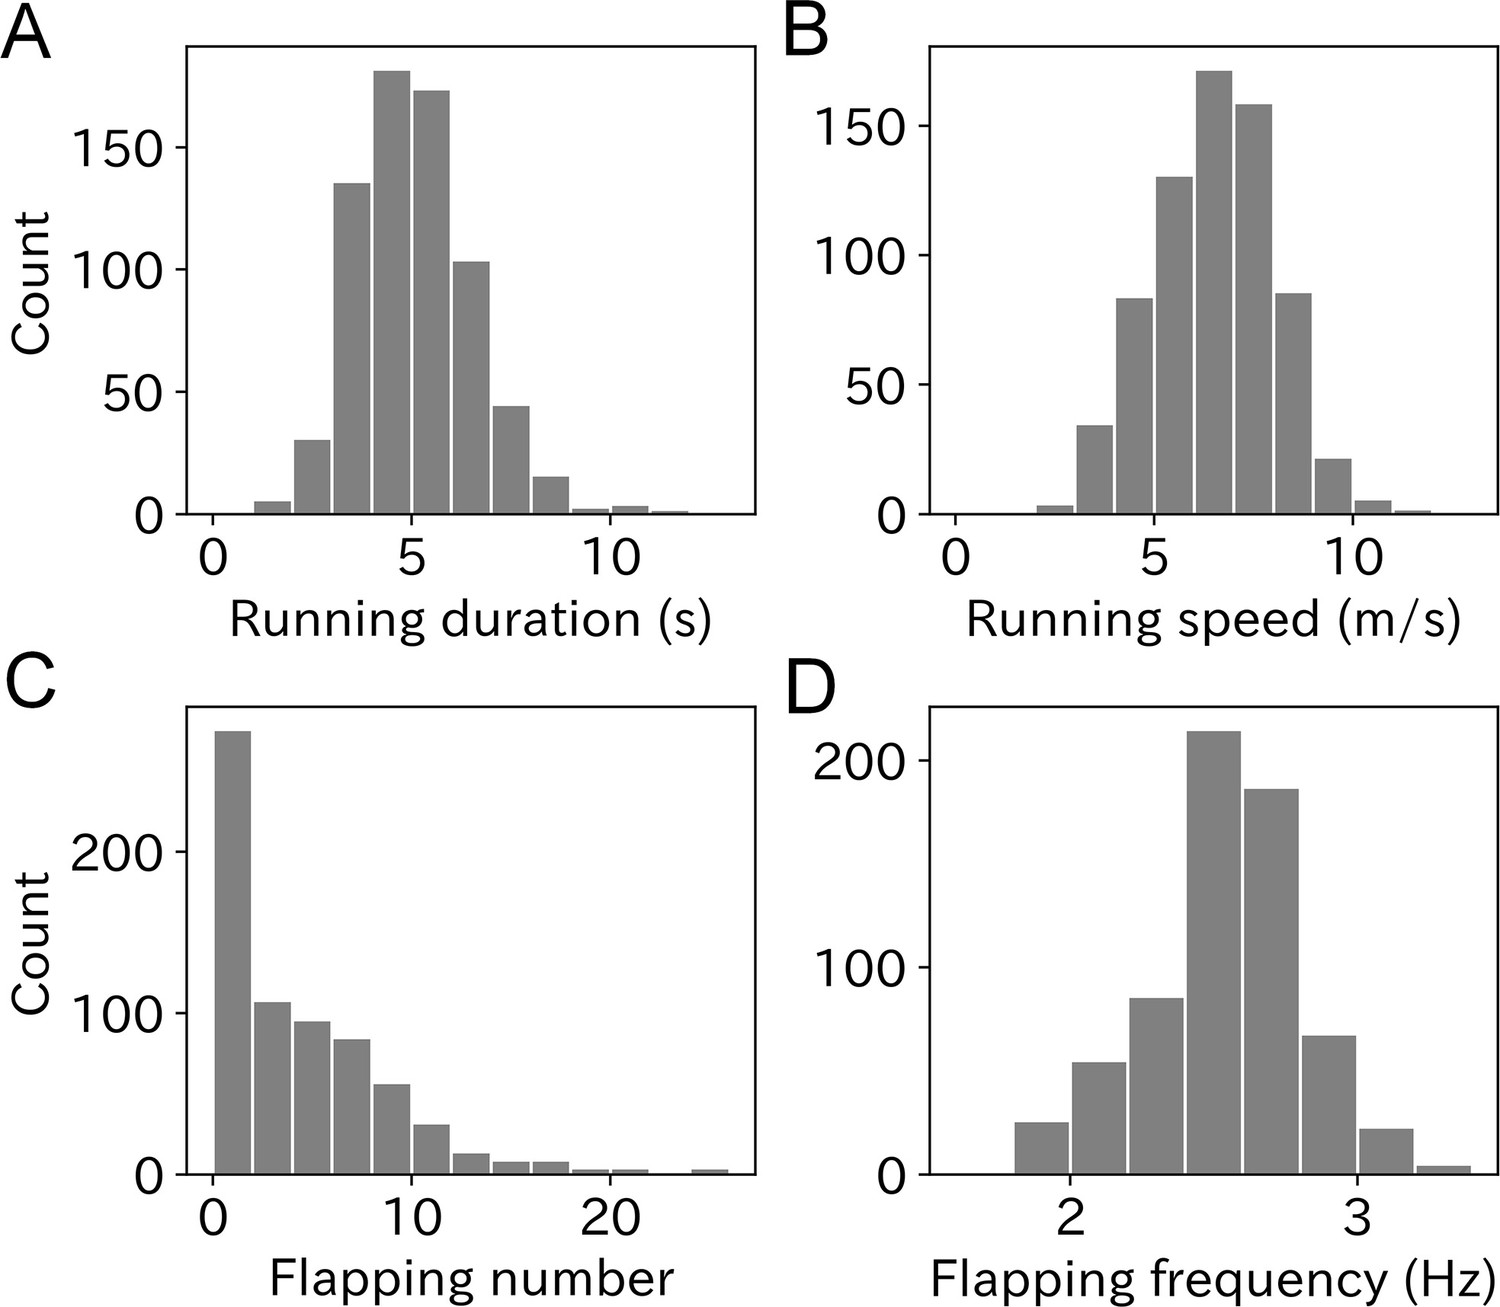
Histogram of (A) running duration, (B) running speed, (C) flapping number, and (D) flapping frequency.
Graphs A, B, and C are composed of 703 samples and graph D is composed of 669 samples.
Figure 3—figure supplement 1

Sexual difference of (A) running duration, (B) running speed, (C) flapping number, and (D) flapping frequency.
Sample numbers of each sex are 378 for male and 325 for female (361 and 301 for D).
Figure 3—figure supplement 2
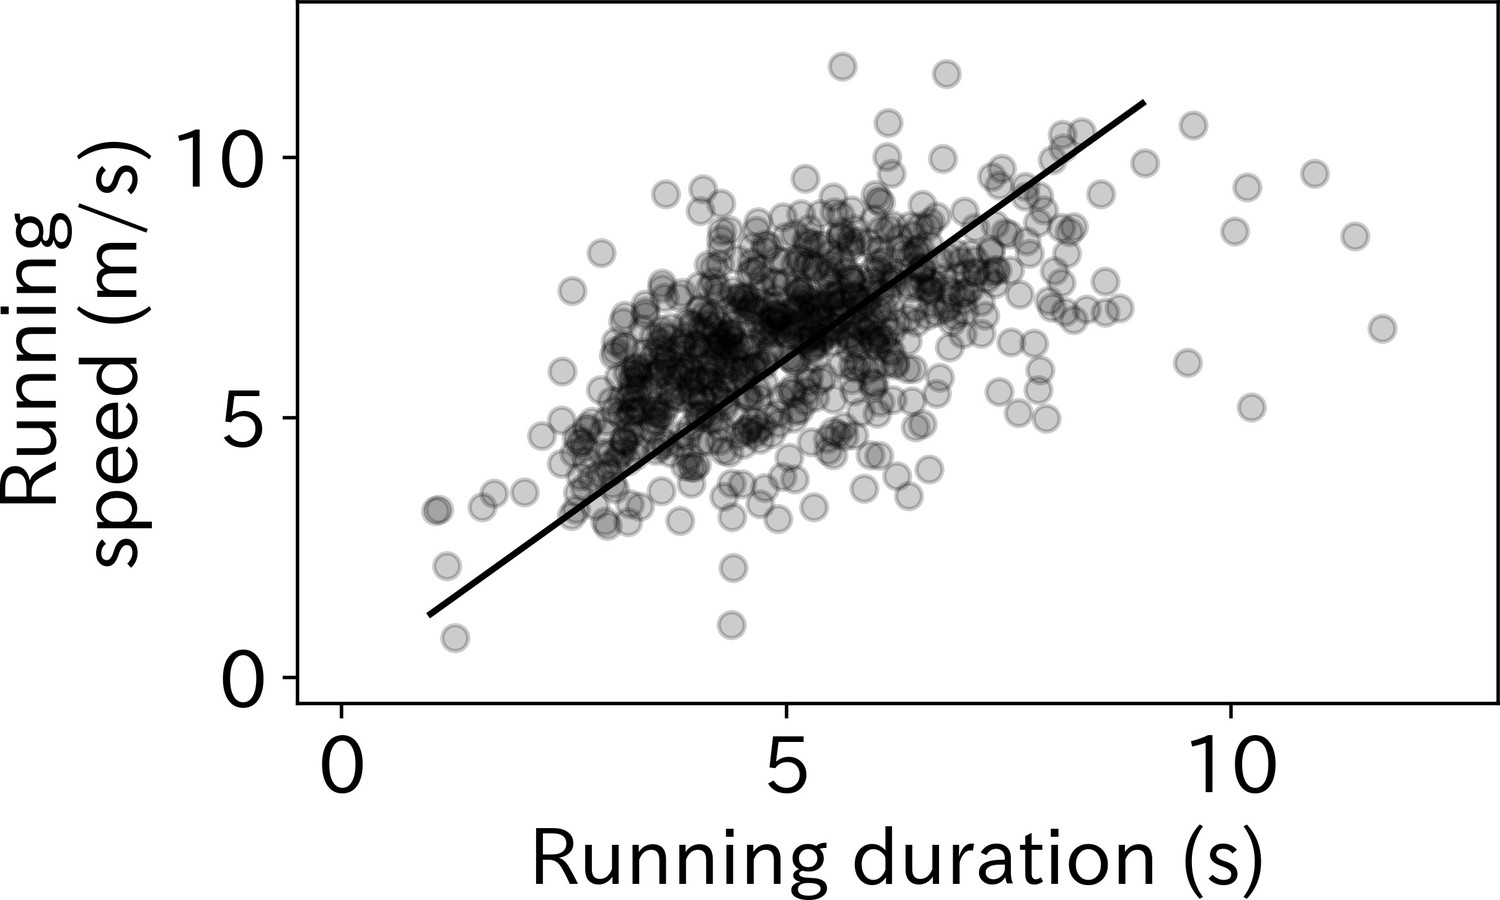
Running duration and running speed had significant correlation (r = 0.57, p < 0.01, n = 703).
Solid line shows the linear regression line determined from the linear mixed model (LMM). The slope value with a fixed slope of zero was 1.23.
Figure 4
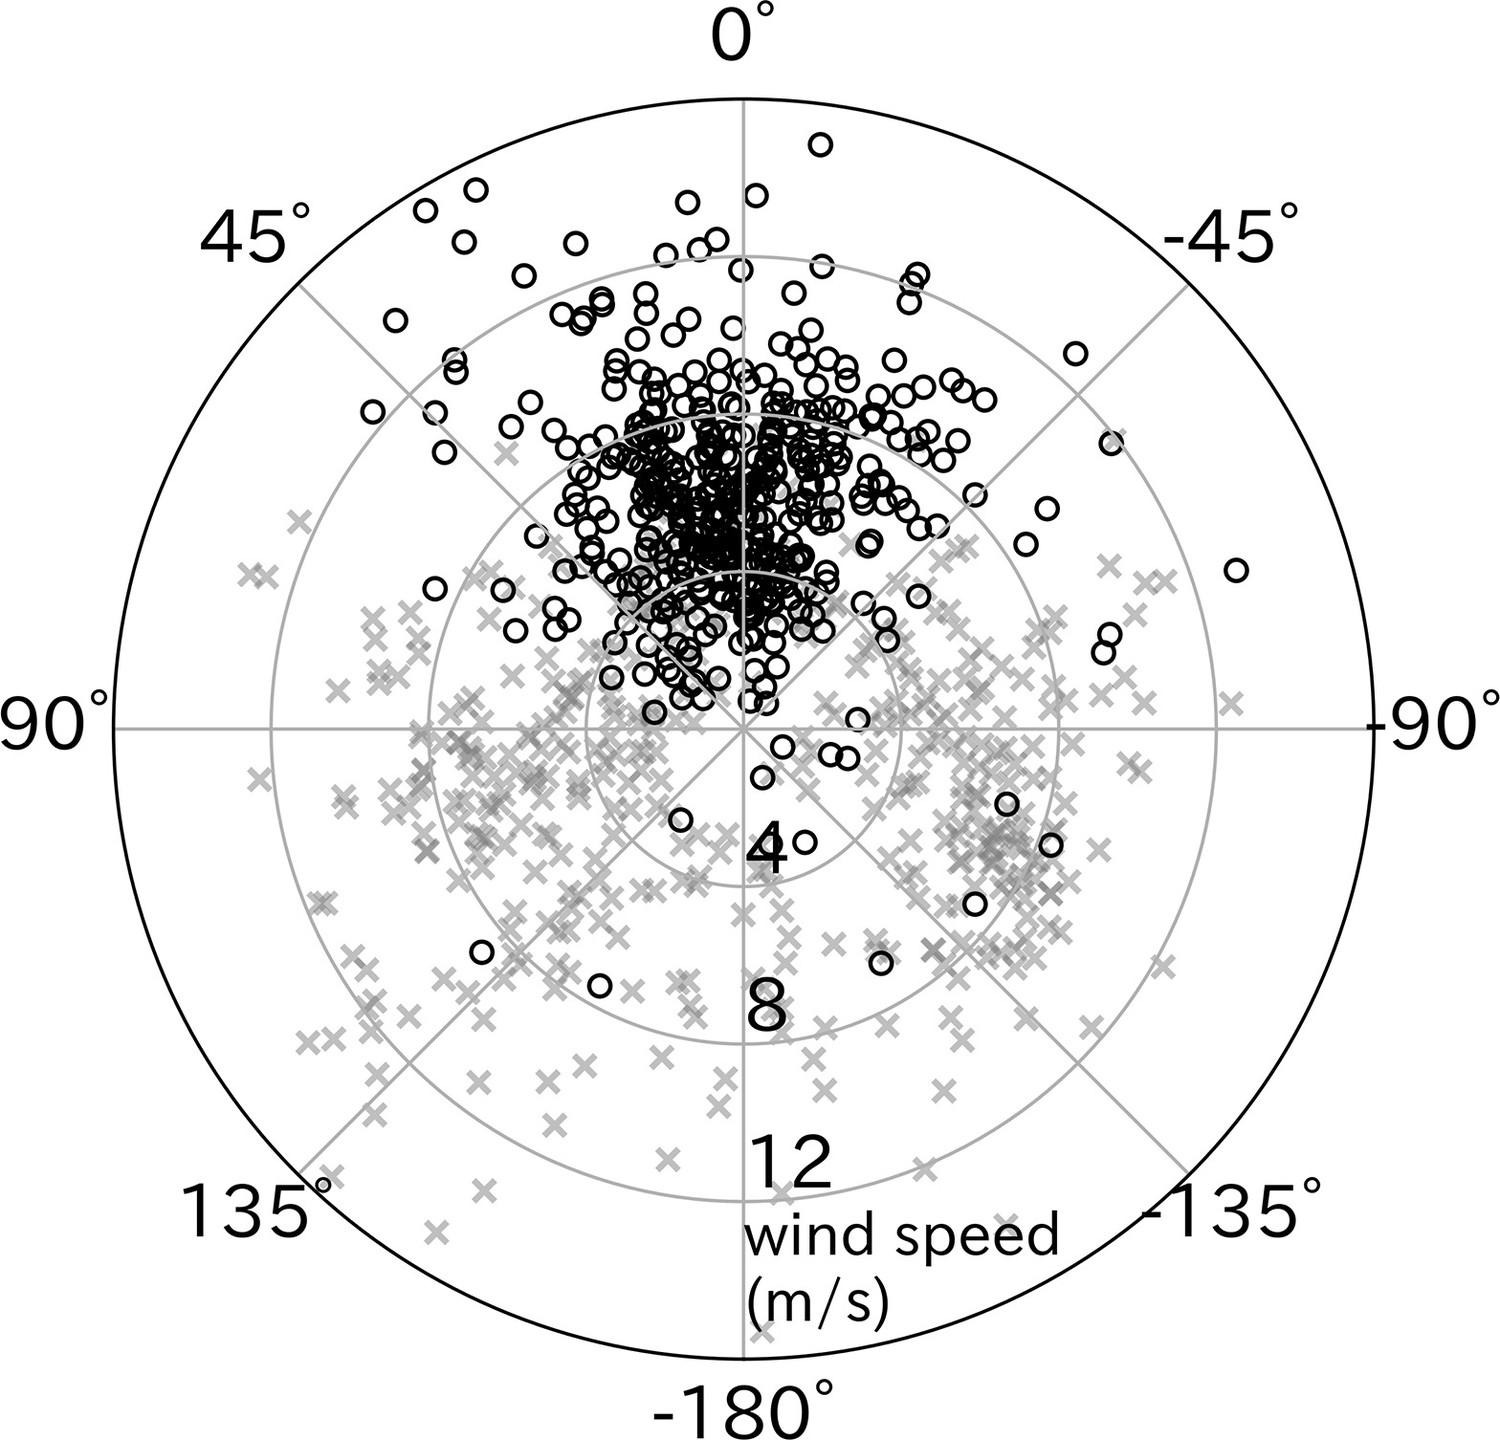
Effect of wind direction on wandering albatross take-off.
Relative take-off direction to wind direction (black circles, n = 427) significantly distributed around 0° (headwind), in contrast to cruising direction relative to the wind (gray x-mark, n = 427). The radial axis represents the wind speed.
Figure 5
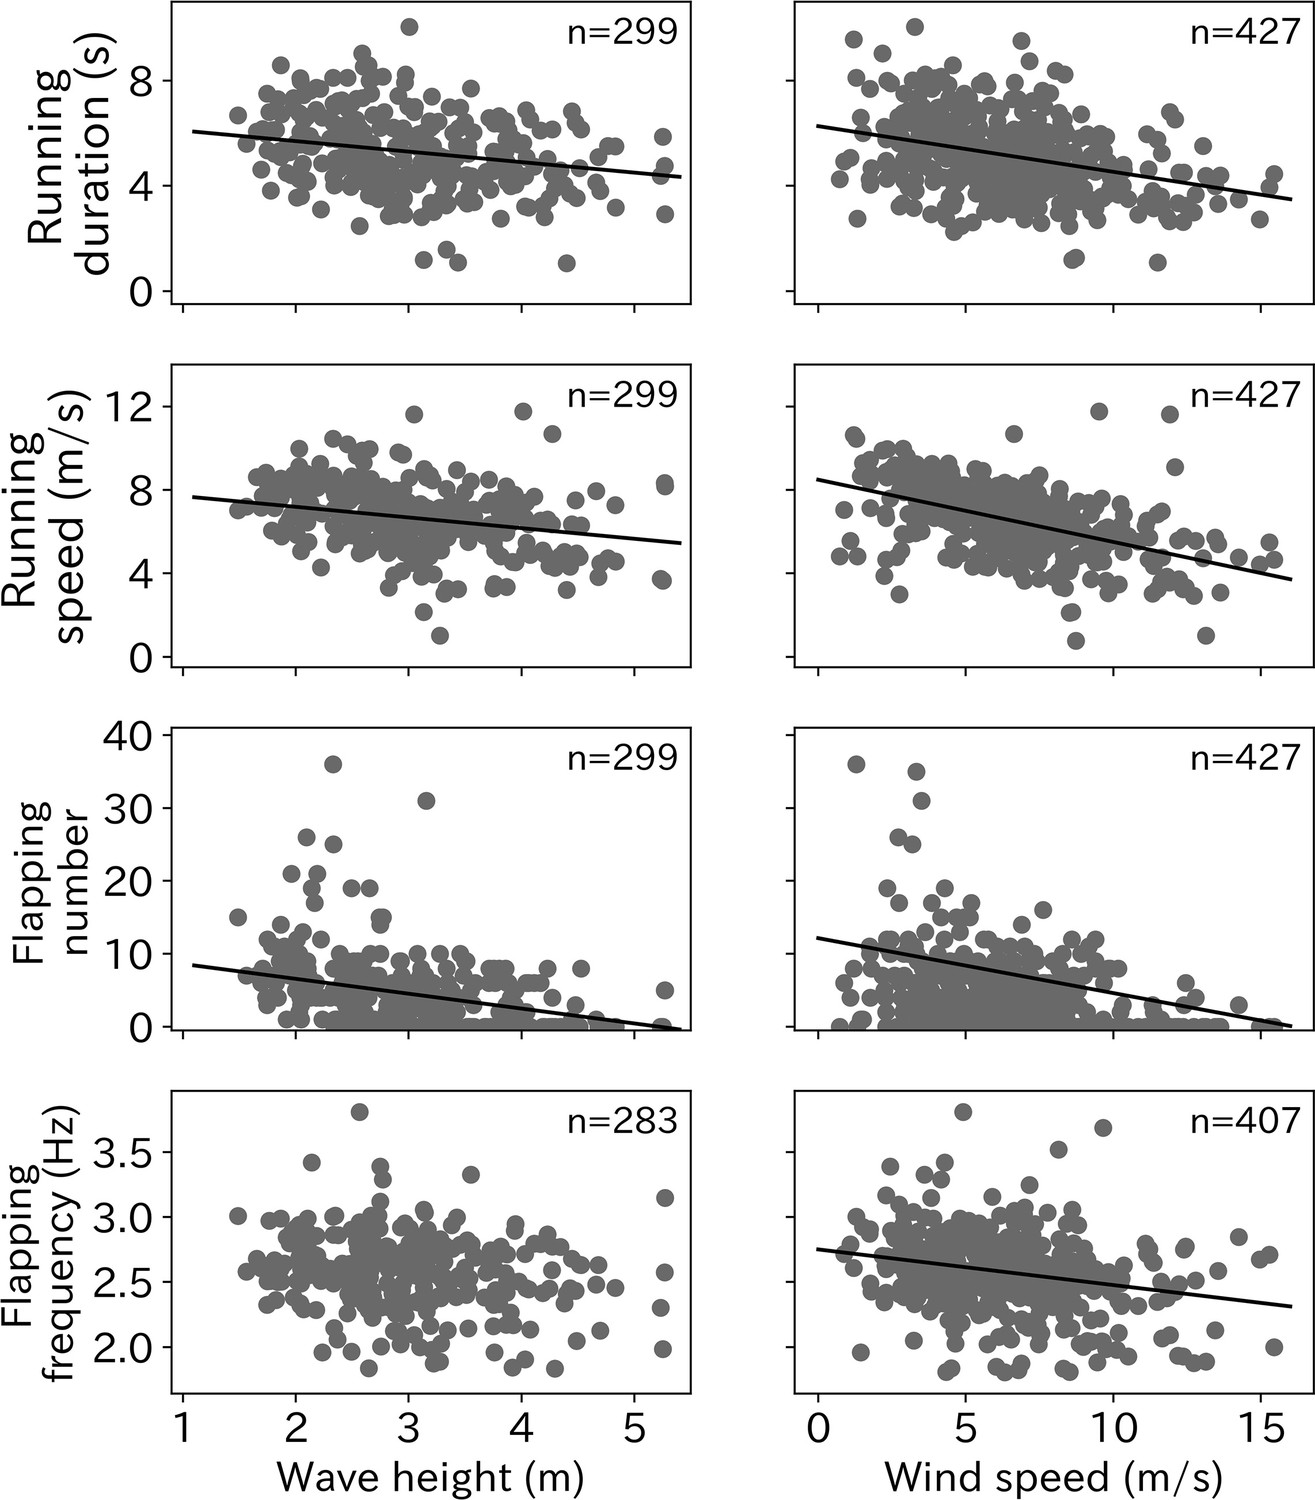
Environmental effect on take-off.
Effort for the take-off (running duration, running speed, flapping number, and flapping frequency) significantly decreased as wave height and wind speed increased (p < 0.01) except the relationship between flapping frequency and wave height (p = 0.026). Solid line shows the linear regression line determined from the LMM and the number at the right top corner on each graph shows the sample sizes.
Figure 6 with 1 supplement
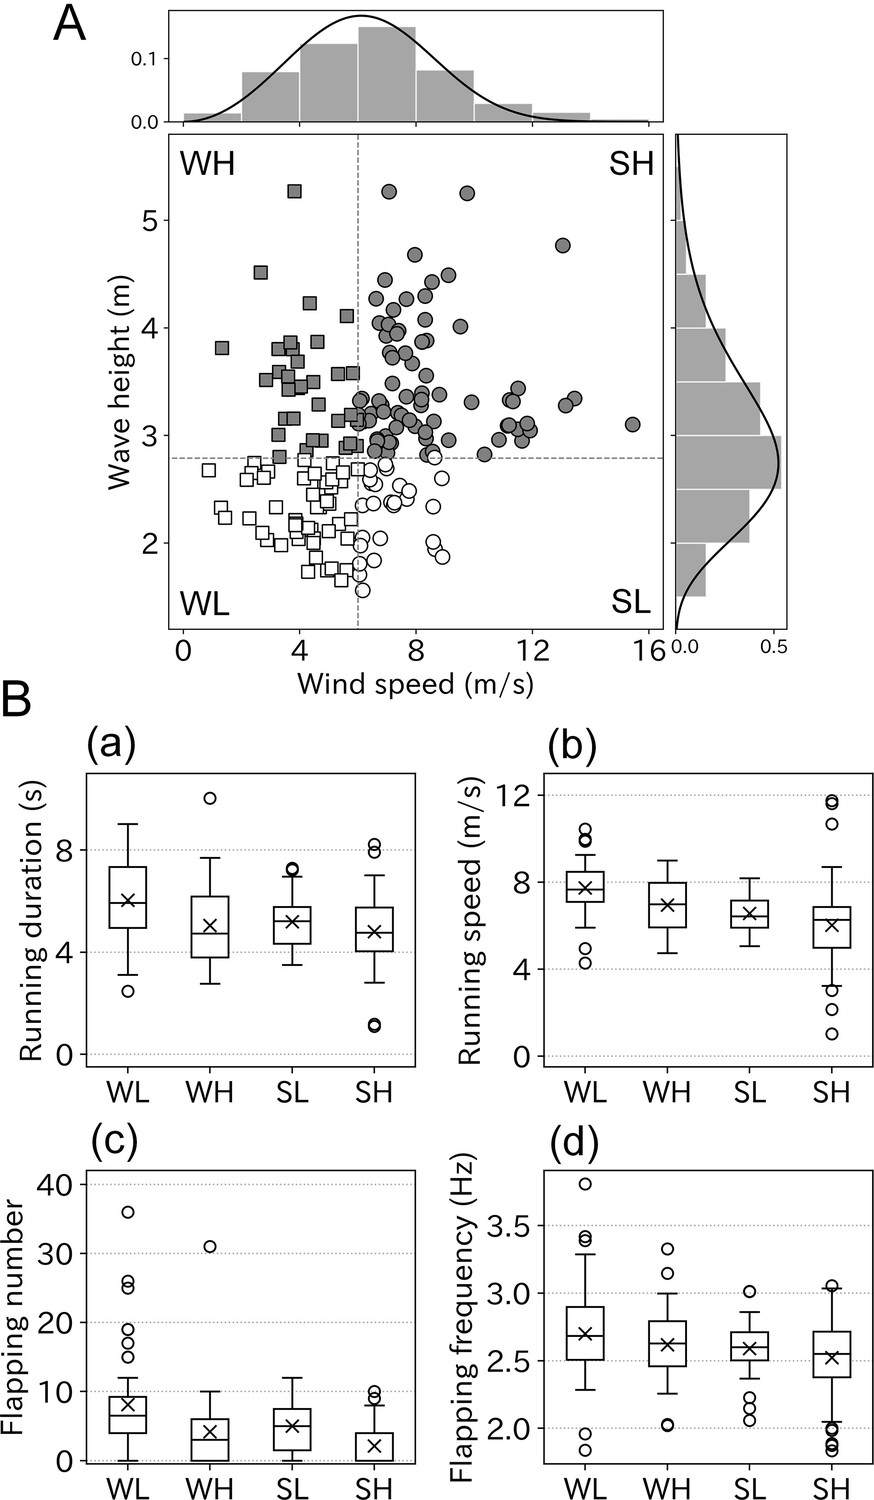
Take-off conditions divided into four environmental categories.
(A) Correlation between wind speed and wave height was weak (r = 0.27, n = 185). Bar charts and solid lines written above and right of the scatter plot are normed histograms of wind speed, wave height, and curve fitted lines. Based on the peak value of fitted lines scatter plots were divided into four categories, WL: weak wind low wave (open square, n = 48), WH: weak wind high wave (filled square, n = 33), SL: strong wind low wave (open circle, n = 27), and SH: strong wind high wave (filled circle, n = 77). (B) Take-off effort comparison among four categories (a: running duration, b: running speed, c: flapping number, and d: flapping frequency). Cross mark indicates the mean value.
Figure 6—figure supplement 1

Take-off effort (gray scale) in relation to wind speed and wave height.
(A) Running duration, (B) running speed, (C) flapping number, and (D) flapping frequency are shown in the gray scale corresponding to the wind speed (x-axis) and wave height (y-axis). Darker color indicates the more effort demanded for the take-off, which tends to appear in left bottom area of the graphs (weaker wind speed and lower wave height condition) for running duration, running speed, and flapping number.
Figure 7
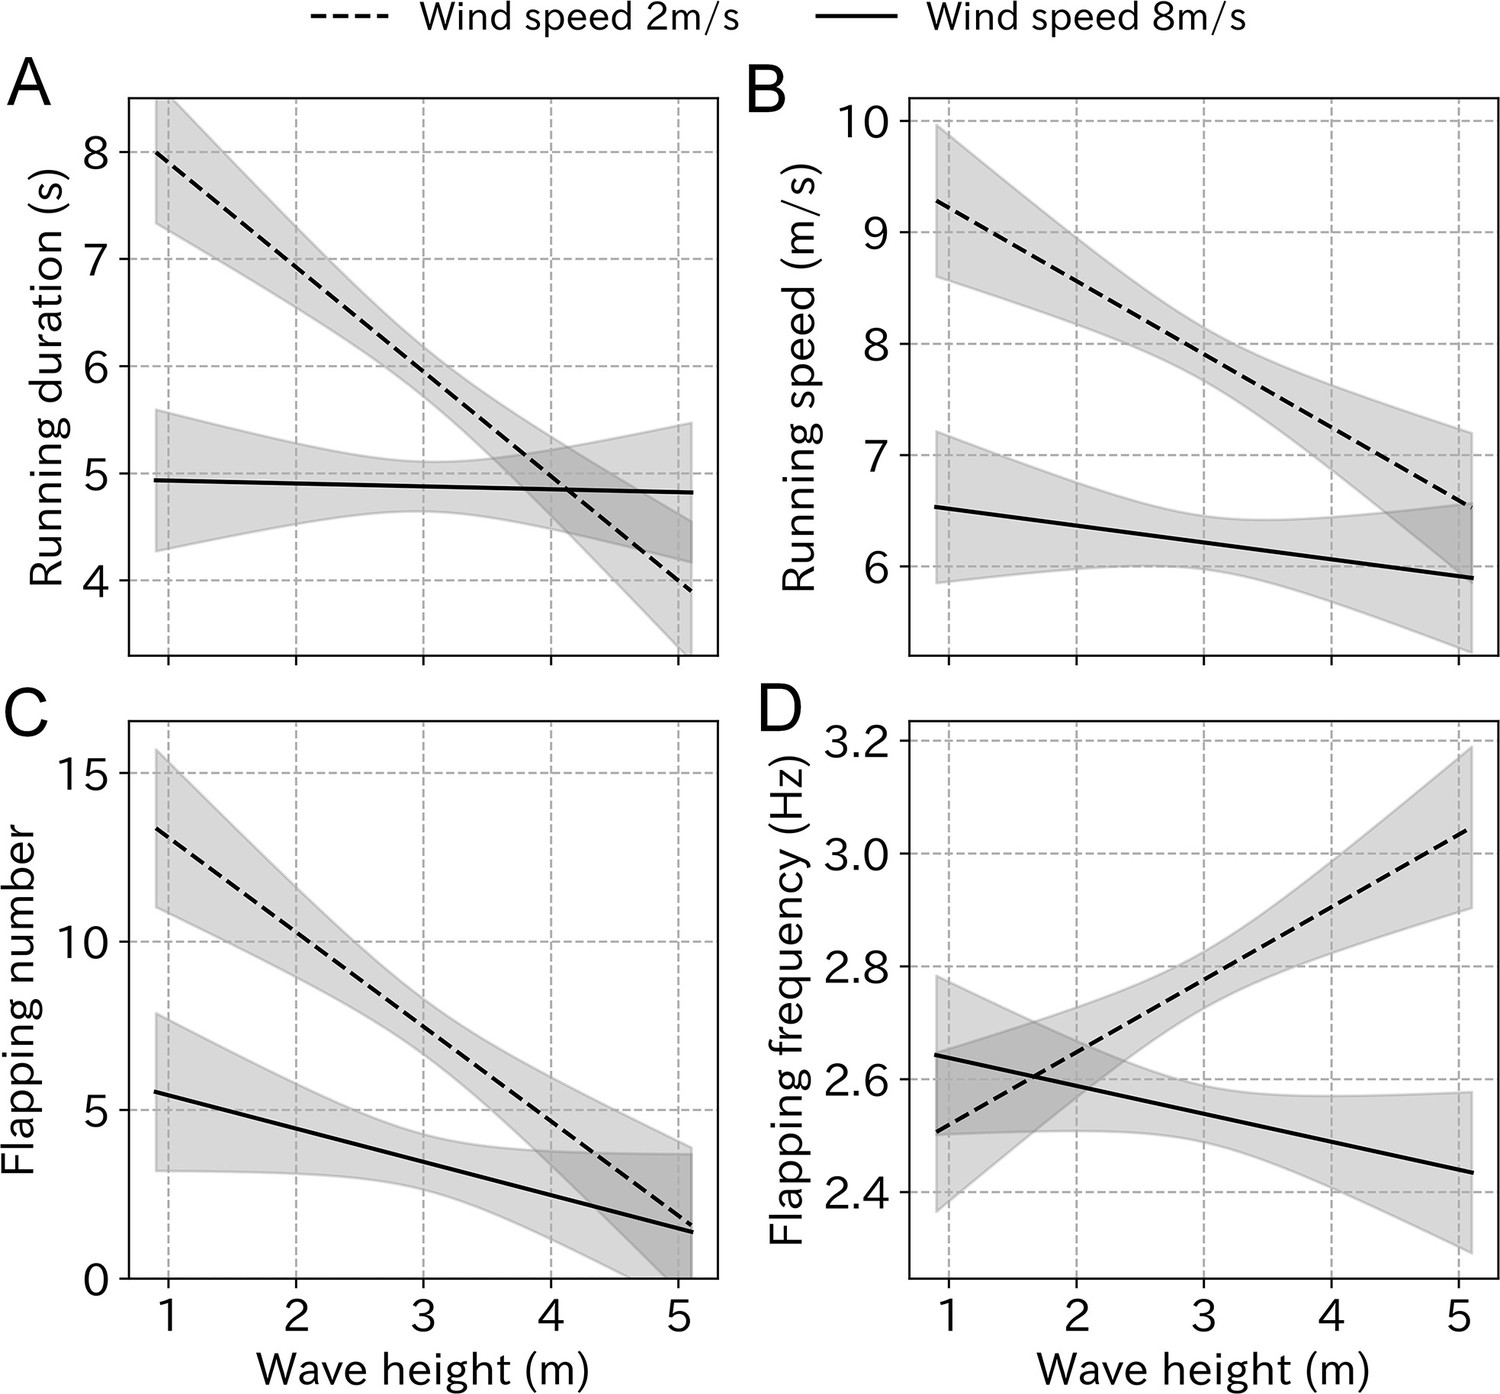
Take-off effort simulation using the estimated coefficient from LMM.
(A) Running duration, (B) running speed, (C) flapping number, and (D) flapping frequency in response to the wave height change under weak wind (dashed line, 2 m/s) and strong wind (solid line, 8 m/s) conditions estimated from the LMM. Gray area represents 99% CI.
Figure 8
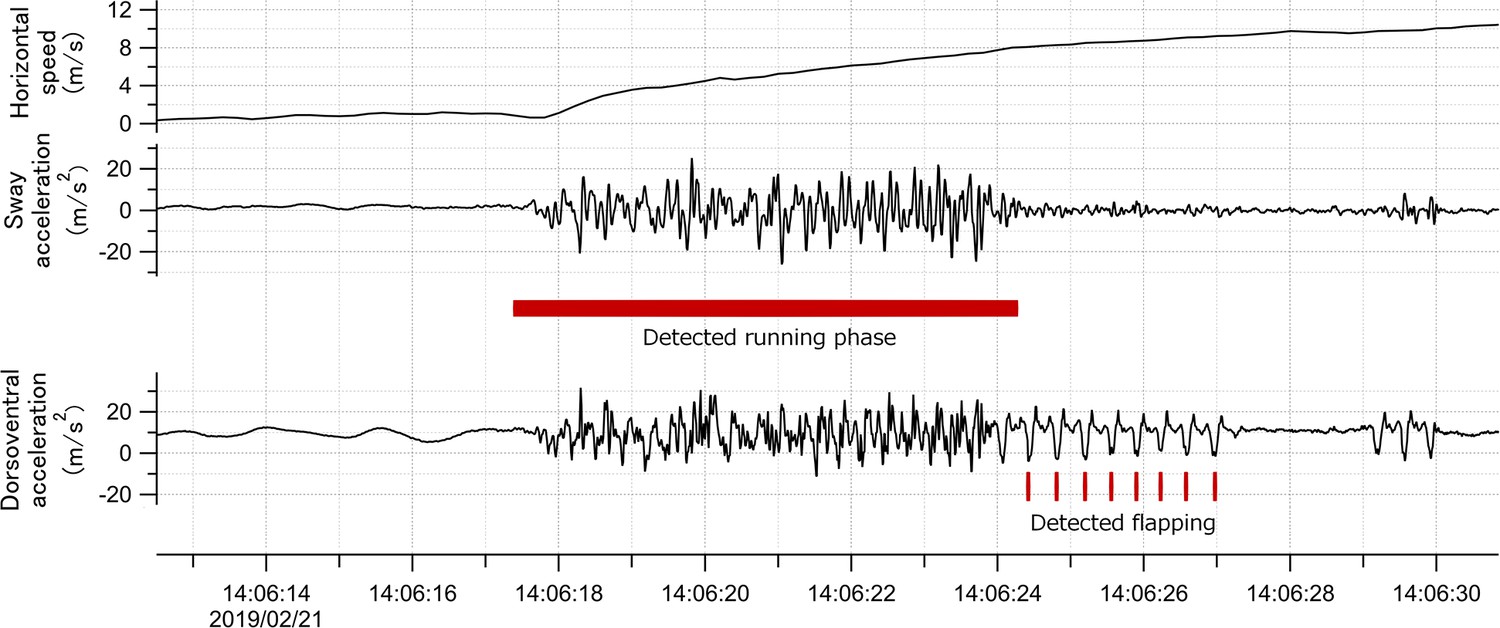
Time series data of horizontal speed (top), lateral acceleration (middle), and dorsoventral acceleration (bottom) signals of the wandering albatross at the moment of take-off.
Horizontal speed starts increasing from the beginning of the take-off. Red square shows the detected running phase based on the variance of the lateral acceleration signal. Red bars show the detected flapping behavior after the running phase based on the dorsoventral acceleration signal. Dorsoventral signal during the running phase fluctuates, probably due to the shaking body derived from the running motion, and thus it is not easy to judge the existence of flapping behavior.
Appendix 1—figure 1
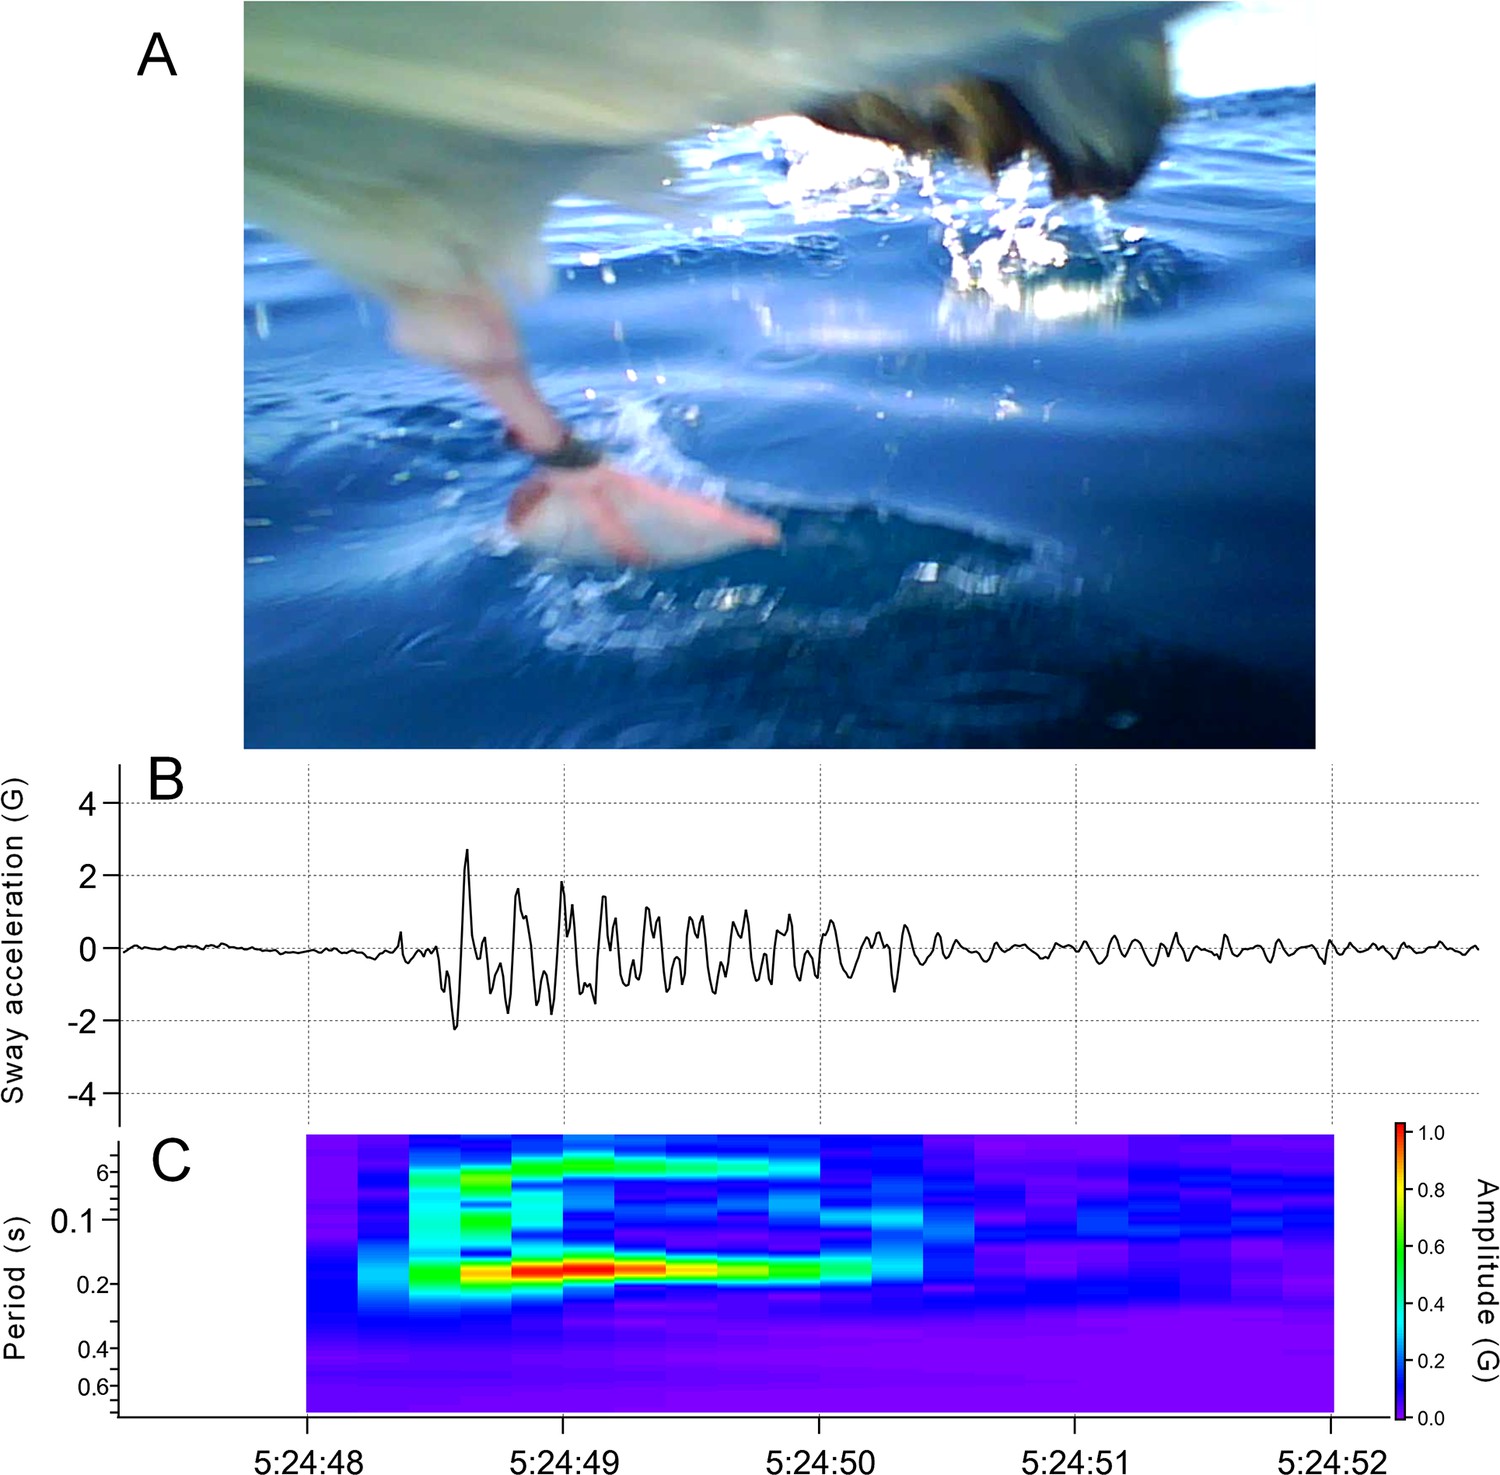
Leg motion and acceleration signal during seabird take-off.
(A) The video recorder mounted on the chest of the bird captured their legs moving in turns to run on the sea surface. (B) Sway acceleration record of taking-off streaked shearwater. Specific signal emerges only when their legs are moving. (C) Dominant period of the signal calculated by continuous wavelet transform using Igor Pro 8 (Wavemetrics, Portland, OR, USA).
Tables
Table 1
Result of Akaike information criterion (AIC) and p values from LMM estimating the environmental effect on take-off behaviors.
The best models are shown in bold.
| Response variables | N | Explanatory variables | AIC | p value (Chi square) |
|---|---|---|---|---|
| Running duration | 427 | Null | 1505.2 | |
| Wind speed | 1464.4 | 6.1 × 10⁻¹¹ | ||
| Running duration | 299 | Null | 1052.6 | |
| Wave height | 1042.0 | 4.0 × 10⁻⁴ | ||
| Running speed | 427 | Null | 1584.5 | |
| Wind speed | 1480.0 | 2.2 × 10⁻¹⁶ | ||
| Running speed | 299 | Null | 1092.9 | |
| Wave height | 1077.8 | 3.4 × 10⁻⁵ | ||
| Flapping number | 427 | Null | 2867.0 | |
| Wind speed | 2834.4 | 4.0 × 10⁻⁹ | ||
| Flapping number | 299 | Null | 1798.6 | |
| Wave height | 1773.5 | 2.0 × 10⁻⁷ | ||
| Flapping frequency | 407 | Null | 138.4 | |
| Wind speed | 115.6 | 6.4 × 10⁻⁷ | ||
| Flapping frequency | 283 | Null | 70.1 | |
| Wave height | 67.2 | 0.026 |
Table 2
Results of Akaike information criterion (AIC) from LMM considering both wind speed and wave height as candidates affecting take-off behaviors.
The best models are shown in bold.
| Response variables | N | Explanatory variables | AIC |
|---|---|---|---|
| Running duration | 185 | Null | 655.81 |
| Wave height | 650.06 | ||
| Wind speed | 639.45 | ||
| Wind speed + Wave height | 637.81 | ||
| Wind speed + Wave height + Interaction | 631.02 | ||
| Running speed | 185 | Null | 699.62 |
| Wave height | 690.57 | ||
| Wind speed | 657.69 | ||
| Wind speed + Wave height | 655.76 | ||
| Wind speed + Wave height + Interaction | 655.49 | ||
| Flapping number | 185 | Null | 1129.4 |
| Wave height | 1117.7 | ||
| Wind speed | 1109.0 | ||
| Wind speed + Wave height | 1102.3 | ||
| Wind speed + Wave height + Interaction | 1101.7 | ||
| Flapping frequency | 175 | Null | 70.43 |
| Wave height | 70.96 | ||
| Wind speed | 52.25 | ||
| Wind speed + Wave height | 54.22 | ||
| Wind speed + Wave height + Interaction | 50.72 |
Additional files
-
Supplementary file 1
Information on individuals and attached recorders.
- https://cdn.elifesciences.org/articles/87016/elife-87016-supp1-v1.xlsx
-
MDAR checklist
- https://cdn.elifesciences.org/articles/87016/elife-87016-mdarchecklist1-v1.docx
Download links
A two-part list of links to download the article, or parts of the article, in various formats.
Downloads (link to download the article as PDF)
Open citations (links to open the citations from this article in various online reference manager services)
Cite this article (links to download the citations from this article in formats compatible with various reference manager tools)
Wandering albatrosses exert high take-off effort only when both wind and waves are gentle
eLife 12:RP87016.
https://doi.org/10.7554/eLife.87016.3


