Host and viral determinants of airborne transmission of SARS-CoV-2 in the Syrian hamster
- Laboratory of Virology, Division of Intramural Research, National Institute of Allergy and Infectious Diseases, National Institutes of Health, United States
- Department of Ecology and Evolutionary Biology, University of California, Los Angeles, United States
- Rocky Mountain Research and Technologies Branch, Division of Intramural Research, National Institute of Allergy and Infectious Diseases, National Institutes of Health, United States
- Department of Medical Microbiology | Amsterdam University Medical Center, University of Amsterdam, Netherlands
- Rocky Mountain Visual and Medical Arts Unit, Research Technologies Branch, Division of Intramural Research, National Institute of Allergy and Infectious Diseases, National Institutes of Health, United States
- Rocky Mountain Veterinary Branch, Division of Intramural Research, National Institute of Allergy and Infectious Diseases, National Institutes of Health, United States
Figures
Figure 1 with 3 supplements
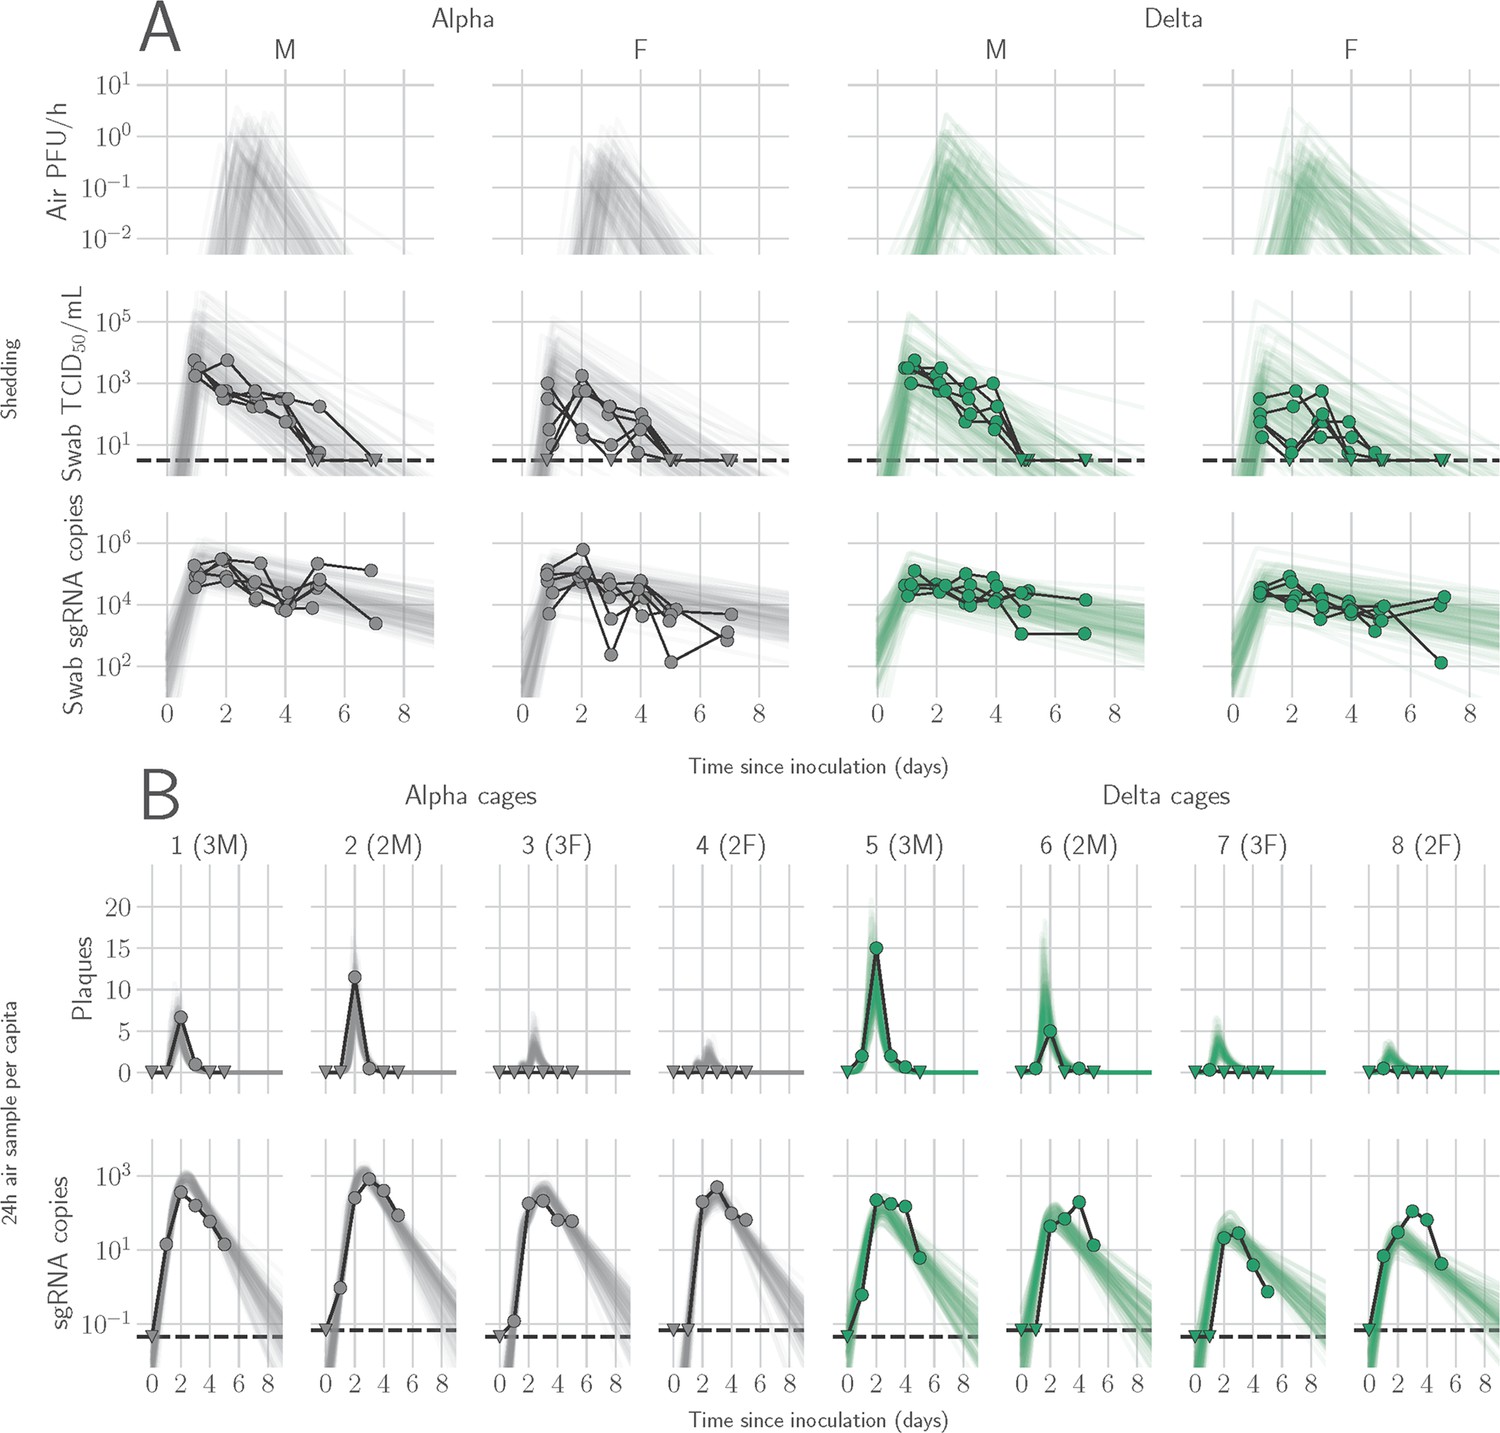
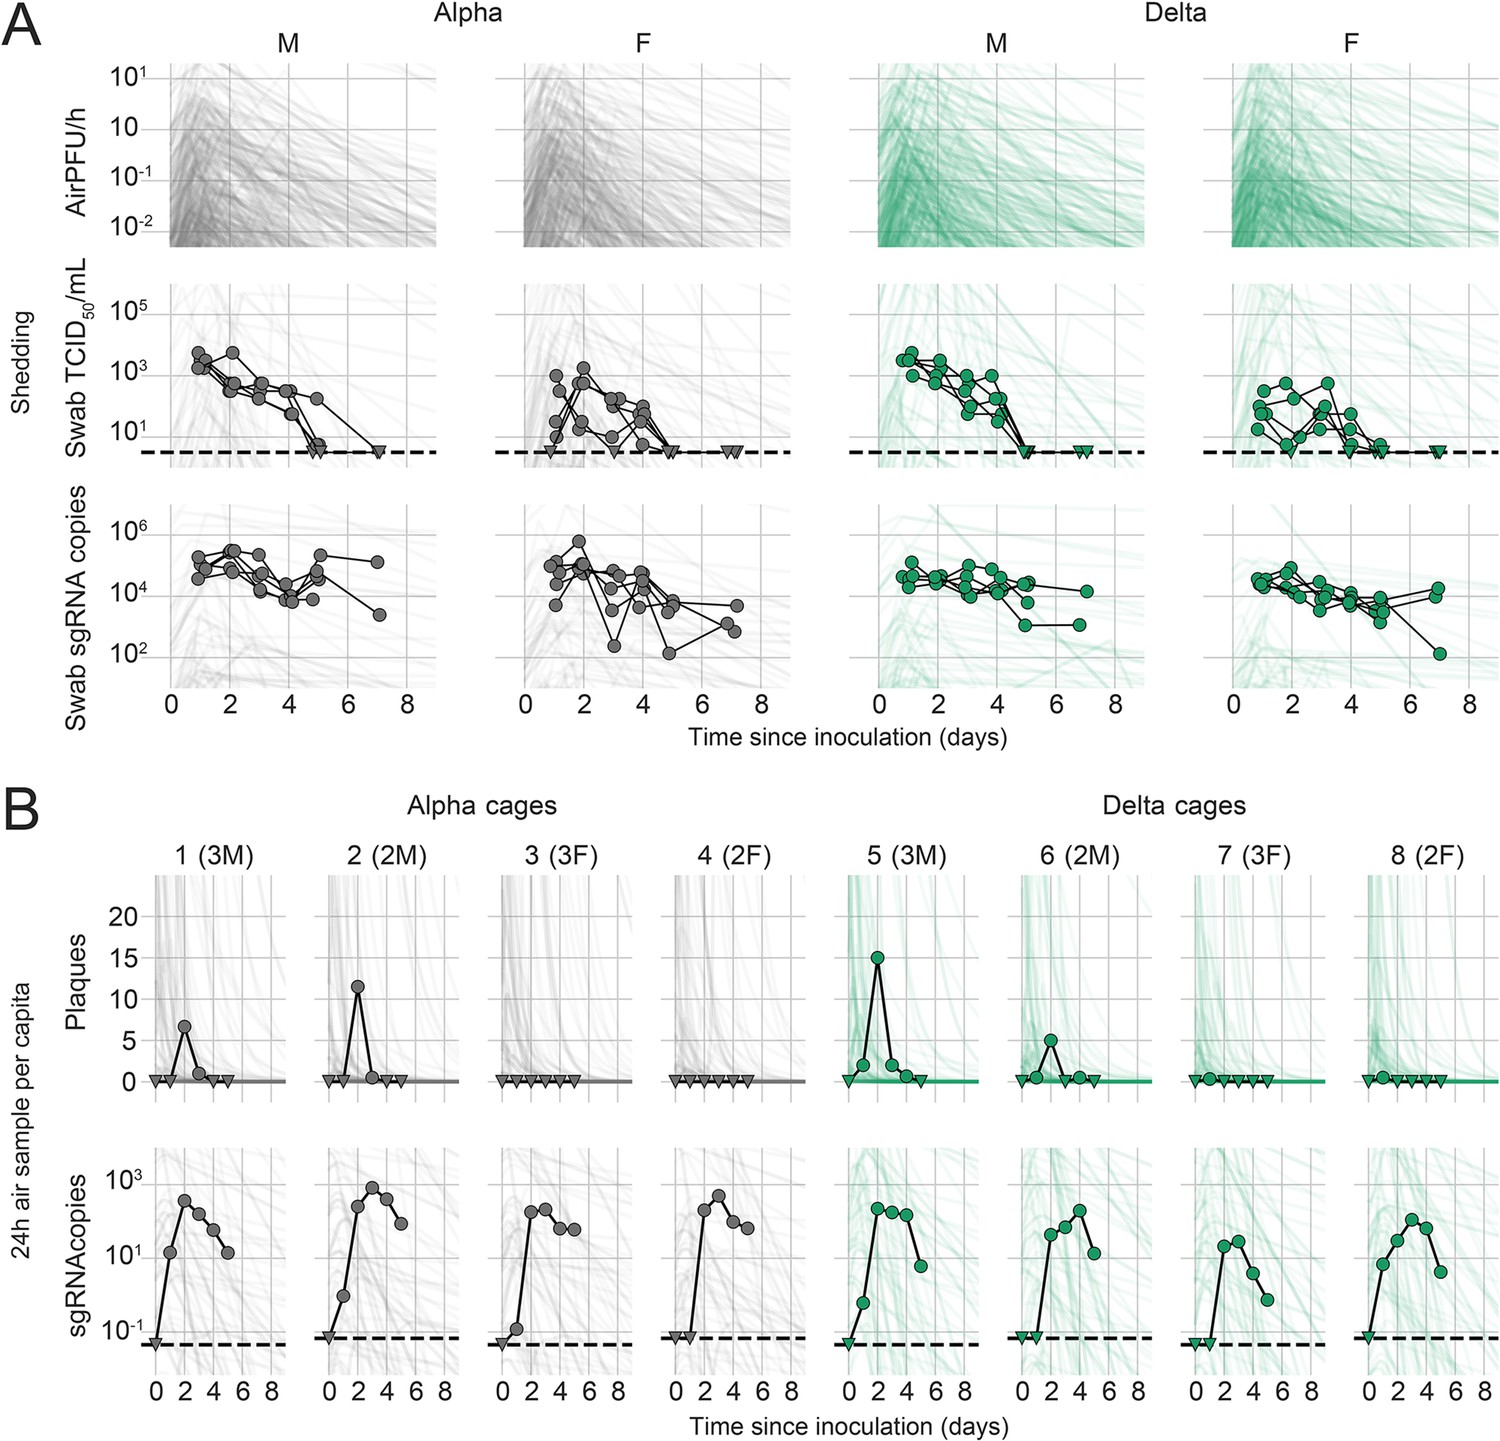
Alpha and Delta variant shedding profiles in oral swabs and air samples.
Syrian hamsters were inoculated with 103 TCID50 via the intranasal route with Alpha or Delta. ( A) Comparison of swab viral load and virus shedding into the air. Inferred profile of air shedding in PFU/h compared to sgRNA levels and infectious virus titers (TCID50/mL) in oropharyngeal swabs collected 1, 2, 3, 4, 5, and 7 DPI. Semitransparent lines are 100 random draws from the inferred posterior distribution of hamster within-host kinetics for each of the metrics. Joined points are individual measured timeseries for experimentally infected hamsters; each set of joined points is one individual. Measurements and inferences shown grouped by variant and animal sex. Measurement points are randomly jittered slightly along the x (time) axis to avoid overplotting. (B). Viral sgRNA and infectious virus (PFU) recovered from cage air sample filters over a 24 hr period starting at 0, 1, 2, 3, 4, and 5 DPI. Points are measured values, normalized by the number of hamsters in the cage (2 or 3) to give per-capita values. Downward-pointing arrows represent virus below the limit of detection (0 observed plaques or estimated copy number corresponding to Ct ≥40). Semitransparent lines are posterior predictions for the sample that would have been collected if sampling started at that timepoint; these reflect the inferred underlying concentrations of sgRNA and infectious virus in the cage air at each timepoint and are calculated from the inferred infection kinetics for each of the hamsters housed within the cage. 100 random posterior draws shown for each cage. Cages housed 2 or 3 hamsters; all hamsters within a cage were of the same sex and infected with the same variant. Column titles show cage number and variant, with number of and sex of individuals in parentheses. Dotted lines limit of detection. Grey = Alpha, teal = Delta, p-values are indicated where significant. Abbreviations: sg, subgenomic; TCID, Tissue Culture Infectious Dose; PFU, plaque forming unit; F, female; M, male; DPI, days post inoculation.
Figure 1—figure supplement 1

Alpha and Delta variant spike interaction with hamster ACE2.
(A, B) Mutations observed in the SARS-CoV-2 Alpha and Delta VOCs are highlighted on the structure of SARS-CoV-2 spike (PDB 6ZGE, Wrobel et al., 2020). The spike trimer is depicted by surface representation with each protomer colored a different shade of gray. The residues at the positions of the spike protein mutations observed in the Alpha and Delta SARS-CoV-2 VOCs are colored purple (Alpha) and teal green (Delta) and annotated. N-linked glycans are shown as light, orange-colored sticks. (C) The structure of the Alpha VOC RBD and human ACE2 complex (PDB 7EKF Han et al., 2021) is depicted with cartoon representation. ACE2 is colored dark gray and the RBD is colored light gray. N-linked glycans are shown as light, orange-colored sticks. A box reveals a close-up view of the RBD-ACE2 binding interface. Side chains of the residues participating in the interaction, as identified and described by Lan, et al. (Smith et al., 2004) are shown as sticks. The residues within the RBD that are mutated in the Alpha and Delta VOCs are colored purple (Alpha, N501Y) and teal green (Delta, L452R and T478K). Although they do not participate directly in the ACE2 interface, the sidechains of residues L452 and T478 are also shown. The residues that differ between human and hamster ACE2 within the interface are colored red. (D) BHK cells expressing either human ACE2 or hamster ACE2 were infected with pseudotyped VSV reporter particles with the spike proteins of Alpha or Delta. Relative entry to no spike control is depicted. Bar-chart depicting median, 95% CI and individuals, N=8, ordinary two-way ANOVA, followed by Šídák’s multiple comparisons test. Abbreviations: RBD, receptor binding domain; ACE2, Angiotensin-converting enzyme 2; VOCs, variants of concern.
Figure 1—figure supplement 2
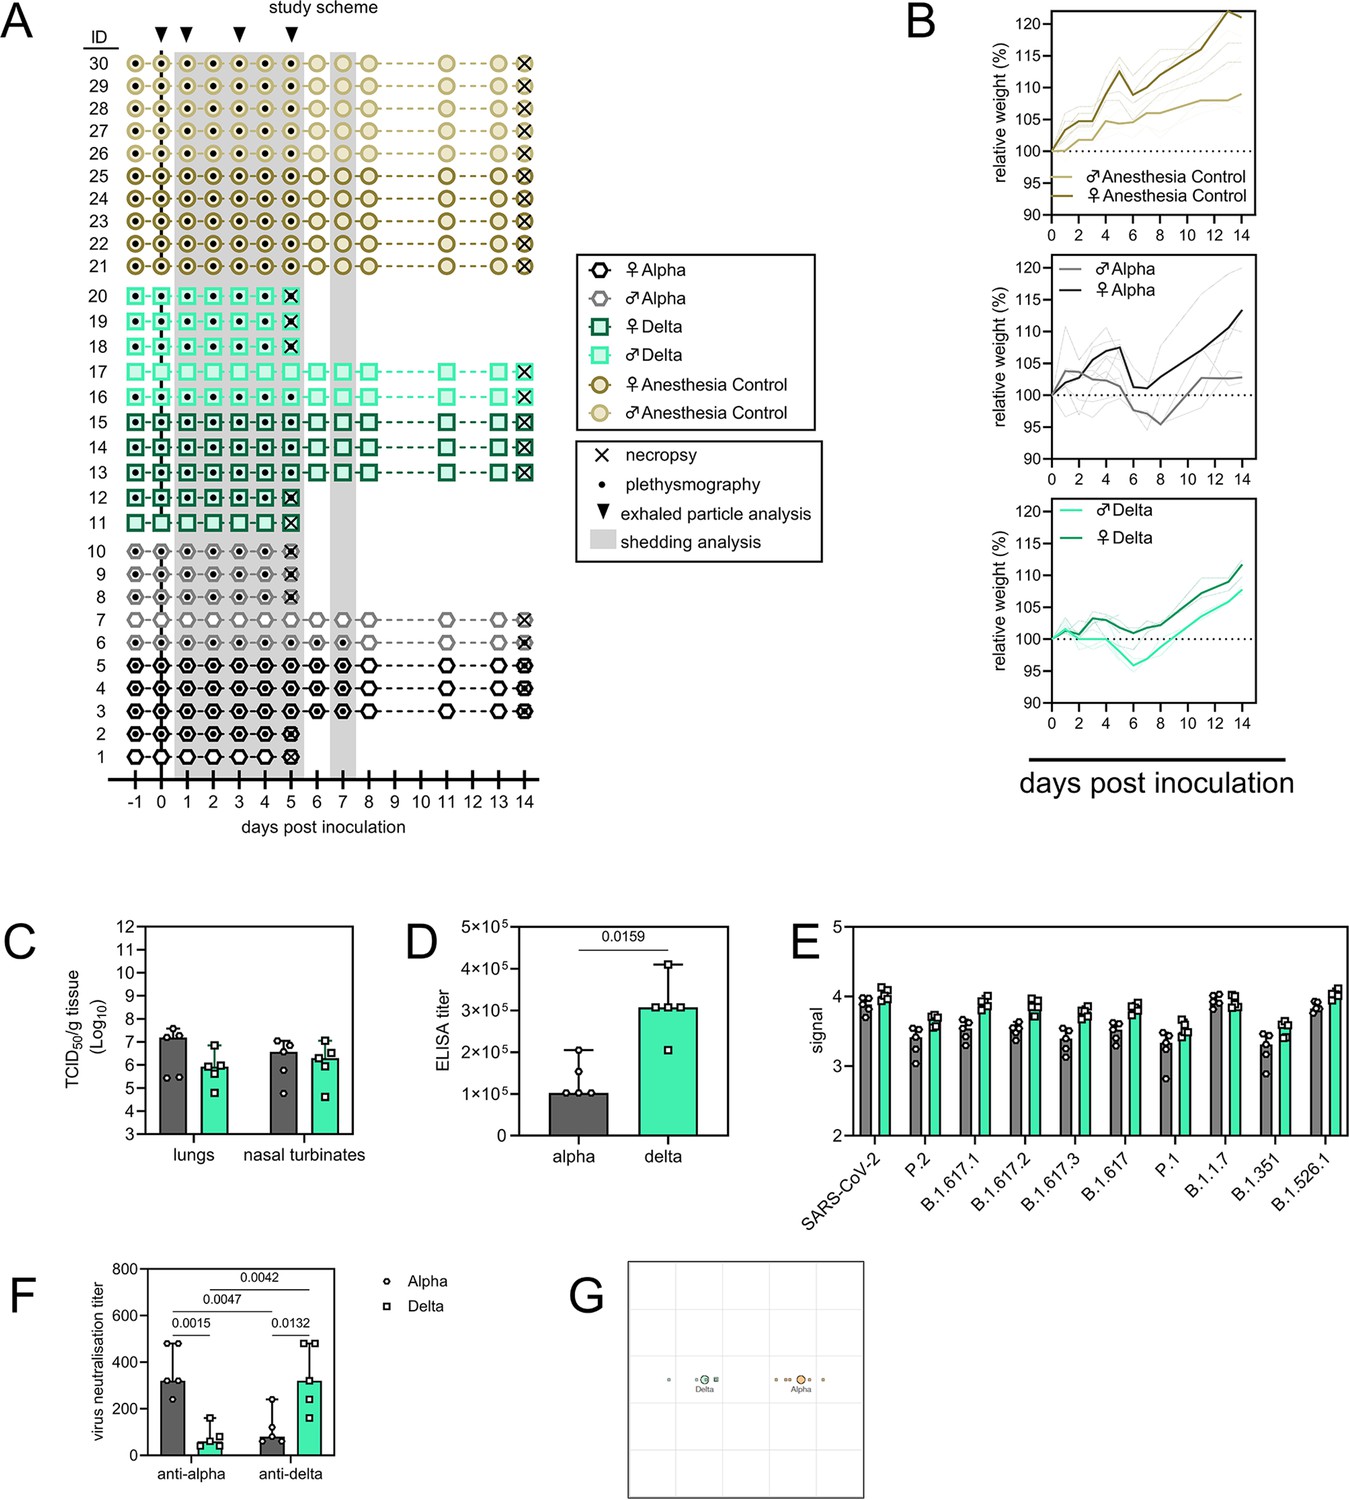
Schematic overview of inoculation experiment.
(A) Four-to-6-week-old female and male Syrian hamsters (ENVIGO) were inoculated (N=10 per virus, N=5 per sex) with 103 TCID50 intranasally (IN) with either SARS-CoV-2 Alpha or Delta variants, or no virus (anaesthesia controls). At 5 days post inoculation, five hamsters for each group were euthanized, and tissues were collected. The remaining five animals for each route were euthanized at 14 DPI for disease course assessment and shedding analysis. For the control group no day 5 necropsy was performed. Schematic indicates when oropharyngeal swabs were collected, when whole body plethysmography was performed, when air sampling was conducted and when exhaled particle profiles were determined. (B) Relative weight loss. Graph shows median (thick line) and individuals, colors indicate sex. (C). Viral load as measured by infectious titers in lungs and nasal turbinates collected at day 5 post inoculation. Bar-chart depicting median, 96% CI and individuals, N=5, ordinary two-way ANOVA, followed by Šídák’s multiple comparisons test. (D) Binding antibodies against spike protein of SARS-CoV-2 in serum obtained 14 days post inoculation. Bar-chart depicting median, 96% CI and individuals, N=5, Mann-Whitney test. ELISA was performed once. (E) Binding antibodies against spike protein of various variants of concern analyzed by MesoPlex. Bar-chart depicting median, 96% CI and individuals, N=5 ordinary two-way ANOVA, followed by Šídák’s multiple comparisons test. Assay was performed once. (F) Virus neutralization titers against Alpha and Delta, depicted as reciprocal titers. N=5, ordinary two-way ANOVA, followed by Tukey’s multiple comparisons test. Assay was performed once. Grey = Alpha, teal = Delta, beige = anesthesia control. (G) Antigenic map (Smith et al., 2004) depicting the cross-reactivity based on neutralization. The spacing between grid lines is 1 unit of antigenic distance, corresponding to a twofold dilution of serum in the neutralization assay. The resulting antigenic distance is depicted between Alpha and Delta. p-Values are indicated where significant. Abbreviations: ELISA, Enzyme-linked immune-absorbent Assay.
Figure 1—figure supplement 3
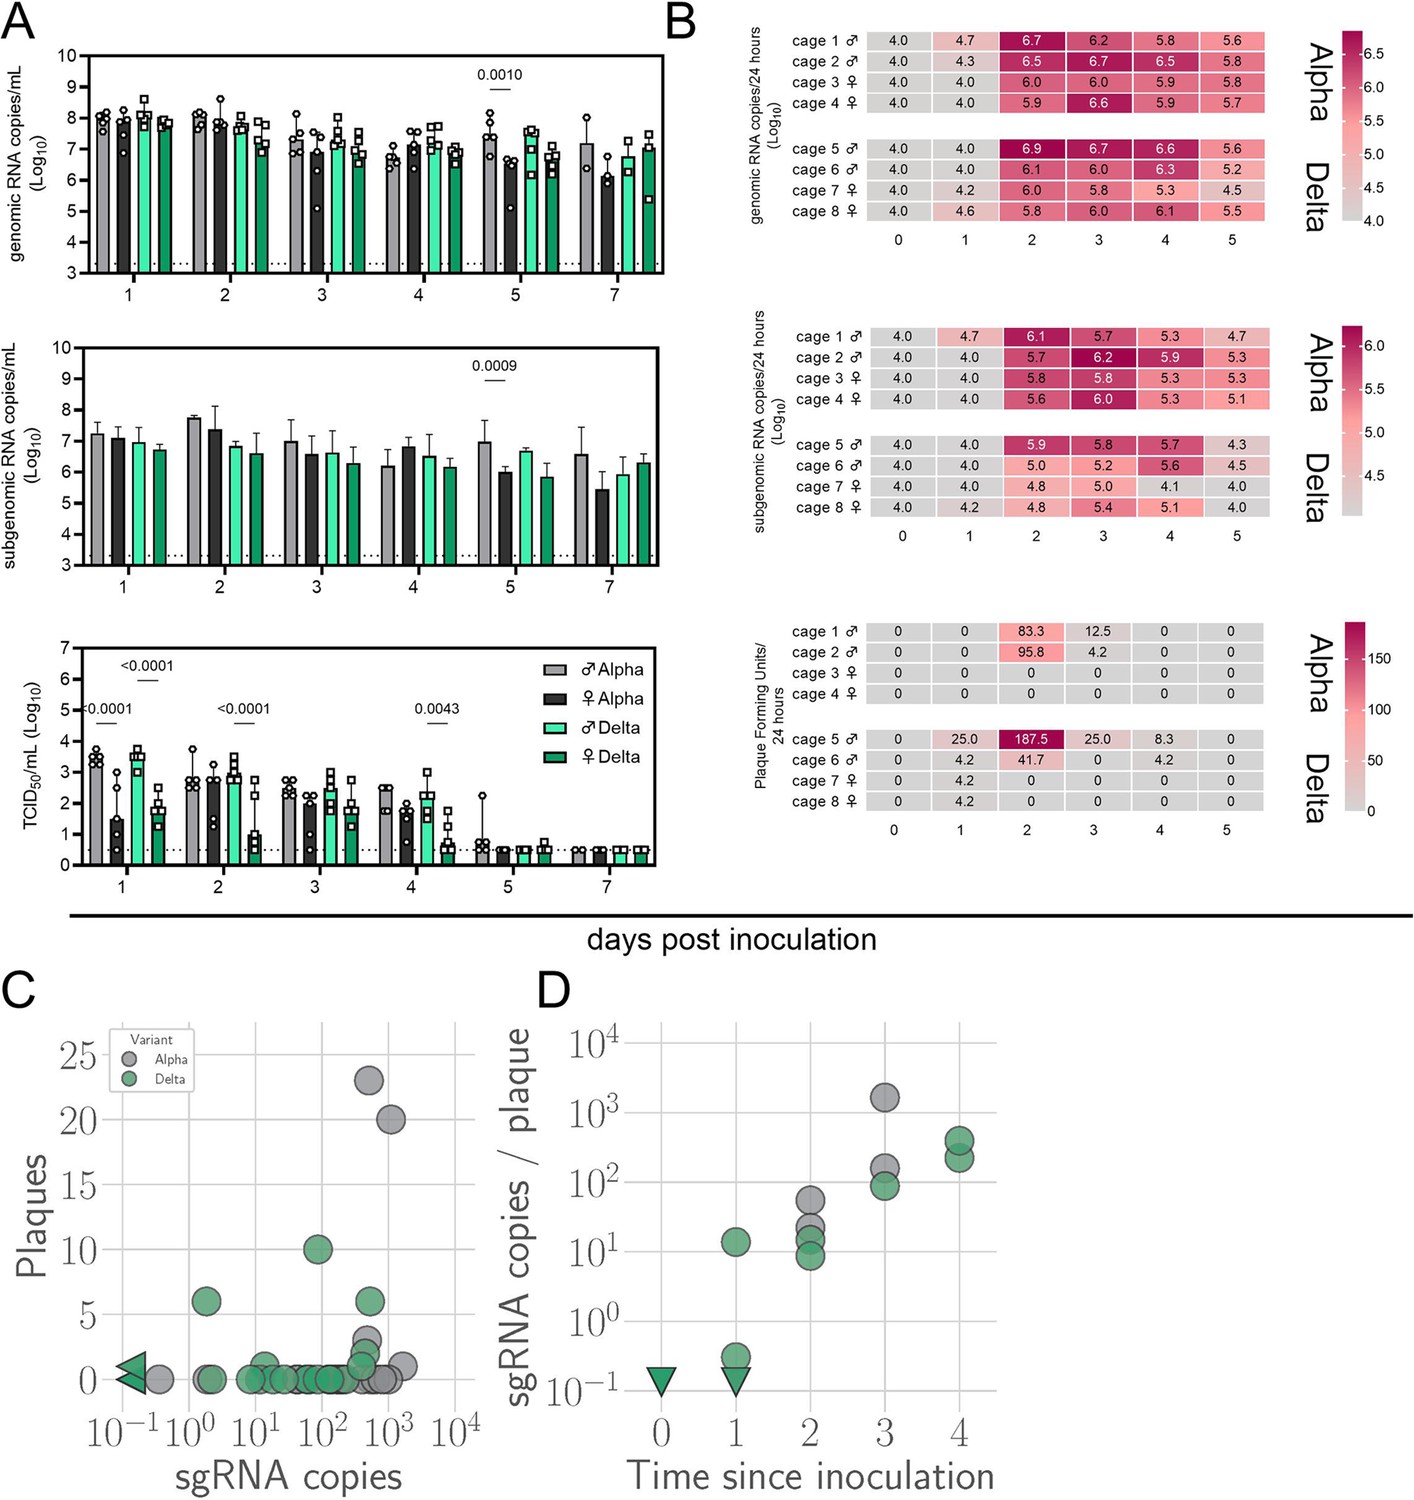
Window of Alpha and Delta variant shedding profiles.
Syrian hamsters were inoculated with 103 TCID50 via the intranasal route with Alpha or Delta. (A) Viral load as measured by gRNA, sgRNA and infectious titers in oropharyngeal swabs collected at days 1, 2, 3, 4, 5, and 7 post inoculation. Bar-chart depicting median, 96% CI and individuals, N=5, ordinary two-way ANOVA, followed by Šídák’s multiple comparisons test. Dotted line = limit of detection. Grey = Alpha, teal = Delta, dark = female, light = males (B) Virus isolated from cage air over 24 hr intervals, measured as gRNA, sgRNA and plaque forming units on days 0, 1, 2, 3, 4, and 5. The column marked 1 corresponds to samples taken from 0 to 24 hr post inoculation. Each cage housed two or three hamsters. Heatmap depicting individual cages across each day, colors referring to legends on the right. RNA: limit of detection = 4.0, Plaque forming units: limit of detection = 0. (C) sgRNA sampled from air versus infectious virus sampled from air. Point color indicates variant: Alpha (grey) or Delta (teal). Sampled sgRNA copies value versus sampled plaques. (D) Number of estimated sgRNA copies per plaque in samples as a function of day sampled and variant. p-values are indicated where significant. Abbreviations: g, genomic; sg, subgenomic; TCID, Tissue Culture Infectious Dose.
Figure 2 with 1 supplement
Lung function and breathing changes after SARS-CoV-2 infection with Alpha and Delta.
Syrian hamsters were inoculated with 103 TCID50 via the intranasal route with Alpha or Delta. (A) Lung function was assessed on days –1, 0, 1, 2, 3, 4, and 5 by whole body plethysmography. Principal component analysis was used to investigate individual variance. Depicted are principal component (PC) 1 and 2 for each day, showing individual animals (colors refer to legend on right, sex-separated) and clusters (black ellipses). (B) Individual loading plots for contributions of top 6 variables to PC1 and 2 at each day. (C) Relevant subset of lung function parameters. Line graphs depicting median and 95% CI fold change values (left) and area under the curve (AUC, right), Kruskal-Wallis test, p-values indicated where significant. Grey = Alpha, teal = Delta, beige = anesthesia control, light = male, dark = female. Abbreviations: Expiratory time (Te), inspiratory time (Ti), percentage of breath occupied by the transition from inspiration to expiration (TB), end expiratory pause (EEP), breathing frequency (f), peak inspiratory flow (PIFb), peak expiratory flow (PEFb), tidal volume (TVb), minute volume (MVb), enhanced pause (Penh), male (M), female (F).
Figure 2—figure supplement 1

Respiratory tract pathology after SARS-CoV-2 infection with Alpha and Delta.
Figure 3 with 1 supplement
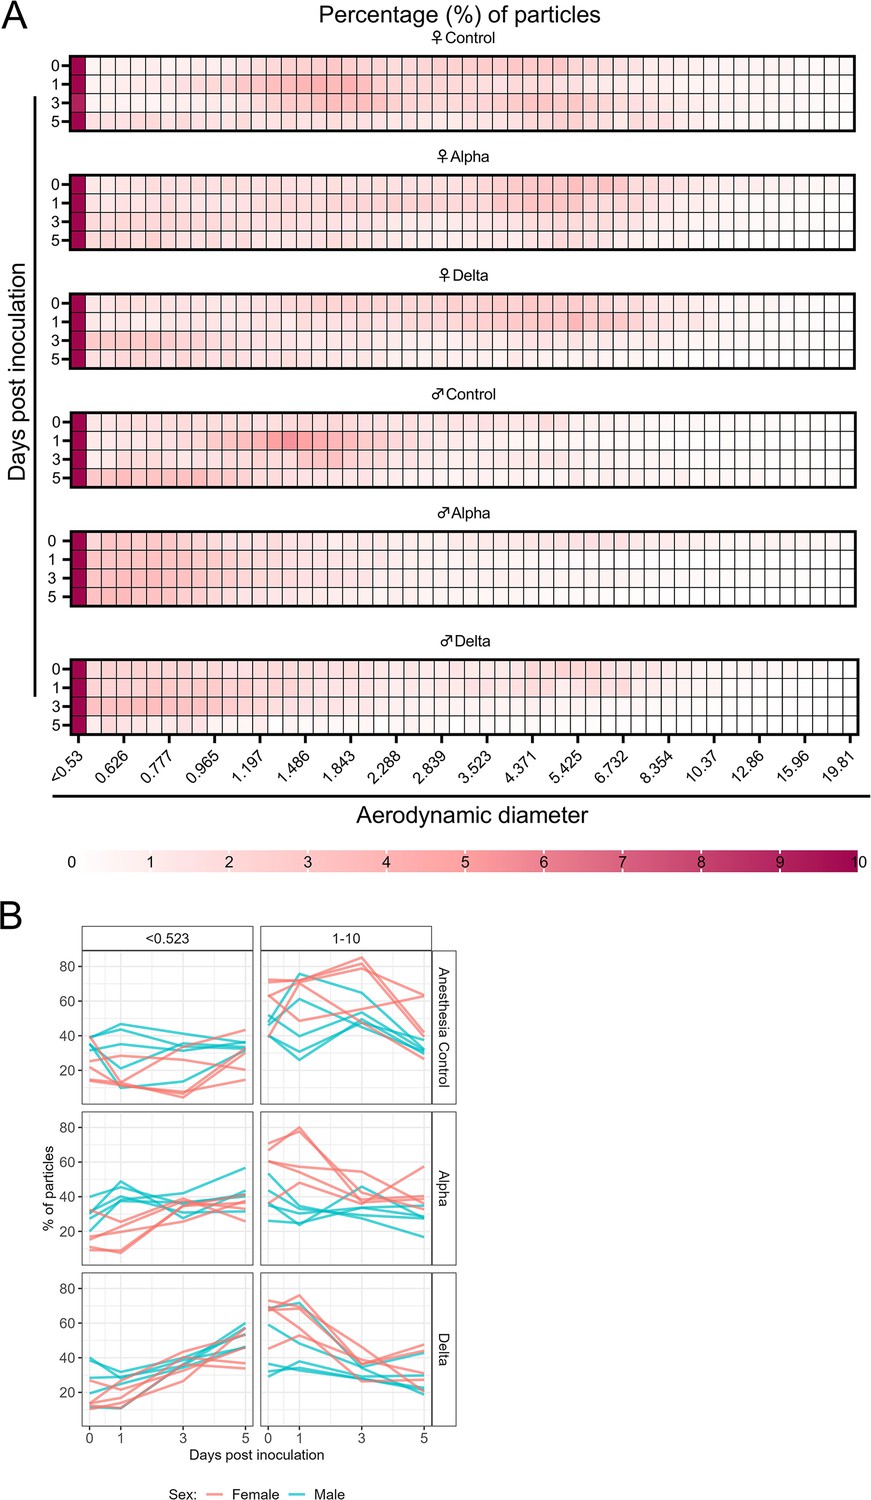
Aerodynamic particle analysis of SARS-CoV-2 infected hamsters.
(A) Syrian hamsters were inoculated with 103 TCID50 via the intranasal route with Alpha or Delta. Aerodynamic diameter profile of exhaled particles was analyzed on days 0, 1, 3, and 5. Heatmap shows rounded median percent of total particles across groups, including the anesthesia control group (N=10, comprising five males and five5 females). Colors refer to scale below. (B) For each animal, line graphs of the percent of particles in the <0.53 and 1–10 µm diameter range by variant group and sex indicated by color. Multiple linear regression performed for each diameter range with group and sex as predictors, F-statistic (Boone and Gerba, 2007; Jones et al., 2021)=9.47 for<0.53 µm model and F-statistic (Boone and Gerba, 2007; Jones et al., 2021)=2.62 for 1–10 µm model, with Tukey multiple comparison adjustment for the three variant-group comparisons (95% family-wise confidence level). For <0.53 range, Male-Female (estimate = –1.7, standard error = 0.888, two-sided p=0.0659); Alpha-Control (estimate = 2.41, standard error = 1.09, two-sided p=0.0874), Delta-Control (estimate = 5.40, standard error = 1.09, two-sided p=0.0001), Delta-Alpha (estimate = 2.99, standard error = 1.09, two-sided p=0.0280). For 1–10 range, Male-Female (estimate = 2.19, standard error = 1.23, two-sided p=0.0875); Alpha-Control (estimate = –0.633, standard error = 1.51, two-sided p=0.9079), Delta-Control (estimate = –3.098, standard error = 1.51, two-sided p=0.1197), Delta-Alpha (estimate = –2.465, standard error = 1.51, two-sided p=0.2498). Grey = Alpha, teal = Delta, beige = anesthesia control, red = female, blue = male.
Figure 3—figure supplement 1
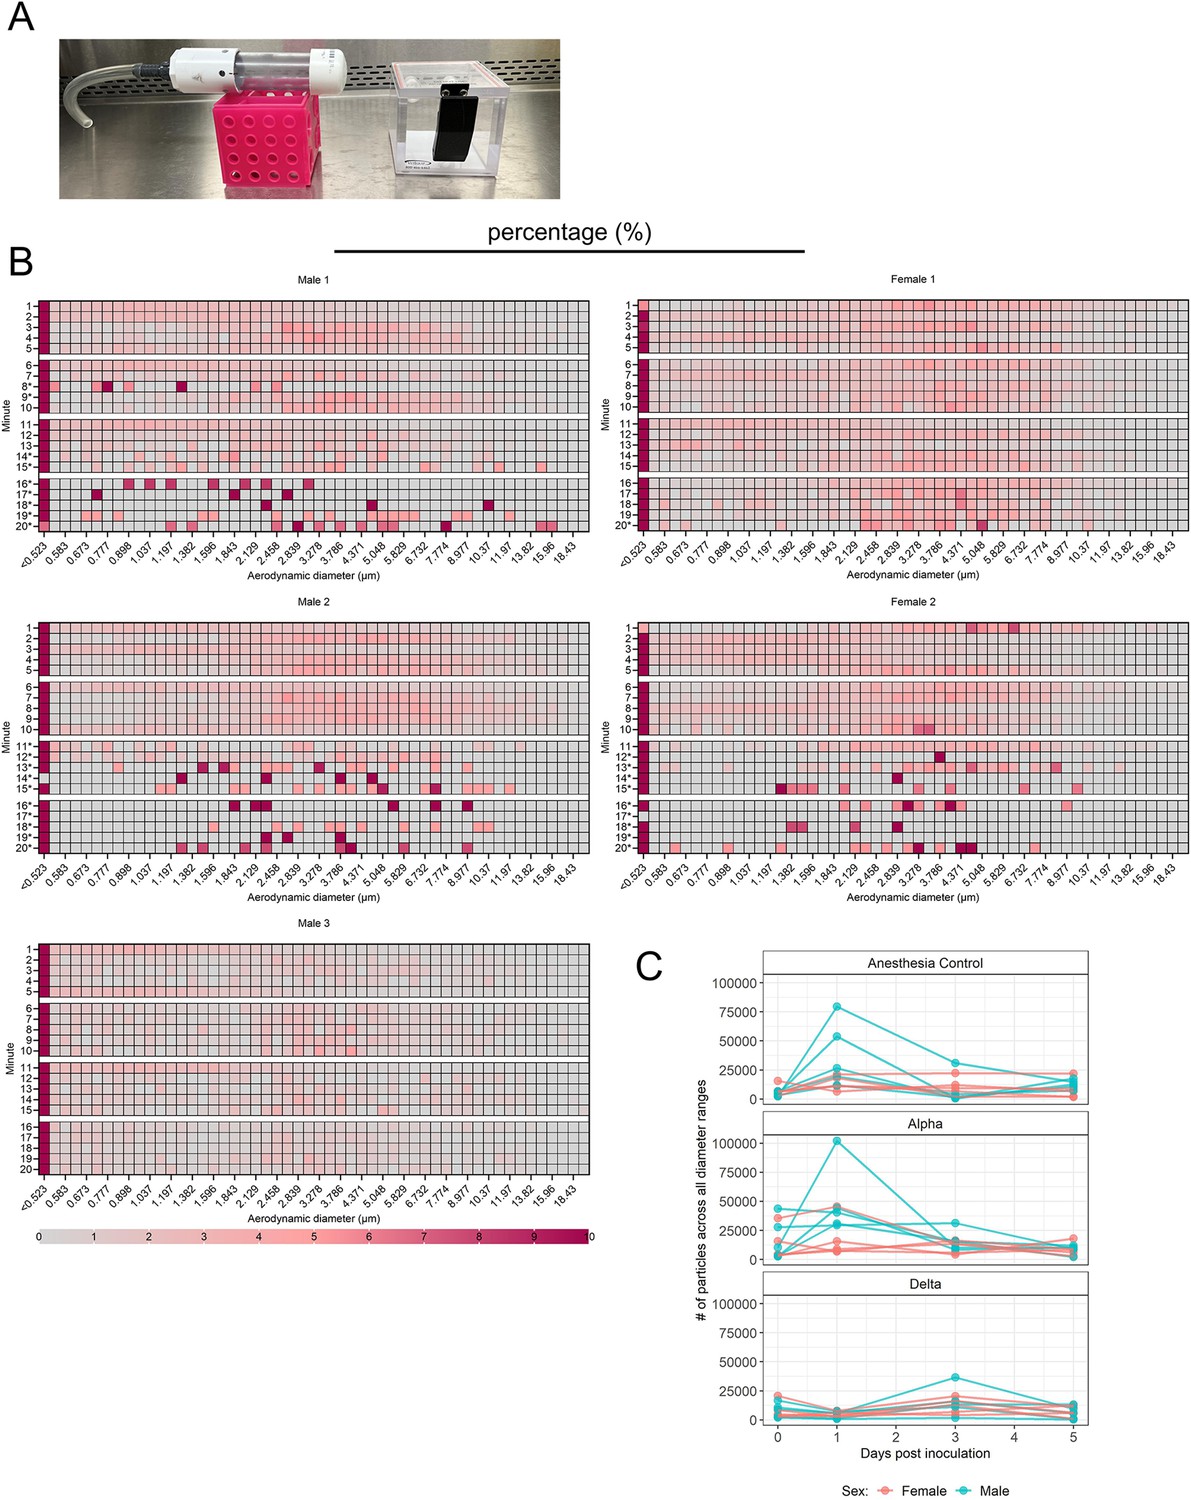
Exhaled particle profiles of Syrian hamsters.
(A) Chambers used to house uninfected hamsters (left) and animals during inoculation experiments (inoculation with Alpha, Delta or control inoculum) (right).(B) Uninfected healthy animals were used to assess particle profiles in relation to behavior patterns. Five Syrian hamsters were acclimatized to a small tube, in which animal movement was limited and air flow was directly passing the face. For each animal, 5x5 min readings were taken. Heatmap shows the percentage of total particles in each diameter size for three male and two female animals. * marks minutes of low to no activity (sleep). Colors refer to scale below. (C). Syrian hamsters were inoculated with 103 TCID50 via the intranasal route with Alpha (N=10) or Delta (N=10). Aerodynamic diameter profile of exhaled particles was analyzed on days 0, 1, 3, and 5. For each animal (N=10 in each variant group, comprising five males and five females), line graph of the total number of particles by variant and sex indicated by color (red = female; blue = male).
Figure 4 with 1 supplement

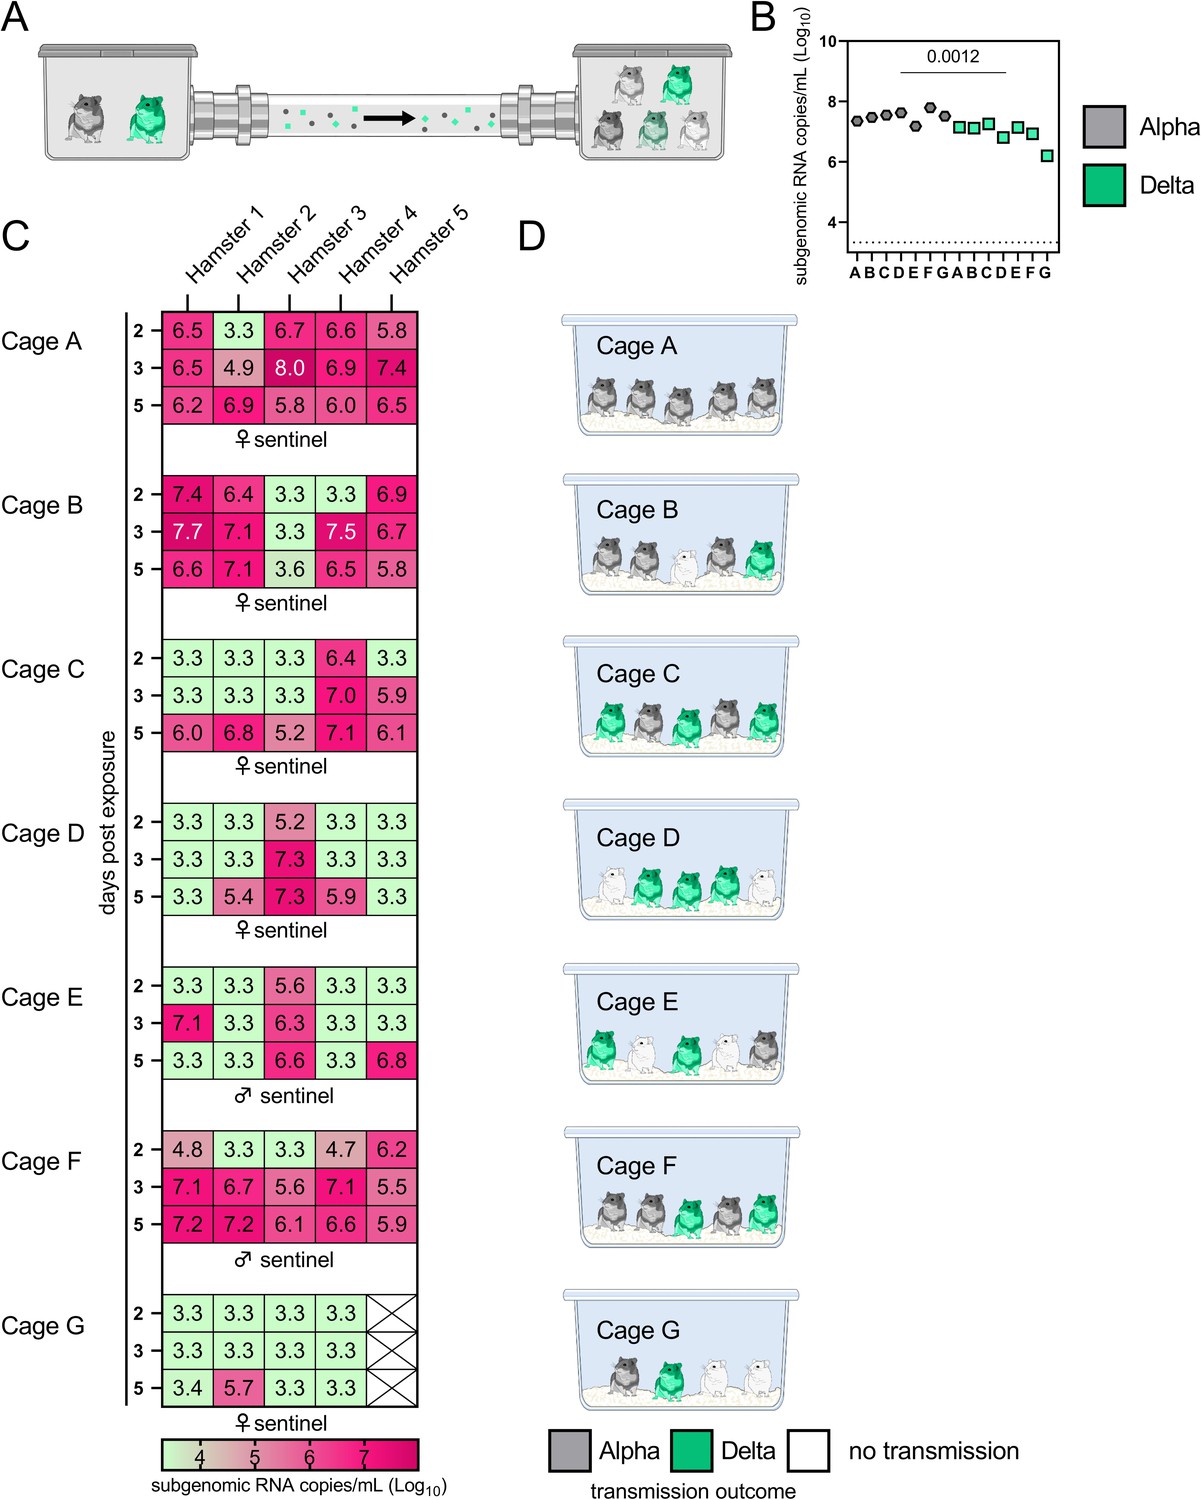
Airborne attack rate of Alpha and Delta SARS-CoV-2 variants.
Donor animals (N=7) were inoculated with either the Alpha or Delta variant with 103 TCID50 via the intranasal route and paired together randomly (1:1 ratio) in 7 attack rate scenarios (A–G). To each pair of donors, 1 day after inoculation, 4–5 sentinels were exposed for a duration of 4 hr (i.e. h 24–28 post inoculation) in an aerosol transmission set-up at 200 cm distance. (A) Schematic figure of the transmission set-up. (B). Day 1 sgRNA detected in oral swabs taken from each donor after exposure ended. Individuals are depicted. Wilcoxon test, N=7. Grey = Alpha, teal = Delta inoculated donors. (C) Respiratory shedding measured by viral load in oropharyngeal swabs; measured by sgRNA on days 2, 3, and 5 for each sentinel. Animals are grouped by scenario. Colors refer to legend below. 3.3=limit of detection of RNA (<10 copies/rxn). (D) Schematic representation of majority variant for each sentinel as assessed by percentage of Alpha and Delta detected in oropharyngeal swabs taken at day 2 and day 5 post exposure by deep sequencing. Grey = Alpha, teal = Delta, white = no transmission.
Figure 4—figure supplement 1
Airborne competitiveness of Alpha and Delta SARS-CoV-2 variants.
(A) Cumulative pathology score of sentinels on day 5 post exposure. Bar-chart depicting median, 96% CI, and individuals, Mann-Whitney test. (B) Lung histologic lesion scores 0, 1, and 2. Score 0, normal lung devoid of immunoreactivity. Score 1, a solitary focus of inflammation (circled) surrounded by normal lung. Bronchiole (*) and alveolar (>) immunoreactivity. Score 2, multiple foci of coalescing inflammation centered on airways. HE (top row) and anti-SARS-CoV-2 IHC (bottom row). (C, D) Viral load measured via infectious virus titer in swabs and lungs of sentinels on day 5. Bar-chart depicting median, 96% CI, and individuals, Mann-Whitney test. Grey = Alpha, teal = Delta, p-values indicated where significant. Abbreviations: TCID, Tissue Culture Infectious Dose.
Figure 5 with 1 supplement
Airborne competitiveness of Alpha and Delta SARS-CoV-2 variants.
(A) Schematic. Donor animals (N=8) were inoculated with Alpha and Delta variant with 5x10² TCID50, respectively, via the intranasal route (1:1 ratio), and three groups of sentinels (Sentinels 1, 2, and 3) were exposed subsequently at a 16.5 cm distance. Animals were exposed at a 1:1 ratio; exposure occurred on day 1 (Donors → Sentinels 1) and day 2 (Sentinels → Sentinels). (B) Respiratory shedding measured by viral load in oropharyngeal swabs; measured by gRNA, sgRNA, and infectious titers on days 2 and day 5 post exposure. Bar-chart depicting median, 96% CI and individuals, N=8, ordinary two-way ANOVA followed by Šídák’s multiple comparisons test. (C-E). Corresponding gRNA, sgRNA, and infectious virus in lungs and nasal turbinates sampled five days post exposure. Bar-chart depicting median, 96% CI and individuals, N=8, ordinary two-way ANOVA, followed by Šídák’s multiple comparisons test. Dark orange = Donors, light orange = Sentinels 1, grey = Sentinels 2, dark grey = Sentinels 3, p-values indicated where significant. Dotted line = limit of detection. (F) Percentage of Alpha and Delta detected in oropharyngeal swabs taken at days 2 and day 5 post exposure for each individual donor and sentinel, determined by deep sequencing. Pie-charts depict individual animals. Grey = Alpha, teal = Delta. (G) Lung and nasal turbinate samples collected on day 5 post inoculation/exposure. (H). Summary of data of variant composition, violin plots depicting median and quantiles for each chain link (left) and for each set of samples collected (right). Shading indicates majority of variant (grey = Alpha, teal = Delta). (I) Correlation plot depicting spearman r for each chain link (right, day 2 swab) and for each set of samples collected across all animals (left). Colors refer to legend on right. Abbreviations: TCID, Tissue Culture Infectious Dose.
Figure 5—figure supplement 1

Early virus shedding in donors and sentinels.
Donor animals were inoculated with Delta variant with 103 TCID50 via the intranasal route. Sentinels (1:1 ratio) were exposed subsequently at 16.5 cm distance for 24 h, beginning 24 h after donor exposure. (A) Organ titers measured by gRNA and sgRNA on day 2 post inoculation/exposure.(B) Respiratory shedding measured by viral load in oropharyngeal swabs; measured by gRNA, sgRNA and infectious titers on day 2 post inoculation/exposure. Bar-chart depicting median, 96% CI and individuals, N=5, ordinary two-way ANOVA, followed by Šídák’s multiple comparisons test and Wilcoxon test. Orange = donors, purple = sentinels, p-value shown where significant. Abbreviations: g, genomic; sg, subgenomic; TCID, Tissue Culture Infectious Dose.
Appendix 1—figure 1
Prior predictive checks.
Figure is as main text Figure 1, except that the trajectories showed by the semi-transparent lines are randomly sampled from the prior predictive distribution rather than from the posterior, and 500 lines are drawn in panel A rather than 100, given the greater dispersion relative to the data. Wide range of simulated trajectories relative to the data shows that priors allow for a wide range of a priori plausible kinetics.
Appendix 1—figure 2
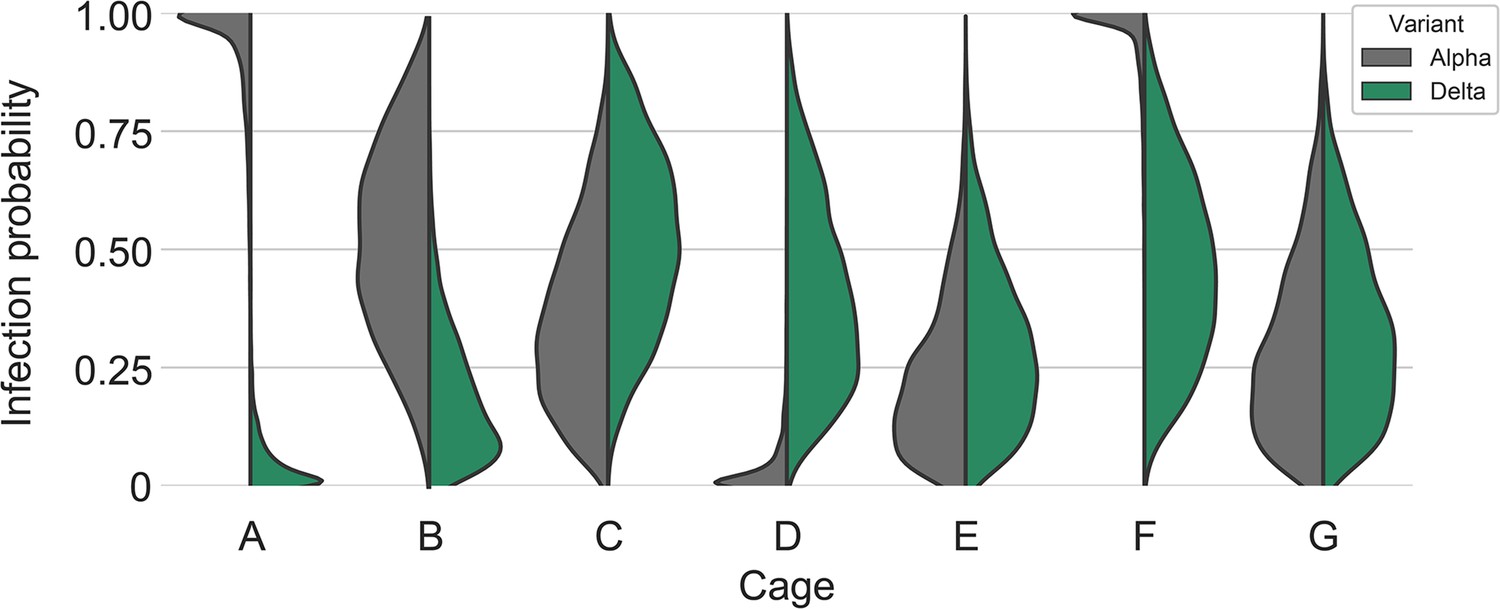
Posterior estimates for the infection probabilities for each variant in each cage.
Half-violin plots show posterior densities for Alpha infection probability (gray) compared to Delta infection probability (green). There were very high Alpha infection probabilities in cages A and F.
Appendix 1—figure 3
Posterior estimates for coinfection probabilities by cage.
Sequential exposures shown in blue, simultaneous exposures shown in pink. Cage F, where coinfections were actually observed, has a substantially higher coinfection probability estimate than other cages.
Appendix 1—figure 4
Expected coinfection counts for sequential and simultaneous experiments.
Author response image 1
Airborne attack rate of Alpha and Delta SARS-CoV-2 variants.
Donor animals (N = 7) were inoculated with either the Alpha or Delta variant with 103 TCID50 via the intranasal route and paired together randomly (1:1 ratio) in 7 attack rate scenarios (A-G). To each pair of donors, one day after inoculation, 4-5 sentinels were exposed for a duration of 4 h (i.e., h 24-28 post inoculation) in an aerosol transmission set-up at 200 cm distance. (A) Schematic figure of the transmission set-up. (B) Day 1 sgRNA detected in oral swabs taken from each donor after exposure ended. Individuals are depicted. Wilcoxon test, N = 7. Grey = Alpha, teal = Delta inoculated donors. (C) Respiratory shedding measured by viral load in oropharyngeal swabs; measured by sgRNA on day 2, 3, and 5 for each sentinel. Animals are grouped by scenario. Colors refer to legend below. 3.3 = limit of detection of RNA (<10 copies/rxn). (D) Schematic representation of majority variant for each sentinel as assessed by percentage of Alpha and Delta detected in oropharyngeal swabs taken at day 2 and day 5 post exposure by deep sequencing. Grey = Alpha, teal = Delta, white = no transmission.
Author response image 2
Airborne competitiveness of Alpha and Delta SARS-CoV-2 variants.
(A) Schematic. Donor animals (N = 8) were inoculated with Alpha and Delta variant with 5 x 10² TCID50, respectively, via the intranasal route (1:1 ratio), and three groups of sentinels (Sentinels 1, 2, and 3) were exposed subsequently at a 16.5 cm distance. Animals were exposed at a 1:1 ratio; exposure occurred on day 1 (Donors = Sentinels 1) and day 2 (Sentinels = Sentinels). (B) Respiratory shedding measured by viral load in oropharyngeal swabs; measured by gRNA, sgRNA, and infectious titers on days 2 and day 5 post exposure. Bar-chart depicting median, 96% CI and individuals, N = 8, ordinary two-way ANOVA followed by Šídák's multiple comparisons test. (C/D/E) Corresponding gRNA, sgRNA, and infectious virus in lungs and nasal turbinates sampled five days post exposure. Bar-chart depicting median, 96% CI and individuals, N = 8, ordinary two-way ANOVA, followed by Šídák's multiple comparisons test. Dark orange = Donors, light orange = Sentinels 1, grey = Sentinels 2, dark grey = Sentinels 3, p-values indicated where significant. Dotted line = limit of quality. (F) Percentage of Alpha and Delta detected in oropharyngeal swabs taken at days 2 and day 5 post exposure for each individual donor and sentinel, determined by deep sequencing. Pie-charts depict individual animals. Grey = Alpha, teal = Delta. (G) Lung and nasal turbinate samples collected on day 5 post inoculation/exposure. (H) Summary of data of variant composition, violin plots depicting median and quantiles for each chain link (left) and for each set of samples collected (right). Shading indicates majority of variant (grey = Alpha, teal = Delta). (I) Correlation plot depicting Spearman r for each chain link (right, day 2 swab) and for each set of samples collected across all animals (left). Colors refer to legend on right. Abbreviations: TCID, Tissue Culture Infectious Dose.”
Additional files
-
Supplementary file 1
Airborne attack rate of Alpha and Delta SARS-CoV-2 variants.
Donor animals (N=7) were inoculated with either the Alpha or Delta variant and paired together randomly in 7 attack rate scenarios (A-G). One day after inoculation, 4–5 sentinels were exposed for a duration of 4 h in an aerosol transmission set-up. Percentage of Alpha and Delta detected in oropharyngeal swabs taken at day 2 and day 5 post exposure by deep sequencing.
- https://cdn.elifesciences.org/articles/87094/elife-87094-supp1-v1.docx
-
MDAR checklist
- https://cdn.elifesciences.org/articles/87094/elife-87094-mdarchecklist1-v1.docx
Download links
A two-part list of links to download the article, or parts of the article, in various formats.
Downloads (link to download the article as PDF)
Open citations (links to open the citations from this article in various online reference manager services)
Cite this article (links to download the citations from this article in formats compatible with various reference manager tools)
Host and viral determinants of airborne transmission of SARS-CoV-2 in the Syrian hamster
eLife 12:RP87094.
https://doi.org/10.7554/eLife.87094.3


