Gene regulatory patterning codes in early cell fate specification of the C. elegans embryo
- Department of Molecular Evolution and Development, University of Vienna, Austria
- University of Vienna, Austria
- Department of Biology, Technion – Israel Institute of Technology, Israel
- State Key Laboratory of Molecular Developmental Biology, Institute of Genetics and Developmental Biology, Chinese Academy of Sciences, China
- Institute for Computational Medicine, NYU School of Medicine, United States
Figures
Figure 1
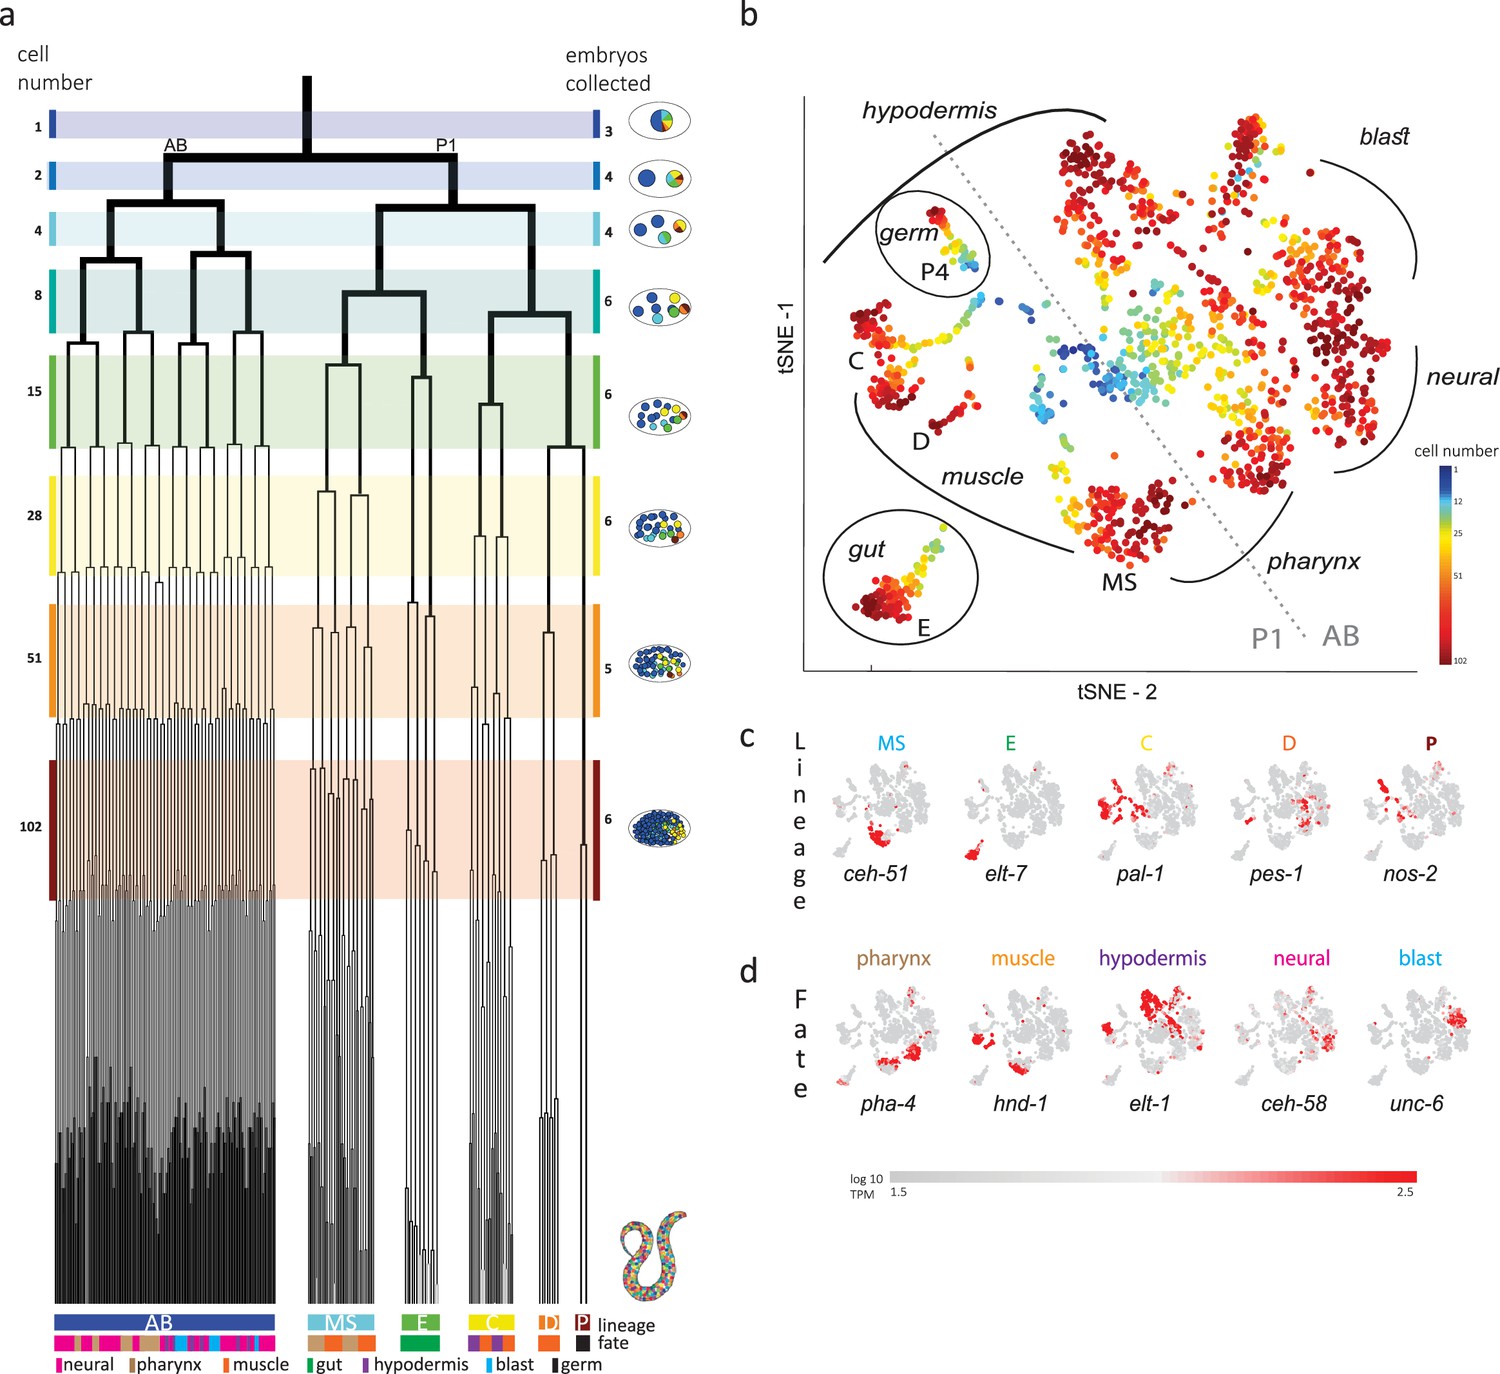
Single-cell transcriptomics in the early C. elegans embryo.
(a) The embryonic C. elegans cell lineage as deciphered by Sulston et al., 1983. The number of cells present at each stage is indicated on the left and schematic images of the embryo are shown for several stages to the right with cells colored by founder cell lineages AB, MS, E, C, D, and P4. The fate of the cells at the last stage is also indicated according to the legend at the foot of the lineage. The number of embryos examined in this study is indicated on the right. Colored bars correspond to the windows in which embryos were considered to be at the same stage. (b) A t-distributed stochastic neighbor embedding (tSNE) map of the cells isolated in this study. Circles indicate the individual cells, colored by the stage of development of the embryo from which they were manually collected. (c–d) Gene expression for the indicated lineage and fate marker genes on the tSNE map shown in (b).
Figure 2 with 9 supplements
Inferring the transcriptomes of cell states throughout specification in the C. elegans embryo.
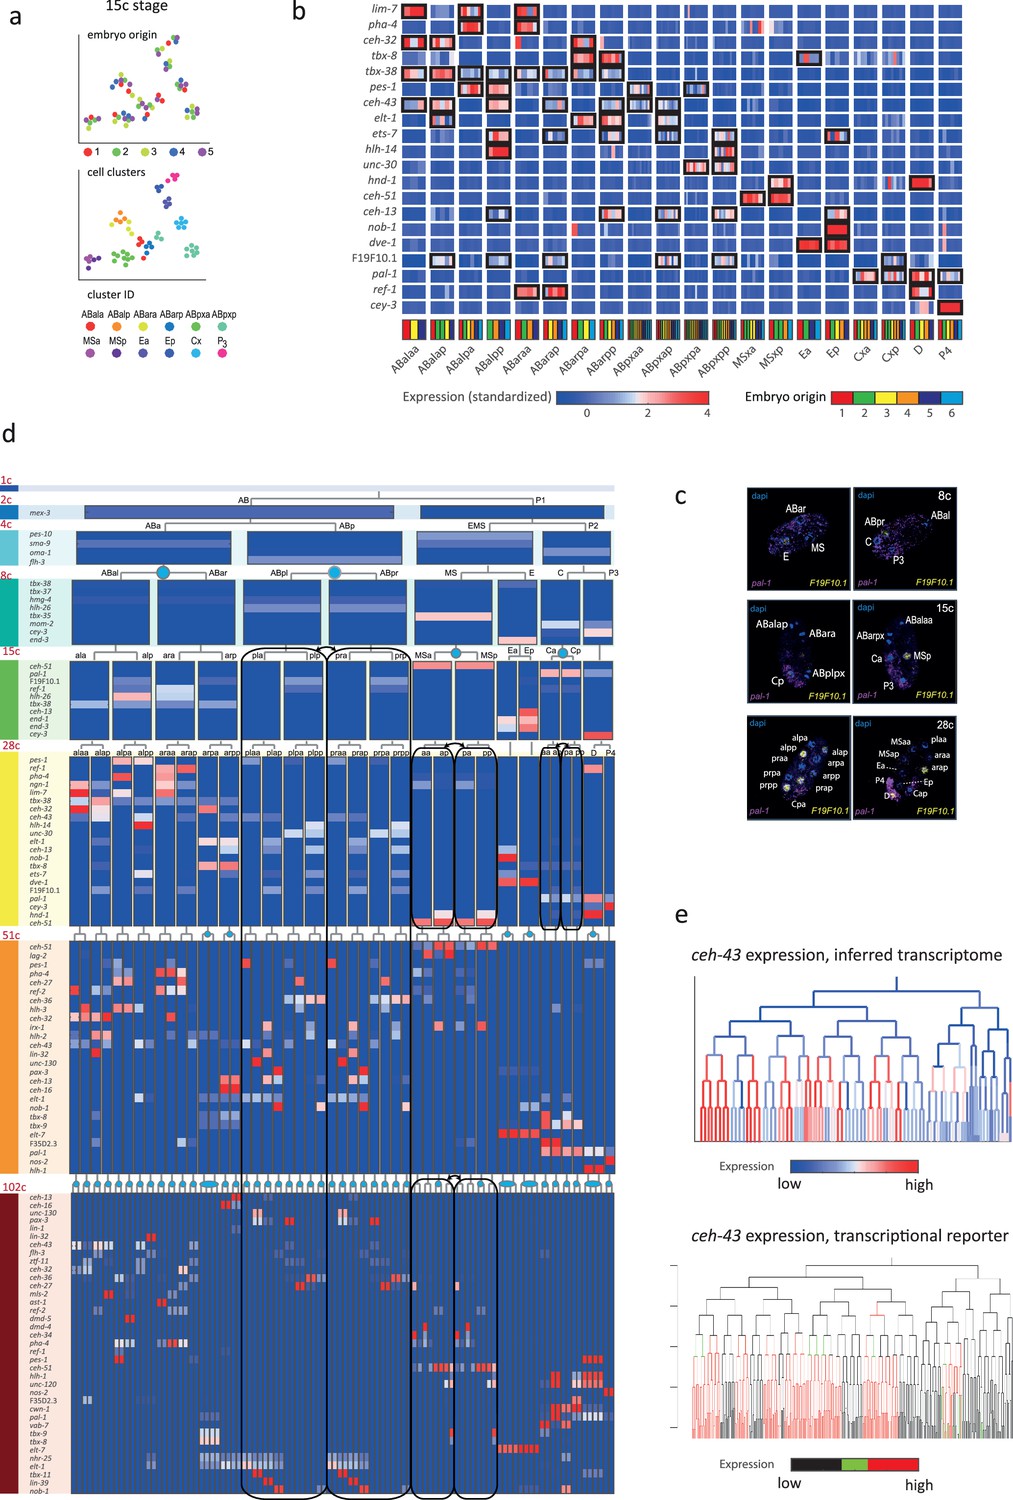
(a) t-Distributed stochastic neighbor embedding (tSNE) clusters of cells from 15-cell stage embryos, shown in terms of their embryo of origin (top), cell clustering (middle), and inferred cell identity (bottom). (b) Gene expression for the indicated genes across the assigned cell states of the 28-cell stage. Rows correspond to genes and each bar within a cell state indicates the expression level of a sample. Black boxes indicate differential gene expression. Colors in the bottom row indicate the embryo of origin. (c) Double single-molecule RNA in situ hybridization showing spatial identity of F19F10.1 expressing nuclei (yellow). The positions of all nuclei are shown with DAPI staining (blue), and the embryos were oriented with the posterior landmark gene pal-1 (purple) (Hunter and Kenyon, 1996). Cell identities were manually annotated based on previous descriptions (Supplementary file 4). (d) Average expression of cluster identity genes through the first 8 cell divisions of embryonic development. Each bar represents the inferred transcriptome of a cell state and shows the standardized expression for the indicated genes, using the same color bar as in (b). Equivalent transcriptomes derived from sister cells are indicated by blue circles. Lineage symmetry gives rise to left/right equivalence groups indicated with black boxes. (e) Expression of ceh-43 according to lineage of the inferred transcriptomes (top) and a transcriptional reporter strain (bottom), where highest expression is shown in red and no detected expression is black (see also Figure 2—figure supplement 9).
Figure 2—figure supplement 1
Sample collection and initial analysis.
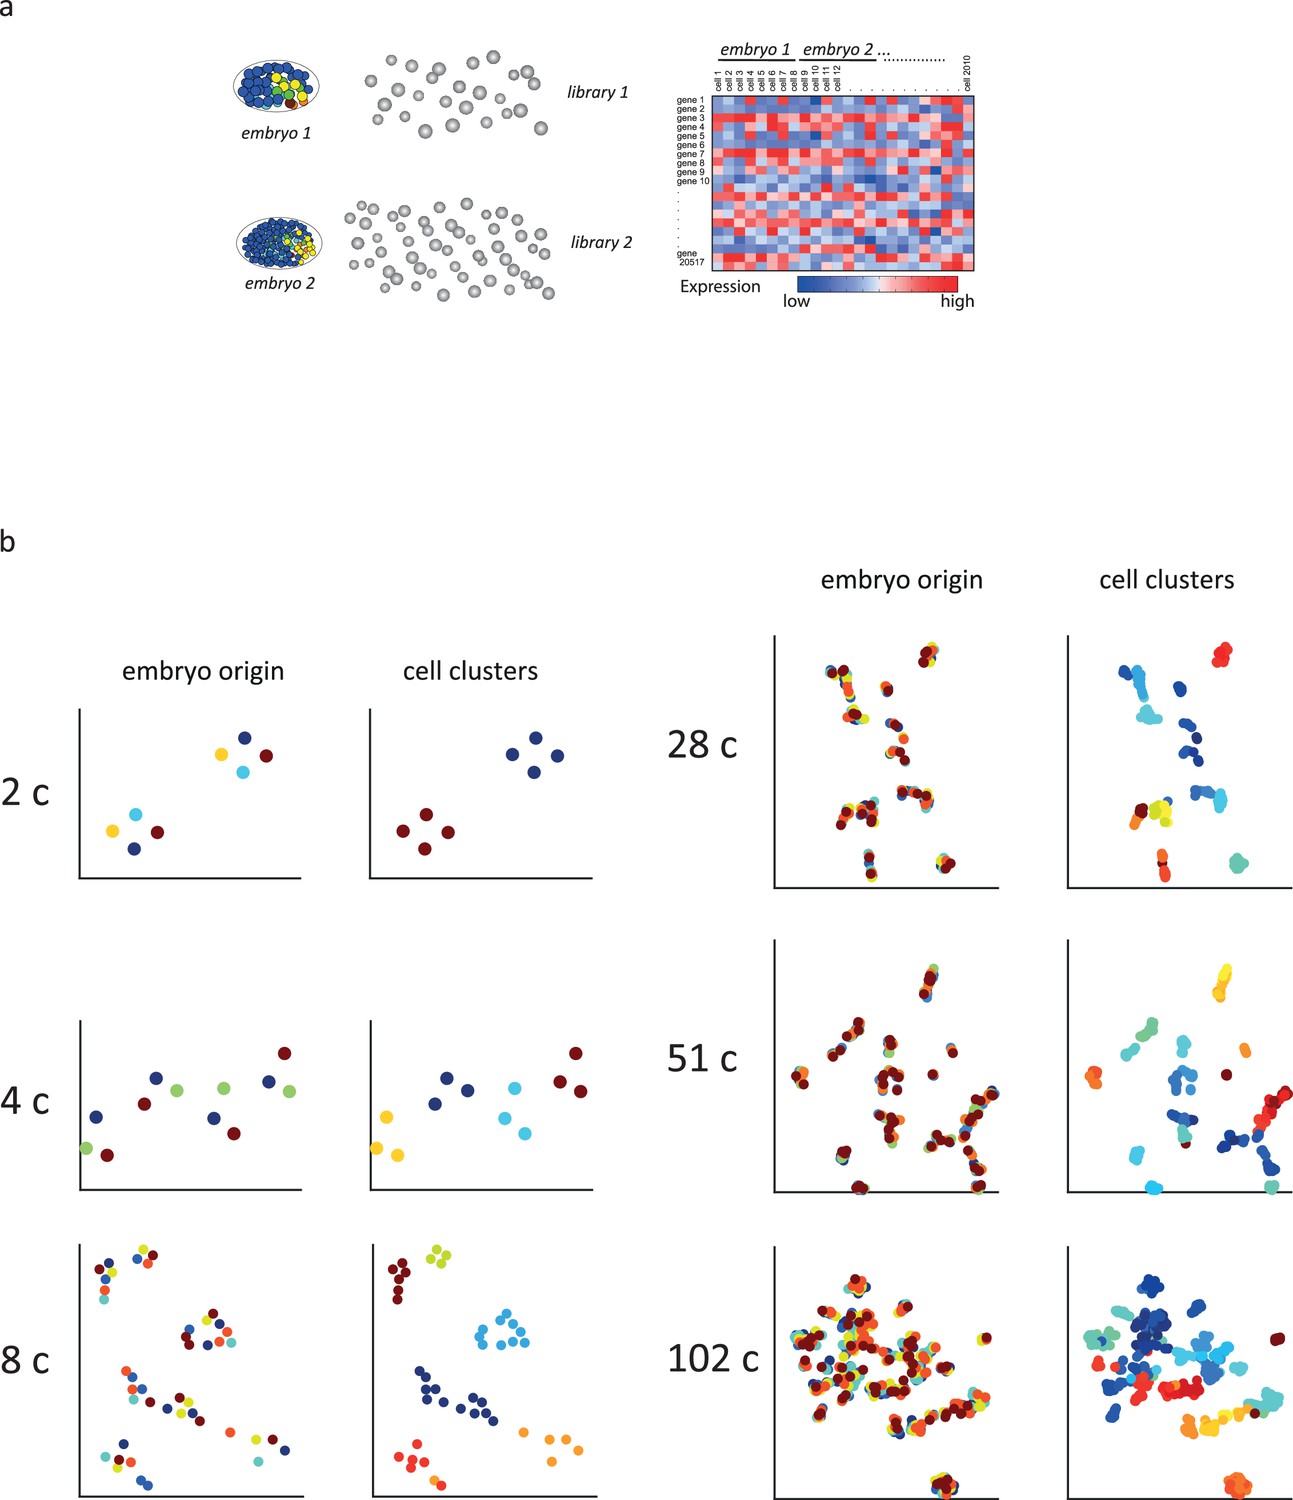
(a) A schematic indicating how transcriptomes are collected. Individual embryos are opened and the cells were manually isolated such that for each cell the embryo of origin is also recorded. (b) t-Distributed stochastic neighbor embedding (tSNE) plots for the indicated cell stages. (Left) Cells are colored by embryo of origin. (Right) Cells are colored by inferred cell fate.
Figure 2—figure supplement 2
Cell state assignment and robustness analysis.
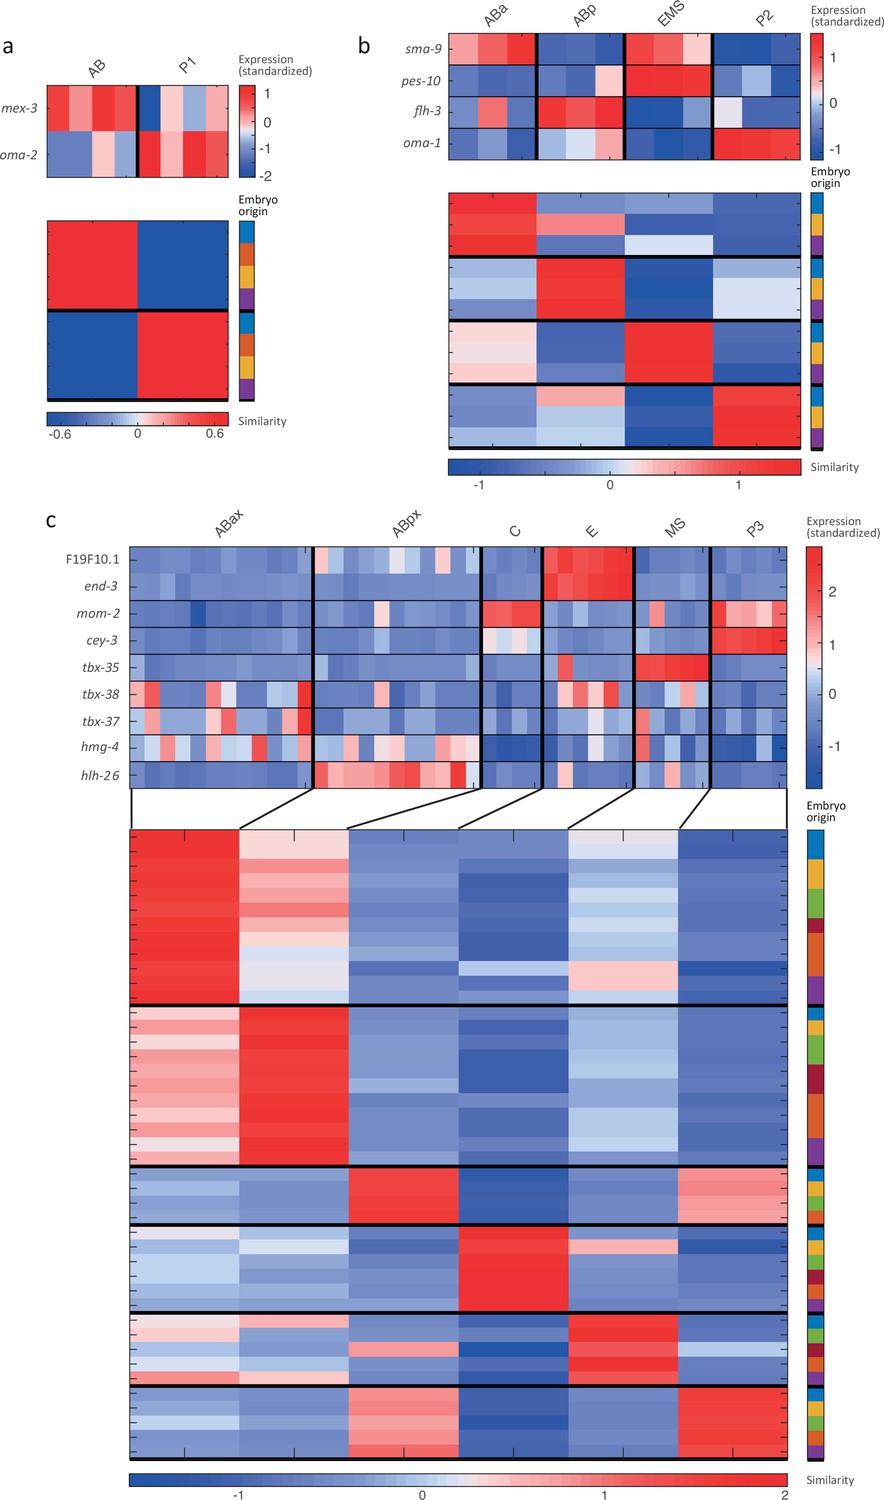
For the 2-cell (a), 4-cell (b) and 8-cell (c) stages, the two plots indicate (1) the expression of known cell state markers (Supplementary files 2 and 3) and (2) the similarity (correlation coefficient) across the cells in terms of these genes. Cells are colored by embryo of origin. Expression levels are indicated as z-scores. Cell states with a name including an ‘x’ indicate the multiple cell states with consistent name (Sulston et al., 1983). Cell similarity scores are shown by the colormap. To the right, the embryo of origin is indicated.
Figure 2—figure supplement 3
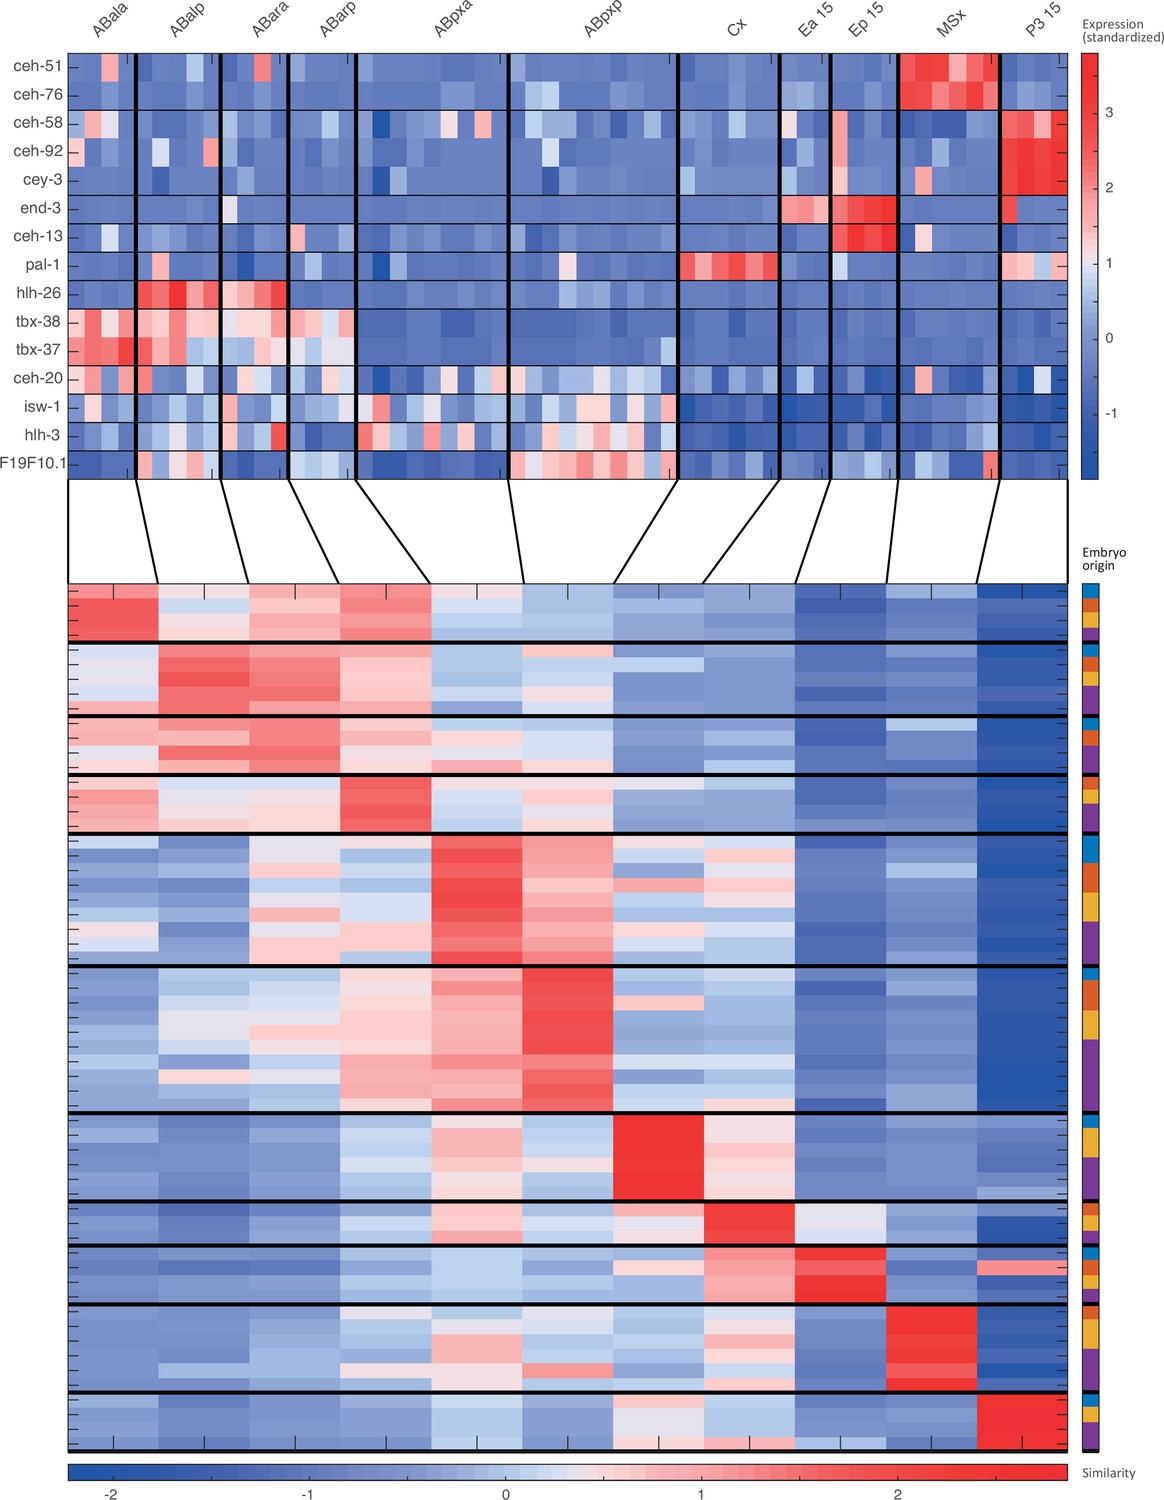
Cell state assignment and robustness analysis.
For the 15-cell stage, the two plots indicate (1) the expression of known cell state markers (Supplementary files 2 and 3) and (2) the similarity (correlation coefficient) across the cells in terms of these genes. Cells are colored by embryo of origin. Expression levels are indicated as z-scores. Cell states with a name including an ‘x’, indicate the multiple cell states with consistent name (Sulston et al., 1983). Cell similarity scores are shown by the colormap. To the right, the embryo of origin is indicated.
Figure 2—figure supplement 4
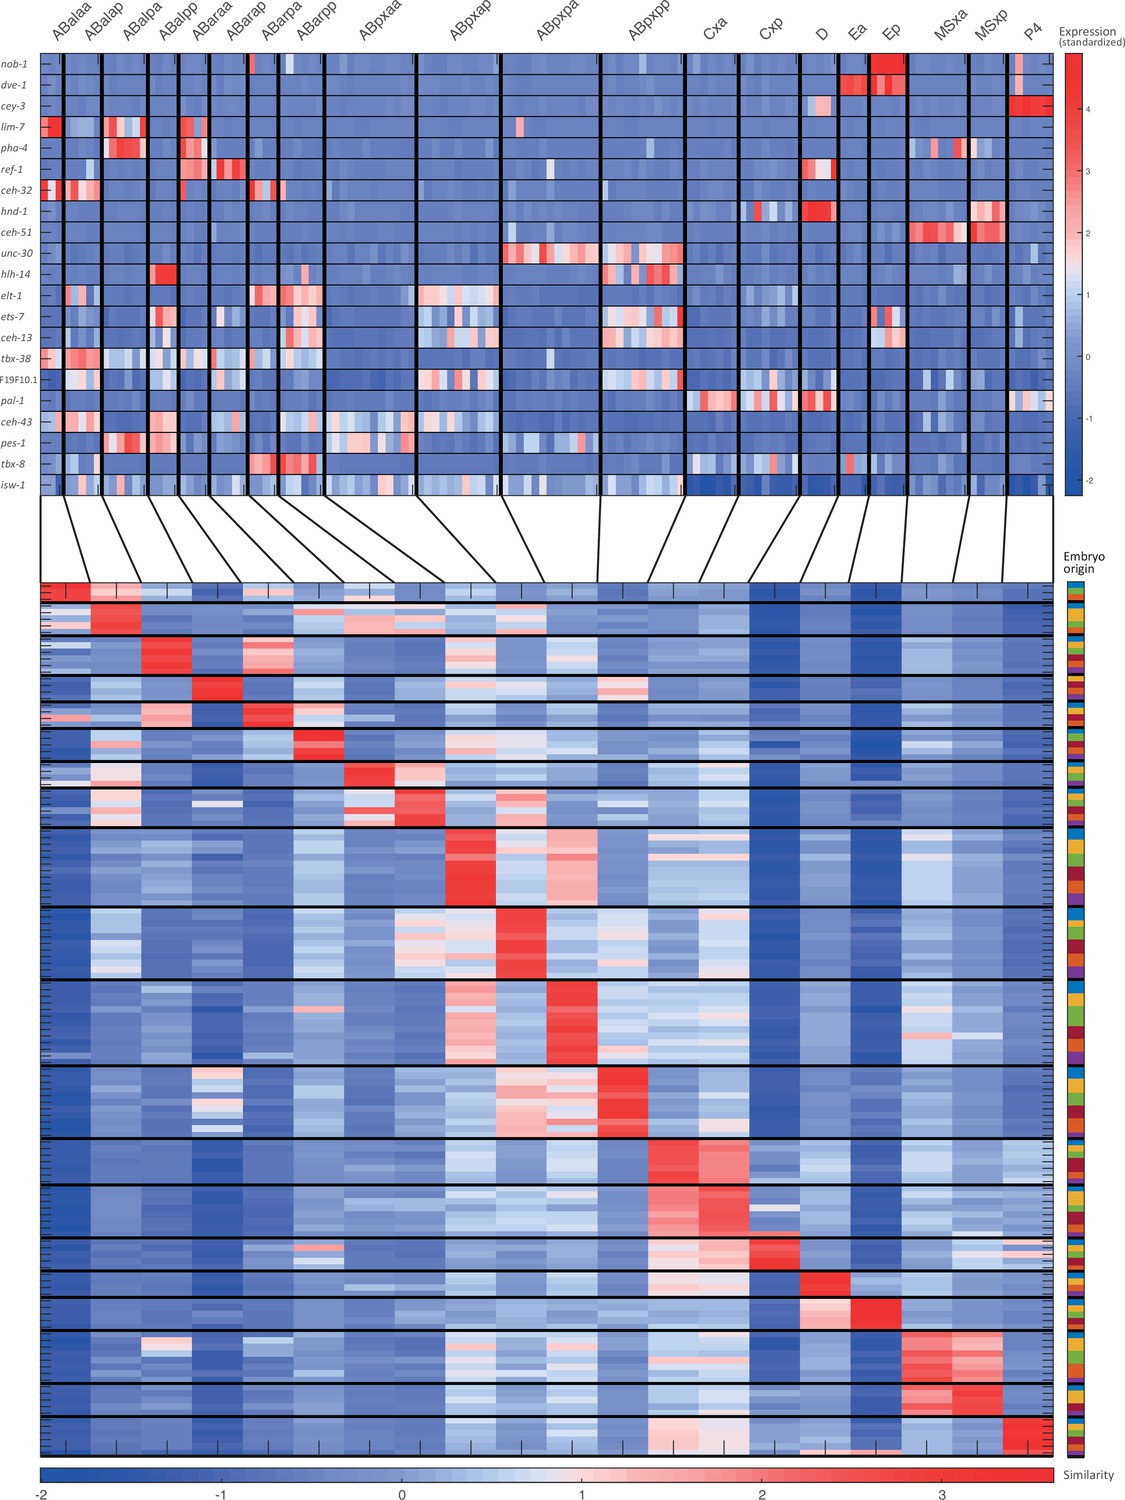
Cell state assignment and robustness analysis.
For the 28-cell stage, the two plots indicate (1) the expression of known cell state markers (Supplementary files 2 and 3) and (2) the similarity (correlation coefficient) across the cells in terms of these genes. Cells are colored by embryo of origin. Expression levels are indicated as z-scores. Cell states with a name including an ‘x’, indicate the multiple cell states with consistent name (Sulston et al., 1983). Cell similarity scores are shown by the colormap. To the right, the embryo of origin is indicated.
Figure 2—figure supplement 5
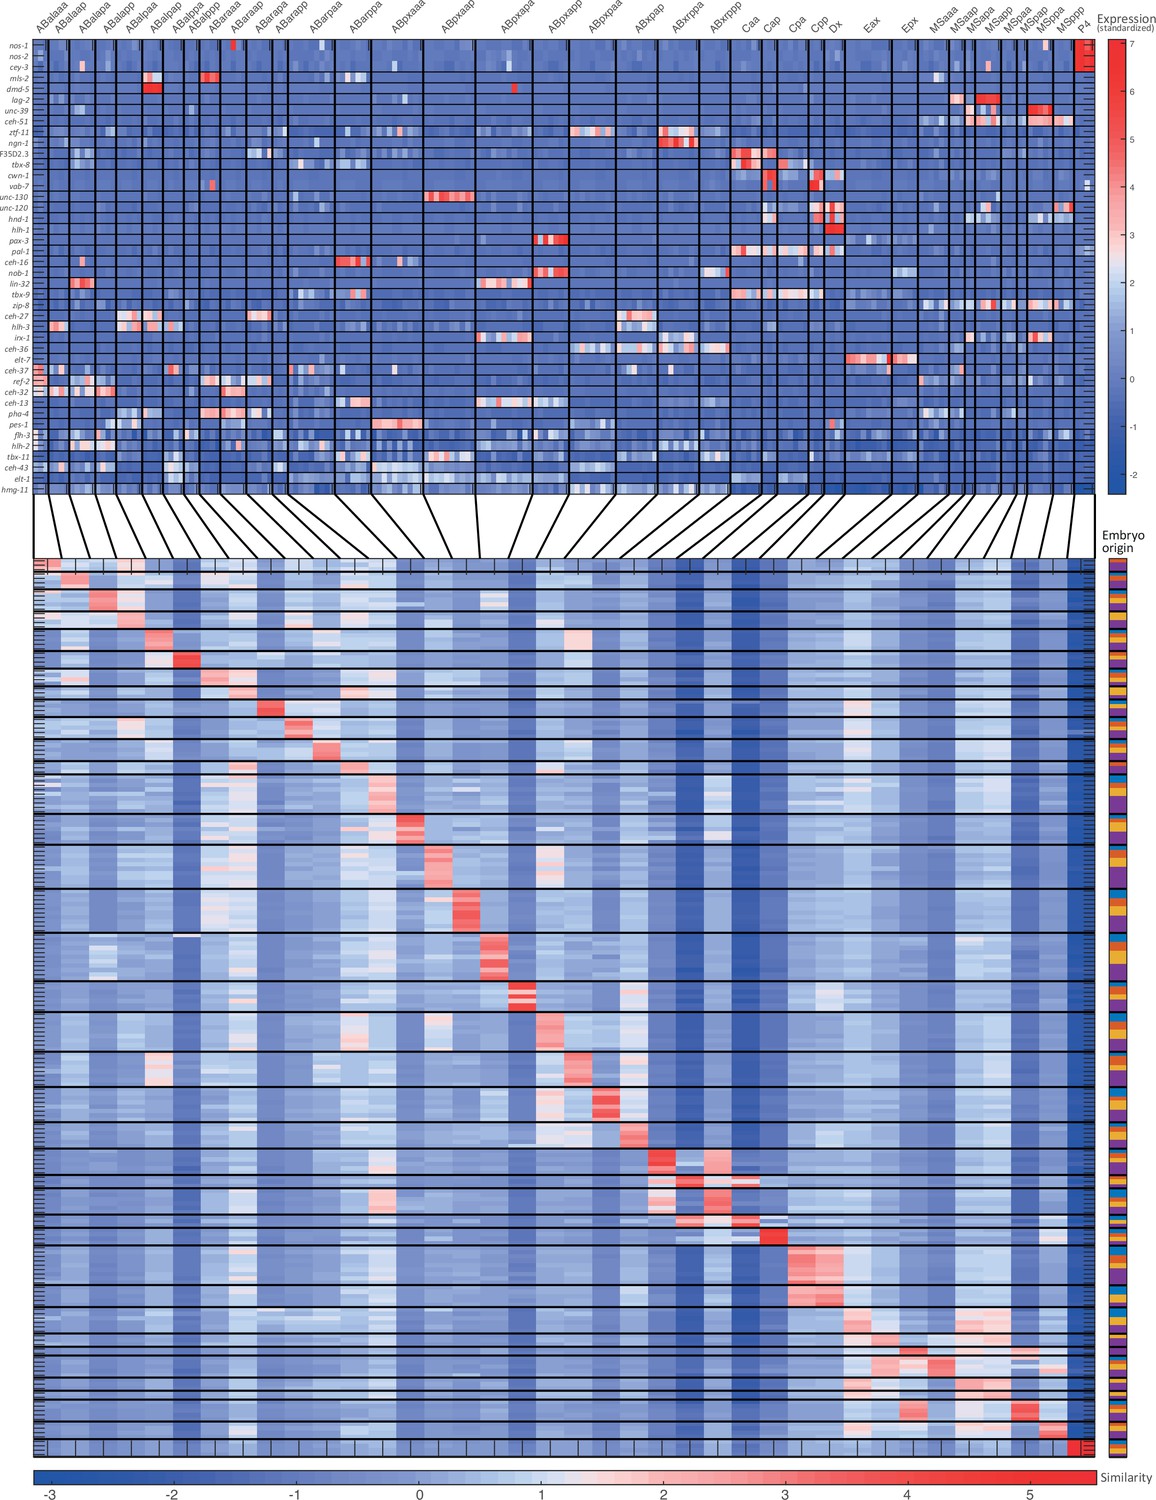
Cell state assignment and robustness analysis.
For the 51-cell stage, the two plots indicate (1) the expression of known cell state markers (Supplementary files 2 and 3) and (2) the similarity (correlation coefficient) across the cells in terms of these genes. Cells are colored by embryo of origin. Expression levels are indicated as z-scores. Cell states with a name including an ‘x’, indicate the multiple cell states with consistent name (Sulston et al., 1983). Cell similarity scores are shown by the colormap. To the right, the embryo of origin is indicated.
Figure 2—figure supplement 6
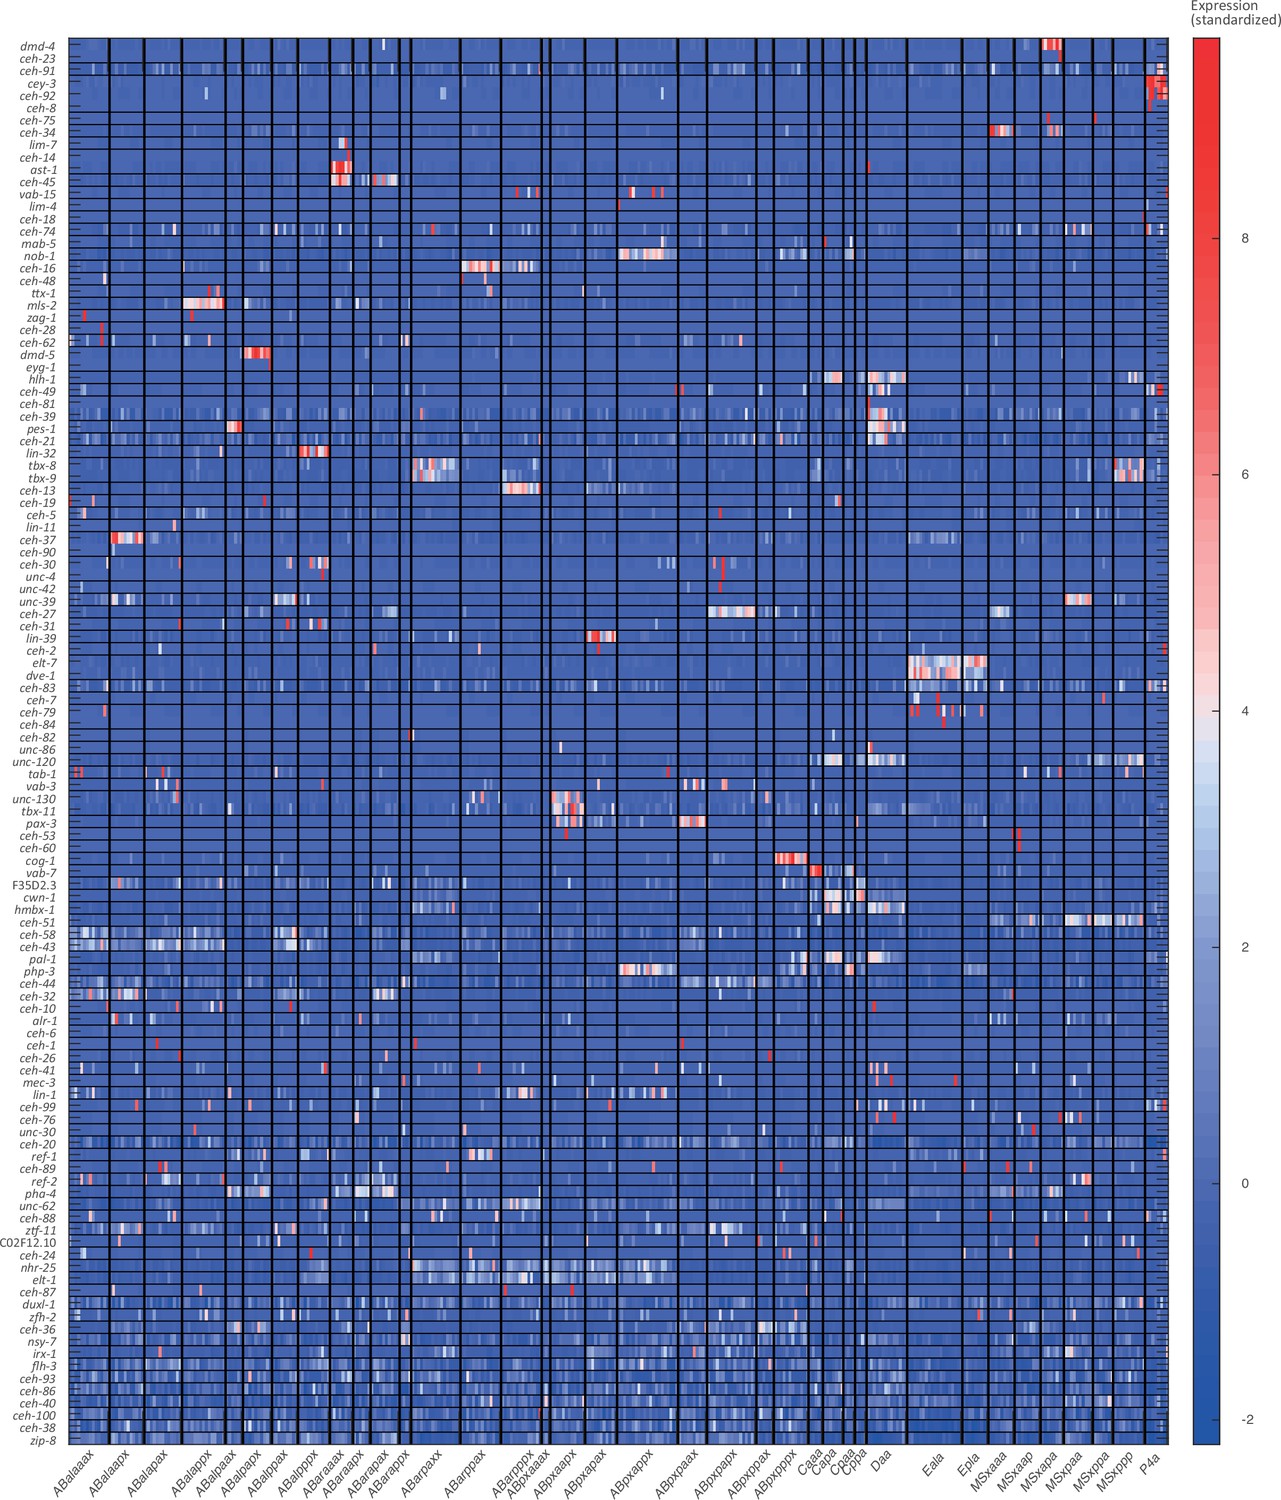
Cell state assignment and robustness analysis.
For the 102-cell stage, the expression of known cell state markers (Supplementary files 2 and 3). Expression levels are indicated as z-scores. Cell states with a name including an ‘x’, indicate the multiple cell states with consistent name (Sulston et al., 1983).
Figure 2—figure supplement 7
Cell state assignment and robustness analysis.
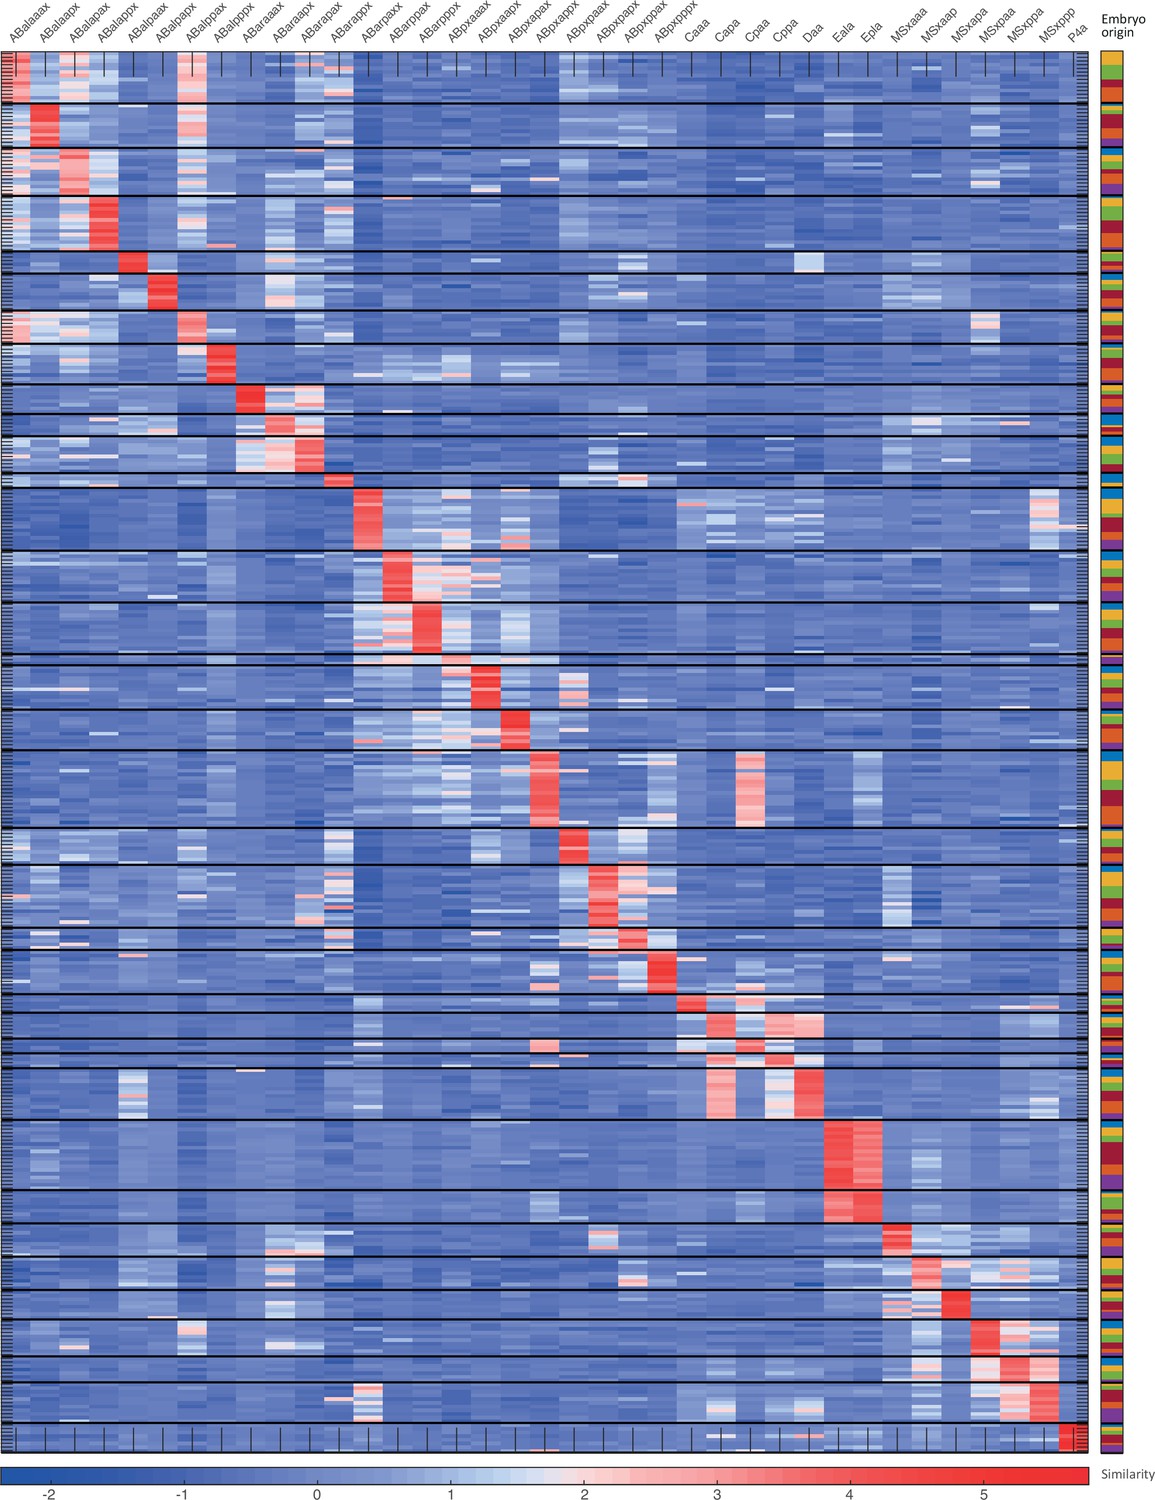
For the 102-cell stage, the similarity (correlation coefficient) across the cells in terms of the cell state markers. Cells are colored by embryo of origin. Expression levels are indicated as z-scores. Cell states with a name including an ‘x’, indicate the multiple cell states with consistent name (Sulston et al., 1983). Cell similarity scores are shown by the colormap. To the right, the embryo of origin is indicated.
Figure 2—figure supplement 8
Number of cell states detected at each of the studied stages.
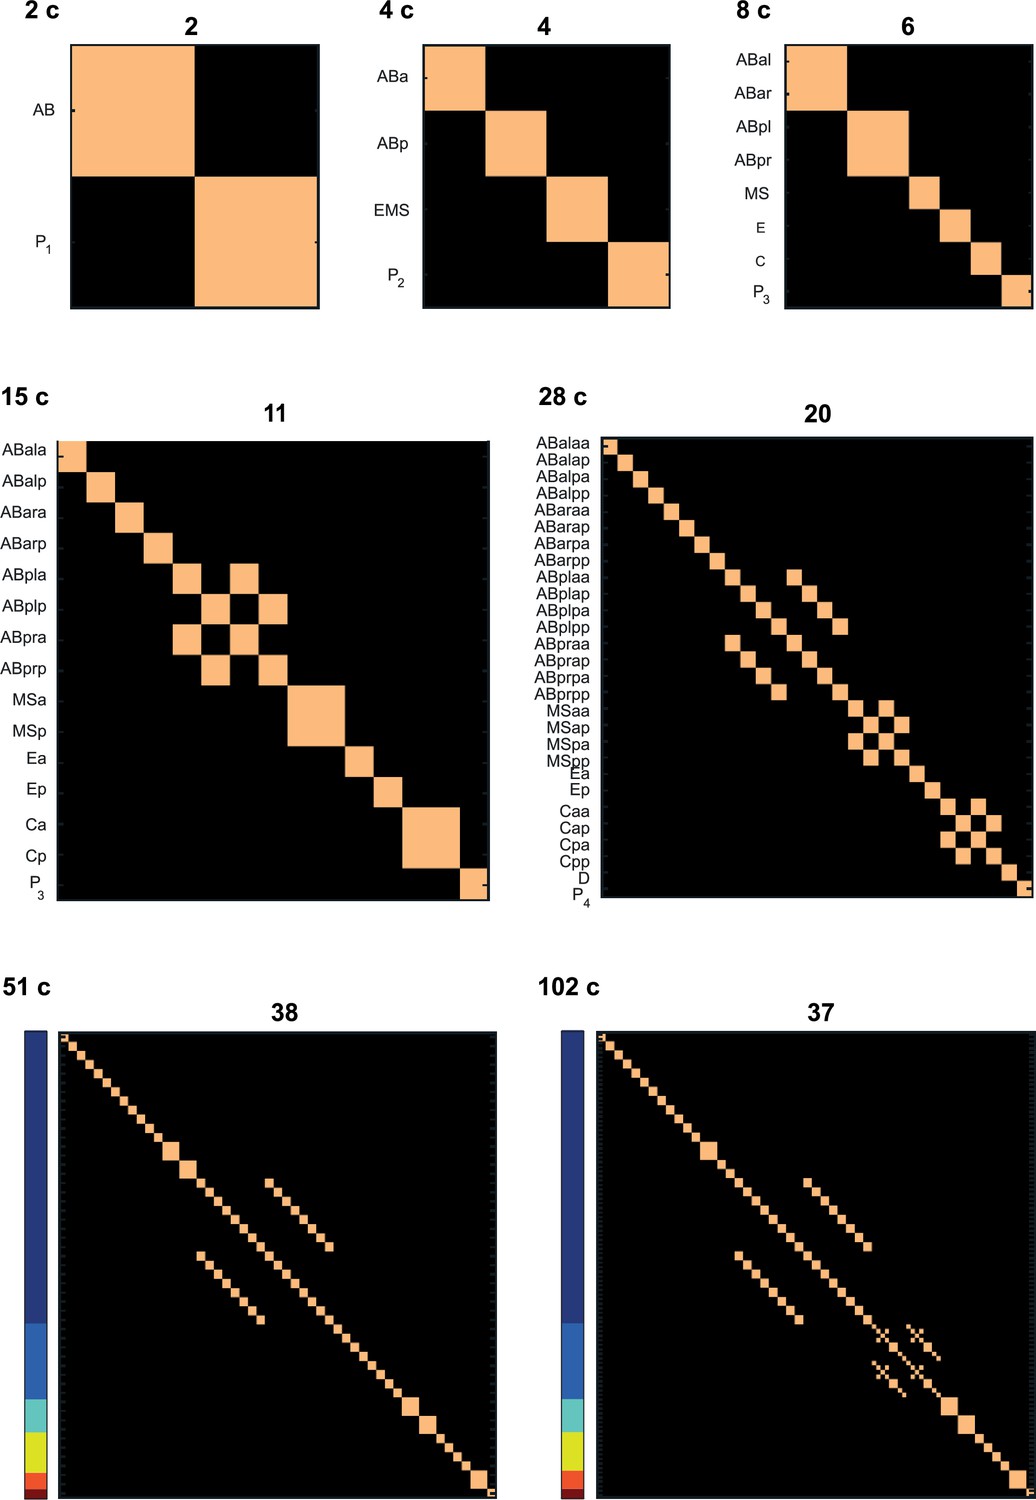
Columns and rows correspond to cell identities (both in the same order). Light and dark colors correspond to identity and distinctness. For the 51- and 102-cell stages the cells are ordered the same as in Figures 1 and 2. The number above each plot indicates the number of cell states identified at the particular stage.
Figure 2—figure supplement 9
Inferred and validated gene expression.
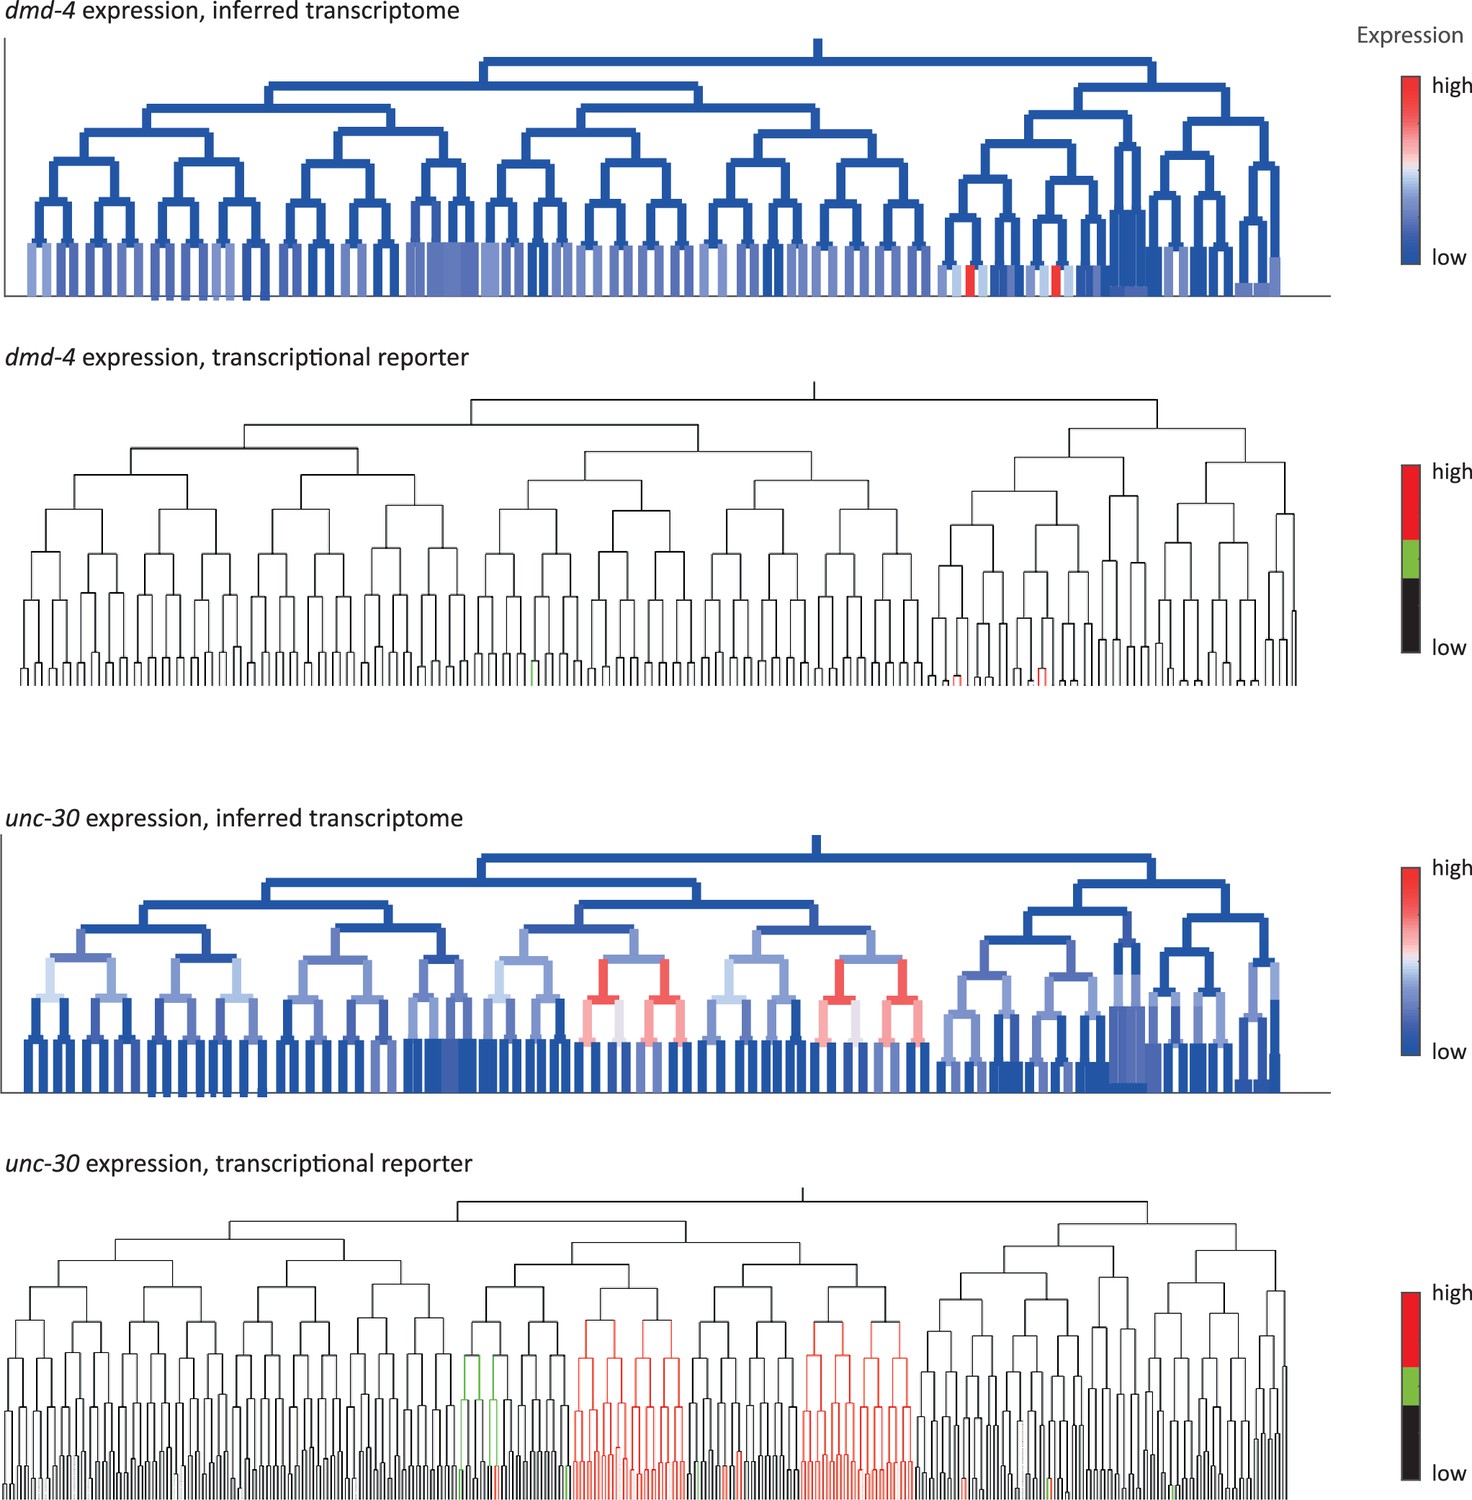
As in Figure 2d, expression of dmd-4 and unc-30 according to lineage of the inferred transcriptomes (top) and a transcriptional reporter strain (bottom), where highest expression is shown in red and no detected expression is black.
Figure 3
Transcription factor (TF) gene families have spatiotemporal specificities.
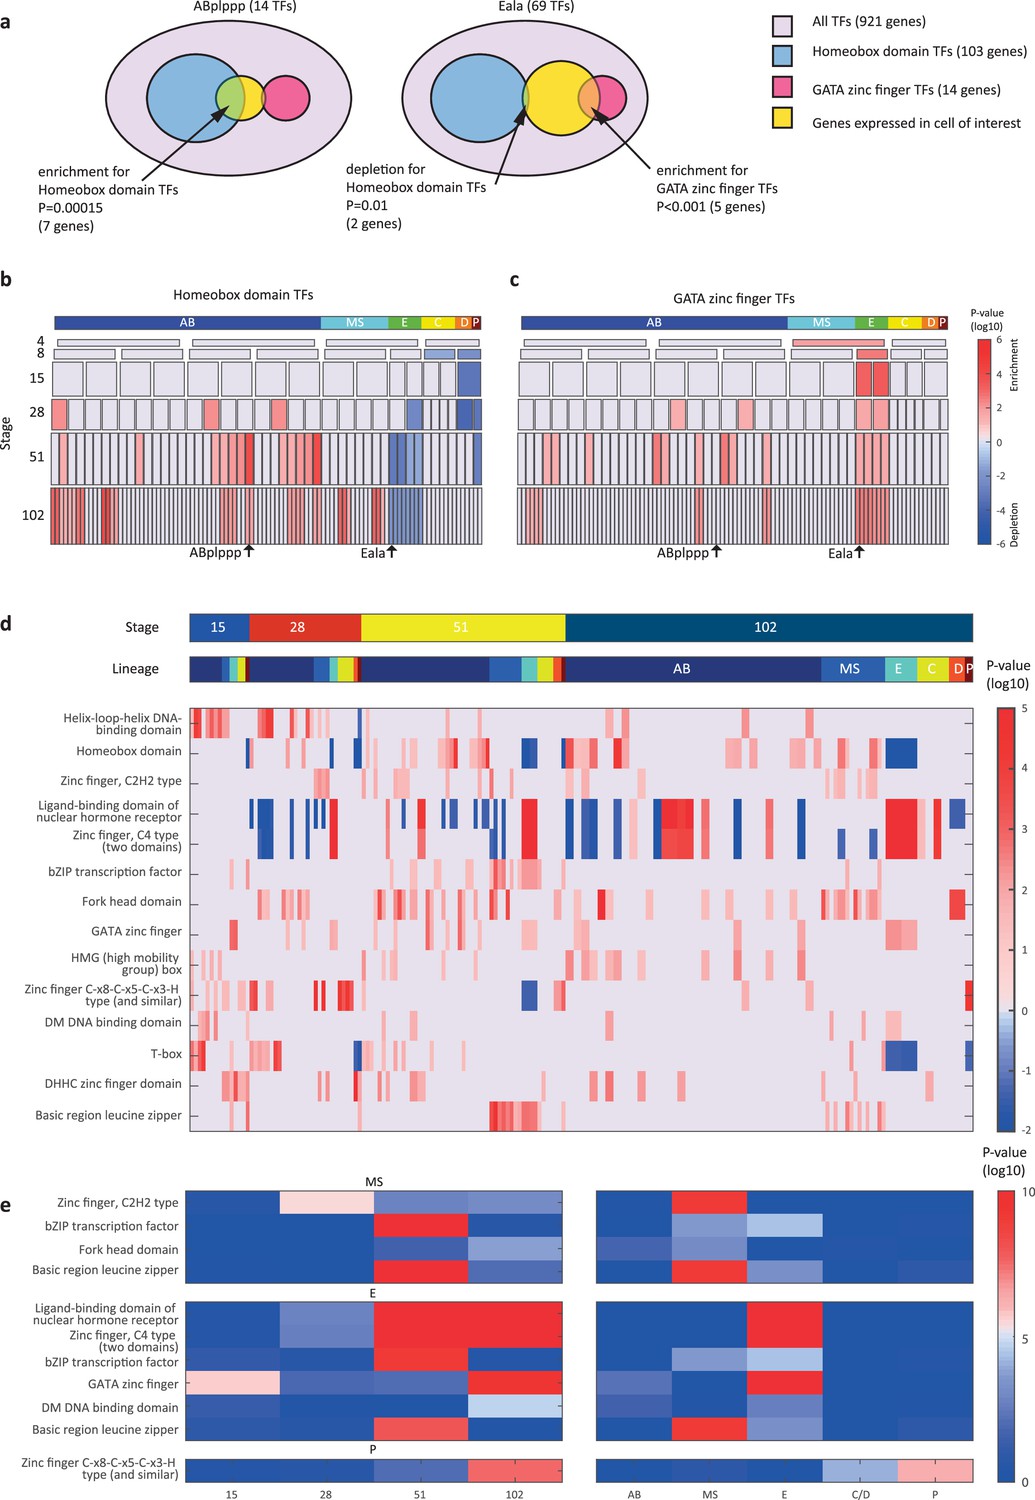
(a) Detecting enrichment and depletion of genes of the same gene family, among the TFs expressed by a cell, using the hypergeometric distribution. (b–c) For the homeobox domain (b) and GATA zinc finger domain (c) gene families, the enrichments and depletions are indicated for each cell of the lineage, plotted as in Figure 2d. (d) TF family stage and lineage enrichments. For each cell (column), the enrichment and depletion for the genes of a TF family (row) is indicated (similar to b, c). The top bars indicate the lineage and stage of the cell. (e) For the indicated TF family the significance for enrichments is shown using the t-test between the values shown in (d) for the noted stage and lineage.
Figure 4
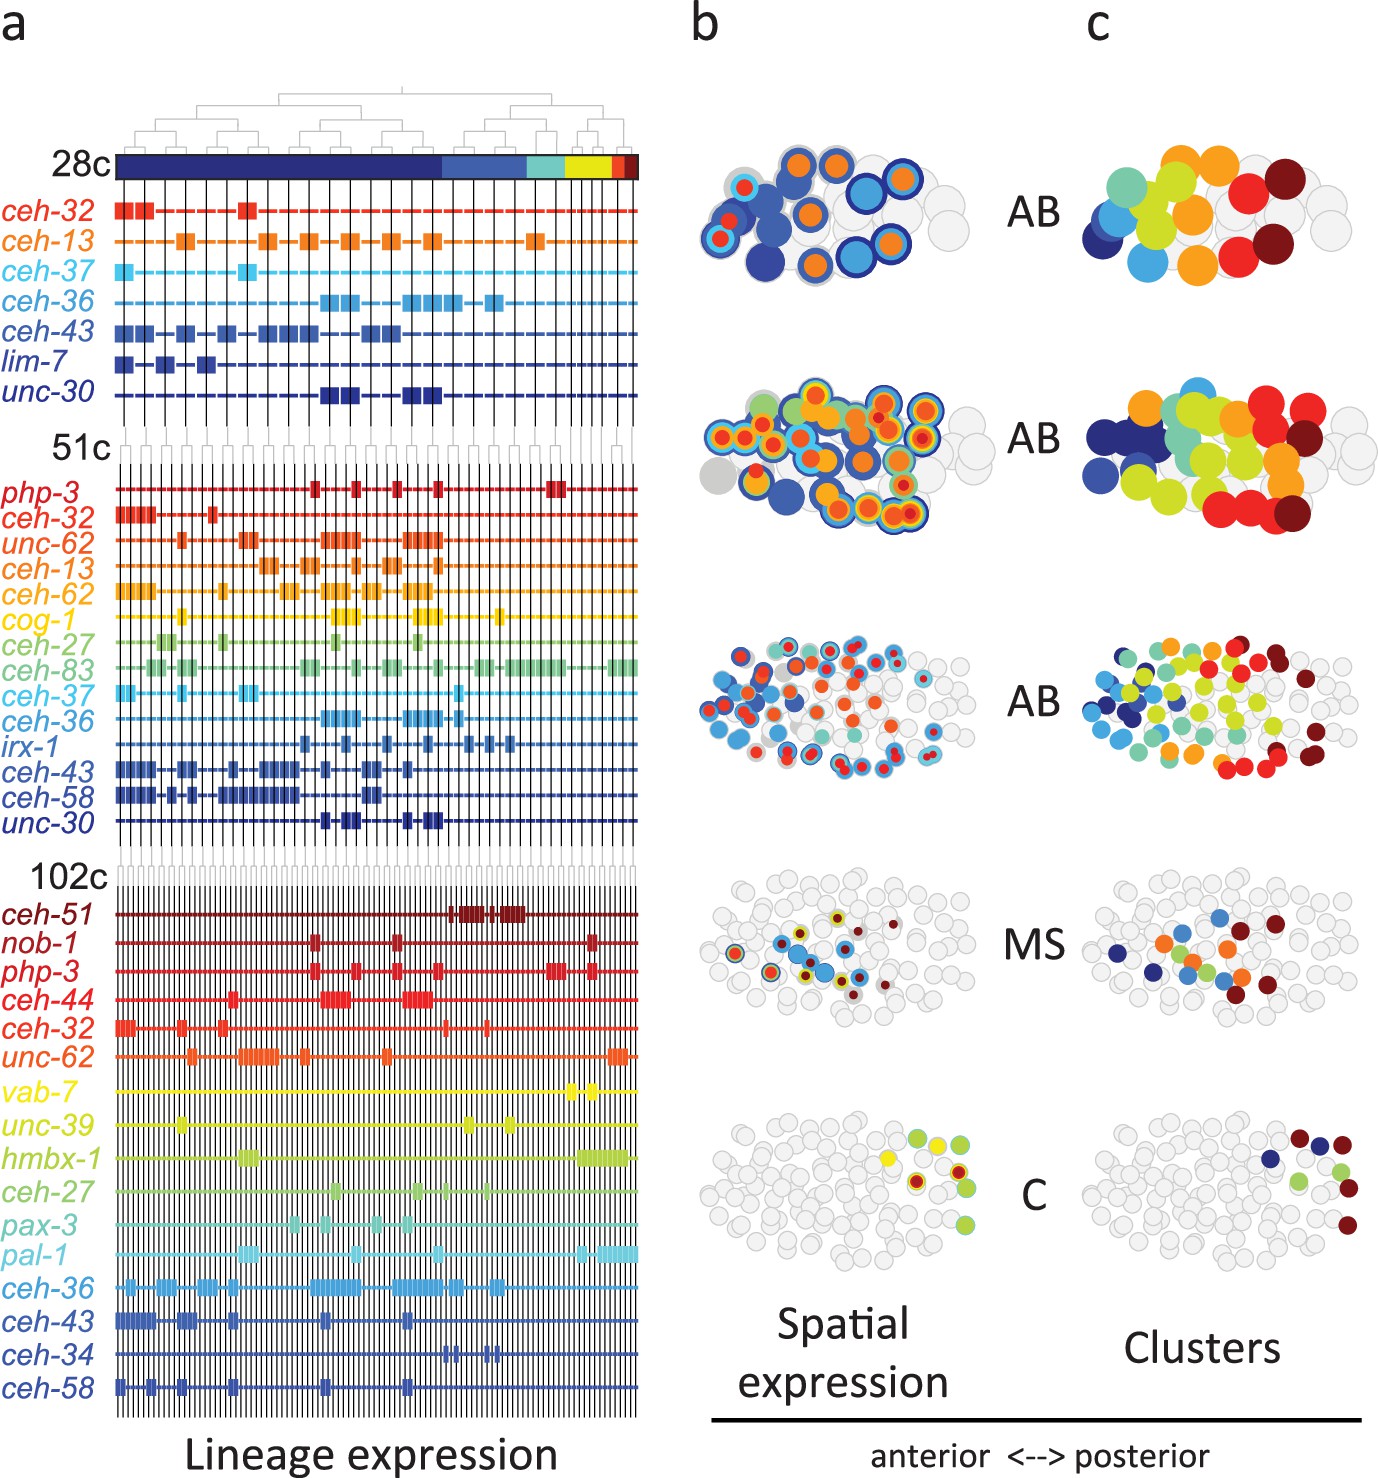
Homeodomain genes are expressed in lineage-specific stripes across the anterior-posterior axis.
(a) Lineage expression patterns for the indicated genes in the 28-, 51-, and 102-cell stage. Thick and thin lines indicate binarized ‘on’ and ‘off’ expressions, respectively. (b) Three-dimensional expression patterns separated by lineage (AB/MS/C) for the genes indicated in (a).Circles represent cells in the embryo at the particular stage examined. Expression of each gene is indicated by a circle of a different size and color. Light gray cells indicate cells in other lineages. (c) Clustering of cells according to gene expression of the indicated lineage and stage. Colors distinguish K-means clustering.
Figure 5
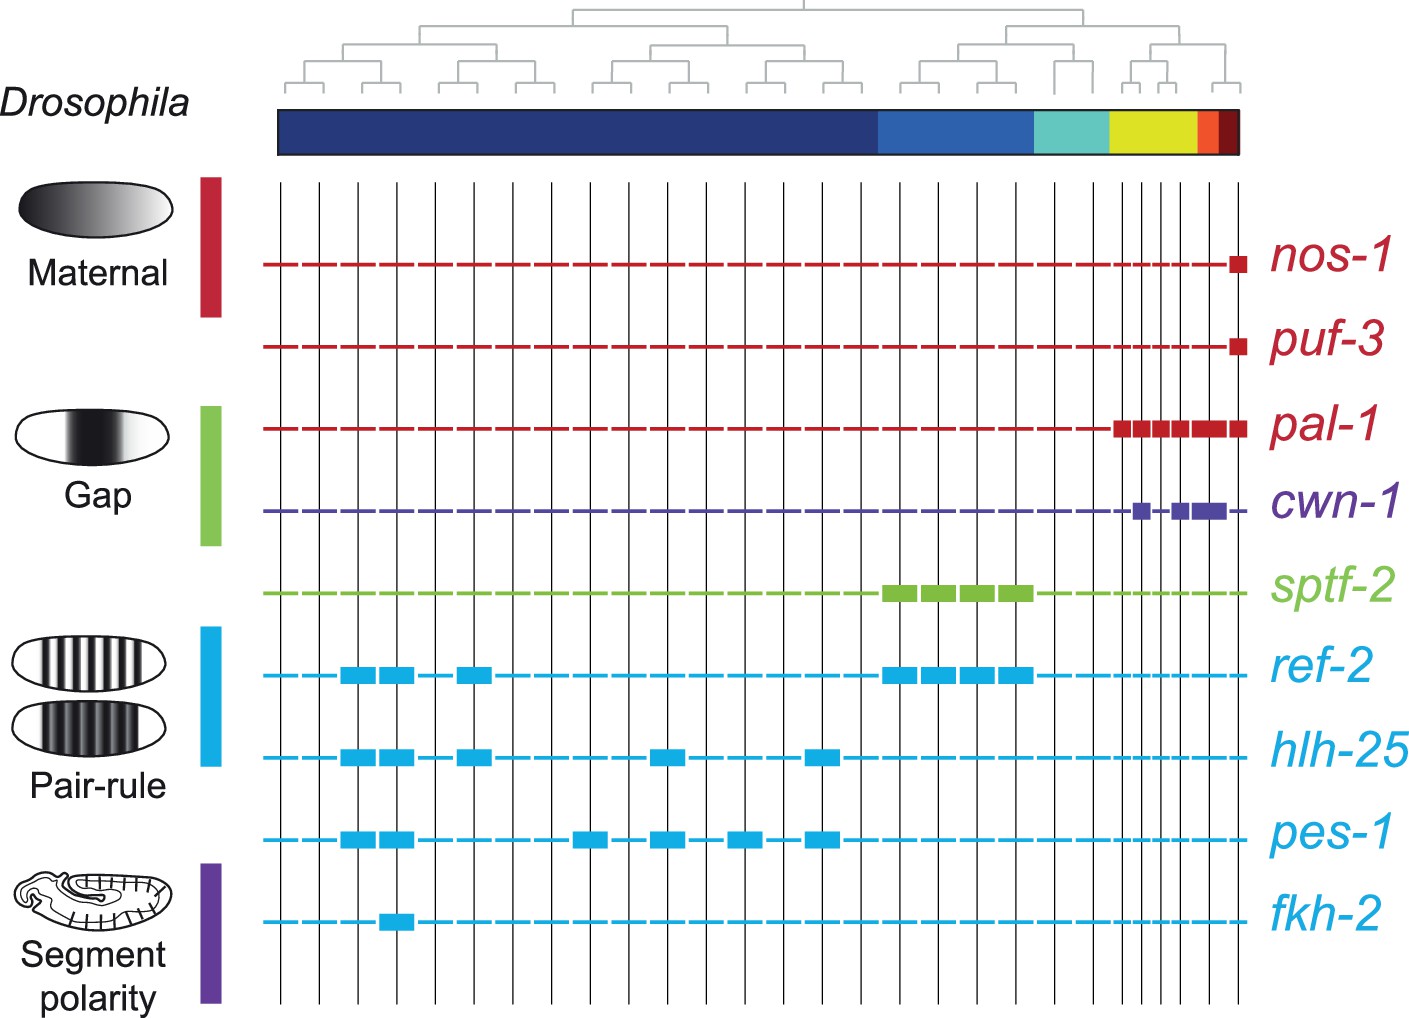
Expression of the orthologs of Drosophila specification genes in C. elegans.
Lineage expression patterns in the 28-cell stage for the indicated genes whose orthologs function as maternal, gap, pair-rule, and segment polarity genes in Drosophila. Thick and thin lines indicate binarized ‘on’ and ‘off’ differential expressions, respectively.
Additional files
-
Supplementary file 1
Characteristics of the dataset.
Rows correspond to a studied embryo. The average number of transcripts and genes detected are shown.
- https://cdn.elifesciences.org/articles/87099/elife-87099-supp1-v1.docx
-
Supplementary file 2
Gene markers from the literature.
Cell state markers for the expression profiles used for assignment were curated from the literature (da Veiga Beltrame et al., 2022) and, in particular, one large study (Murray et al., 2012).
- https://cdn.elifesciences.org/articles/87099/elife-87099-supp2-v1.docx
-
Supplementary file 3
Expression of marker genes across cell identities.
For each cell state the expression of the cell state markers used for annotation (Supplementary file 2) is indicated.
- https://cdn.elifesciences.org/articles/87099/elife-87099-supp3-v1.xlsx
-
Supplementary file 4
Inferred cell states.
Each row corresponds to 1 of the 119 inferred cell states. The third column indicates the number of samples (scRNA-Seq cells) annotated to each cell state.
- https://cdn.elifesciences.org/articles/87099/elife-87099-supp4-v1.docx
-
Supplementary file 5
Cell state assignments.
For each sample (scRNA-Seq), the table provides the GEO accession number, sample name, embryo ID, annotated cell state, and the number of transcripts detected.
- https://cdn.elifesciences.org/articles/87099/elife-87099-supp5-v1.xlsx
-
Supplementary file 6
Gene expression dataset.
For each gene, the average, standardized, differential, and standard deviation of expression is provided (see Methods) across the 119 detected cell states.
- https://cdn.elifesciences.org/articles/87099/elife-87099-supp6-v1.xlsx
-
MDAR checklist
- https://cdn.elifesciences.org/articles/87099/elife-87099-mdarchecklist1-v1.pdf
Download links
A two-part list of links to download the article, or parts of the article, in various formats.
Downloads (link to download the article as PDF)
Open citations (links to open the citations from this article in various online reference manager services)
Cite this article (links to download the citations from this article in formats compatible with various reference manager tools)
Gene regulatory patterning codes in early cell fate specification of the C. elegans embryo
eLife 12:RP87099.
https://doi.org/10.7554/eLife.87099.3


