Scn1a-GFP transgenic mouse revealed Nav1.1 expression in neocortical pyramidal tract projection neurons
- Department of Neurodevelopmental Disorder Genetics, Institute of Brain Science, Nagoya City University Graduate School of Medical Sciences, Japan
- Laboratory for Neurogenetics, RIKEN Center for Brain Science, Japan
- Department of Physiology, Nippon Medical School, Japan
- Laboratory for Behavioral Genetics, RIKEN Center for Brain Science, Japan
Abstract
Expressions of voltage-gated sodium channels Nav1.1 and Nav1.2, encoded by SCN1A and SCN2A genes, respectively, have been reported to be mutually exclusive in most brain regions. In juvenile and adult neocortex, Nav1.1 is predominantly expressed in inhibitory neurons while Nav1.2 is in excitatory neurons. Although a distinct subpopulation of layer V (L5) neocortical excitatory neurons were also reported to express Nav1.1, their nature has been uncharacterized. In hippocampus, Nav1.1 has been proposed to be expressed only in inhibitory neurons. By using newly generated transgenic mouse lines expressing Scn1a promoter-driven green fluorescent protein (GFP), here we confirm the mutually exclusive expressions of Nav1.1 and Nav1.2 and the absence of Nav1.1 in hippocampal excitatory neurons. We also show that Nav1.1 is expressed in inhibitory and a subpopulation of excitatory neurons not only in L5 but all layers of neocortex. By using neocortical excitatory projection neuron markers including FEZF2 for L5 pyramidal tract (PT) and TBR1 for layer VI (L6) cortico-thalamic (CT) projection neurons, we further show that most L5 PT neurons and a minor subpopulation of layer II/III (L2/3) cortico-cortical (CC) neurons express Nav1.1 while the majority of L6 CT, L5/6 cortico-striatal (CS), and L2/3 CC neurons express Nav1.2. These observations now contribute to the elucidation of pathological neural circuits for diseases such as epilepsies and neurodevelopmental disorders caused by SCN1A and SCN2A mutations.
Editor's evaluation
Using a newly developed Scn1a promoter driven GFP mouse line, the authors convincingly show that GFP expression largely replicates the endogenous expression of Nav1.1. Additionally, they credibly identify inhibitory and excitatory neurons in the cortex that express Nav 1.1. This mouse line provides a valuable resource, especially for epilepsy and autism research, as it offers a reliable tool that can be used to identify specific cell populations that potentially cause disease-related symptoms such as seizures, ataxia, sociability deficits, learning and memory problems, and sudden unexpected death in epilepsy.
https://doi.org/10.7554/eLife.87495.sa0Introduction
Voltage-gated sodium channels (VGSCs) play crucial roles in the generation and propagation of action potentials, contributing to excitability and information processing (Catterall, 2012). They consist of one main pore-forming alpha- and one or two subsidiary beta-subunits that regulate kinetics or subcellular trafficking of the alpha subunits. Human has nine alpha (Nav1.1–Nav1.9) and four beta (beta-1–beta-4) subunits. Among alphas, Nav1.1, Nav1.2, Nav1.3, and Nav1.6, encoded by SCN1A, SCN2A, SCN3A, and SCN8A, respectively, are expressed in central nervous system. SCN3A is mainly expressed embryonically (Brysch et al., 1991), and SCN1A, SCN2A, and SCN8A are major alphas after birth. Although these three genes show mutations in a wide spectrum of neurological diseases such as epilepsy, autism spectrum disorder (ASD), and intellectual disability, two of those, SCN1A and SCN2A, are major ones (reviewed in Yamakawa, 2016; Meisler et al., 2021). To understand the circuit basis of these diseases, it is indispensable to know the detailed distributions of these molecules in the brain.
We previously reported that expressions of Nav1.1 and Nav1.2 seem to be mutually exclusive in many brain regions (Yamagata et al., 2017). In adult neocortex and hippocampus, Nav1.1 is dominantly expressed in medial ganglionic eminence-derived parvalbumin-positive (PV-IN) and somatostatin-positive (SST-IN) inhibitory neurons (Ogiwara et al., 2007; Lorincz and Nusser, 2008; Ogiwara et al., 2013; Li et al., 2014; Tai et al., 2014; Tian et al., 2014; Yamagata et al., 2017). In the neocortex, some amount of Nav1.1 is also expressed in a distinct subset of layer V (L5) excitatory neurons (Ogiwara et al., 2013), but their natures were unknown. In the hippocampus, Nav1.1 seems to be expressed in inhibitory but not in excitatory neurons (Ogiwara et al., 2007; Ogiwara et al., 2013). In contrast, a major amount of Nav1.2 (~95%) is expressed in excitatory neurons including the most of neocortical and all of hippocampal ones, and a minor amount is expressed in caudal ganglionic eminence-derived inhibitory neurons such as vasoactive intestinal polypeptide (VIP)-positive ones (Lorincz and Nusser, 2010; Yamagata et al., 2017; Ogiwara et al., 2018). However, a recent study reported that a subpopulation (more than half) of VIP-positive inhibitory neurons is Nav1.1-positive (Goff and Goldberg, 2019).
VGSCs are mainly localized at axons and therefore it is not always easy to identify their origins, the soma. To overcome this, here in this study we generated bacterial artificial chromosome (BAC) transgenic mouse lines that express GFP under the control of Scn1a promoters, and we carefully investigated the GFP/Nav1.1 distribution in mouse brain. Our analysis confirmed that expressions of Nav1.1 and Nav1.2 are mutually exclusive and that in neocortex Nav1.1 is expressed in both inhibitory and excitatory neurons while in hippocampus only in inhibitory but totally absent in excitatory neurons. Furthermore by using a transcription factor FEZF2 (FEZ family zinc finger protein 2 transcriptional factor), also referred to as Fezl, Fez1, Zfp312, and Fez, as a marker for L5 pyramidal tract (PT) neurons (Inoue et al., 2004; Chen et al., 2005; Chen et al., 2008; Molyneaux et al., 2005; Lodato et al., 2014; Matho et al., 2021), and a transcription factor TBR1 which suppresses FEZF2 expression and therefore does not overlap with FEZF2 (Han et al., 2011; McKenna et al., 2011; Matho et al., 2021), we found that most of L5 FEZF2-positive neurons are GFP-positive while L5/6 TBR1-positive neurons are largely GFP-negative and Nav1.2-positive. These results proposed that Nav1.1 is expressed in L5 PT while Nav1.2 in L5/6 non-PT neurons such as L5/6 cortico-striatal (CS) and L6 cortico-thalamic (CT) projection neurons. A majority of L2/3 excitatory neurons express Nav1.2 but a minor subpopulation are GFP-positive, suggesting that most of cortico-cortical (CC) projection neurons express Nav1.2 but the distinct minor population express Nav1.1. These results refine the expression loci of Nav1.1 and Nav1.2 in the brain and should contribute to the understanding of circuit mechanisms for diseases caused by SCN1A and SCN2A mutations.
Results
Generation and verification of Scn1a-GFP transgenic mouse lines
Scn1a-GFP founder mice were generated from C57BL/6J zygotes microinjected with a modified Scn1a-GFP BAC construct harboring all, upstream and downstream, Scn1a promoters (Nakayama et al., 2010; Figure 1A) (see Materials and methods for details). Western blot analysis (Figure 1B) and immunohistochemistry (Figure 1—figure supplement 1) showed robust GFP expression and mostly normal expression levels of Nav1.1 in Scn1a-GFP mouse lines #184 and #233. Both lines showed a similar distribution of chromogenic GFP immunosignals across the entire brain (Figure 2A–H), and a similar distribution was also obtained in fluorescence detection of GFP (Figure 2I–L and Figure 2—figure supplement 1). In neocortex (Figure 2B, F, J and Figure 2—figure supplement 1B, F), GFP-positive cells were distributed throughout all cortical layers. In hippocampus (Figure 2C, G, K and Figure 2—figure supplement 1C, G), cells with intense GFP signals, which are assumed to be PV-IN and SST-IN (Ogiwara et al., 2007; Tai et al., 2014) (see also Figure 8), were scattered in stratum oriens, pyramidale, radiatum, lucidum, and lacunosum-moleculare of the CA (cornu ammonis) fields, hilus and molecular layer of dentate gyrus. Of note, somata of dentate granule cells were apparently GFP-negative. CA1–3 pyramidal cells were twined around with fibrous GFP immunosignals. We previously reported that the fibrous Nav1.1 signals clinging to somata of hippocampal CA1–3 pyramidal cells were disappeared by conditional elimination of Nav1.1 in PV-INs but not in excitatory neurons, and therefore concluded that these Nav1.1-immunopositive fibers are axon terminals of PV-INs (Ogiwara et al., 2013). As such, GFP signals are fibrous but do not form cell shapes in the CA pyramidal cell layer (Figure 2C, G, K and Figure 2—figure supplement 1C, G), and therefore these CA pyramidal cells themselves are assumed to be GFP-negative. These observations further confirmed our previous proposal that hippocampal excitatory neurons are negative for Nav1.1 (Ogiwara et al., 2007; Ogiwara et al., 2013). In cerebellum (Figure 2D, H, L and Figure 2—figure supplement 1D, H), GFP signals appeared in Purkinje, basket, and deep cerebellar nuclei cells, again consistent to the previous reports (Ogiwara et al., 2007; Ogiwara et al., 2013). In the following analyses, we used the line #233 which shows stronger GFP signals than #184.
Figure 1 with 1 supplement see all
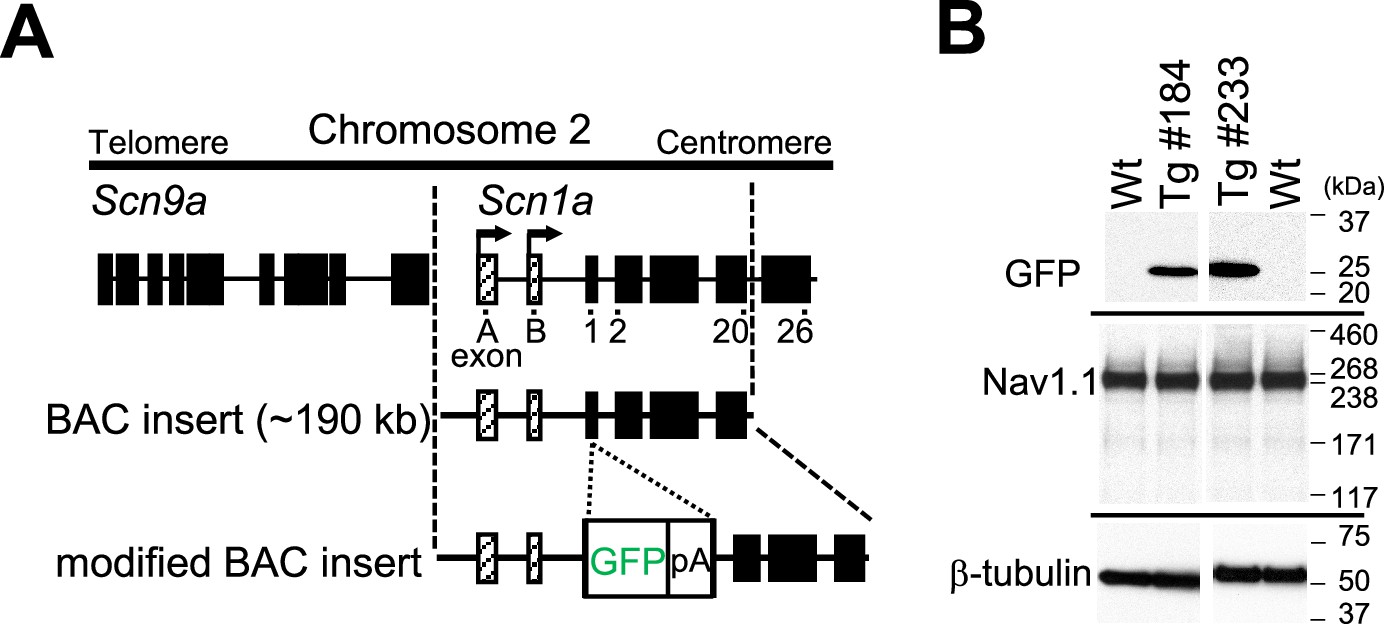
Generation of Scn1a-GFP mice.
(A) Schematic representation of the modified bacterial artificial chromosome (BAC) construct containing the Scn1a-GFP transgene. A green fluorescent protein (GFP) reporter cassette consisting of GFP cDNA and a polyadenylation signal was inserted at the ATG initiation codon in the coding exon 1 of Scn1a. Filled and hatched boxes indicate the coding and non-coding exons of Scn9a and Scn1a. Arrows indicate the start sites and orientation of transcription of Scn1a. (B) Western blot analysis for Scn1a-GFP and endogenous Nav1.1. The whole cytosolic fractions from 5W Scn1a-GFP brains (lines #184 and #233) were probed with anti-GFP and their membrane fractions were probed with anti-Nav1.1 antibodies. β-Tubulin was used as an internal control. pA, polyadenylation signal; Tg, hemizygous Scn1a-GFP transgenic mice; Wt, wild-type littermates.
-
Figure 1—source data 1
Raw and annotated immunoblots for Figure 1B.
- https://cdn.elifesciences.org/articles/87495/elife-87495-fig1-data1-v1.zip
Figure 2 with 2 supplements see all
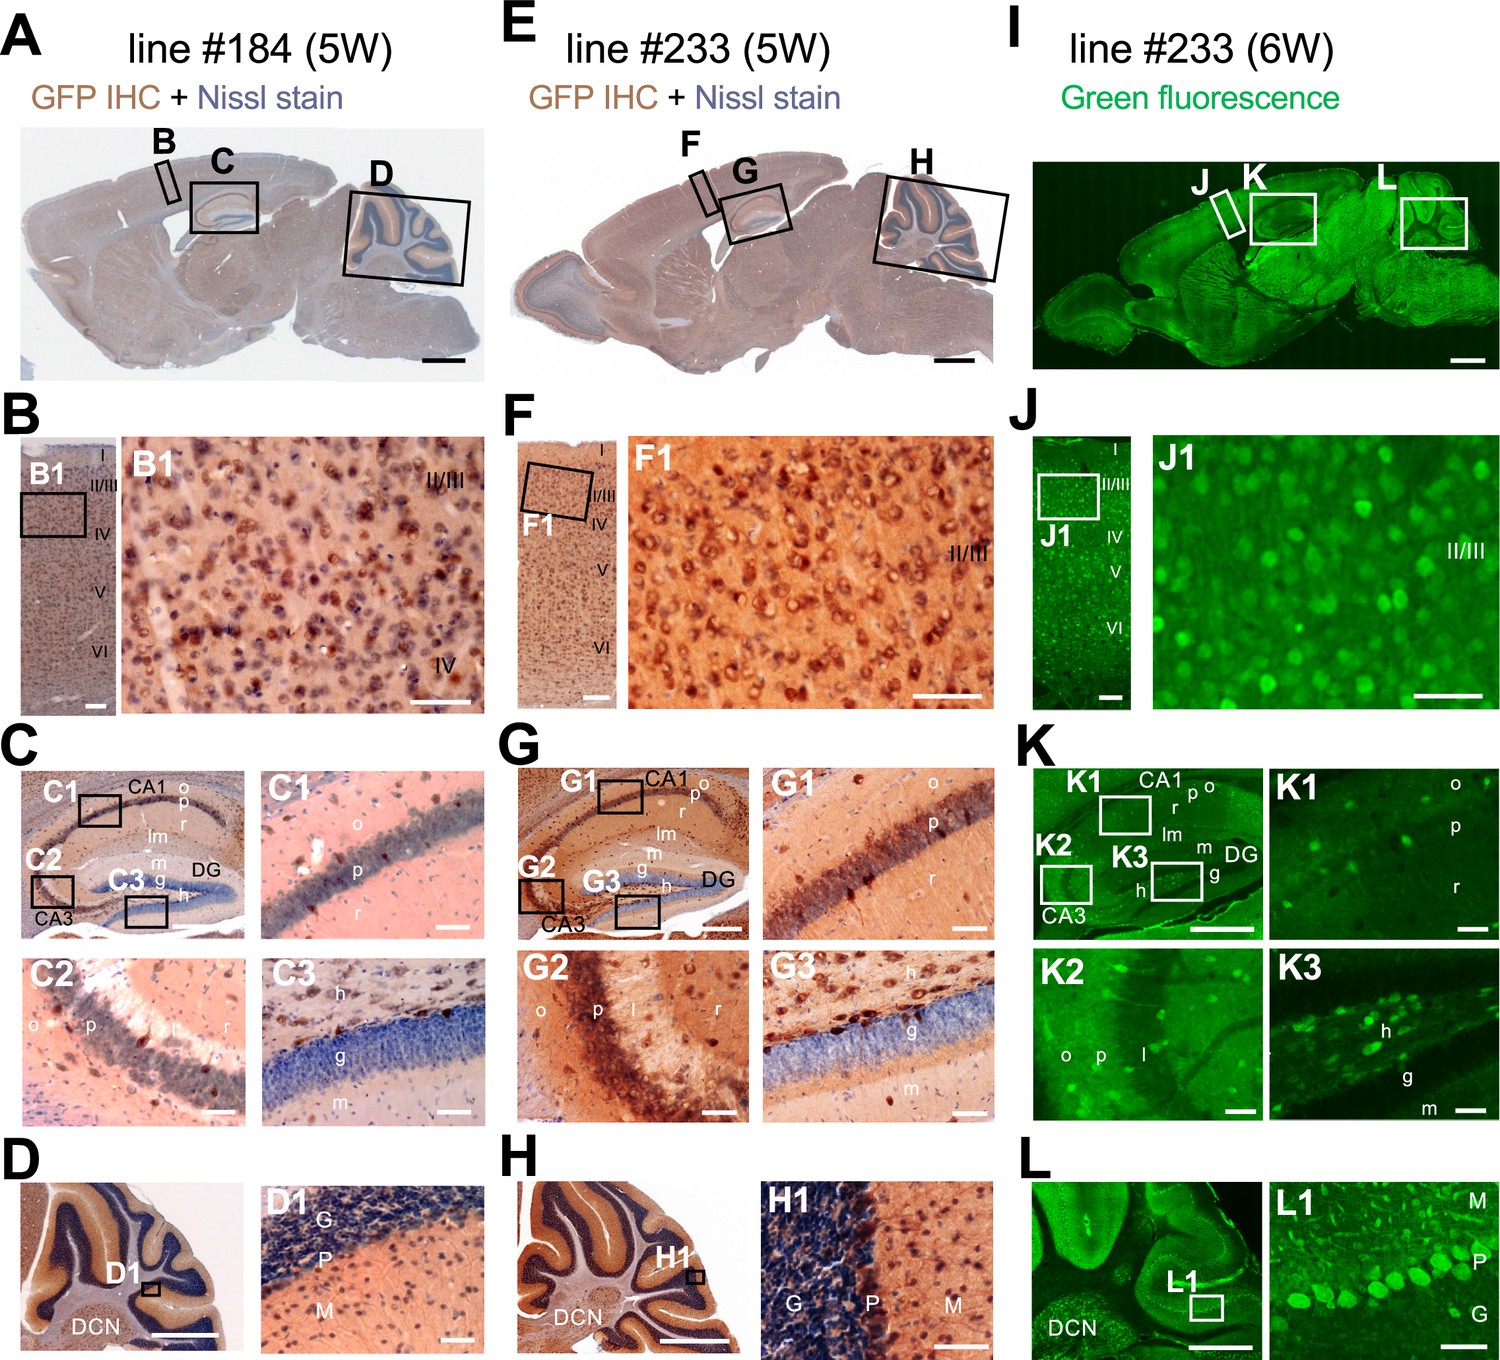
Distributions of green fluorescent protein (GFP) signals in brains are similar among Scn1a-GFP mouse lines.
Chromogenic immunostaining of GFP (brown) with Nissl counterstaining (violet) of lines #184 and #233 (A–H) and GFP fluorescence images of line #233 (I–L) on parasagittal sections from 5W to 6W Scn1a-GFP brains. Boxed areas in (A, E, I, B, F, J, C, G, K, D, H, L) are magnified in (B–D, F–H, J–L, B1, F1, J1, C1–3, G1–3, K1–3, D1, H1, L1). The two lines (#184 and #233) showed a similar distribution pattern of GFP-expressing cells across all brain regions (A–H), but the signals in the line #233 are more intense than the line #184. In neocortex (B, F, J), GFP-expressing cells were scattered throughout the entire region. In the hippocampus (C, G, K), GFP-positive inhibitory neurons were sparsely distributed (see also Figure 8), while excitatory neurons in stratum pyramidale and stratum granulosum are GFP-negative. In cerebellum (D, H, L), Purkinje, basket, and deep cerebellar nuclei cells were GFP-positive. IHC, immunohistochemistry; CA, cornu ammonis; DG, dentate gyrus; o, stratum oriens; p, stratum pyramidale; r, stratum radiatum; lm, stratum lacunosum-moleculare; l, stratum lucidum; m, stratum moleculare; g, stratum granulosum; h, hilus; DCN, deep cerebellar nuclei; M, molecular layer; P, Purkinje cell layer; G, granular cell layer. Scale bars: 1 mm (A, E, I), 500 µm (C, D, G, H, K, L), 100 µm (B, F, J), and 50 µm (B1, C1–3, D1, F1, G1–3, H1, J1, K1–3, L1).
Quantification of Nav1.1 signals in western blot analyses of brain lysates from the Scn1a-GFP mice and their wild-type littermates (N = 5 animals per each genotype) showed no difference between genotypes, while that of GFP somehow deviated among individual Scn1a-GFP mice (Figure 2—figure supplement 2). Fluorescence imaging of the Scn1a-GFP sagittal brain sections at postnatal day 15 (P15), 4-week-old (4W) and 8W showed that GFP signals continue to be intense in caudal region such as thalamus, midbrain, and brainstem (Figure 3), which is well consistent with our previous report of Nav1.1 protein and Scn1a mRNA distributions in wild-type mouse brain (Ogiwara et al., 2007).
Figure 3 with 2 supplements see all
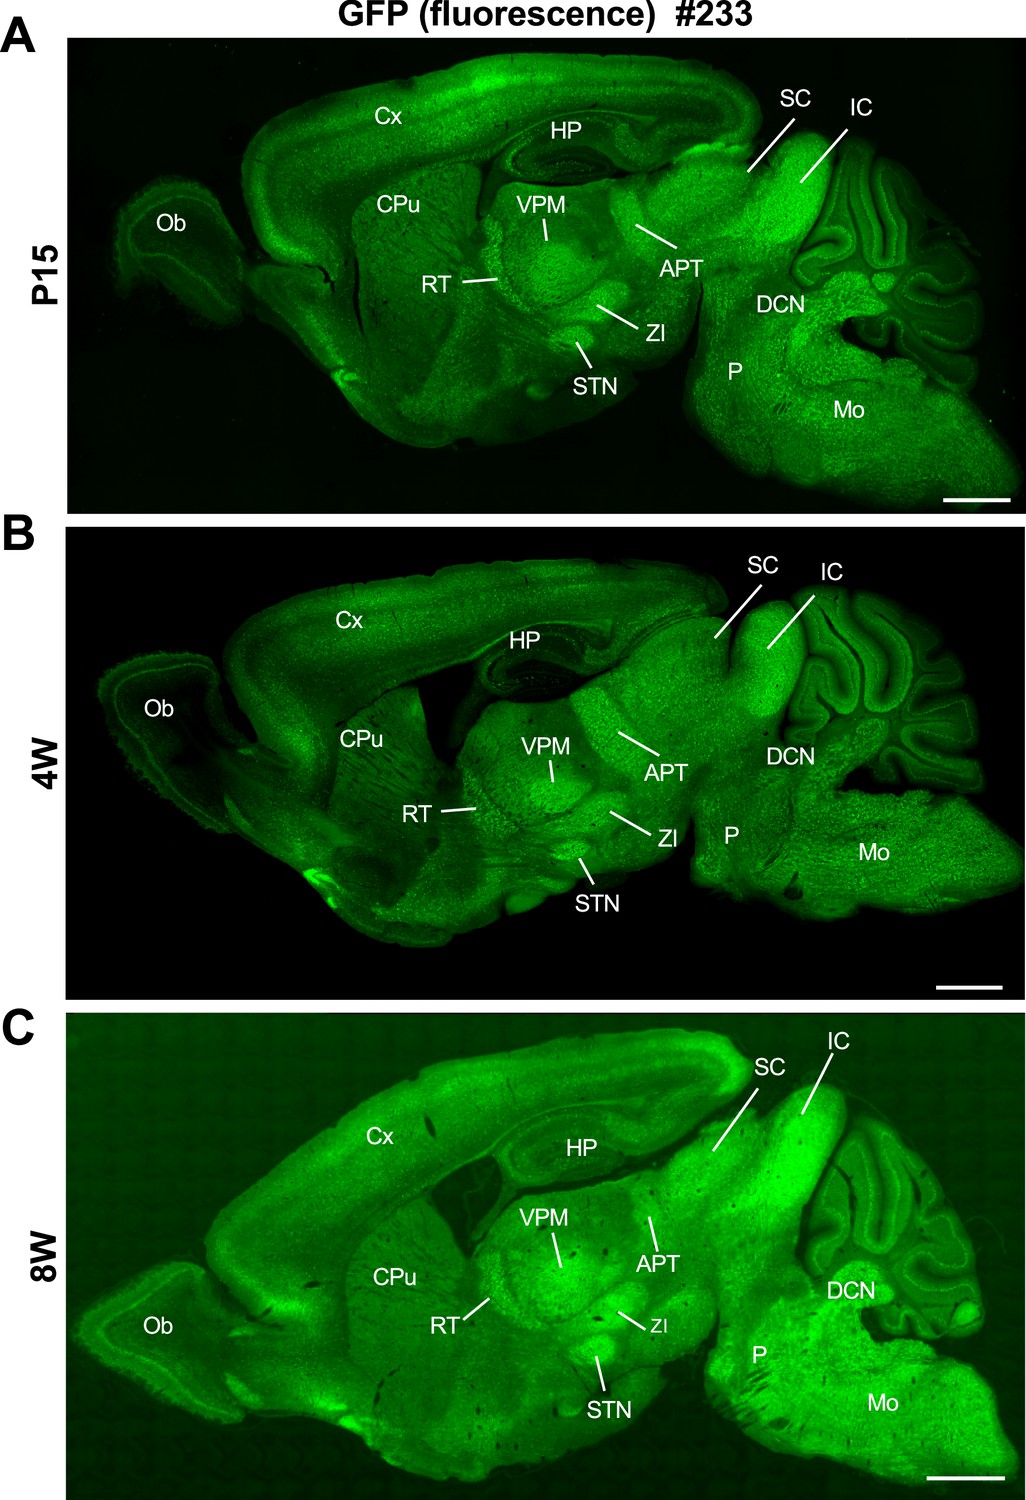
Distribution of green fluorescent protein (GFP) signals in Scn1a-GFP mouse brain are largely maintained through development.
Fluorescent images of parasagittal sections from P15 (A), 4W (B), and 8W (C) Scn1a-GFP mouse brains (line #233). GFP signals were observed in multiple brain regions. APT, anterior pretectal nucleus; CPu, caudate putamen; Cx, cerebral cortex; DCN, deep cerebellar nuclei; HP, hippocampus; IC, inferior colliculus; Mo, medulla oblongata; Ob, olfactory bulb; P, pons; RT, reticular thalamic nucleus; SC, superior colliculus; STN, subthalamic nucleus; VPM, ventral posteromedial thalamic nucleus; ZI, zona incerta. Scale bars: 1 mm.
Nav1.1 is expressed in both excitatory and inhibitory neurons in neocortex but only in inhibitory neurons in hippocampus
In the neocortex of Scn1a-GFP mouse, a large number of cells with GFP-positive somata (GFP-positive cells) were broadly distributed across all cortical layers (Figure 3 and Figure 3—figure supplement 1). Intensities of GFP signals in primary somatosensory cortex (S1) at L2/3 are much higher than other areas such as primary motor cortex (M1) (Figure 3—figure supplement 1), however the cell population (density) of GFP-positive cells did not differ in these areas indicating that GFP signals for GFP-positive cells are stronger in S1 at L2/3. Although GFP signals are strong in PV-INs (see Figure 8), cell density of PV-INs is not specifically high at S1 area and therefore most cells with strong GFP signals in S1 at L2/3 may not be PV-INs but excitatory neurons.
In order to know the ratio of GFP-positive cells among all neurons, we further performed immunohistochemical staining using NeuN-antibody on Scn1a-GFP mouse at P15 and cells were counted at M1 and S1 (Figure 3—figure supplement 2 and Supplementary file 1a). The NeuN staining showed that GFP-positive cells occupy 30% (L2/3), 32% (L5), and 22% (L6) of NeuN- and GFP-positive cells at P15 (Figure 3—figure supplement 2B and Supplementary file 1a). However, we noticed that sparsely distributed cells with intense GFP signals, which are assumed to be PV-INs (see Figure 8), were often NeuN-negative (Figure 3—figure supplement 2 – arrowheads), reminiscent of a previous report that NeuN expression is absent in cerebellar inhibitory neurons such as Golgi, basket, and satellite cells in cerebellum (Weyer and Schilling, 2003). Therefore, NeuN-positive cells do not represent all neurons in neocortex as well. NeuN/GFP-double negative neurons could even exist and therefore above figure (Figure 3—figure supplement 2B) may deviate from the real ratios of GFP-positive cells among all neurons.
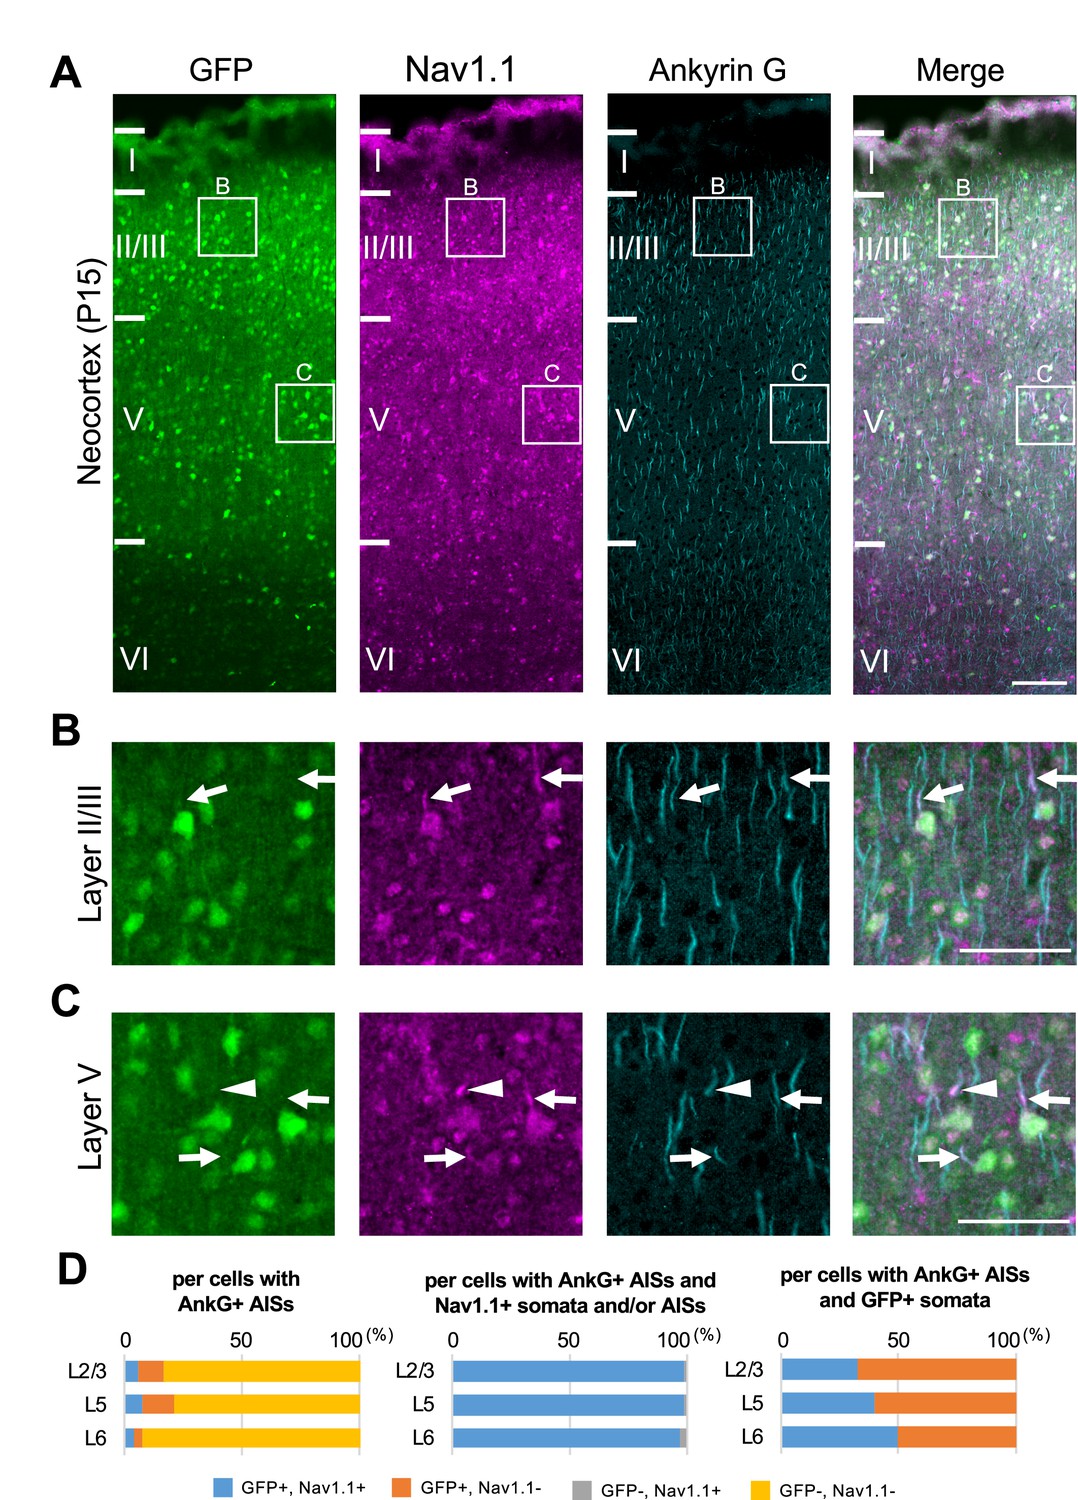
Next, we performed triple immunostaining of Nav1.1, GFP, and ankyrinG on brains of Scn1a-GFP mouse at P15. In the neocortex (Figure 4), axon initial segments (AISs) of cells with Nav1.1-positive somata were always Nav1.1-positive but somata of cells with Nav1.1-positive AISs were occasionally Nav1.1-negative (Figure 4A–C). Cell counting revealed that 17% (L2/3), 21% (L5), and 8% (L6) of neurons (cells with ankyrinG-positive AISs) were GFP-positive (Figure 4D, left panel and Supplementary file 1b). Of note, all cells with Nav1.1-positive AISs or somata were GFP-positive, but AISs or somata for only half of GFP-positive cells were Nav1.1-positive (Figure 4D and Supplementary file 1c, d), possibly due to undetectably low levels of Nav1.1 immunosignals in a subpopulation of GFP-positive cells. The above ratios of GFP-positive cells among neurons (cells with ankyrinG-positive AISs) obtained in the triple immunostaining of Nav1.1, GFP, and ankyrinG are rather discordant to those obtained in the later experiment of triple immunostaining of Nav1.2, GFP, and ankyrinG, 23% (L2/3), 30% (L5), and 21% (L6) (see below). Therefore, we additionally performed double immunostaining of GFP and ankyrinG on brains of Scn1a-GFP mouse at P15, and the ratios of GFP-positive cells among neurons were 30% (L2/3), 26% (L5), and 9% (L6) (Figure 4—figure supplement 1 and Supplementary file 1e). Averaged ratios of GFP-positive cells among neurons of these experiments are 23% (L2/3), 26% (L5), and 13% (L6) (Figure 4—figure supplement 2 and Supplementary file 1f), which are actually significantly lower than those obtained in the NeuN staining (Figure 3—figure supplement 2 and Supplementary file 1a).
Figure 4 with 2 supplements see all
Nav1.1 expression at the axon initial segment (AIS) in the Scn1a-GFP mouse neocortex.
(A) Triple immunofluorescent staining of parasagittal sections from P15 Scn1a-GFP mouse brain (line #233) by mouse anti-GFP (green), rabbit anti-Nav1.1 (magenta), and goat anti-ankyrinG (cyan) antibodies. Regions at primary motor cortex are shown. (B, C) Magnified images outlined in (A) are shown in (B) and (C). Arrows indicate AISs of cells with green fluorescent protein (GFP)-positive somata in which both somata and AISs are positive for Nav1.1. Arrowheads indicate AISs of cells with GFP-positive somata in which AISs but not somata are positive for Nav1.1. All images are oriented from pial surface (top) to callosal (bottom). Scale bars: 100 μm (A), 50 μm (B, C). (D) Cell counting of three Scn1a-GFP mice. Bar graphs indicating the percentage of cells with GFP- and Nav1.1-positive/negative somata and AISs per cells with ankyrinG-positive AISs (left panel), the percentage of cells with GFP-positive/negative somata per cells with ankyrinG-positive AISs and Nav1.1-positive somata and/or AISs (middle panel), and the percentage of cells with Nav1.1-positive/negative somata and/or AISs per cells with ankyrinG-positive AISs and GFP-positive somata (right panel) in L2/3, L5, and L6 (see also Supplementary file 1b–d). Only cells with ankyrinG-positive AISs were counted. Nav1.1 immunosignals were occasionally observed in somata, but in such cases Nav1.1 signals were always observed in their AISs if visible by ankyrinG staining. Note that 99% (L2/3), 99% (L5), and 97% (L6) of cells with Nav1.1-positive AISs have GFP-positive somata (middle panel), but only half or less of cells with GFP-positive somata have Nav1.1-positive AISs (right panel). L2/3, L5: neocortical layer II/III and V. AnkG, ankyrinG; +, positive; −, negative.
-
Figure 4—source data 1
Numerical source data for Figure 4D.
- https://cdn.elifesciences.org/articles/87495/elife-87495-fig4-data1-v1.xlsx
In contrast to the neocortex where only half of GFP-positive cells were Nav1.1-positive, in the hippocampus all GFP-positive cells were Nav1.1-positive and all Nav1.1-positive cells were GFP-positive (Figure 5). Actually, most of excitatory neurons such as CA1–3 pyramidal cells and dentate granule cells were GFP-negative. As described above (Figure 2C, G), fibrous GFP and Nav1.1 signals twining around CA1~3 pyramidal cells' somata which are assumed to be axon terminals of PV-INs were again observed (Figure 5A, B, D). Cell counting in the hippocampal CA1 region showed that 98% of cells with GFP-positive somata were Nav1.1-positive at their AISs and 100% of cells with Nav1.1-positive AISs were GFP-positive (Figure 5F and Supplementary file 1g, h).
Figure 5
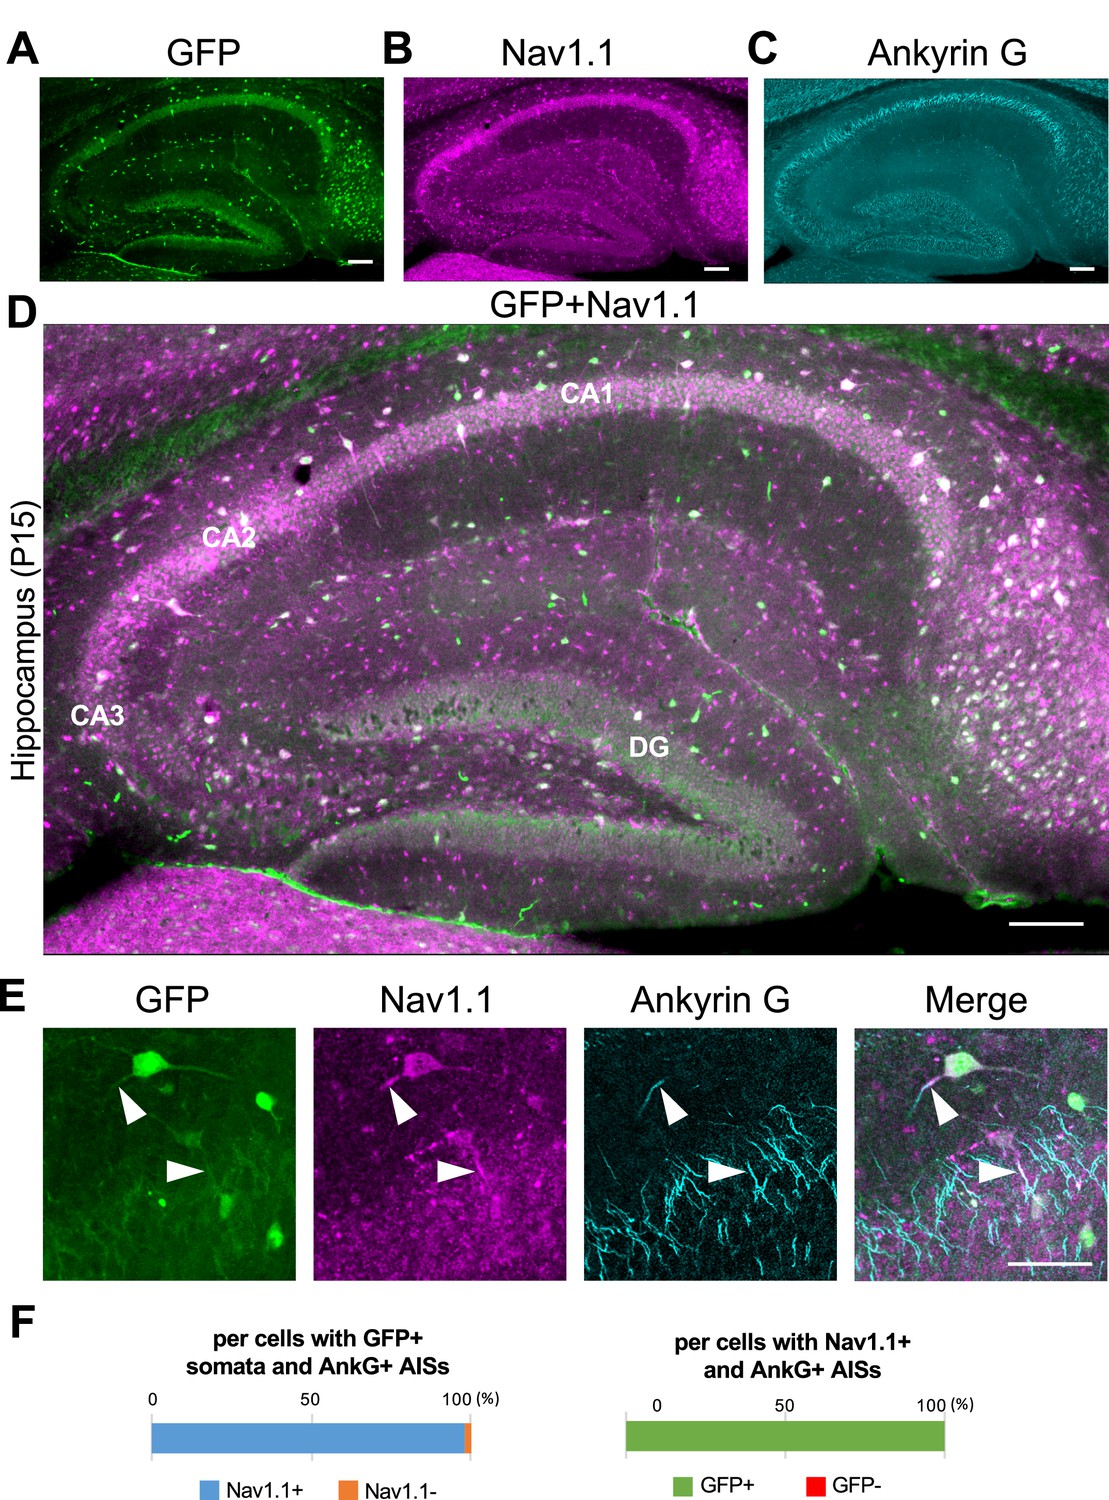
Nav1.1 expression at the axon initial segment (AIS) in the Scn1a-GFP mouse hippocampus.
(A–D) Triple immunofluorescent staining of parasagittal sections from P15 Scn1a-GFP mouse brain (line #233) by mouse anti-GFP (green), rabbit anti-Nav1.1 (magenta), and goat anti-ankyrinG (cyan) antibodies. Regions at hippocampus were shown. Note that green fluorescent protein (GFP) and Nav1.1 immunosignals mostly overlap at somata. CA1, cornu ammonis 1; CA2, cornu ammonis 2; CA3, cornu ammonis 3; DG, dentate gyrus. Images are oriented from pial surface (top) to callosal (bottom). Scale bars: 100 μm. (E) Magnified images for co-expression of GFP and Nav1.1 in cells at CA1 region. Arrowheads indicate Nav1.1-positive AISs of GFP expression cells. Scale bar: 50 μm. (F) Bar graphs indicate the percentage of cells in hippocampal CA1 region with Nav1.1-positive/negative AISs per cells with GFP-positive somata and ankyrinG-positive AISs (left panel), and the percentage of cells with GFP-positive/negative somata per cells with Nav1.1/ankyrinG-double positive AISs (right panel) (see also Supplementary file 1g, h). Only cells with ankyrinG-positive AISs were counted. GFP/Nav1.1-double negative cells, most of which are pyramidal cells, were not counted because of the accumulated nature of their ankyrinG-positive AISs. AnkG, ankyrinG; +, positive; −, negative.
-
Figure 5—source data 1
Numerical source data for Figure 5F.
- https://cdn.elifesciences.org/articles/87495/elife-87495-fig5-data1-v1.xlsx
Double in situ hybridization of Scn1a and GFP mRNAs showed that these signals well overlap in both neocortex and hippocampus of Scn1a-GFP mice (Figure 6), further supporting that the GFP signals well represent endogenous Scn1a/Nav1.1 expression. Again, in neocortex Scn1a and GFP mRNAs seem to be expressed in a number of neurons including some of excitatory pyramidal cells, while in hippocampus they are absent in excitatory neurons such as CA1–3 pyramidal cells and dentate granule cells. All of these distributions of Scn1a and GFP mRNAs in Scn1a-GFP transgenic mouse brain are consistent to our previous report of regional distributions of Scn1a mRNA in wild-type mouse (Ogiwara et al., 2007).
Figure 6
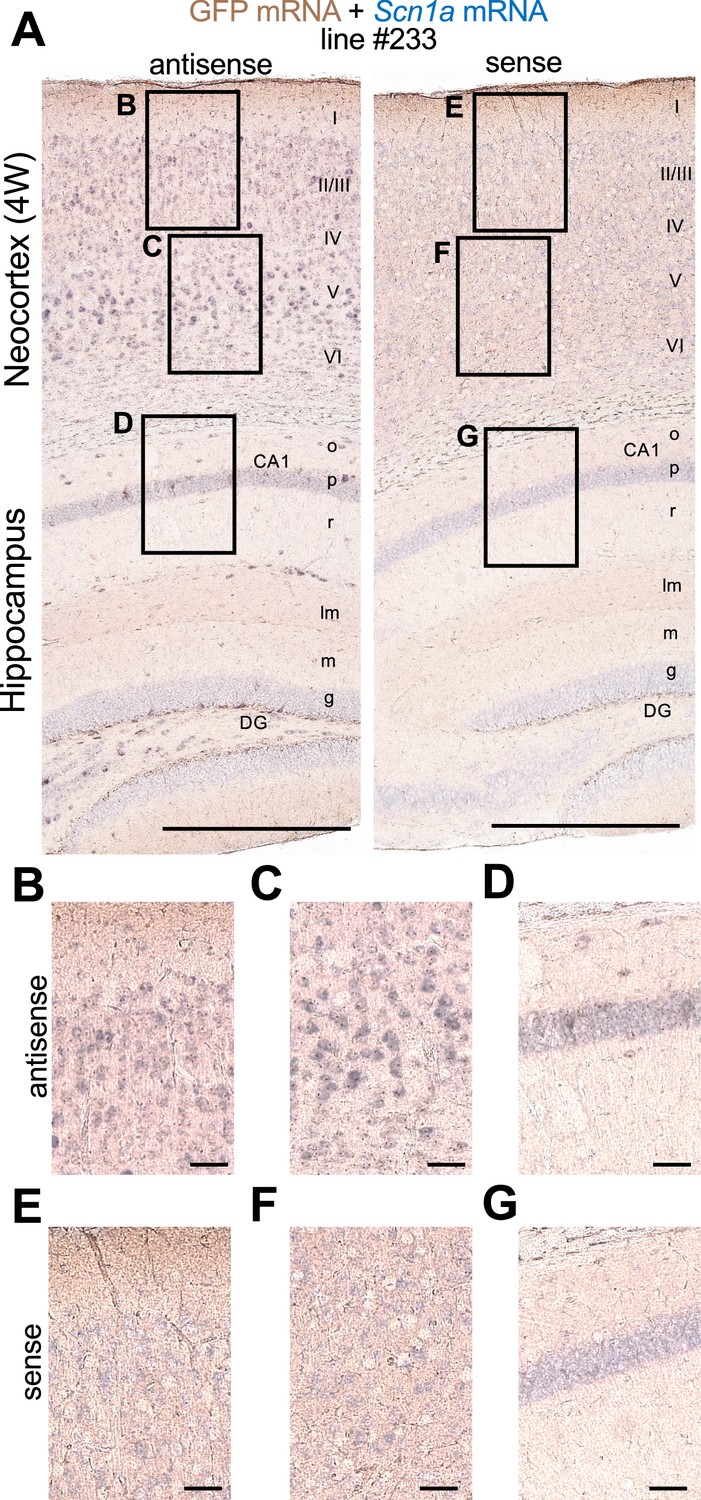
Green fluorescent protein (GFP) and Scn1a mRNAs expression mainly overlap in Scn1a-GFP mouse brain.
Double in situ hybridization for Scn1a-GFP transgene mRNA and endogenous Scn1a mRNA on parasagittal sections from 4W Scn1a-GFP brains (line #233). (A) Sections were hybridized with antisense (left) and sense (right) RNA probes for GFP transgene (brown) and endogenous Scn1a (blue) mRNA species and chromogenically stained. Magnified images outlined in (A) are shown in (B–D) for antisense probes, and (E–G) for sense probes. o, stratum oriens; p, stratum pyramidale; r, stratum radiatum; lm, stratum lacunosum-moleculare; m, stratum moleculare; g, stratum granulosum, CA1, cornu ammonis 1; DG, dentate gyrus. Scale bars: 500 µm (A), 50 µm (B–G).
To investigate the ratio of inhibitory neurons in GFP-positive cells, we generated and examined Scn1a-GFP and vesicular GABA transporter Slc32a1 (Vgat)-Cre (Ogiwara et al., 2013) double transgenic mice in which Slc32a1-Cre is expressed in all GABAergic inhibitory neurons and visualized by floxed tdTomato transgene (Figure 7). In the neocortex at 4W, 23% (L2/3), 28% (L5), and 27% (L6) of GFP-positive cells were Tomato-positive inhibitory neurons and 73% (L2/3), 77% (L5), and 83% (L6) of Tomato-positive cells were GFP-positive (Figure 7C and Supplementary file 1i, j). These results suggest that a significant subpopulation of neocortical excitatory neurons also express Nav1.1. Our previous observation that Nav1.1 is expressed in callosal axons of neocortical excitatory neurons (Ogiwara et al., 2013) supports that a subpopulation of L2/3 CC neurons express Nav1.1. Unlike in neocortex, in the hippocampus most of GFP-positive cells were Tomato-positive, 98% (CA1) and 94% (DG), and majorities of Tomato-positive GABAergic neurons are GFP-positive, 93% (CA1) and 77% (DG). These results further confirmed that in hippocampus Nav1.1 is expressed in inhibitory neurons but not in excitatory neurons. Although somata of pyramidal cells in CA2/3 region are weakly GFP-positive in this and some other experiments (Figure 7B and Figure 2—figure supplement 1G), those were GFP-negative in other experiments (Figures 2K and 5A, D) and therefore the Nav1.1 expression in CA2/3 pyramidal cells would be minimal if any.
Figure 7
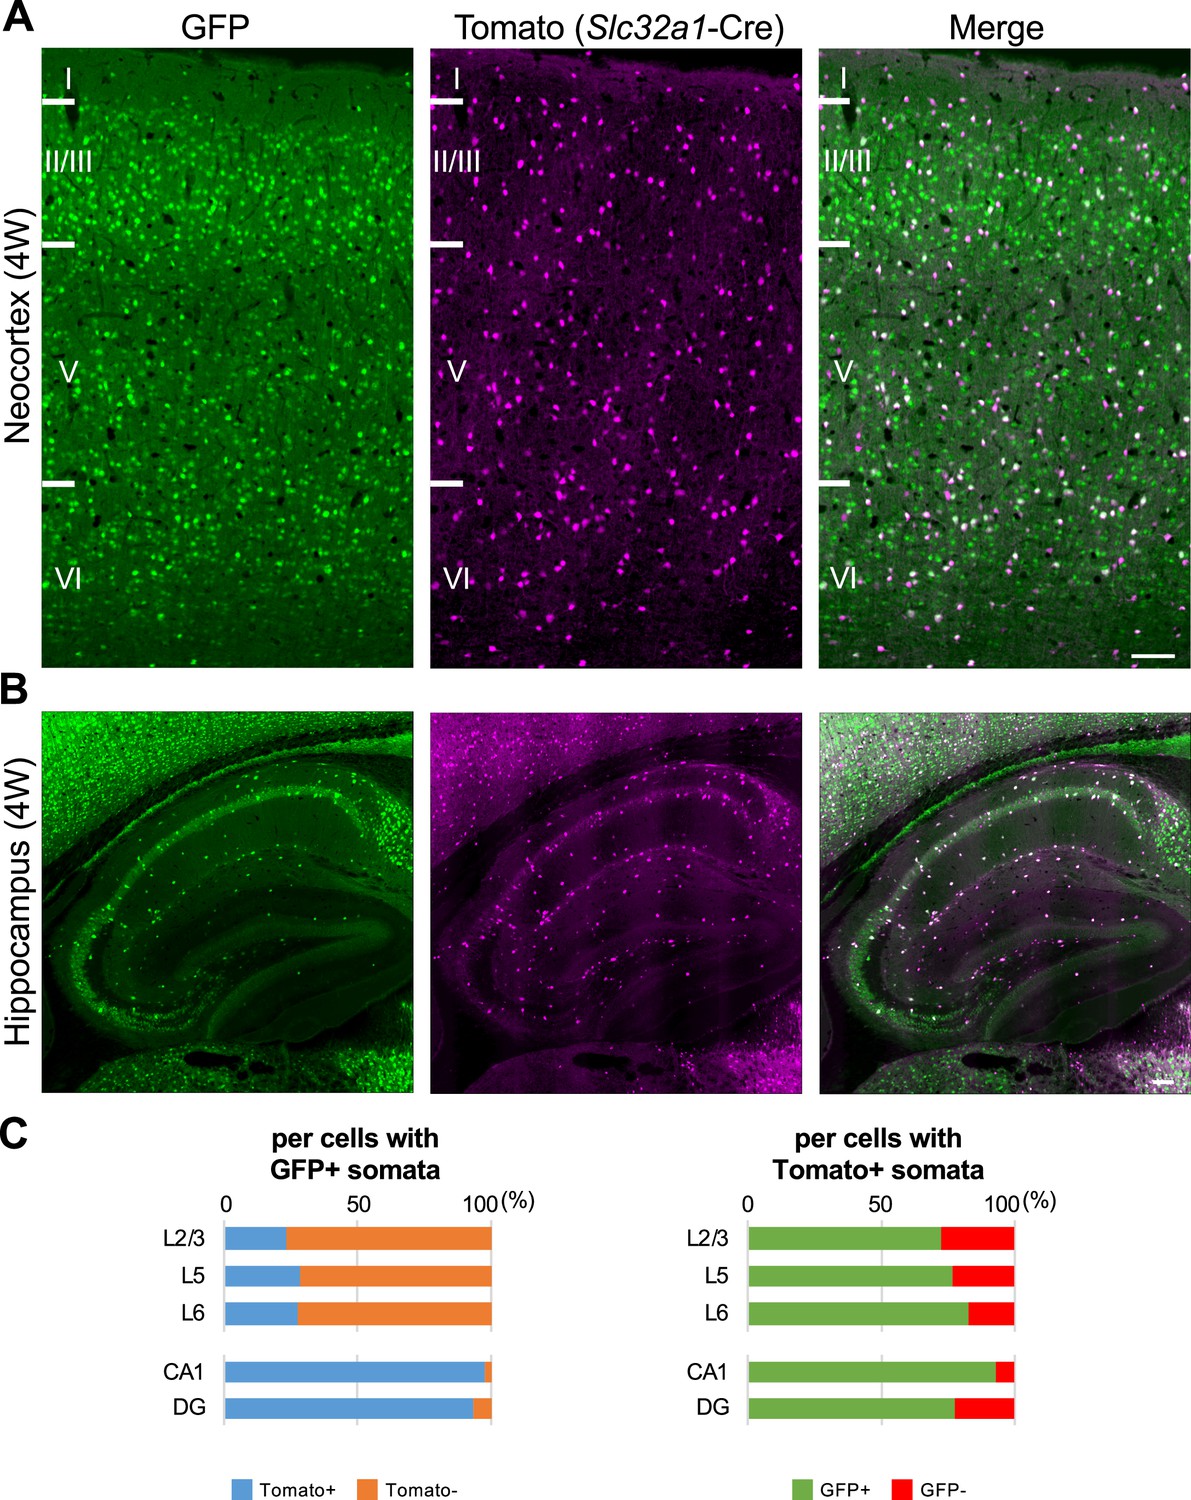
One-third of green fluorescent protein (GFP)-positive cells in neocortex are inhibitory neurons, but most of GFP-positive cells in hippocampus are inhibitory neurons.
(A, B) GFP (green) and Tomato (magenta) fluorescent images of parasagittal sections from 4W Scn1a-GFP/Slc32a1-cre/Ai14 mouse. Regions at primary motor cortex (A) and hippocampus (B) are shown. Scale bar: 100 μm. (C) Bar graphs indicate the percentage of cells with Tomato-positive/negative somata per cells with GFP-positive somata (left panel) (see also Supplementary file 1i) and the percentage of cells with GFP-positive/negative somata per cells with Tomato-positive somata (right panel) (see also Supplementary file 1j) in L2/3, L5, L6, CA1, and DG. Cells in primary motor cortex and hippocampus of Scn1a-GFP mouse at 4W were counted. L2/3, L5, L6, CA1, and DG: neocortical layer II/III, V, VI, cornu ammonis 1, dentate gyrus. +, positive; −, negative.
-
Figure 7—source data 1
Numerical source data for Figure 7C.
- https://cdn.elifesciences.org/articles/87495/elife-87495-fig7-data1-v1.xlsx
We further performed immunohistochemical staining of PV and SST in neocortex and hippocampus of Scn1a-GFP mice at 4W (Figure 8). PV and SST do not co-express in cells and do not overlap. PV-INs and SST-INs were both GFP-positive, and especially GFP signals in PV-INs were intense (Figure 8A). Cell counting revealed that 21% (L2/3), 37% (L5), 37% (L6), 58% (CA1), 42% (CA2/3), and 41% (DG) of GFP-positive cells were PV- or SST-positive depending on regions in neocortex and hippocampus (Figure 8B and Supplementary file 1k–m). All PV-INs were GFP-positive (Figure 8B, middle), and most of SST-INs were GFP-positive (Figure 8B, right). Comparison of these results with those of Slc32a1-Cre mouse (Figure 7) suggests that GFP-positive GABAergic neurons in neocortex are mostly PV- or SST-positive, while in hippocampus a half of those are PV/SST-negative GABAergic neurons. Higher ratios of PV- or SST-positive cells (Figure 8B) compared with those of Slc32a1-Cre-positive cells (Figure 7C) among GFP-positive cells would be explained by us counting a cell as PV-positive if their PV immunosignals are moderate and a significant subpopulation of such cells are known to be excitatory neurons (Jinno and Kosaka, 2004; Tanahira et al., 2009; Matho et al., 2021). Quantitative analysis of GFP signal intensity and area size of cells revealed that GFP signal intensities in PV-positive cells were significantly higher than those in PV-negative cells and GFP signal intensities in SST-positive cells were lower than those in PV-positive cells but similar to PV/SST-double negative cells (Figure 9 and Supplementary file 1n–p). These results indicate that Nav1.1 expression level in PV-INs is significantly higher than those in excitatory neurons and PV-negative GABAergic neurons including SST-INs.
Figure 8
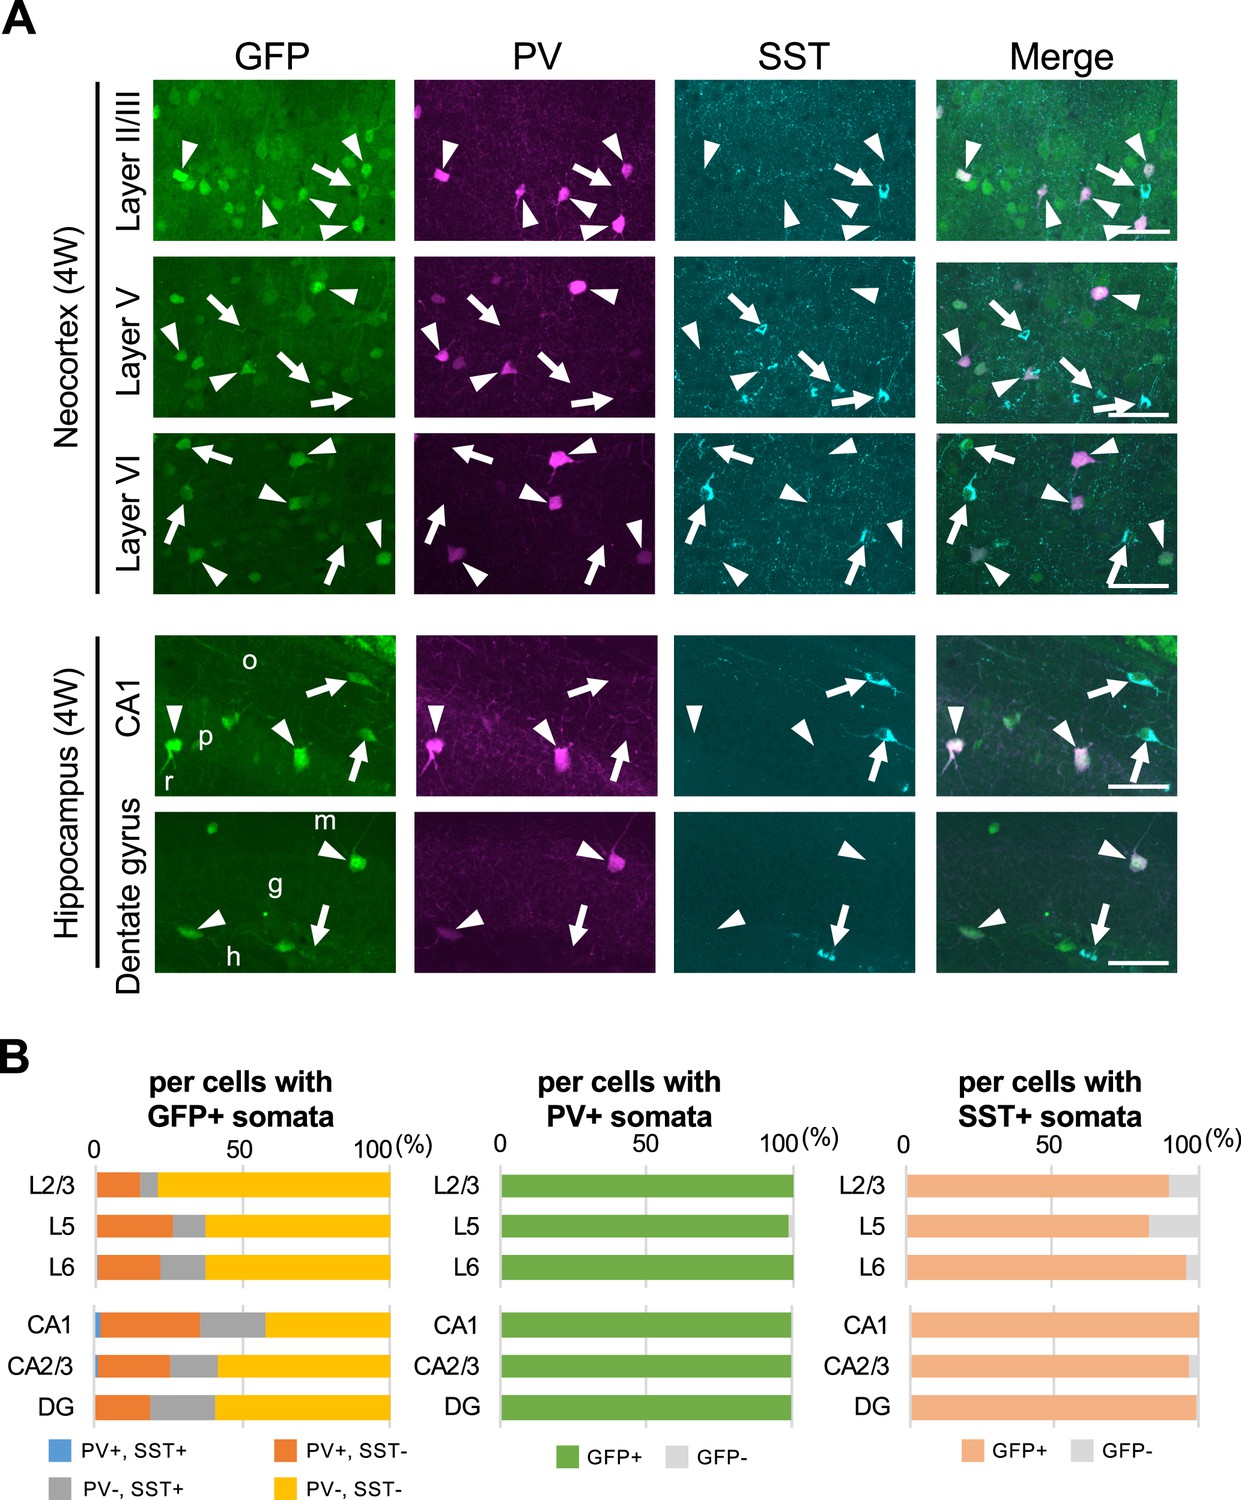
Parvalbumin- or somatostatin-positive inhibitory neurons are green fluorescent protein (GFP)-positive in Scn1a-GFP mouse neocortex and hippocampus.
(A) Triple immunofluorescent staining of parasagittal sections from 4W Scn1a-GFP mouse (line #233) by mouse anti-GFP (green), rabbit anti-parvalbumin (PV) (magenta), and goat anti-somatostatin (SST) (cyan) antibodies. Regions at neocortex and hippocampus are shown. Merged images were shown in the right columns. Arrows indicate SST/GFP-double positive cells. Arrowheads indicate PV/GFP-double positive. o, stratum oriens; p, stratum pyramidale; r, stratum radiatum; h, hilus; g, stratum granulosum; m, stratum moleculare. All images are oriented from pial surface (top) to callosal (bottom). Scale bars: 50 μm. (B) Bar graphs indicate the percentage of cells with PV- and SST-positive/negative somata per cells with GFP-positive somata (left panel) (see also Supplementary file 1k), the percentage of cells with GFP-positive/negative somata per cells with PV-positive somata (middle panel) (see also Supplementary file 1l), and the percentage of cells with GFP-positive/negative somata per cells with SST-positive somata (right panel) (see also Supplementary file 1m) in L2/3, L5, L6, CA1, CA2/3, and DG. Cells in neocortex and hippocampus of Scn1a-GFP mouse at 4W were counted. L2/3, L5, L6, CA1, CA2/3, and DG: neocortical layer II/III, V, VI, cornu ammonis 1, 2 plus 3, dentate gyrus. +, positive; −, negative.
-
Figure 8—source data 1
Numerical source data for Figure 8B.
- https://cdn.elifesciences.org/articles/87495/elife-87495-fig8-data1-v1.xlsx
Figure 9
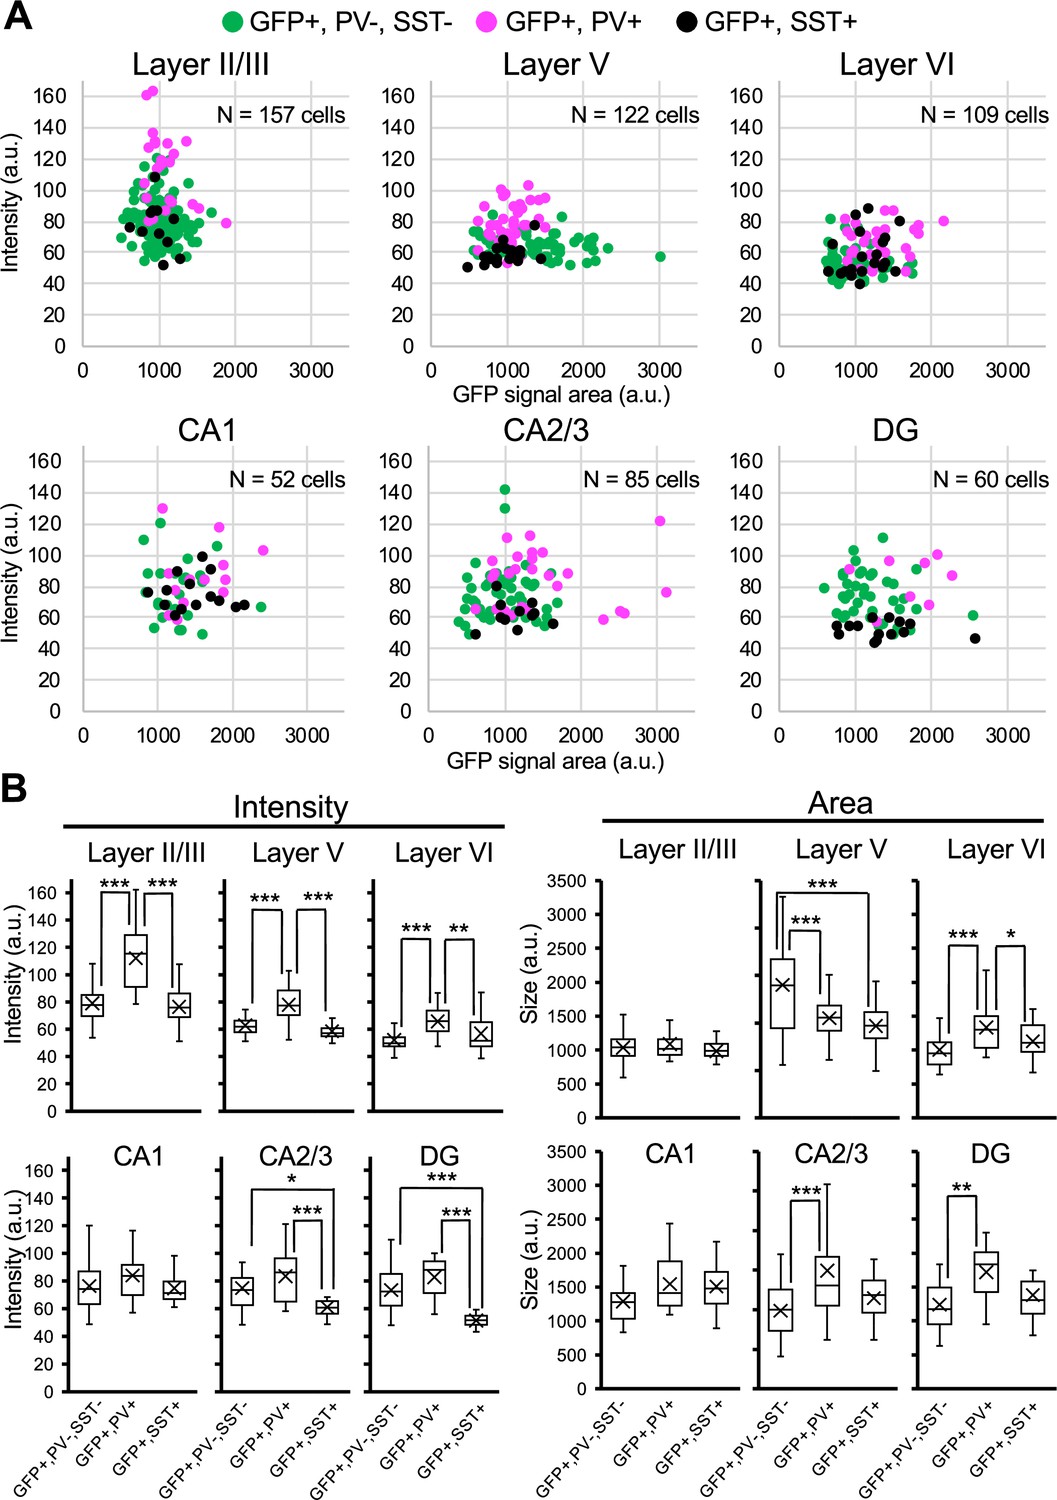
Green fluorescent protein (GFP) signals in parvalbumin-positive inhibitory neurons are higher than PV-negative/GFP-positive cells in Scn1a-GFP mouse neocortex.
(A) Scatter plots of intensities and area sizes of GFP immunosignals in GFP-positive cells with PV- or SST-positive or -negative somata. Cells at primary motor cortex (upper panels) and hippocampus (lower panels) in parasagittal sections from 4W Scn1a-GFP mouse (line #233) were analyzed. PV-positive (magenta circles) or SST-positive (black circles) and -negative (green circles) cells in neocortical L2/3, L5, and L6 or hippocampal CA1, CA2/3, and DG are plotted (see also Supplementary file 1n). (B) Box plots represent values for the intensity and area size in each cell type (see also Supplementary file 1o, p). Cross marks indicate mean values in each cell type. Statistical significance was assessed using one-way analysis of variance (ANOVA) followed by Tukey–Kramer post hoc multiple comparison test. *p < 0.05, **p < 0.01, ***p < 0.001. Note that GFP signal intensities of PV/GFP-double positive cells were significantly higher than that of SST/GFP-double positive cells and PV/SST-negative/GFP-positive cells (all layers), while GFP signal intensities of SST/GFP-double positive cells were similar to PV/SST-negative/GFP-positive cells in neocortex. In hippocampus, GFP signal intensities of SST/GFP-double positive cells were significantly lower than that of SST-negative/GFP-positive cells at CA2/3 and DG. CA1, CA2/3, and DG: cornu ammonis 1, 2 plus 3, dentate gyrus. a.u., arbitrary unit; +, positive; −, negative.
-
Figure 9—source data 1
Numerical source data for Figure 9.
- https://cdn.elifesciences.org/articles/87495/elife-87495-fig9-data1-v1.xlsx
Nav1.1 and Nav1.2 expressions are mutually exclusive in mouse brain
We previously reported that expressions of Nav1.1 and Nav1.2 seem to be mutually exclusive in multiple brain regions including neocortex, hippocampal CA1, dentate gyrus, striatum, globus pallidus, and cerebellum in wild-type mice (Yamagata et al., 2017). To further confirm it, here we performed triple immunostaining for Nav1.1, Nav1.2, and ankyrinG, and counted Nav1.1- or Nav1.2-immunopositive AISs in the neocortex of Scn1a-GFP mice (Figure 10). The staining again showed that Nav1.1 and Nav1.2 expressions are mutually exclusive in brain regions including neocortex (Figure 10A). The counting revealed that 5% (L2/3), 6% (L5), and 3% (L6) of AISs at P15 were Nav1.1-positive and 78% (L2/3), 69% (L5), and 69% (L6) of AISs at P15 were Nav1.2-positive in the neocortex (Figure 10B and Supplementary file 1q). Of note, less than 0.5% of AISs are Nav1.1/Nav1.2-double positive confirming that Nav1.1 and Nav1.2 do not co-express. These results are consistent with our previous study (Yamagata et al., 2017) and further support that expressions of Nav1.1 and Nav1.2 are mutually exclusive in mouse neocortex at least at immunohistochemical level.
Figure 10
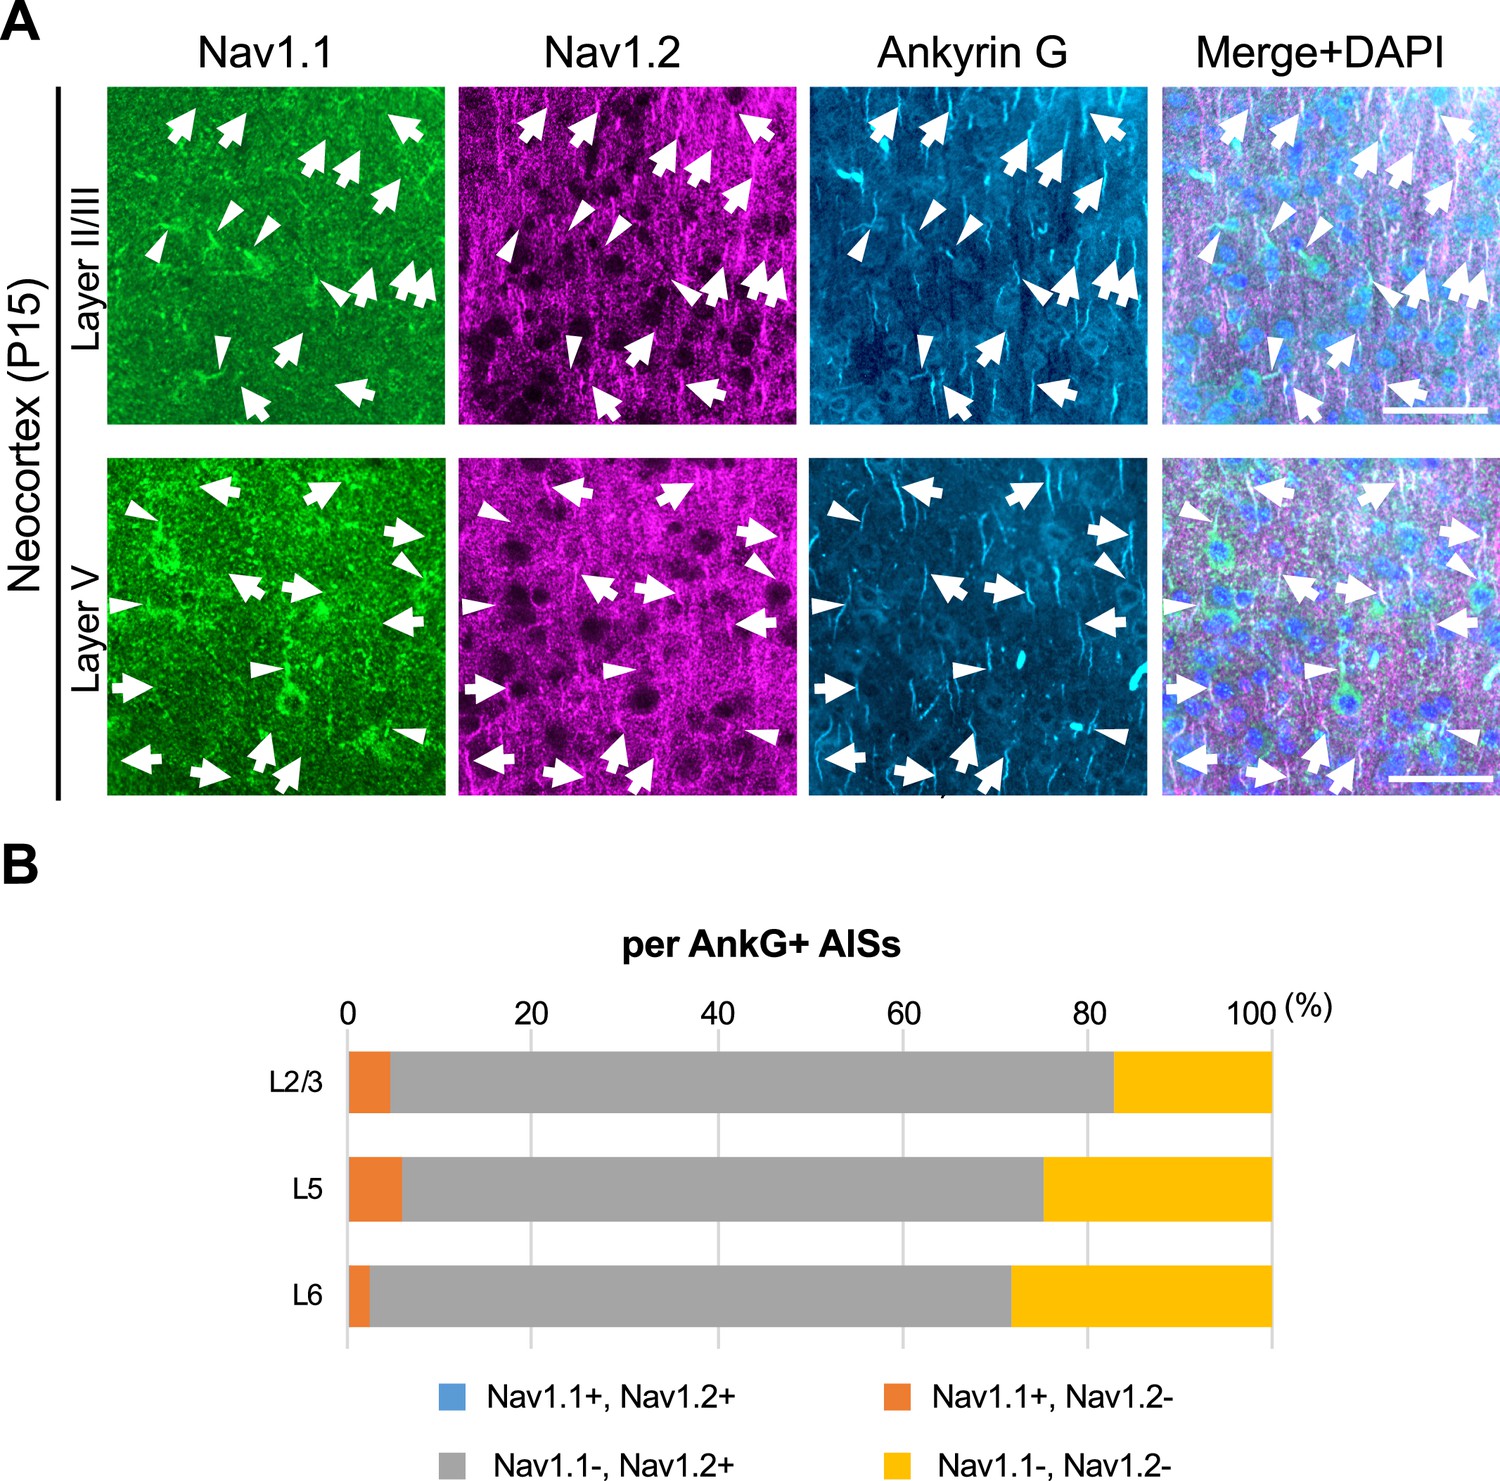
Nav1.1 and Nav1.2 are mutually exclusive at axon initial segments (AISs) in mouse brain.
(A) Triple immunofluorescent staining on parasagittal sections from Scn1a-GFP mouse at P15 by rabbit anti-Nav1.1 (green), goat anti-Nav1.2 (magenta), and mouse anti-ankyrinG (cyan) antibodies. Merged images are shown in the right panels. Arrows indicate Nav1.2-positive AISs. Arrowheads indicate Nav1.1-positive AISs. Note that there are no Nav1.1/Nav1.2-double positive AISs. Images are oriented from pial surface (top) to callosal (bottom). Scale bars: 50 μm. (B) Bar graphs indicating the percentage of Nav1.1- and Nav1.2-positive/negative AISs per AISs detected by ankyrinG staining in L2/3, L5, and L6 of Scn1a-GFP mice. Note that Nav1.1/Nav1.2-double positive AISs were less than 0.5% of all AISs in these layers (see Supplementary file 1q). L2/3, L5, L6: neocortical layer II/III, V, VI. AnkG, ankyrinG; +, positive; −, negative.
-
Figure 10—source data 1
Numerical source data for Figure 10B.
- https://cdn.elifesciences.org/articles/87495/elife-87495-fig10-data1-v1.xlsx
As mentioned, GFP signals in Scn1a-GFP mouse can represent even moderate or low Nav1.1 expressions which cannot be detected by immunohistochemical staining, so some of GFP-positive cells may still express Nav1.2. To investigate whether and if so how much of GFP-positive cells have Nav1.2-positive AISs in Scn1a-GFP mouse neocortex, we performed triple immunohistochemical staining for Nav1.2, GFP, and ankyrinG (Figure 11 and Supplementary file 1r–t). The staining showed that AISs of GFP-positive cells are largely negative for Nav1.2, and cells with Nav1.2-positive AISs are mostly GFP-negative (Figure 11A). Cell counting revealed that 88% (L2/3), 90% (L5), and 95% (L6) of cells with Nav1.2-positive AISs at P15 were GFP-negative (Figure 11B, middle panel and Supplementary file 1s), and 69% (L2/3), 83% (L5), and 86% (L6) of AISs of GFP-positive cells at P15 were Nav1.2-negative (Figure 11B, right panel and Supplementary file 1t). These results indicate that the co-expression of GFP and Nav1.2 would be minimal if any.
Figure 11
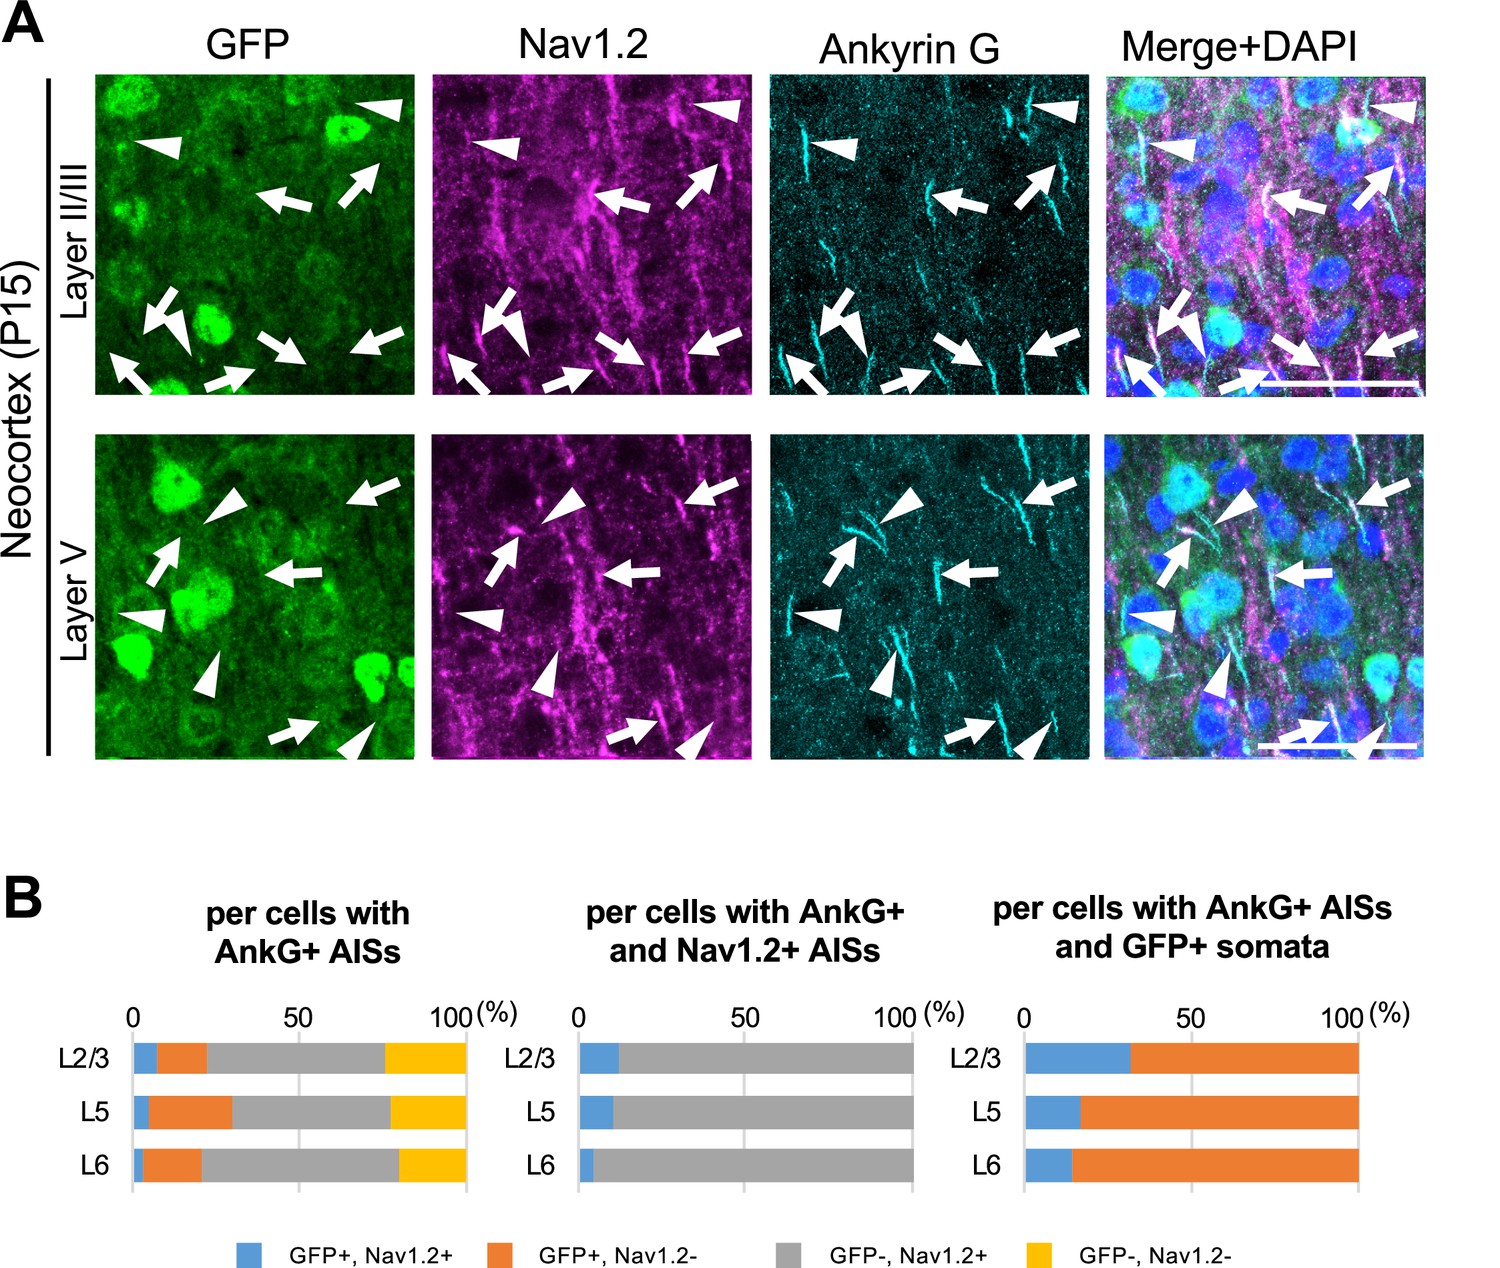
Cells with Nav1.2-positive axon initial segments (AISs) are mostly green fluorescent protein (GFP)-negative in Scn1a-GFP mouse neocortex.
(A) Triple immunofluorescent staining of parasagittal sections from P15 Scn1a-GFP mouse brain (line #233) by mouse anti-GFP (green), goat anti-Nav1.2 (magenta), and rabbit anti-ankyrinG (cyan) antibodies. Merged images of the signals are shown in the right panels. Arrows indicate Nav1.2-positive AISs of cells with GFP-negative somata. Arrowheads indicate Nav1.2-negative AISs of cells with GFP-positive somata. All images are oriented from pial surface (top) to callosal (bottom). Scale bars: 50 μm. (B) Bar graphs indicating the percentage of cells with GFP- and Nav1.2-positive/negative somata and AISs per cells with ankyrinG-positive AISs (left panel) (see also Supplementary file 1r), the percentage of cells with GFP-positive/negative somata per cells with ankyrinG/Nav1.2-double positive AISs (middle panel) (see also Supplementary file 1s), and the percentage of cells with Nav1.2-positive/negative AISs per cells with ankyrinG-positive AISs and GFP-positive somata (right panel) (see also Supplementary file 1t) in L2/3, L5, and L6. Note that 88% (L2/3), 90% (L5), and 95% (L6) of cells with Nav1.2-positive AISs have GFP-negative somata (middle panel), and 68% (L2/3), 83% (L5), and 86% (L6) of cells with GFP-positive somata have Nav1.2-negative AISs (right panel). L2/3, L5, L6: neocortical layer II/III, V, VI. AnkG, ankyrinG; +, positive; −, negative.
-
Figure 11—source data 1
Numerical source data for Figure 11B.
- https://cdn.elifesciences.org/articles/87495/elife-87495-fig11-data1-v1.xlsx
Neocortical PT and a subpopulation of CC projection neurons express Nav1.1
Neocortical excitatory neurons can be divided into functionally distinct subpopulations, a majority of those are pyramidal cells which have axons of long-range projections such as L2/3 CC, L5 PT, L5/6 CS, and L6 CT projection neurons (Shepherd, 2013). Although PT neurons also project their axon collaterals to ipsilateral striatum, CS neurons project bilaterally to ipsi- and contralateral striata. A transcription factor FEZF2 is expressed in L5 PT neurons, forms their axonal projections, and defines their targets (Inoue et al., 2004; Chen et al., 2005; Chen et al., 2008; Lodato et al., 2014). Most of PT neurons are FEZF2-positive (Molyneaux et al., 2005; Matho et al., 2021). We previously reported that a subpopulation of neocortical L5 pyramidal neurons is Nav1.1-positive (Ogiwara et al., 2013), but their natures were unclear. To investigate those, here we performed immunohistochemical staining of FEZF2 and GFP on Scn1a-GFP mouse brains (Figures 12 and 13, Supplementary file 1uv and w). In L5 where a major population of FEZF2-positive cells locate (Figure 12A), a majority of FEZF2-positive neurons were GFP-positive (83% and 96% of FEZF2-positive neurons were GFP-positive at P15 and 4W, respectively) (Figure 12B, middle panels and Supplementary file 1v). In L2/3, FEZF2-positive cells were scarce (Figure 12A). In L6, a certain number of FEZF2-positive cells exist but overlaps of FEZF2 and GFP signals are much less compared to those in L5 (Figure 12 and Supplementary file 1u–w). Quantitative analyses revealed that FEZF2/GFP-double positive cells in L5 showed significantly lower GFP immunosignal intensities and larger signal areas (soma sizes) compared to those of FEZF2-negative/GFP-positive cells (Figure 13 and Supplementary file 1x), indicating that L5 PT neurons showed lower Nav1.1 expression compared to other neurons such as PV-INs (see also Figure 9). Soma sizes of GFP-positive cells in L6 were overall smaller than those of FEZF2/GFP-double positive cells in L5, and there was no statistically significant difference in size between the FEZF2-positive/negative subpopulations. However, FEZF2/GFP-double positive cells still showed lower intensity of GFP signals compared to FEZF2-negative/GFP-positive cells (Figure 13 and Supplementary file 1x).
Figure 12 with 3 supplements see all
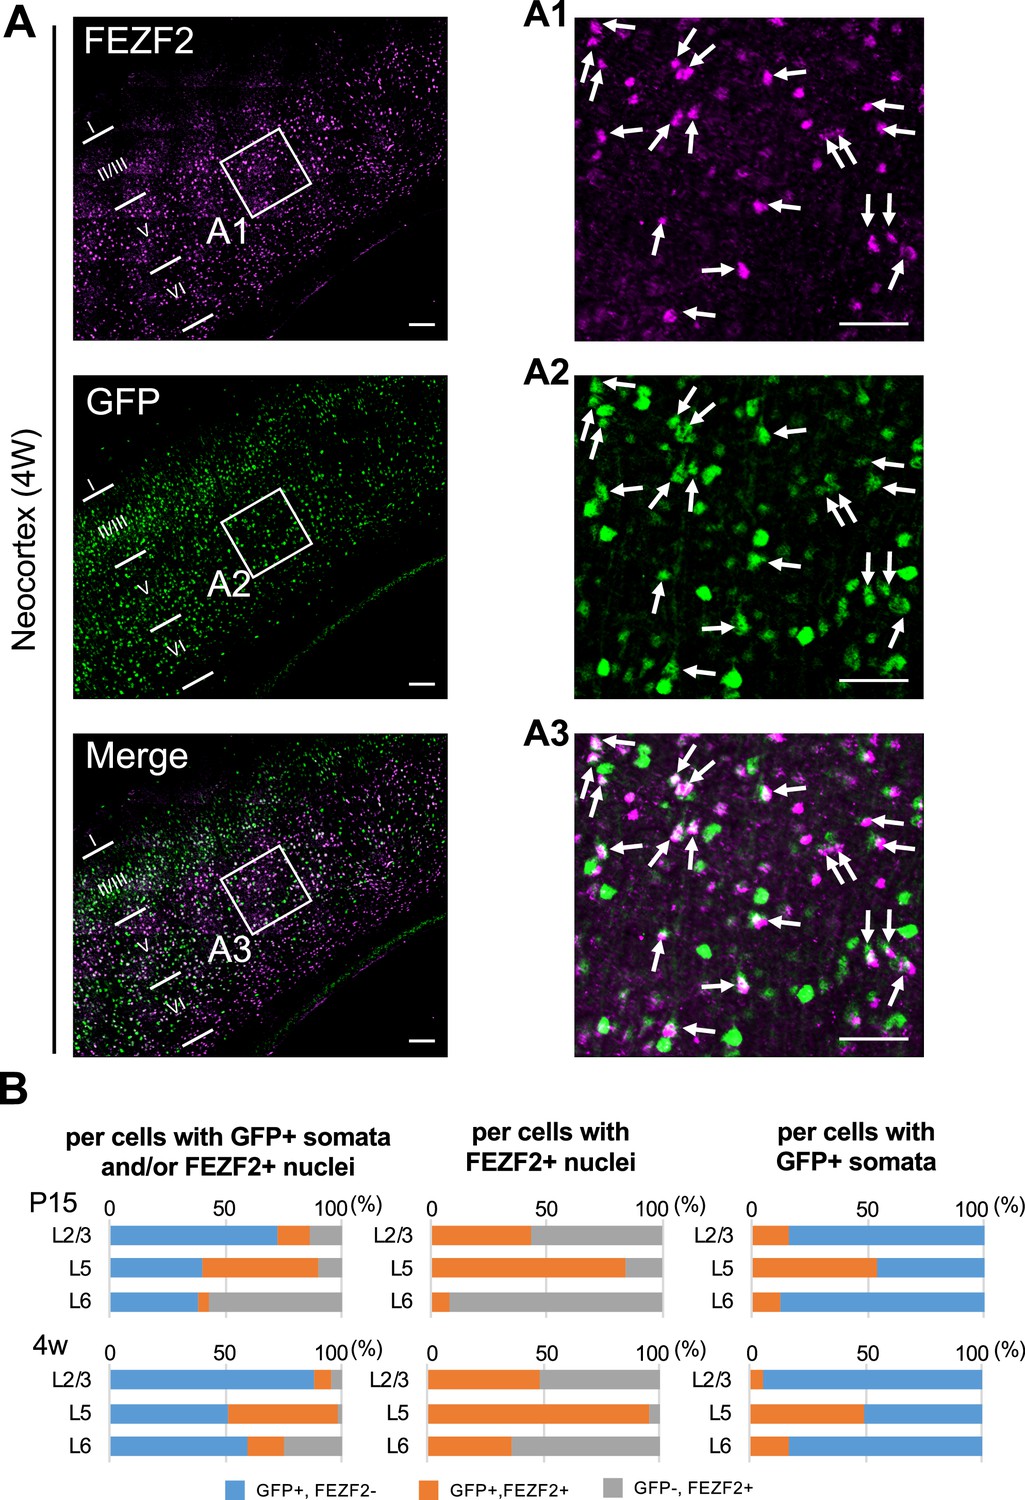
Cells positive for FEZF2 are mostly green fluorescent protein (GFP)-positive in L5 of Scn1a-GFP mouse neocortex.
(A) Double immunostaining of FEZF2 and GFP in neocortex of 4W Scn1a-GFP mouse (line #233) by rabbit anti-FEZF2 (magenta) and mouse anti-GFP (green) antibodies. Arrows indicate FEZF2/GFP-double positive cells. Magnified images outlined in (A) are shown in (A1–A3). Note that FEZF2 signals mostly overlap with GFP signals in L5. Many of the remained GFP-positive/FEZF2-negative cells have intense GFP signals and are assumed to be inhibitory neurons (see Figure 8). Scale bars: 100 μm (A), 50 μm (A1–A3). (B) Bar graphs indicating the percentage of cells with FEZF2- and GFP-positive/negative nuclei and somata per cells with GFP-positive somata and/or FEZF2-positive nuclei (left panels) (see also Supplementary file 1u), the percentage of cells with GFP-positive/negative somata per cells with FEZF2-positive nuclei (middle panels) (see also Supplementary file 1v), and the percentage of cells with FEZF2-positive/negative nuclei per cells with GFP-positive somata (right panels) (see also Supplementary file 1w) in L2/3, L5, and L6. Cells at primary motor cortex of Scn1a-GFP mouse at P15 and 4W were counted. Note that 83% (P15) and 96% (4W) of cells with FEZF2-positive cells are GFP-positive in L5 (middle panels), but a half of cells with GFP-positive cells are FEZF2-positive in L5 (right panel). L2/3, L5, L6: neocortical layer II/III, V, VI. +, positive; −, negative.
-
Figure 12—source data 1
Numerical source data for Figure 12B.
- https://cdn.elifesciences.org/articles/87495/elife-87495-fig12-data1-v1.xlsx
Figure 13

FEZF2-positive cells have lower green fluorescent protein (GFP) signal intensities in Scn1a-GFP mouse neocortex.
Scatter plots of intensities and area sizes of GFP immunosignals in GFP-positive cells with FEZF2-positive/negative nuclei. Cells at primary motor cortex in parasagittal sections from 4W Scn1a-GFP mouse (line #233) were analyzed. FEZF2-positive (orange squares) and negative (black circles) cells in neocortical L2/3, L5, and L6 are plotted (see also Supplementary file 1x). Note that GFP signal intensities of FEZF2/GFP-double positive cells were significantly lower than that of FEZF2-negative/GFP-positive cells (L5, L6), and signal area size of FEZF2/GFP-double positive cells was significantly larger than that of FEZF2-negative/GFP-positive cells (L2/3, L5). Statistical significance was assessed using t-test. a.u., arbitrary unit; +, positive; −, negative.
-
Figure 13—source data 1
Numerical source data for Figure 13.
- https://cdn.elifesciences.org/articles/87495/elife-87495-fig13-data1-v1.xlsx
We further performed triple immunostaining of FEZF2, Nav1.1, and ankyrinG on Scn1a-GFP mice at P15, and found that 11% of FEZF2-positive cells have Nav1.1-positive AIS in L5 of Scn1a-GFP mouse neocortex (Figure 12—figure supplement 1 and Supplementary file 1y, z, aa). The low ratios of FEZF2/Nav1.1-double positive cells are most possibly due to immunohistochemically undetectable low levels of Nav1.1 expression in these excitatory neurons.
We also performed triple immunostaining of FEZF2, Nav1.2, and ankyrinG on Scn1a-GFP mice at P15 (Figure 12—figure supplement 2 and Supplementary file 1ab, ac, ad, ae). The staining showed that 20% of neurons (cells with ankyrinG-positive AISs) in L5 are FEZF2-positive and a half of L5 FEZF2-positive cells have Nav1.2-positive AISs. Together with the observation that most of FEZF2-positive cells are GFP-positive (Figure 12), these results indicate that a subpopulation of FEZF2-positive PT neurons may express both Nav1.1 and Nav1.2.
We additionally performed triple immunostaining of FEZF2, GFP, and Nav1.2 on Scn1a-GFP mice at P15 (Figure 12—figure supplement 3 and Supplementary file 1af), showing that in L5 74% of FEZF2-positive cells are GFP-positive but a majority of their AISs are Nav1.2-negative. The ratios of Nav1.2-positive cells among FEZF2-positive cells obtained in the triple immunostaining of FEZF2, GFP, and Nav1.2 (Figure 12—figure supplement 3) are 27% (L5) and 40% (L6). These results further support the above notion that a subpopulation of FEZF2-positive PT neurons may express both Nav1.1 and Nav1.2. Although further studies such retrograde tracking analyses are required to confirm and figure out the detailed circuits, all these results propose that the majority of L5 PT neurons express Nav1.1.
The majority of CT, CS, and CC projection neurons express Nav1.2
TBR1 (T-box brain 1 transcription factor) is a negative regulator of FEZF2 and therefore not expressed in the PT neurons, all of which are known to be FEZF2-positive (Chen et al., 2008; Han et al., 2011; McKenna et al., 2011). TBR1 is predominantly expressed in L6 CT neurons and subpopulations of L2/3 and L5 non-PT excitatory neurons instead (Han et al., 2011; McKenna et al., 2011; Matho et al., 2021). To further elucidate the distributions of GFP (Nav1.1)-expressing neurons in neocortex, we performed immunohistochemical staining of TBR1 on Scn1a-GFP mice (Figure 14 and Supplementary file 1ag, ah, ai) and quantitated GFP signal intensities and area sizes of cells (Figure 15 and Supplementary file 1aj). TBR1-positive cells were predominant in neocortical L6, some in L5 and a few in L2/3. In L5, contrary to the high ratios of GFP-positive cells among FEZF2-positive cells (83% at P15 and 96% at 4W) (Figure 12B), the ratios of GFP-positive cells among TBR1-positive cells are quite low (11% at P15 and 5% at 4W) (Figure 14B, middle panels and Supplementary file 1ah). Soma sizes of TBR1/GFP-double positive cells were smaller than those of TBR1-negative/GFP-positive cells (Figure 15, middle panel and Supplementary file 1aj). In L6 where a major population of TBR1-positive neurons locate, the ratios of GFP-positive cells among TBR1-positive cells are still low (15% at P15 and 26% at 4W) (Figure 14B, middle panels and Supplementary file 1ah). Soma sizes of TBR1/GFP-double positive cells were also smaller than those of TBR1-negative/GFP-positive cells, and TBR1/GFP-double positive cells showed lower intensity of GFP immunosignals compared to TBR1-negative/GFP-positive cells (Figure 15, right panel and Supplementary file 1aj). We additionally performed triple immunostaining for TBR1, Nav1.1, and ankyrinG on Scn1a-GFP mice (Figure 14—figure supplement 1 and Supplementary file 1ak, al, am). Notably, the ratios of Nav1.1-positive cells among TBR1-positive cells are 0% in all layers (Figure 14—figure supplement 1B, right panel and Supplementary file 1am). These results indicate that the major population of TBR1-positive cells do not express Nav1.1.
Figure 14 with 4 supplements see all

Green fluorescent protein (GFP)-positive cells were mostly negative for TBR1 in L5 of Scn1a-GFP mouse neocortex.
(A) Double immunostaining of TBR1 and GFP in neocortex of 4W Scn1a-GFP mouse (line #233) detected by mouse rabbit anti-TBR1 (magenta) and anti-GFP (green) antibodies. Arrows indicate TBR1-negative/GFP-positive cells. Magnified images outlined in (A) are shown in (A1–A6). Note that at L5 GFP-positive cells were mostly TBR1-negative but at L2/3 more than half of GFP-positive cells were TBR1-positive. Scale bars: 100 μm (A), 50 μm (A1–A6). (B) Bar graphs indicating the percentage of cells with TBR1- and GFP-positive/negative nuclei and somata per GFP-positive cells and/or TBR1-positive nuclei (left panels) (see also Supplementary file 1ag), the percentage of cells with GFP-positive/negative somata per cells with TBR1-positive nuclei (middle panels) (see also Supplementary file 1ah), and the percentage of cells with TBR1-positive/negative nuclei per cells with GFP-positive somata (right panels) (see also Supplementary file 1ai) in L2/3, L5, and L6. Cells in primary motor cortex of Scn1a-GFP mouse at P15 and 4W were counted. Note that 86% (P15) and 95% (4W) of cells with TBR1-positive cells are GFP-negative in L5 (middle panels), and 90% (P15) and 96% (4W) of cells with GFP-positive cells are TBR1-negative in L5 (right panel). L2/3, L5, L6: neocortical layer II/III, V, VI. +, positive; −, negative.
-
Figure 14—source data 1
Numerical source data for Figure 14B.
- https://cdn.elifesciences.org/articles/87495/elife-87495-fig14-data1-v1.xlsx
Figure 15
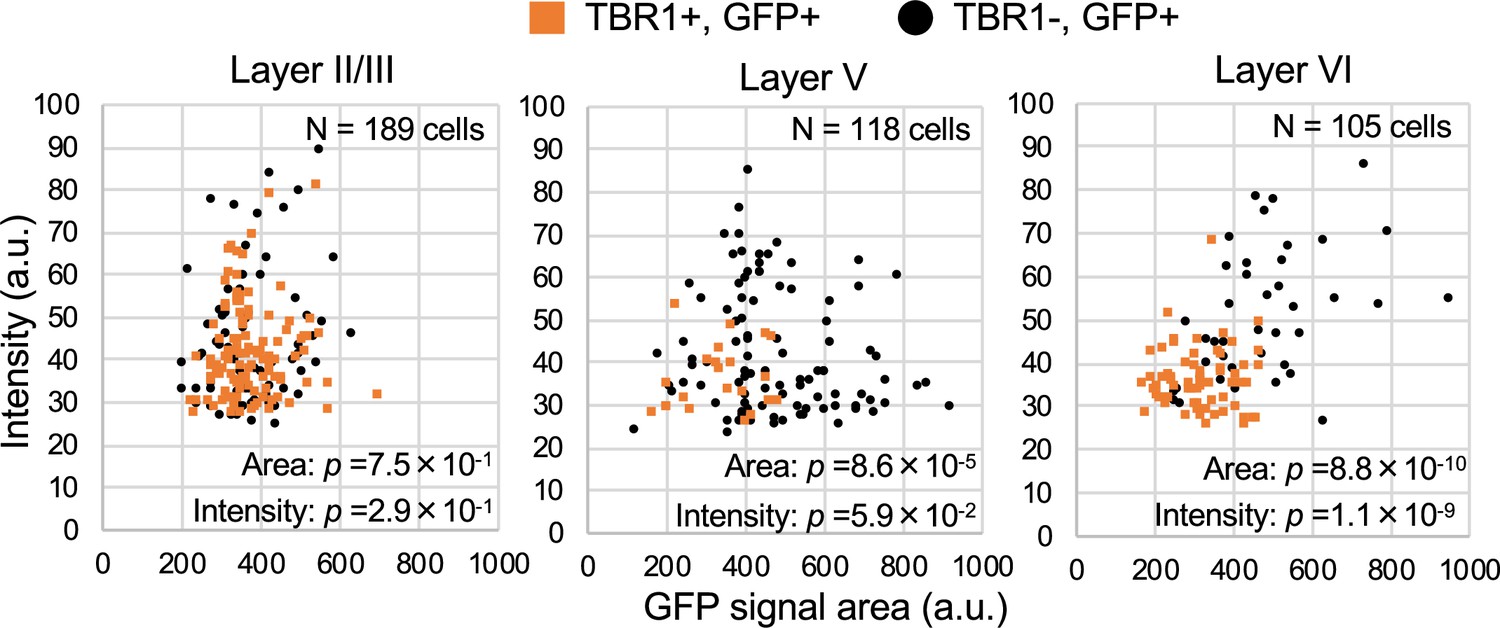
TBR1-positive cells have lower green fluorescent protein (GFP) signal intensities in Scn1a-GFP mouse neocortex.
Scatter plots of intensities and area sizes of GFP immunosignals in GFP-positive cells with TBR1-positive/negative nuclei. Cells at primary motor cortex in parasagittal sections from 4W Scn1a-GFP mouse (line #233) were analyzed. TBR1-positive (orange squares) and negative (black circles) cells in neocortical L2/3, L5, and L6 are plotted (see also Supplementary file 1aj). Note that GFP signal intensities of TBR1/GFP-double positive cells were significantly lower than that of TBR1-negative/GFP-positive cells (L6), and signal area size of TBR1/GFP-double positive cells was significantly smaller than that of TBR1-negative/GFP-positive cells (L5, L6). Statistical significance was assessed using t-test. a.u., arbitrary unit; +, positive; −, negative.
-
Figure 15—source data 1
Numerical source data for Figure 15.
- https://cdn.elifesciences.org/articles/87495/elife-87495-fig15-data1-v1.xlsx
To investigate whether TBR1-positive cells express Nav1.2, we performed triple immunostaining of TBR1, Nav1.2, and ankyrinG on Scn1a-GFP mice (Figure 14—figure supplement 2 and Supplementary file 1an, ao, ap, aq). In L5, contrary to the low ratios of GFP-positive cells among TBR1-positive cells (11% at P15 and 5% at 4W) (Figure 14B, middle panels and Supplementary file 1aq), the ratios of Nav1.2-positive cells among TBR1-positive cells are high (69% (L2/3), 69%(L5), and 69% (L6) at P15) (Figure 14—figure supplement 2B, right-upper panel and Supplementary file 1ap). The ratios of TBR1-positive cells among Nav1.2-positive cells are 29% (L2/3), 53% (L5), and 62% (L6) at P15 (Figure 14—figure supplement 2B, middle upper panel and Supplementary file 1ao).
We further performed triple immunostaining for TBR1, Nav1.2, and GFP on Scn1a-GFP mice (Figure 14—figure supplement 3 and Supplementary file 1ar) and found that most (88%) of L6 TBR1-positive cells are GFP-negative.
Taken together, these results indicate that most TBR1-positive neurons including L6 CT neurons do not express Nav1.1 but expresses Nav1.2.
As a whole, above results showed that a minor subpopulation of L2/3 CC and L5 PT neurons express Nav1.1 while the majority of L2/3 CC, L5/6 CS, and L6 CT neurons express Nav1.2. A breakdown of L5 neuron subtypes is specifically described in Figure 14—figure supplement 4.
Discussion
In our present study, we developed Scn1a promoter-driven GFP mice in which the expression of GFP replicates that of Nav1.1. All PV-INs and most of SST-INs were GFP-positive in the neocortex and hippocampus of the Scn1a-GFP mouse, being consistent with the previous reports of Nav1.1 expression in those inhibitory neurons (Ogiwara et al., 2007; Lorincz and Nusser, 2008; Ogiwara et al., 2013; Li et al., 2014; Tai et al., 2014; Tian et al., 2014; Yamagata et al., 2017). All Nav1.1-positive cells were GFP-positive. Reversely all GFP-positive cells were also Nav1.1-positive in the hippocampus, but in the neocortex only a half of GFP-positive cells were Nav1.1-positive. This is largely because in the hippocampus Nav1.1 expression is restricted to inhibitory neurons, but in the neocortex Nav1.1 is expressed not only in inhibitory but also in a subpopulation of excitatory neurons in which Nav1.1 expression is low and not easily detected immunohistochemically by anti-Nav1.1 antibodies. In neocortex, one-third of GFP-positive cells were GABAergic cells such as PV-INs and SST-INs, and the remaining two-third were excitatory neurons. GFP signals were especially intense in PV-positive cells indicating strong Nav1.1 expression in those cells, while GFP signals in SST-positive cells were similar to those in excitatory neurons. In addition, extensive immunostaining analyses using projection neuron markers FEZF2 and TBR1 together with anti-Nav1.2 antibody also revealed that most L5 PT neurons and a minor subpopulation of L2/3 CC neurons express Nav1.1 while the majority of L6 CT, L5/6 CS, and L2/3 CC neurons express Nav1.2.
The above observations should contribute to understanding of neural circuits responsible for diseases such as epilepsy and neurodevelopmental disorders caused by SCN1A and SCN2A mutations. Dravet syndrome is a sporadic intractable epileptic encephalopathy characterized by early onset (6 months to 1 year after birth) epileptic seizures, intellectual disability, autistic features, ataxia, and increased risk of sudden unexpected death in epilepsy (SUDEP). De novo loss-of-function mutations of SCN1A are found in more than 80% of the patients (Claes et al., 2001; Sugawara et al., 2002; Fujiwara et al., 2003; Dravet et al., 2005; Depienne et al., 2009; Meng et al., 2015). In mice, loss-of-function Scn1a mutations caused clinical features reminiscent of Dravet syndrome, including early-onset epileptic seizures, hyperactivity, learning and memory deficits, reduced sociability and ataxic gaits and premature sudden death (Yu et al., 2006; Ogiwara et al., 2007; Oakley et al., 2009; Cao et al., 2012; Han et al., 2012; Kalume et al., 2013; Ito et al., 2013). As also shown in the present study, Nav1.1 is densely localized at AISs of inhibitory cells such PV-IN (Ogiwara et al., 2007; Ogiwara et al., 2013; Li et al., 2014; Tai et al., 2014) and selective elimination of Nav1.1 in PV-IN in mice leads to epileptic seizures, sudden death, and deficits in social behavior and spatial memory (Ogiwara et al., 2013; Tatsukawa et al., 2018). It is thus plausible that Nav1.1 haplo-deficiency in PV-IN plays a pivotal role in the pathophysiology of many clinical aspects of Dravet syndrome. Notably, mice with selective Nav1.1 reduction in global inhibitory neurons were at a greater risk of lethal seizure than heterozygote null mice (Nav1.1 KO/+), and the mortality risk of mice with Nav1.1 haplo-deficiency in inhibitory neurons was significantly decreased or improved with additional Nav1.1 reduction in dorsal telencephalic excitatory neurons (Ogiwara et al., 2013). These observations indicate beneficial effects of Nav1.1 deficiency in excitatory neurons for epileptic seizures and sudden death. Because of the absence of Nav1.1 in hippocampal excitatory neurons (Ogiwara et al., 2007; Ogiwara et al., 2013; Yamagata et al., 2017) and the present study, the ameliorating effect was most possibly caused by Nav1.1 haploinsufficiency in neocortical excitatory neurons. Kalume et al., 2013 reported that parasympathetic hyperactivity is observed in Nav1.1 haplo-deficient mice and it causes ictal bradycardia and finally result in seizure-associated sudden death.
Our present finding of Nav1.1 expression in L5 PT projection neurons which innervate the vagus nerve may possibly elucidate the ameliorating effects of Nav1.1 haploinsufficiency in neocortical excitatory neurons for sudden death of Nav1.1 haplo-deficient mice and may contribute to the understanding of the neural circuit for SUDEP in patients with Dravet syndrome. Further studies including retrograde tracing and electrophysiological analyses are needed.
We previously proposed that impaired CS excitatory neurotransmission causes epilepsies in Scn2a haplo-deficient mouse (Miyamoto et al., 2019). Our present finding of Nav1.2 expression in CS neurons is consistent and further support the proposal. Because SCN2A has been well established as one of top genes which show de novo loss-of-function mutations in patients with ASD (Hoischen et al., 2014; Johnson et al., 2016) and because impaired striatal function was suggested in multiple ASD animal models (Fuccillo, 2016), our finding of Nav1.2 expression in CS neurons may also contribute to the understanding of neural circuit for ASD caused by SCN2A mutations.
In summary, the present investigations using a newly developed Scn1a promoter-driven GFP mice together with anti-Nav1.1/Nav1.2 antibodies and neocortical neuron markers revealed the cellular expression of Nav1.1 and Nav1.2 in more detail. Further developments of mice containing fluorescent protein reporters driven by promoters for other sodium channel genes and combinatorial analyses of those mice are needed to segregate and redefine their unique functional roles in diverse neuronal populations of complexed neural circuits.
Materials and methods
Animal work statement
Request a detailed protocolAll animal experimental protocols were approved by the Animal Experiment Committee of Nagoya City University and RIKEN Center for Brain Science. Mice were handled in accordance with the guidelines of the Animal Experiment Committee.
Mice
Scn1a-GFP BAC transgenic mice were generated as follows. A murine BAC clone RP23-232A20 containing the Scn1a locus was obtained from the BACPAC Resource Center (https://bacpacresources.org). A GFP reporter cassette, comprising a red-shifted variant GFP cDNA and a downstream polyadenylation signal derived from pIRES2-EGFP (Takara Bio), was inserted in-frame into the initiation codon of the Scn1a coding exon 1 using the Red/ET Recombineering kit (Gene Bridges), according to the manufacturer’s instructions. A correctly modified BAC clone verified using PCR and restriction mapping was digested with SacII, purified using CL-4B sepharose (GE Healthcare), and injected into pronuclei of C57BL/6J zygotes. Mice carrying the BAC transgene were identified using PCR with primers: mScn1a_TG_check_F1, 5′-TGTTCTCCACGTTTCTGGTT-3′, mScn1a_TG_check_R1, 5′-TTAGCCTTCTCTTCTGCAATG-3′, and EGFP_R1, 5′-GCTCCTGGACGTAGCCTTC-3′ that detect the wild-type Scn1a allele as an internal control (186 bp) and the inserted transgene (371 bp). Of 15 independent founder lines that were crossed with C57BL/6J mice, 12 lines successfully transmitted the transgene to their progeny. Of 12 founders, two lines (#184 and 233) that display much stronger green fluorescent intensity compared with other lines were selected, and maintained on a congenic C57BL/6J background. The mouse lines had normal growth and development. The line #233 has been deposited to the RIKEN BioResource Research Center (https://web.brc.riken.jp/en/) for distribution under the registration number RBRC10241. Slc32a1-Cre BAC transgenic mice and loxP flanked transcription terminator cassette CAG promotor-driven tdTomato transgenic mice Ai14 (B6.Cg-Gt(ROSA)26Sortm14(CAG-tdTomato)Hze/J, Stock No: 007914, The Jackson Laboratory, USA) were maintained on a C57BL/6J background. To generate triple mutant mice (Scn1a-GFP, Slc32a1-Cre, Ai14), heterozygous Scn1a-GFP and Slc32a1-Cre mice were mated with homozygous Rosa26-tdTomato transgenic mice.
Western blot analysis
Request a detailed protocolMouse brains at 5W were isolated and homogenized in homogenization buffer [(0.32 M sucrose, 10 mM 4-(2-hydroxyethyl)-1-piperazineethanesulfonic acid (HEPES), 2 mM ethylenediaminetetraacetic acid (EDTA), and 1× complete protease inhibitor cocktail (Roche Diagnostics), pH 7.4)], and centrifuged for 15 min at 1000 × g. The supernatants were next centrifuged for 30 min at 30,000 × g. The resulting supernatants were designated as the cytosol fraction. The pellets were subsequently resuspended in lysis buffer (50 mM HEPES and 2 mM EDTA, pH 7.4) and centrifuged for 30 min at 30,000 × g. The resulting pellets, designated as the membrane fraction, were dissolved in 2 M Urea, 1× NuPAGE reducing agent (Thermo Fisher Scientific) and 1× NuPAGE LDS sample buffer (Thermo Fisher Scientific). The cytosol and membrane fractions were separated on the NuPAGE Novex Tris-acetate 3–8% gel (Thermo Fisher Scientific) or the PAG mini SuperSep Ace Tris-glycine 5–20% gel (FUJIFILM Wako Pure Chemical), and transferred to nitrocellulose membranes (Bio-Rad). Membranes were probed with the rabbit anti-Nav1.1 (250 ng/ml; IO1, Ogiwara et al., 2007), chicken anti-GFP (1:5000; ab13970, Abcam), and mouse anti-β tubulin (1:10,000; T0198, Sigma-Aldrich) antibodies, and incubated with the horseradish peroxidase-conjugated goat anti-rabbit IgG (1:2000; sc-2004, Santa Cruz Biotechnology), rabbit anti-chicken IgY (1:1000; G1351, Promega), and goat anti-mouse IgG (1:5000; W4011, Promega) antibodies. Blots were detected using the enhanced chemiluminescence reagent (PerkinElmer). The intensity of the Nav1.1 immunosignals was quantified using the Image Studio Lite software (LI-COR, Lincoln, NE, USA) and normalized to the level of β-tubulin or glyceraldehyde 3-phosphate dehydrogenase.
Histochemistry
Request a detailed protocolMice were deeply anesthetized, perfused transcardially with 4% paraformaldehyde (PFA) in phosphate-buffered saline (PBS) (10 mM phosphate buffer, 2.7 mM KCl, and 137 mM NaCl, pH 7.4) or periodate-lysine-4% PFA (PLP). Brains were removed from the skull and post-fixed. For fluorescent imaging, PFA-fixed brains were cryoprotected with 30% sucrose in PBS, cut in 30 µm parasagittal sections, and mounted on glass slides. The sections on glass slides were treated with TrueBlack Lipofuscin Autofluorescence Quencher (Biotium) to reduce background fluorescence. For immunostaining, frozen parasagittal sections (30 µm) were blocked with 4% BlockAce (DS Pharma Biomedical) in PBS for 1 hr at room temperature (RT), and incubated with rat anti-GFP (1:500; GF090R, Nacalai Tesque). The sections were then incubated with the secondary antibodies conjugated with biotin (1:200; Vector Laboratories). The antibody–antigen complexes were visualized using the Vectastain Elite ABC kit (Vector Laboratories) with Metal enhanced DAB substrate (34065, PIERCE). For immunofluorescent staining, we prepared 6 µm parasagittal sections from paraffin embedded PLP-fixed brains of mice. The sections were processed as previously described (Yamagata et al., 2017). Following antibodies were used to detect GFP, Nav1.1, Nav1.2, TBR1, FEZF2, ankyrinG, NeuN, parvalbumin, and somatostatin; mouse anti-GFP antibodies (1:500; 11814460001, Roche Diagnostics), anti-Nav1.1 antibodies (1:10,000; rabbit IO1, 1:500; goat SC-16031, Santa Cruz Biotechnology), anti-Nav1.2 antibodies (1:1000; rabbit ASC-002, Alomone Labs; goat SC-31371, Santa Cruz Biotechnology), rabbit anti-TBR1 antibody (1:1000; ab31940, Abcam or 1:500; SC-376258, Santa Cruz Biotechnology), rabbit anti-FEZF2 antibody (1:500; #18997, IBL), ankyrinG antibodies (1:500; mouse SC-12719, rabbit SC-28561; goat, SC-31778, Santa Cruz Biotechnology), mouse anti-NeuN biotin-conjugated antibody (1:2000; MAB377B, Millipore), rabbit anti-parvalbumin (1:5000; PC255L, Merck), and rabbit anti-somatostatin (1:5000; T-4103, Peninsula Laboratories, 1:1000; SC-7819, Santa Cruz Biotechnology) antibodies. As secondary antibodies, Alexa Fluor Plus 488-, 555-, 594-, and 647-conjugated antibodies (1:1000; A32723, A32766, A32794, A32754, A32849, A32795, A32787, Thermo Fisher Scientific) were used. To detect NeuN, Alexa 647-conjugated streptavidin (1:1000; S21374, Thermo Fisher Science) was used. Images were captured using fluorescence microscopes (BZ-8100 and BZ-X710, Keyence), and processed with Adobe Photoshop Elements 10 (Adobe Systems) and BZ-X analyzer (Keyence).
Fluorescence and immunofluorescence quantification
Request a detailed protocolFor quantification of inhibitory neurons in GFP-positive cells, we used Scn1a-GFP/Slc32a1-Cre/Ai14 mice at 4W. We acquired multiple color images of primary motor cortex and hippocampus from three parasagittal sections per animal. Six images per region of interest were manually counted and summarized using Adobe Photoshop Elements 10 and Excel (Microsoft). On immunofluorescence quantification, we used Scn1a-GFP mice at P15 and/or 4W for the quantification of immunosignals. For quantification of GFP-, NeuN-, PV-, SST-, Nav1.1-, Nav1.2-, FEZF2-, or TBR1-positive cells, we acquired multiple color images of primary motor cortex and hippocampus from three parasagittal sections per animal. Six to nine images per region of interest were manually quantified and summarized. For quantification of PV-, SST-, FEZF2-, or TBR1-positive cells, intensity and area size of GFP fluorescent signals were measured by Fiji software. Statistical analyses were performed by one-way analysis of variance followed by Tukey–Kramer post hoc multiple comparison test using Kyplot 6.0 (KyensLab Inc). p value smaller than 0.05 was considered statistically significant. Data are presented as the mean ± standard error of the mean.
In situ hybridization
Request a detailed protocolFrozen sections (30 µm) of PFA-fixed mouse brains at 4W were incubated in 0.3% H2O2 in PBS for 30 min at RT to quench endogenous peroxidases, and mounted on glass slides. The sections on slides were UV irradiated with 1250 mJ/cm2 (Bio-Rad), permeabilized with 0.3% Triton X-100 in PBS for 15 min at RT, and digested with 1 µg/ml proteinase K (Nacalai Tesque) in 10 mM Tris–HCl and 1 mM EDTA, pH 8.0, for 30 min at 37°C, washed twice with 100 mM glycine in PBS for 5 min at RT, fixed with 4% formaldehyde in PBS for 5 min at RT, and acetylated with 0.25% acetic anhydride in 100 mM triethanolamine, pH 8.0. After acetylation, the sections were washed twice with 0.1 M phosphate buffer, pH 8.0, incubated in a hybridization buffer [(50% formamide, 5× Sodium Chloride-Sodium Phosphate-EDTA buffer (SSPE), 0.1% Sodium dodecyl sulfate (SDS), and 1 mg/ml Yeast tRNA (Roche Diagnostics))] containing the Avidin solution (Vector Laboratories) for 2 hr at 60°C, and hybridized with 2 µg/ml digoxigenin (DIG)- and dinitrophenol (DNP)-labeled probes in a hybridization buffer containing the Biotin solution (Vector Laboratories) overnight at 60°C in a humidified chamber. The hybridized sections were washed with 50% formamide in 2× Saline-sodium citrate buffer (SSC) for 15 min at 50°C twice, incubated in TNE (1 mM EDTA, 500 mM NaCl, 10 mM Tris–HCl, pH 8.0) for 10 min at 37°C, treated with 20 µg/ml RNase A (Nacalai Tesque) in TNE for 15 min at 37°C, washed 2× SSC twice for 15 min each at 37°C twice and 0.2× SSC twice for 15 min each at 37°C. After washing twice in a high stringency buffer (10 mM Tris, 10 mM EDTA, and 500 mM NaCl, pH 8.0) for 10 min each at RT, the sections were blocked with a blocking buffer [20 mM Tris and 150 mM NaCl, pH 7.5 containing 0.05% Tween-20, 4% BlockAce (DS Pharma Biomedical) and 0.5× Blocking reagent (Roche Diagnostics)] for 1 hr at RT, and incubated with the alkaline phosphatase-conjugated sheep anti-DIG (1:500; 11093274910, Roche Diagnostics) and biotinylated rabbit anti-DNP (1:100; BA-0603, Vector Laboratories) antibodies in a blocking buffer overnight at 4 °C, followed by incubation with the biotinylated goat anti-rabbit antibody (1:200; BA-1000, Vector Laboratories) in a blocking buffer at RT for 1–2 hr. The probes were visualized using the NBT/BCIP kit (Roche Diagnostics), VECTASTAIN Elite ABC kit (Vector Laboratories), and ImmPACT DAB substrate (Vector Laboratories).
The DIG-labeled RNA probes for Scn1a designed to target the 3′-untranlated region (nucleotides 6488–7102 from accession number NM_001313997.1) were described previously (Ogiwara et al., 2007), and synthesized using the MEGAscript transcription kits (Thermo Fisher Scientific) with DIG-11-UTP (Roche Diagnostics). The DNP-labeled RNA probes for GFP were derived from the fragment corresponding to nucleotides 1256–1983 in pIRES2-EGFP (Takara Bio), and prepared using the MEGAscript transcription kits (Thermo Fisher Scientific) with DNP-11-UTP (PerkinElmer).
Data availability
All data generated or analyzed during this study are included in the manuscript and supporting file; Source Data files have been provided for Figure 1, 3–5, 7–15 and Figure 2—figure supplement 2, Figure 3—figure supplement 2, Figure 4—figure supplement 1, Figure 12—figure supplement 1–3, Figure 14—figure supplement 1–3.
References
-
Regional and temporal expression of sodium channel messenger Rnas in the rat brain during developmentExperimental Brain Research 86:562–567.https://doi.org/10.1007/BF00230529
-
Voltage-Gated sodium channels at 60: Structure, function and pathophysiologyThe Journal of Physiology 590:2577–2589.https://doi.org/10.1113/jphysiol.2011.224204
-
De Novo mutations in the sodium-channel Gene Scn1A cause severe myoclonic epilepsy of infancyAmerican Journal of Human Genetics 68:1327–1332.https://doi.org/10.1086/320609
-
Spectrum of Scn1A Gene mutations associated with Dravet syndrome: Analysis of 333 patientsJournal of Medical Genetics 46:183–191.https://doi.org/10.1136/jmg.2008.062323
-
BookSevere myoclonic epilepsy in infancy (Dravet syndrome)In: Roger J, editors. Epileptic Syndromes in Infancy, Childhood and Adolescence. John Libbey Eurotext Ltd. pp. 89–113.
-
Striatal circuits as a common node for autism pathophysiologyFrontiers in Neuroscience 10:27.https://doi.org/10.3389/fnins.2016.00027
-
Prioritization of neurodevelopmental disease genes by discovery of new mutationsNature Neuroscience 17:764–772.https://doi.org/10.1038/nn.3703
-
Fez1 is layer-specifically expressed in the adult mouse neocortexThe European Journal of Neuroscience 20:2909–2916.https://doi.org/10.1111/j.1460-9568.2004.03763.x
-
Parvalbumin is expressed in glutamatergic and GABAergic Corticostriatal pathway in miceThe Journal of Comparative Neurology 477:188–201.https://doi.org/10.1002/cne.20246
-
Sudden unexpected death in a mouse model of Dravet syndromeThe Journal of Clinical Investigation 123:1798–1808.https://doi.org/10.1172/JCI66220
-
Cell-type-dependent molecular composition of the axon initial segmentThe Journal of Neuroscience 28:14329–14340.https://doi.org/10.1523/JNEUROSCI.4833-08.2008
-
Tbr1 and Fezf2 regulate alternate Corticofugal neuronal identities during neocortical developmentThe Journal of Neuroscience 31:549–564.https://doi.org/10.1523/JNEUROSCI.4131-10.2011
-
Sodium Channelopathies in neurodevelopmental disordersNature Reviews. Neuroscience 22:152–166.https://doi.org/10.1038/s41583-021-00449-5
-
Impaired Cortico-striatal excitatory transmission triggers epilepsyNature Communications 10:1917.https://doi.org/10.1038/s41467-019-09954-9
-
Corticostriatal Connectivity and its role in diseaseNature Reviews Neuroscience 14:278–291.https://doi.org/10.1038/nrn3469
-
Parvalbumin neurons in the forebrain as revealed by Parvalbumin-CRE transgenic miceNeuroscience Research 63:213–223.https://doi.org/10.1016/j.neures.2008.12.007
-
Molecular identity of axonal sodium channels in human cortical pyramidal cellsFrontiers in Cellular Neuroscience 8:297.https://doi.org/10.3389/fncel.2014.00297
-
Developmental and cell type-specific expression of the neuronal marker Neun in the murine cerebellumJournal of Neuroscience Research 73:400–409.https://doi.org/10.1002/jnr.10655
-
Nav1.2 is expressed in caudal ganglionic eminence-derived Disinhibitory interneurons: Mutually exclusive distributions of Nav1.1 and Nav1.2Biochemical and Biophysical Research Communications 491:1070–1076.https://doi.org/10.1016/j.bbrc.2017.08.013
-
BookMutations of voltage-Gated sodium channel genes Scn1A and Scn2A in epilepsy, intellectual disability, and autismIn: Sara C, Verpelli C, editors. Neuronal and Synaptic Dysfunction in Autism Spectrum Disorder and Intellectual Disability. Elsiver. pp. 233–251.
Article and author information
Author details
Funding
Japan Society for the Promotion of Science (JP20H03566)
- Kazuhiro Yamakawa
RIKEN Center for Brain Science
- Kazuhiro Yamakawa
Japan Agency for Medical Research and Development (JP18dm0107092)
- Kazuhiro Yamakawa
Japan Society for the Promotion of Science (JP16H06276)
- Kazuhiro Yamakawa
Ministry of Education, Culture, Sports, Science and Technology (JP17H01564)
- Kazuhiro Yamakawa
Takeda Science Foundation
- Ikuo Ogiwara
- Kazuhiro Yamakawa
Kiyokun Foundation
- Ikuo Ogiwara
- Kazuhiro Yamakawa
Japan Society for the Promotion of Science (JP19790747)
- Ikuo Ogiwara
Japan Society for the Promotion of Science (JP21791020)
- Ikuo Ogiwara
Japan Society for the Promotion of Science (JP16K15564)
- Ikuo Ogiwara
Japan Society for the Promotion of Science (JP19K08284)
- Ikuo Ogiwara
Japan Epilepsy Research Foundation
- Ikuo Ogiwara
- Tetsuya Tatsukawa
Japan Society for the Promotion of Science (JP23H02799)
- Kazuhiro Yamakawa
The funders had no role in study design, data collection, and interpretation, or the decision to submit the work for publication.
Acknowledgements
We thank Dr. Yaguchi (Laboratory for Behavioral Genetics) and the staff members at the Research Resources Division of RIKEN Center for Brain Science for technical assistance in generating Scn1a-GFP BAC Tg mice and Dr. Kaneda (Nippon Medical School) for his support. This study was supported in part by MEXT/JSPS KAKENHI JP20H03566, JP17H01564, JP16H06276, JP23H02799, AMED JP18dm0107092, RIKEN Center for Brain Science (KY); Takeda Science Foundation, Kiyokun Foundation (IO and KY); MEXT/JSPS KAKENHI JP19790747, JP21791020, JP16K15564, JP19K08284 (IO); and Japan Epilepsy Research Foundation (IO and TT).
Ethics
All animal experimental protocols were approved by the Animal Experiment Committee of Nagoya City University (#19-032) and RIKEN Center for Brain Science (W2019-1-005). Mice were handled in accordance with the guidelines of the Animal Experiment Committee.
Version history
- Preprint posted: March 31, 2021 (view preprint)
- Received: March 6, 2023
- Accepted: May 9, 2023
- Version of Record published: May 23, 2023 (version 1)
Copyright
© 2023, Yamagata, Ogiwara, Tatsukawa et al.
This article is distributed under the terms of the Creative Commons Attribution License, which permits unrestricted use and redistribution provided that the original author and source are credited.
Metrics
-
- 1,010
- views
-
- 137
- downloads
-
- 2
- citations
Views, downloads and citations are aggregated across all versions of this paper published by eLife.
Download links
A two-part list of links to download the article, or parts of the article, in various formats.
Downloads (link to download the article as PDF)
Open citations (links to open the citations from this article in various online reference manager services)
Cite this article (links to download the citations from this article in formats compatible with various reference manager tools)
Scn1a-GFP transgenic mouse revealed Nav1.1 expression in neocortical pyramidal tract projection neurons
eLife 12:e87495.
https://doi.org/10.7554/eLife.87495
Further reading
-
- Neuroscience
Nociceptive sensory neurons convey pain-related signals to the CNS using action potentials. Loss-of-function mutations in the voltage-gated sodium channel NaV1.7 cause insensitivity to pain (presumably by reducing nociceptor excitability) but clinical trials seeking to treat pain by inhibiting NaV1.7 pharmacologically have struggled. This may reflect the variable contribution of NaV1.7 to nociceptor excitability. Contrary to claims that NaV1.7 is necessary for nociceptors to initiate action potentials, we show that nociceptors can achieve similar excitability using different combinations of NaV1.3, NaV1.7, and NaV1.8. Selectively blocking one of those NaV subtypes reduces nociceptor excitability only if the other subtypes are weakly expressed. For example, excitability relies on NaV1.8 in acutely dissociated nociceptors but responsibility shifts to NaV1.7 and NaV1.3 by the fourth day in culture. A similar shift in NaV dependence occurs in vivo after inflammation, impacting ability of the NaV1.7-selective inhibitor PF-05089771 to reduce pain in behavioral tests. Flexible use of different NaV subtypes exemplifies degeneracy – achieving similar function using different components – and compromises reliable modulation of nociceptor excitability by subtype-selective inhibitors. Identifying the dominant NaV subtype to predict drug efficacy is not trivial. Degeneracy at the cellular level must be considered when choosing drug targets at the molecular level.
-
- Neuroscience
Despite substantial progress in mapping the trajectory of network plasticity resulting from focal ischemic stroke, the extent and nature of changes in neuronal excitability and activity within the peri-infarct cortex of mice remains poorly defined. Most of the available data have been acquired from anesthetized animals, acute tissue slices, or infer changes in excitability from immunoassays on extracted tissue, and thus may not reflect cortical activity dynamics in the intact cortex of an awake animal. Here, in vivo two-photon calcium imaging in awake, behaving mice was used to longitudinally track cortical activity, network functional connectivity, and neural assembly architecture for 2 months following photothrombotic stroke targeting the forelimb somatosensory cortex. Sensorimotor recovery was tracked over the weeks following stroke, allowing us to relate network changes to behavior. Our data revealed spatially restricted but long-lasting alterations in somatosensory neural network function and connectivity. Specifically, we demonstrate significant and long-lasting disruptions in neural assembly architecture concurrent with a deficit in functional connectivity between individual neurons. Reductions in neuronal spiking in peri-infarct cortex were transient but predictive of impairment in skilled locomotion measured in the tapered beam task. Notably, altered neural networks were highly localized, with assembly architecture and neural connectivity relatively unaltered a short distance from the peri-infarct cortex, even in regions within ‘remapped’ forelimb functional representations identified using mesoscale imaging with anaesthetized preparations 8 weeks after stroke. Thus, using longitudinal two-photon microscopy in awake animals, these data show a complex spatiotemporal relationship between peri-infarct neuronal network function and behavioral recovery. Moreover, the data highlight an apparent disconnect between dramatic functional remapping identified using strong sensory stimulation in anaesthetized mice compared to more subtle and spatially restricted changes in individual neuron and local network function in awake mice during stroke recovery.


