Histone variants shape chromatin states in Arabidopsis
- Gregor Mendel Institute, Austrian Academy of Sciences, Vienna BioCenter, Austria
- Vienna BioCenter, Austria
- Department of Biological Sciences, Graduate School of Science, The University of Tokyo, Hongo, Bunkyo-ku, Japan
- PRESTO, Japan Science and Technology Agency, Honcho, Japan
- Institute of Molecular Biotechnology, IMBA, Dr. Bohr-Gasse 3, Austria
Figures
Figure 1 with 1 supplement
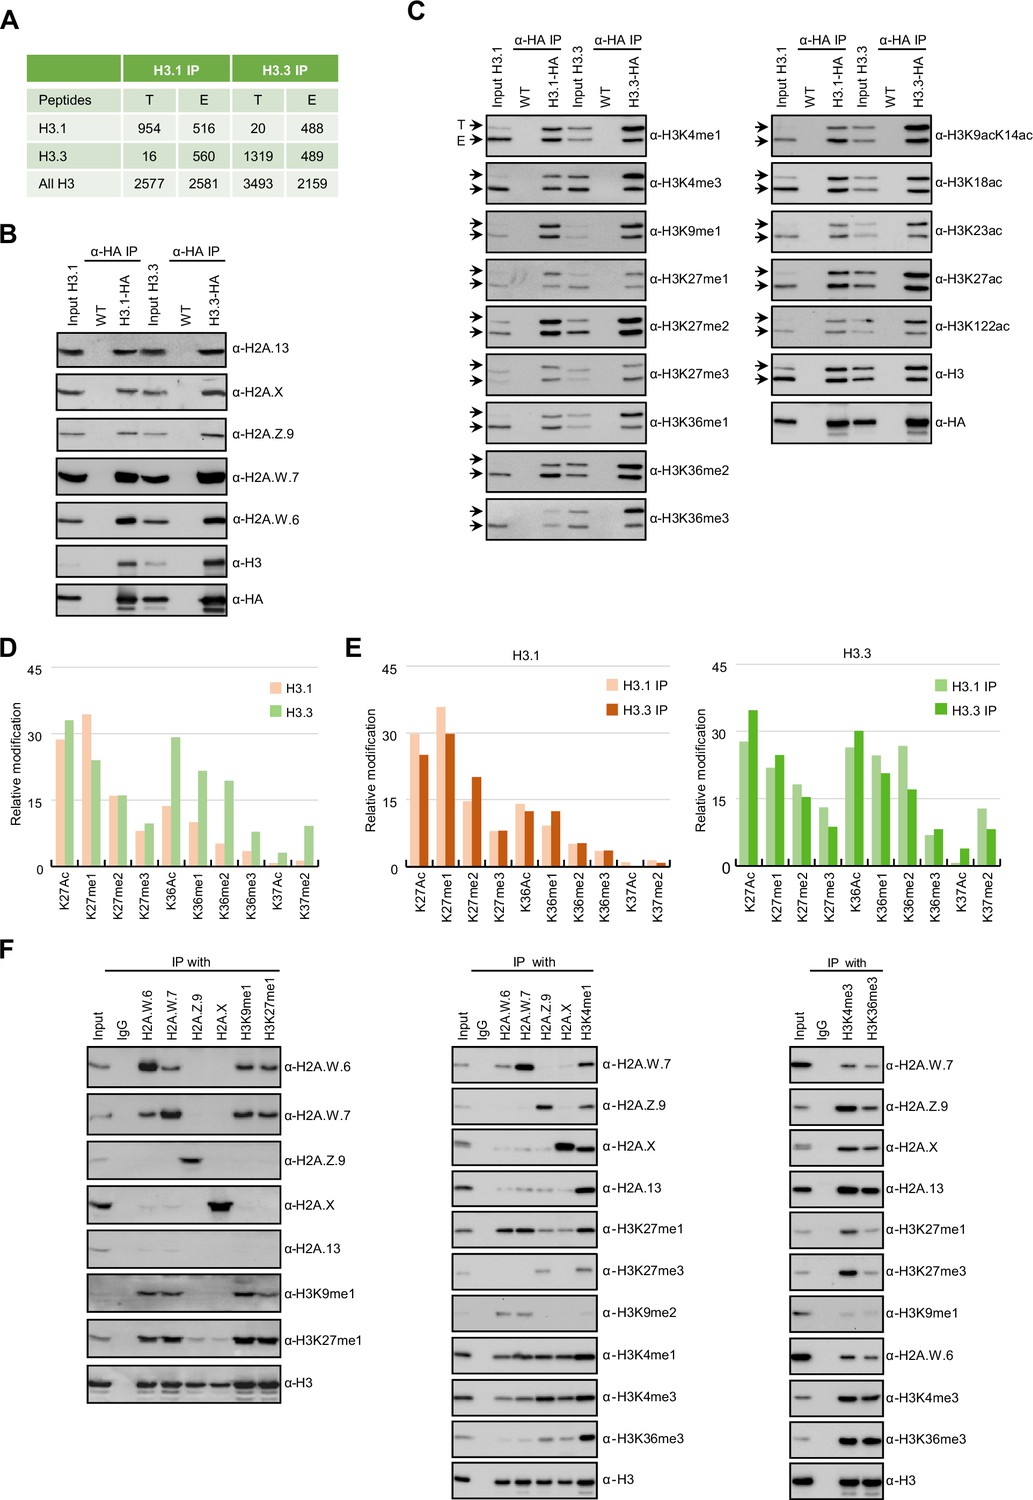
Biochemical analysis of the association between histone variants and histone marks.
(A) Histones H3.1 and H3.3 form homotypic and heterotypic nucleosomes. Spectral counts of H3.1- and H3.3-specific peptides in the respective immunoprecipitations (T – transgenic, E – endogenous H3.1 and H3.3). (B) H2A variants do not preferentially associate with H3.1- or H3.3-containing nucleosomes. HA-tagged H3.1 and H3.3 mononucleosomes were immunoprecipitated with HA agarose and analyzed for the presence of H2A variants by immunoblotting. (C) Histone H3 marks are present on both H3.1 and H3.3. HA-tagged H3.1 and H3.3 mononucleosomes were immunoprecipitated with HA agarose and analyzed for the presence of H3 marks by immunoblotting. Arrows indicate transgenic (T) and endogenous (E) H3. (D) Mass spectrometry (MS) analysis of cumulative H3K27, H3K36, and H3K37 modifications on H3.1 and H3.3. All measured spectra corresponding to H3.1 and H3.3 peptides from both IPs were used for analysis. (E) Relative abundance of H3K27, H3K36, and H3K37 modifications on H3.1 variant analyzed separately from MS data of H3.1 and H3.3 purified nucleosomes (left panel). Relative abundance of H3K27, H3K36, and H3K37 modifications on H3.3 variant analyzed separately from MS data of H3.1 and H3.3 purified nucleosomes (right panel). (F) Co-occurrence of H2A variants and H3 marks. Mononucleosomes were immunoprecipitated with the indicated antibodies and analyzed for the presence of H2A variants and H3 marks by western blotting. Original pictures of the gels are provided in Figure 1—source data 1, Figure 1—source data 2 and Figure 1—source data 3.
-
Figure 1—source data 1
- https://cdn.elifesciences.org/articles/87714/elife-87714-fig1-data1-v1.zip
-
Figure 1—source data 2
The data contains the orginal images of the gels.
- https://cdn.elifesciences.org/articles/87714/elife-87714-fig1-data2-v1.zip
-
Figure 1—source data 3
The data contains the orginal images of the gels.
- https://cdn.elifesciences.org/articles/87714/elife-87714-fig1-data3-v1.zip
Figure 1—figure supplement 1
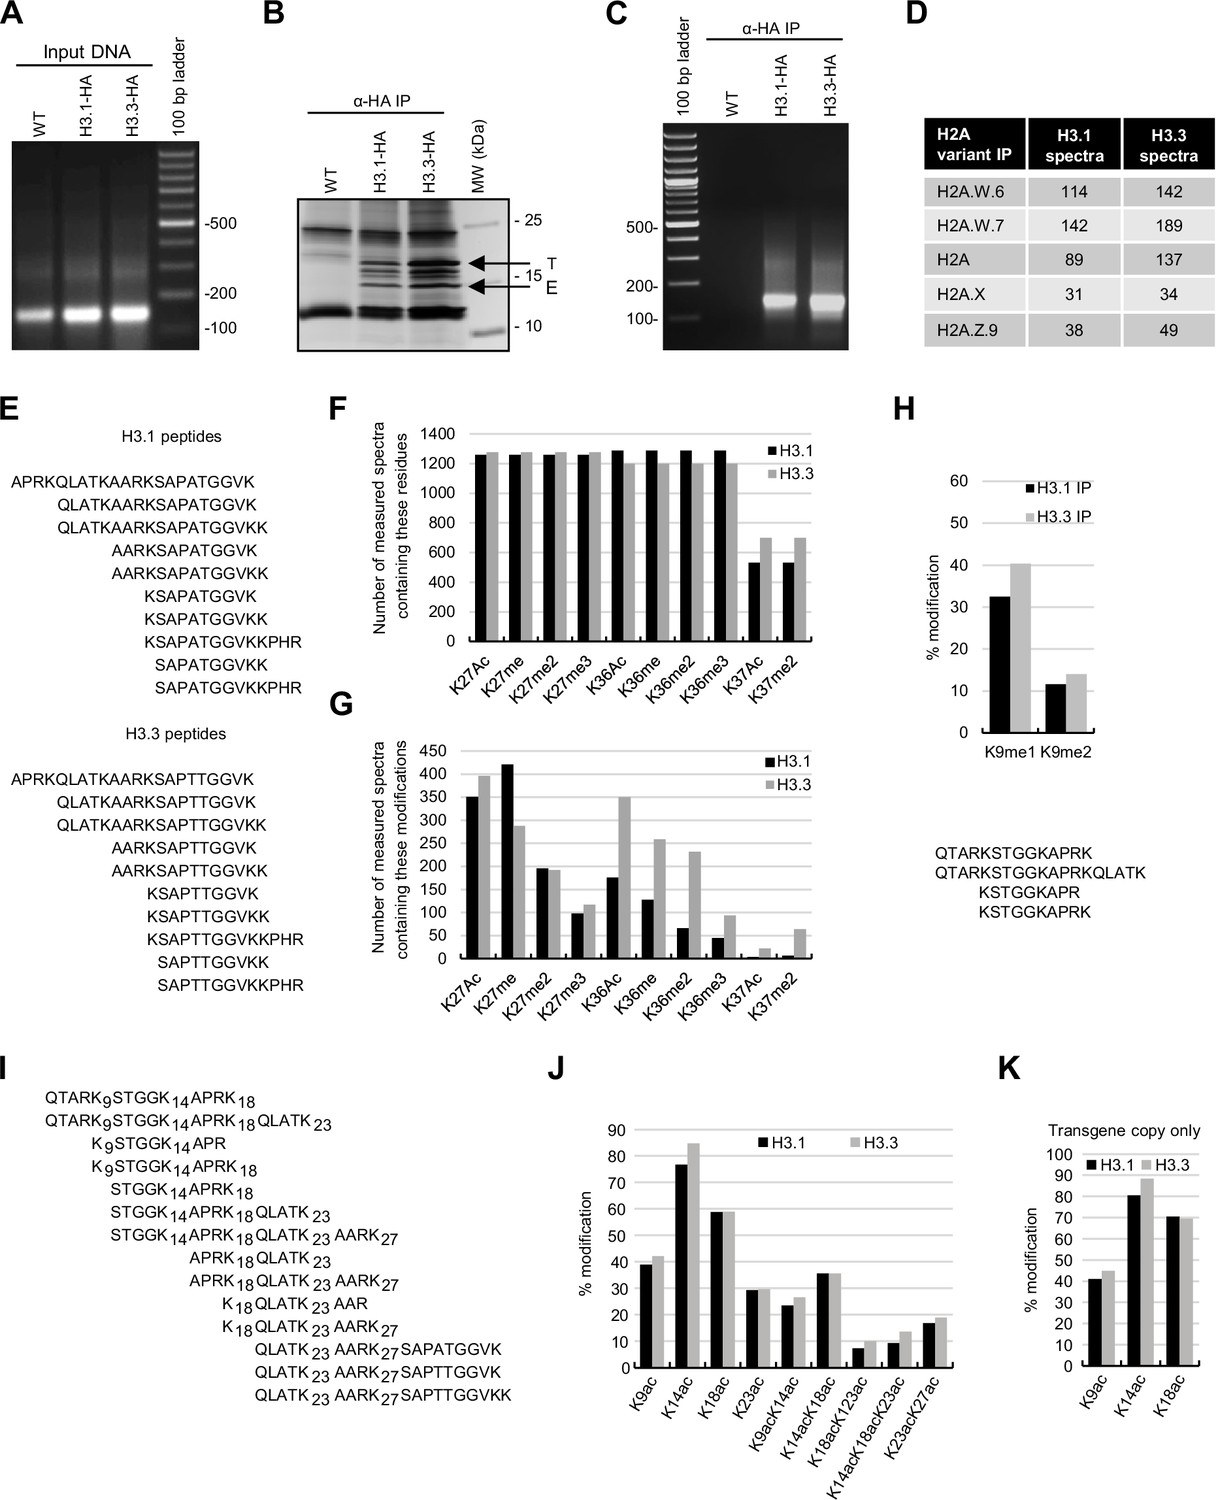
Biochemical analysis of the association between histone variants and histone marks.
(A) Analysis of DNA in input samples used for H3.1 and H3.3 mononucleosome immunoprecipitation after MNase digestion. (B) Silver-stained 8–20% gradient gel of immunoprecipitated H3.1 and H3.3 mononucleosomes. Arrows indicate transgenic (T) and endogenous (E) H3 proteins. Molecular weight markers are indicated on the right. (C) Analysis of DNA extracted from immunoprecipitated H3.1 and H3.3 mononucleosomes. (D) Spectral counts of H3.1- and H3.3-specific peptides (as indicated in panel E) in mononucleosomes immunoprecipitated with H2A variant-specific antibodies. (E) H3.1- and H3.3-specific peptides were used for the analysis of H3K27, H3K36, and H3K37 modifications. (F) Number of MS-measured spectra that covered the indicated residues in H3.1 and H3.3 mononucleosomes. (G) Number of measured MS spectra containing the indicated modifications in H3.1 and H3.3 mononucleosomes. (H) (top) Relative methylation levels of H3K9me1 and H3K9me2 on H3.1 and H3.3 were revealed from transgenic copies of the respective H3 variants. (bottom) Sequences of peptides used to evaluate H3K9me1 and H3K9me2 by MS. (I) Sequences of peptides used to evaluate H3 acetylation by MS. (J) Relative acetylation levels of the indicated H3 residues in immunoprecipitated H3.1 and H3.3 mononucleosomes without differentiating H3.1 and H3.3 variants. (K) Relative acetylation levels of the indicated H3 residues on H3.1 and H3.3 were revealed from transgenic copies of the respective H3 variants. Original pictures of the gels are provided in Figure 1—figure supplement 1—source data 1.
-
Figure 1—figure supplement 1—source data 1
The data contains the orginal images of the gels.
- https://cdn.elifesciences.org/articles/87714/elife-87714-fig1-figsupp1-data1-v1.zip
Figure 2 with 2 supplements
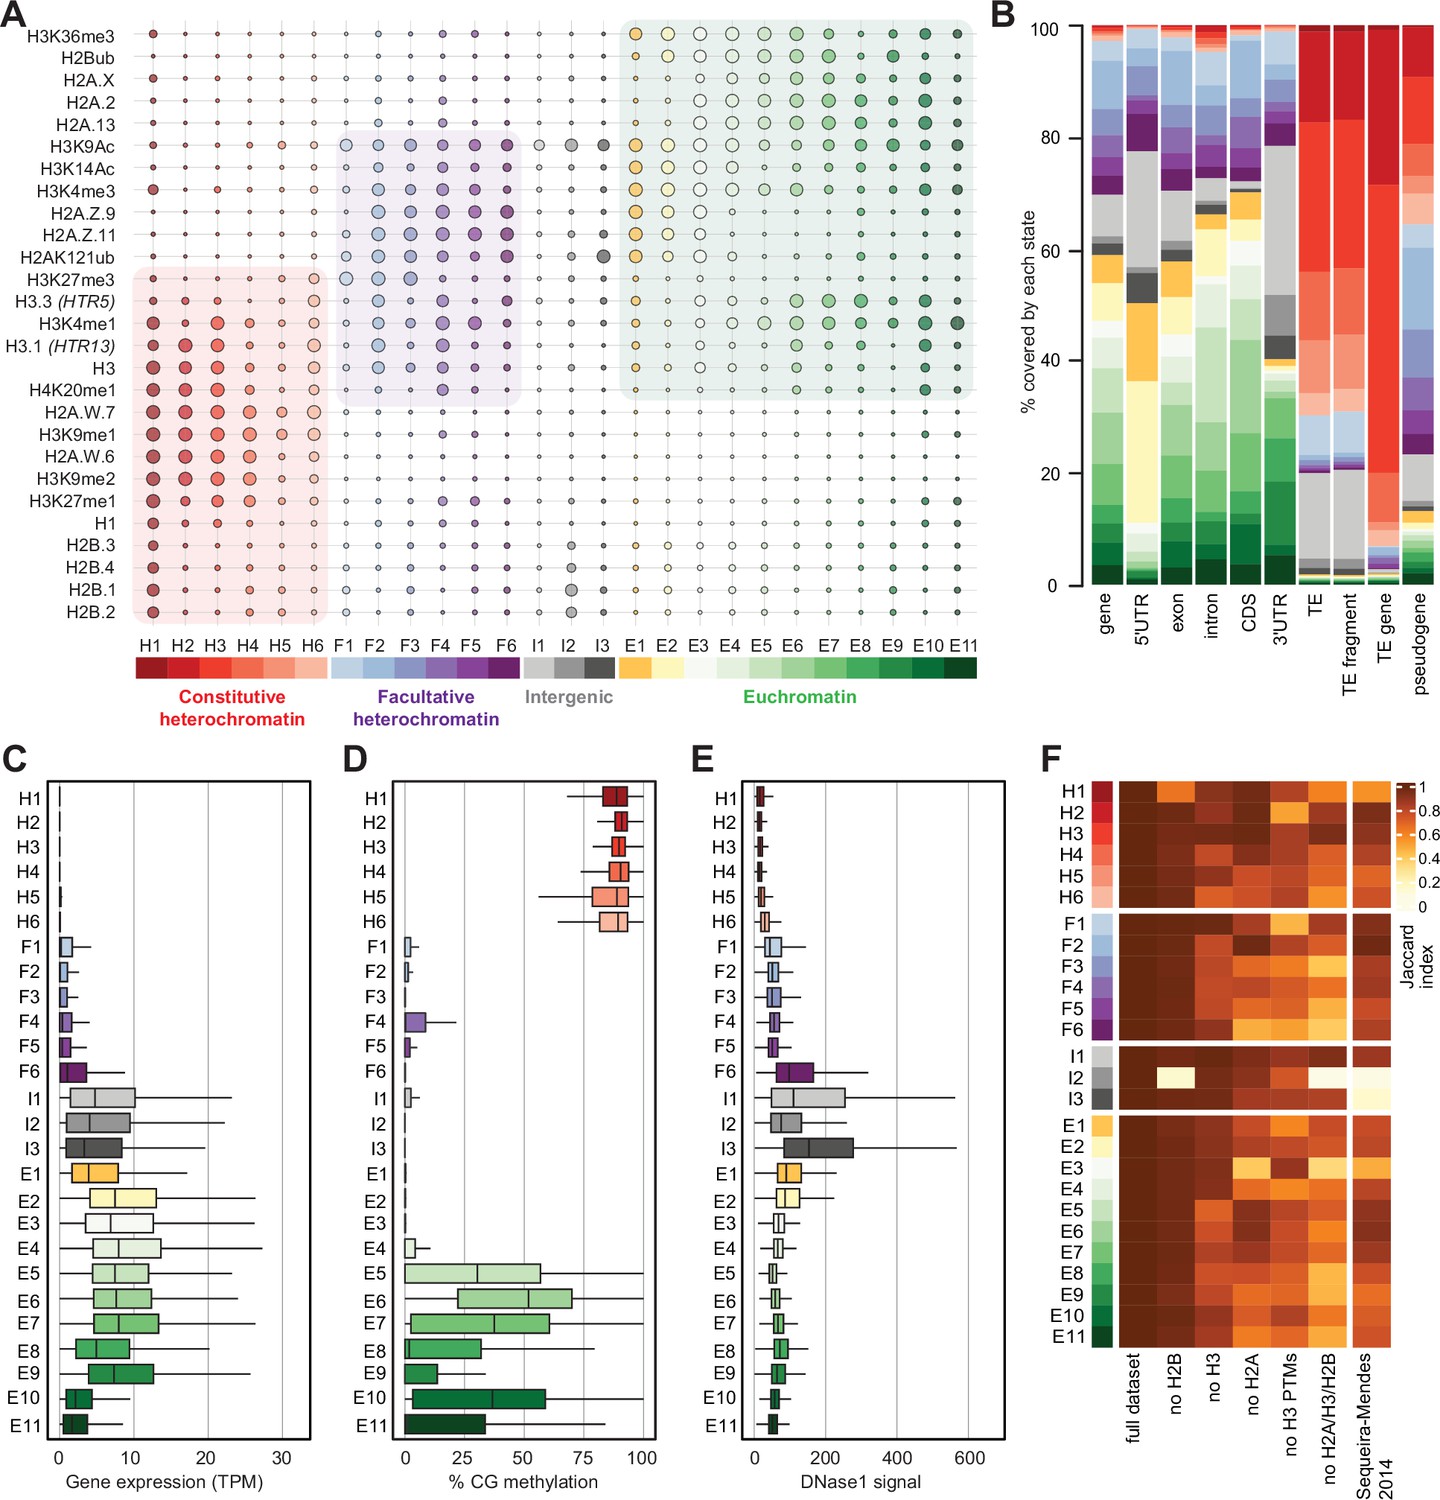
Histone variants define chromatin states in Arabidopsis thaliana.
(A) Bubble plot showing the emission probabilities for histone modifications/variants across the 26 chromatin states. (The size of the bubble represents the emission probability ranging from 0 to 1). The colors are ascribed for each type of chromatin. (B) Stacked bar plot showing the overlap between annotated genomic features and chromatin states. (C) Box plot showing the expression of protein-coding genes overlapping with each chromatin state in Transcripts per Million (TPM). (D) Box plot showing levels of CG methylation across chromatin states. (E) Box plot comparing DNase I-seq read coverage across chromatin states representing chromatin accessibility. (F) Heatmap showing the Jaccard similarity index between the states generated using the whole model and states using a subset of marks, i.e., excluding a set of marks and variants as indicated on the x-axis. The comparison with a 9-state model (Sequeira-Mendes et al., 2014) did not include CG content, DNA methylation, H4K5ac, and H3K4me2 which were not used in the 26-state model. H2B did not seem to make a significant contribution. Excluding H3 did reduce effectively the Jaccard index for both the 26 and the 9 chromatin states model, which both included H3.1 and H3.3. The major differences between the 26 and the 9 chromatin states model are in the intergenic states. Overall H2A variants affected most strongly the Jaccard index.
-
Figure 2—source data 1
This source data contain the original pictures of the gels.
- https://cdn.elifesciences.org/articles/87714/elife-87714-fig2-data1-v1.xlsx
Figure 2—figure supplement 1
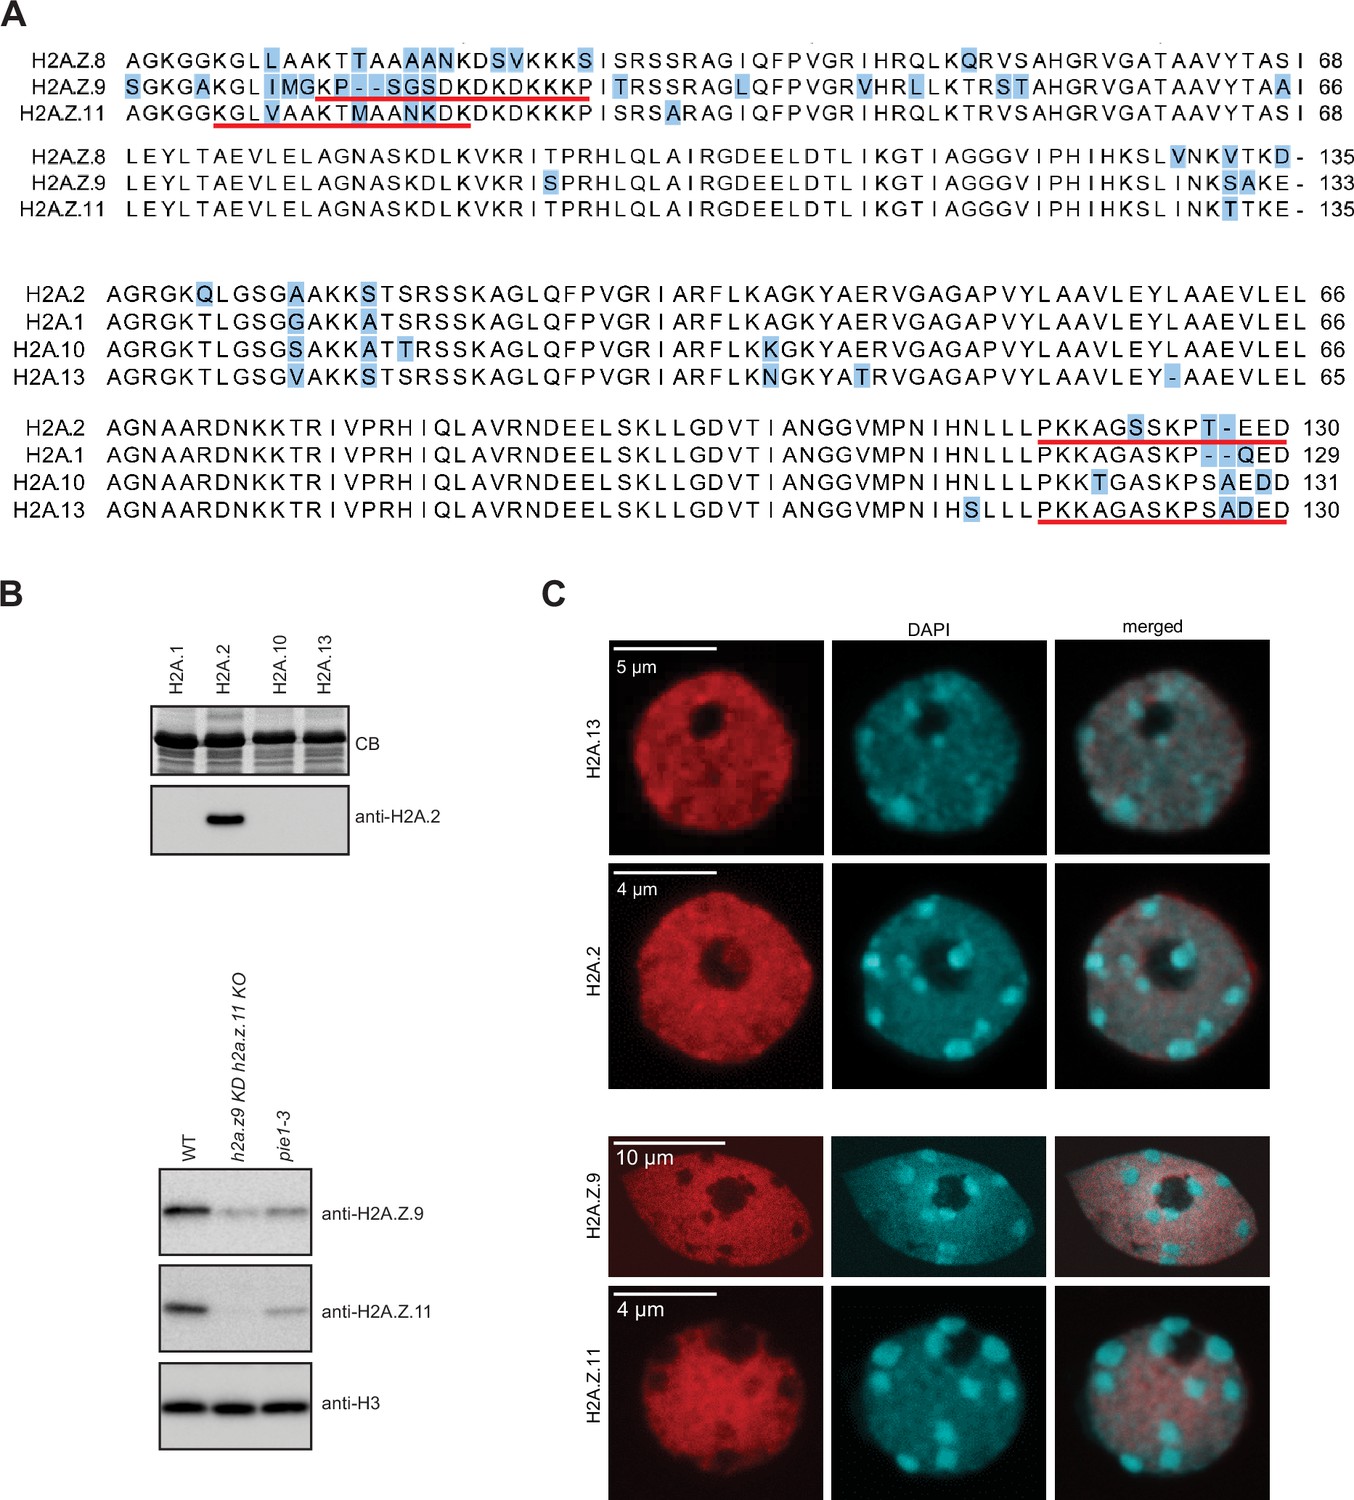
Validation of H2A.2 and H2A.
Z.11 polyclonal antibodies. (A) Sequence alignments of three H2A.Z and four H2A histone variants. Positions that differ between variants are highlighted in blue. Underlined are sequences of peptides used for immunization. (B) Antibodies against H2A.2 were tested with four H2A variants expressed in bacteria. Relevant part of Coomassie stained gel with overexpressed H2As is shown on the top. As shown on the bottom panel antibody raised against H2A.2 peptide recognized only H2A.2. Antibodies against H2A.Z.11 were tested on nuclear extracts from WT, h2a.z.9 knock-down/h2a.z.11 knock out (h2a.z.9 KD h2a.z.11 KO; this line still expresses H2A.Z.8), and pie1-3 (mutant in the large subunit of the SWR1 complex responsible for the deposition of H2A.Z) lines. The H2A.Z.11 antibodies did not recognize any protein in the h2a.z.9 KD h2a.z.11 KO line indicating its specificity. In pie1-3 line, both H2A.Z.9 and H2A.Z.11 were detected but at reduced levels as compared to WT which is in line with the inefficient deposition of H2A.Z in the absence of SWR1. The H3 antibody served as the loading control. (C) Immunostaining of WT nuclei with indicated antibodies. Original pictures of the gels are provided in Figure 2—figure supplement 1—source data 1.
-
Figure 2—figure supplement 1—source data 1
This source data contain the original pictures of the gels.
- https://cdn.elifesciences.org/articles/87714/elife-87714-fig2-figsupp1-data1-v1.zip
Figure 2—figure supplement 2
Properties of chromatin states in Arabidopsis thaliana.
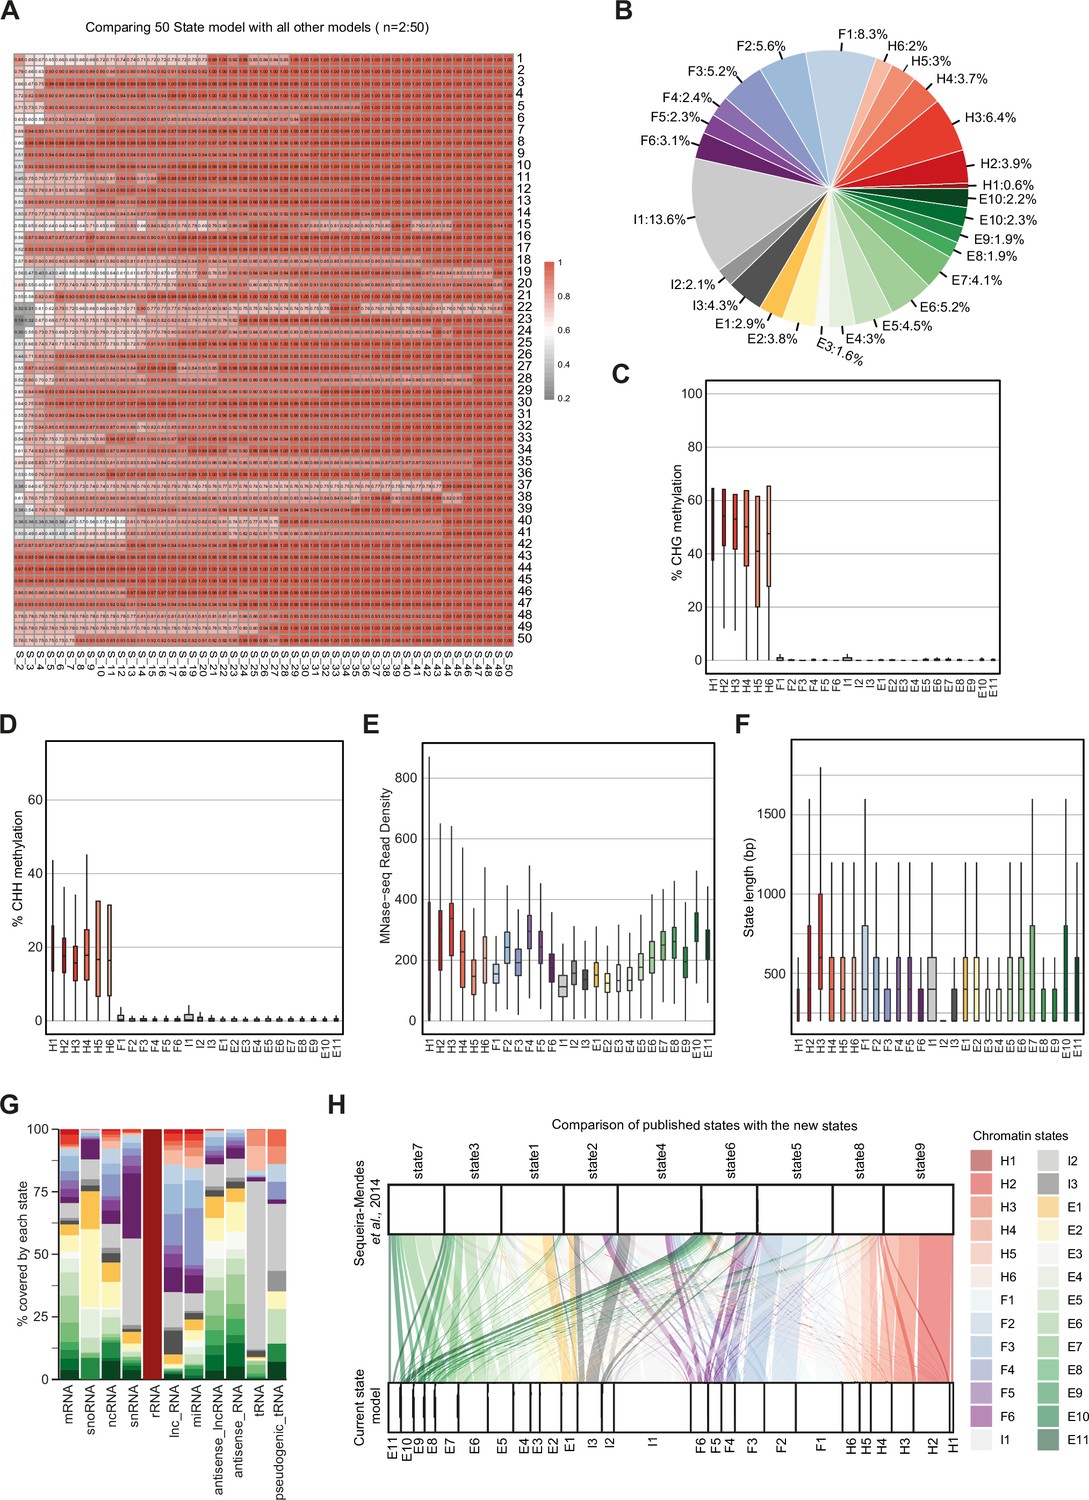
(A) Heatmap showing the correlation (0–1) between emission parameters of each model. The y-axis represents the distinct states in the reference state model (n=50). The x-axis represents models including 2–49 states compared to the 50-state model. The correlation plotted here is the maximum correlation between each state of the reference model and any state of the other models being compared. (B) Pie chart showing the proportion of the genome covered by each state. (C, D) Box plots showing levels of CHG (C) and CHH (D) methylation across states. (E) Box plot showing nucleosome occupancy (MNase-seq read density) across states. (F) Box plots showing the length (bp) of chromatin states. (G) Stacked bar plot showing the overlap between non-protein-coding gene features and chromatin states. (H) Flow diagram showing the overlap (in bp) between published states (Sequeira-Mendes et al., 2014) and the current states. The color code for the flow diagram represents the chromatin states in the current model.
Figure 3 with 2 supplements
Decreased in DNA Methylation (DDM1) loss of function disrupts chromatin states in Arabidopsis thaliana.
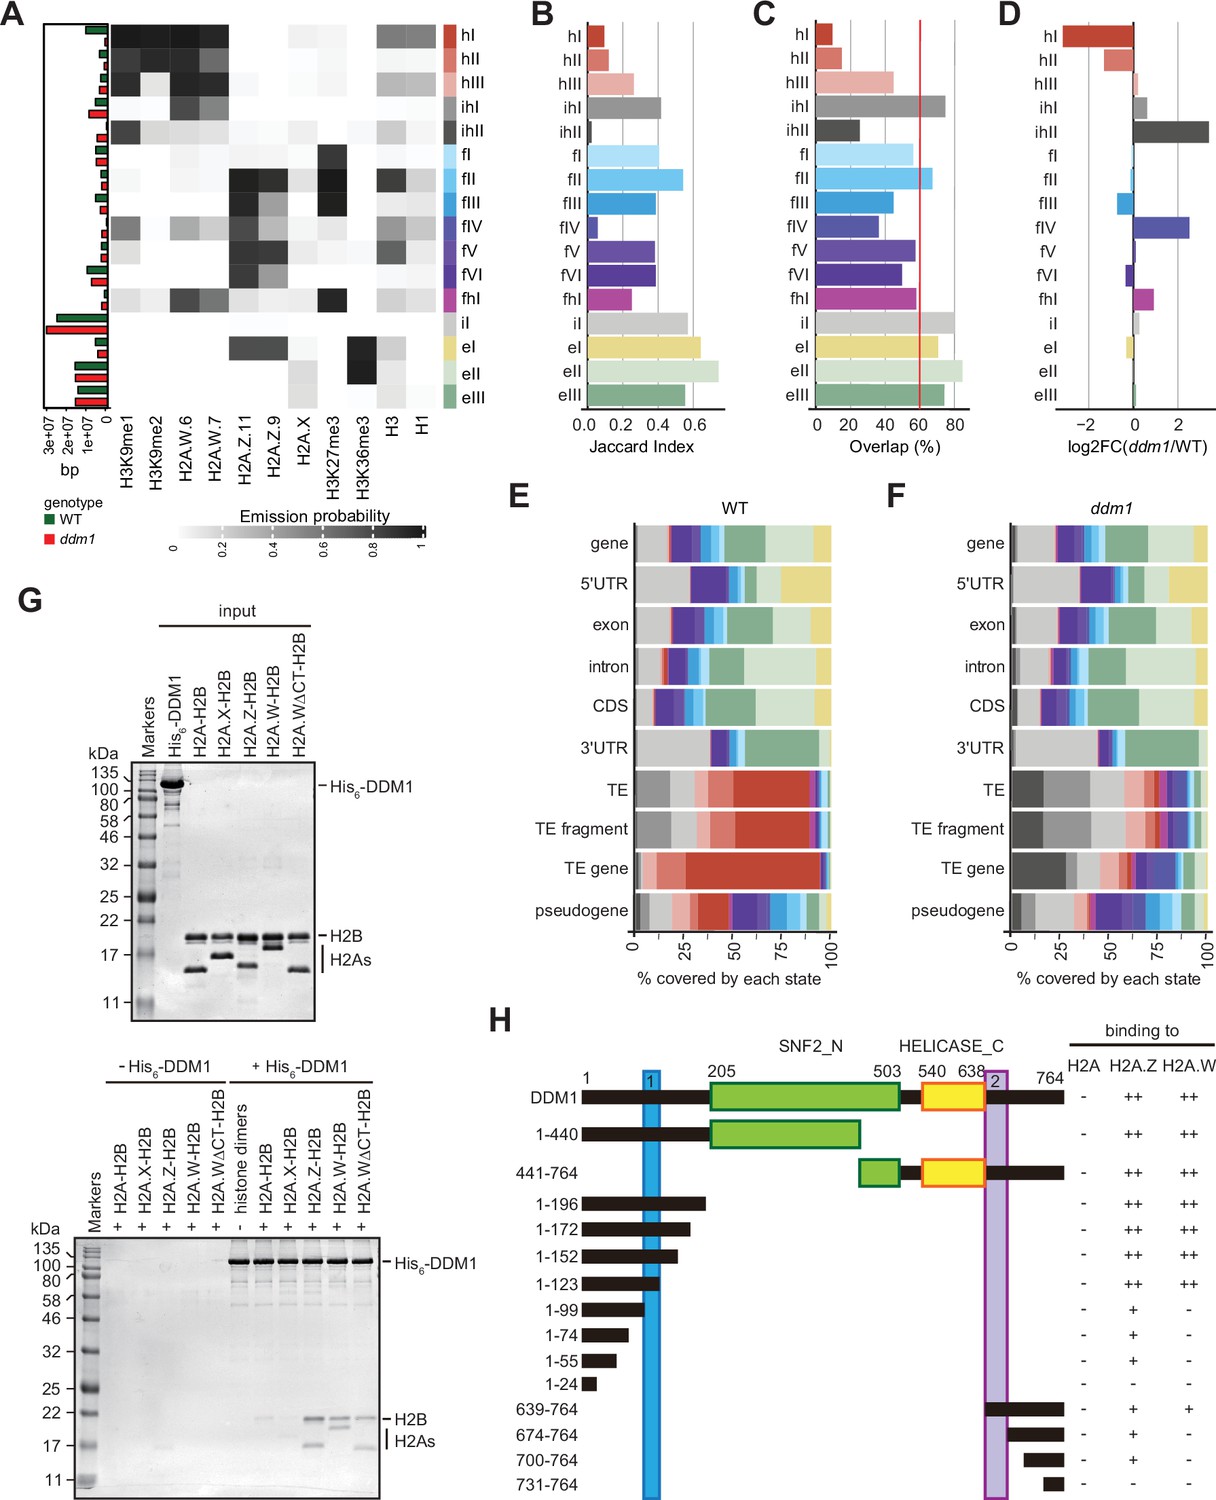
(A) Heatmap showing the emission probability for each mark/variant across the 16 chromatin states of the concatenated wild-type and ddm1 mutant model. The bar plot on the left represents the proportion of the genome covered by each state in wild-type (green) and in ddm1 (red). (B) Bar plot showing the Jaccard indices between the state assignments in wild-type and ddm1 mutant. (C) Bar plot showing the state assignment overlap between the wild-type and ddm1 for each chromatin state. The red vertical line represents the genome-wide overlap (62.2%). (D) Bar plot showing the log2 fold changes of the proportion of genome covered by each state across the ddm1 genome compared to the wild-type. (E) Stacked bar plot showing the overlap between annotated genomic features and chromatin states from the concatenated model in wild-type. (F) Stacked bar plot showing the overlap between annotated genomic features and chromatin states from the concatenated model in ddm1 mutant. (G) DDM1 interaction with H2A.W and H2A.Z. Coomassie-stained 15% SDS-PAGE gel showing input protein samples (top panel) used for in vitro pull-down (bottom panel) with His6-tagged DDM1 and histone dimers. The lane ΔCTH2A.W shows that the deletion of the C-terminal tail of H2A.W does not influence binding to DDM1. (H) Summary of the pull-down assays to identify regions in DDM1 binding to H2A.W and H2A.Z. Blue and purple boxes indicate the H2A.W binding regions in DDM1 identified by previous work (Osakabe et al., 2021). Original pictures of the gels are provided in Figure 3—source data 1.
-
Figure 3—source data 1
The data contains the orginal images of the gels.
- https://cdn.elifesciences.org/articles/87714/elife-87714-fig3-data1-v1.zip
Figure 3—figure supplement 1
Decreased in DNA Methylation (DDM1) loss of function disrupts chromatin states in Arabidopsis thaliana.
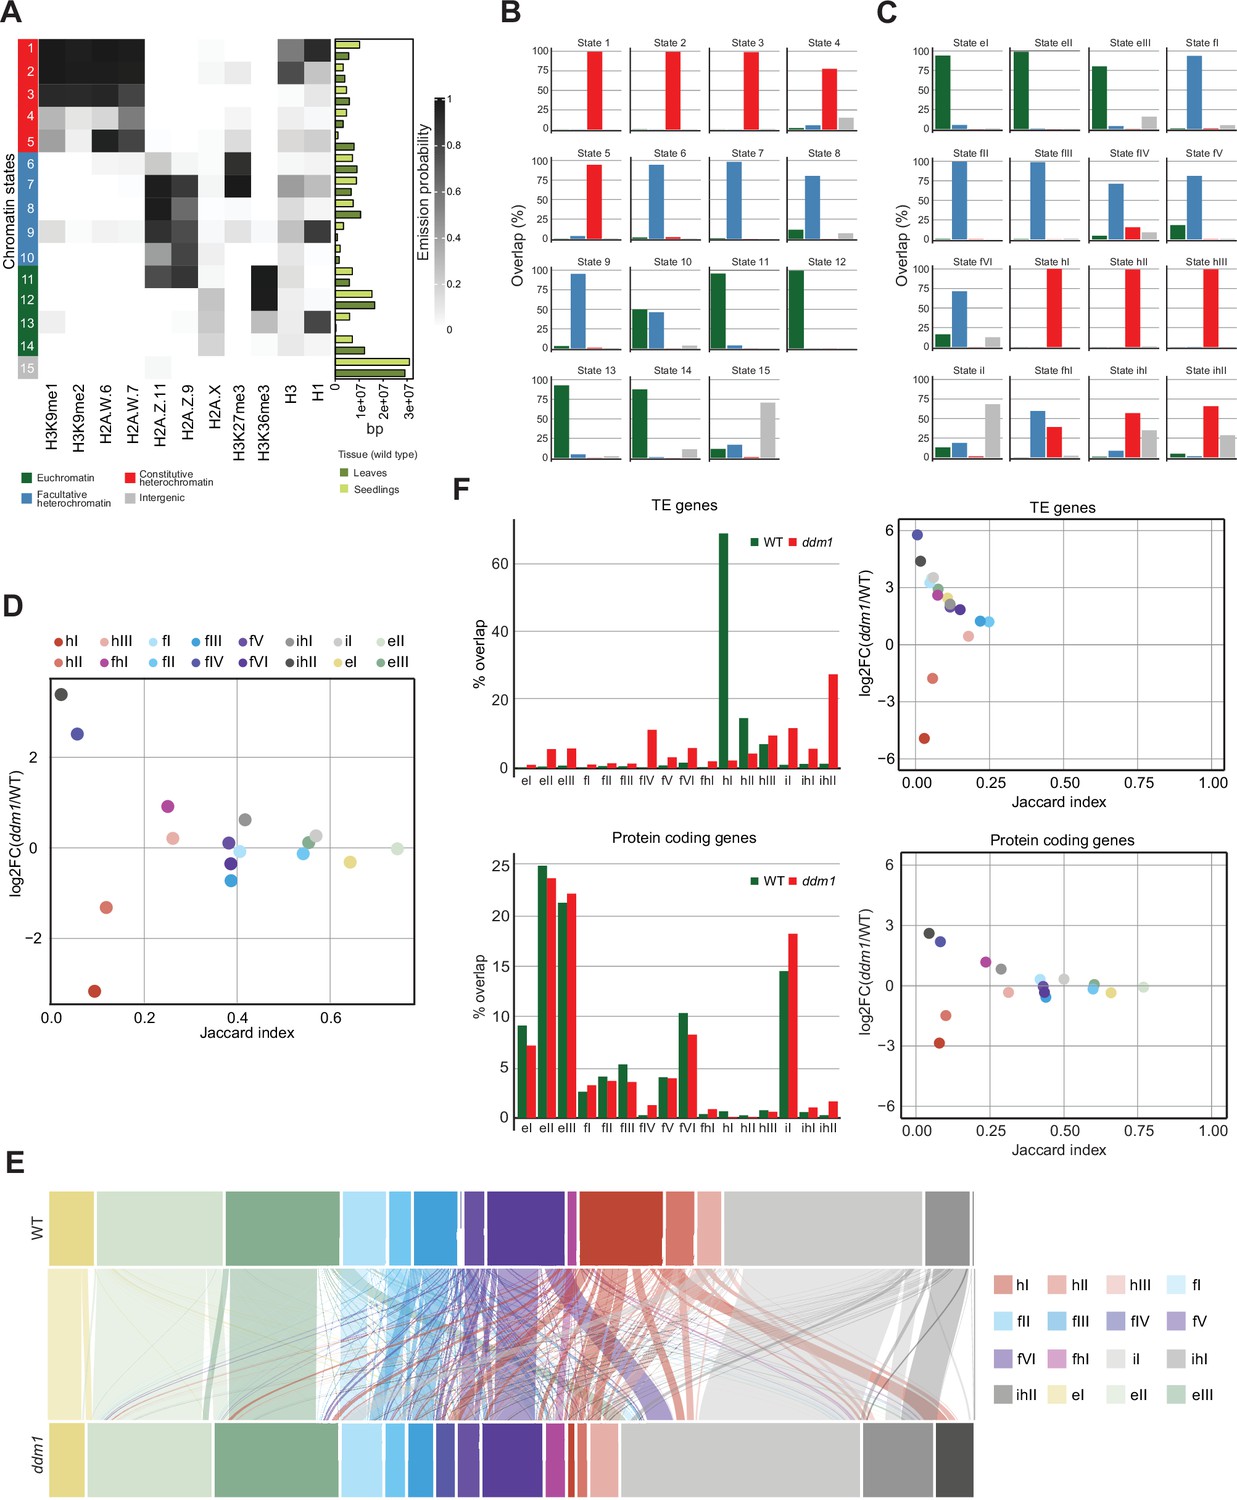
(A) Heatmap showing the emission probability of histone mark/variant across the 15 chromatin states of the concatenated model computed with chromatin profiles from seedlings and leaves. The bar plot on the right represents the proportion of the genome covered by each state in seedlings (light green) and in leaves (dark green). (B) Bar plots of the genomic overlap between the seedling and leaf concatenated model states and states from the four chromatin types in the 26-state model. 14 states show overlaps with predominantly one chromatin type, whereas only state 10 overlaps with two types in similar proportions. (C) Bar plots of the genomic overlap between the wild-type and ddm1 concatenated model states and states from the four chromatin types in the 26-state model. 13 states overlap with predominantly one chromatin type, whereas 3 states overlap with two types. In (B) and (C), color codes for four major groups of chromatin states are as in panel (A). (D) Scatter plot of the Jaccard index vs. the log2 fold change in the proportion of the genome for the 16 states from the wild-type and ddm1 concatenated model. For each state, the Jaccard index was calculated for the genomic regions covered in wild-type and in ddm1. The log2 fold change was calculated using the total number of base pairs covered by each state in ddm1 mutant compared to in the wild-type (see also methods). (E) Alluvial plot showing the chromatin state changes between the wild-type (top row) and ddm1 (bottom row). The plot was generated using the R package ggalluviel v0.12.5 (Brunson and Read, 2020). (F) Scatter plots of the Jaccard index vs. the log2 fold change in the proportion of genome for the 16 states from the wild-type and ddm1 concatenated model (see D and Methods) for TE genes and protein coding genes separately (right panels). In addition, the percentages of the combined length of the TE/protein-coding genes covered by each state are shown as bar plots on the left. Color codes for chromatin states are as in panel (D).
Figure 3—figure supplement 2
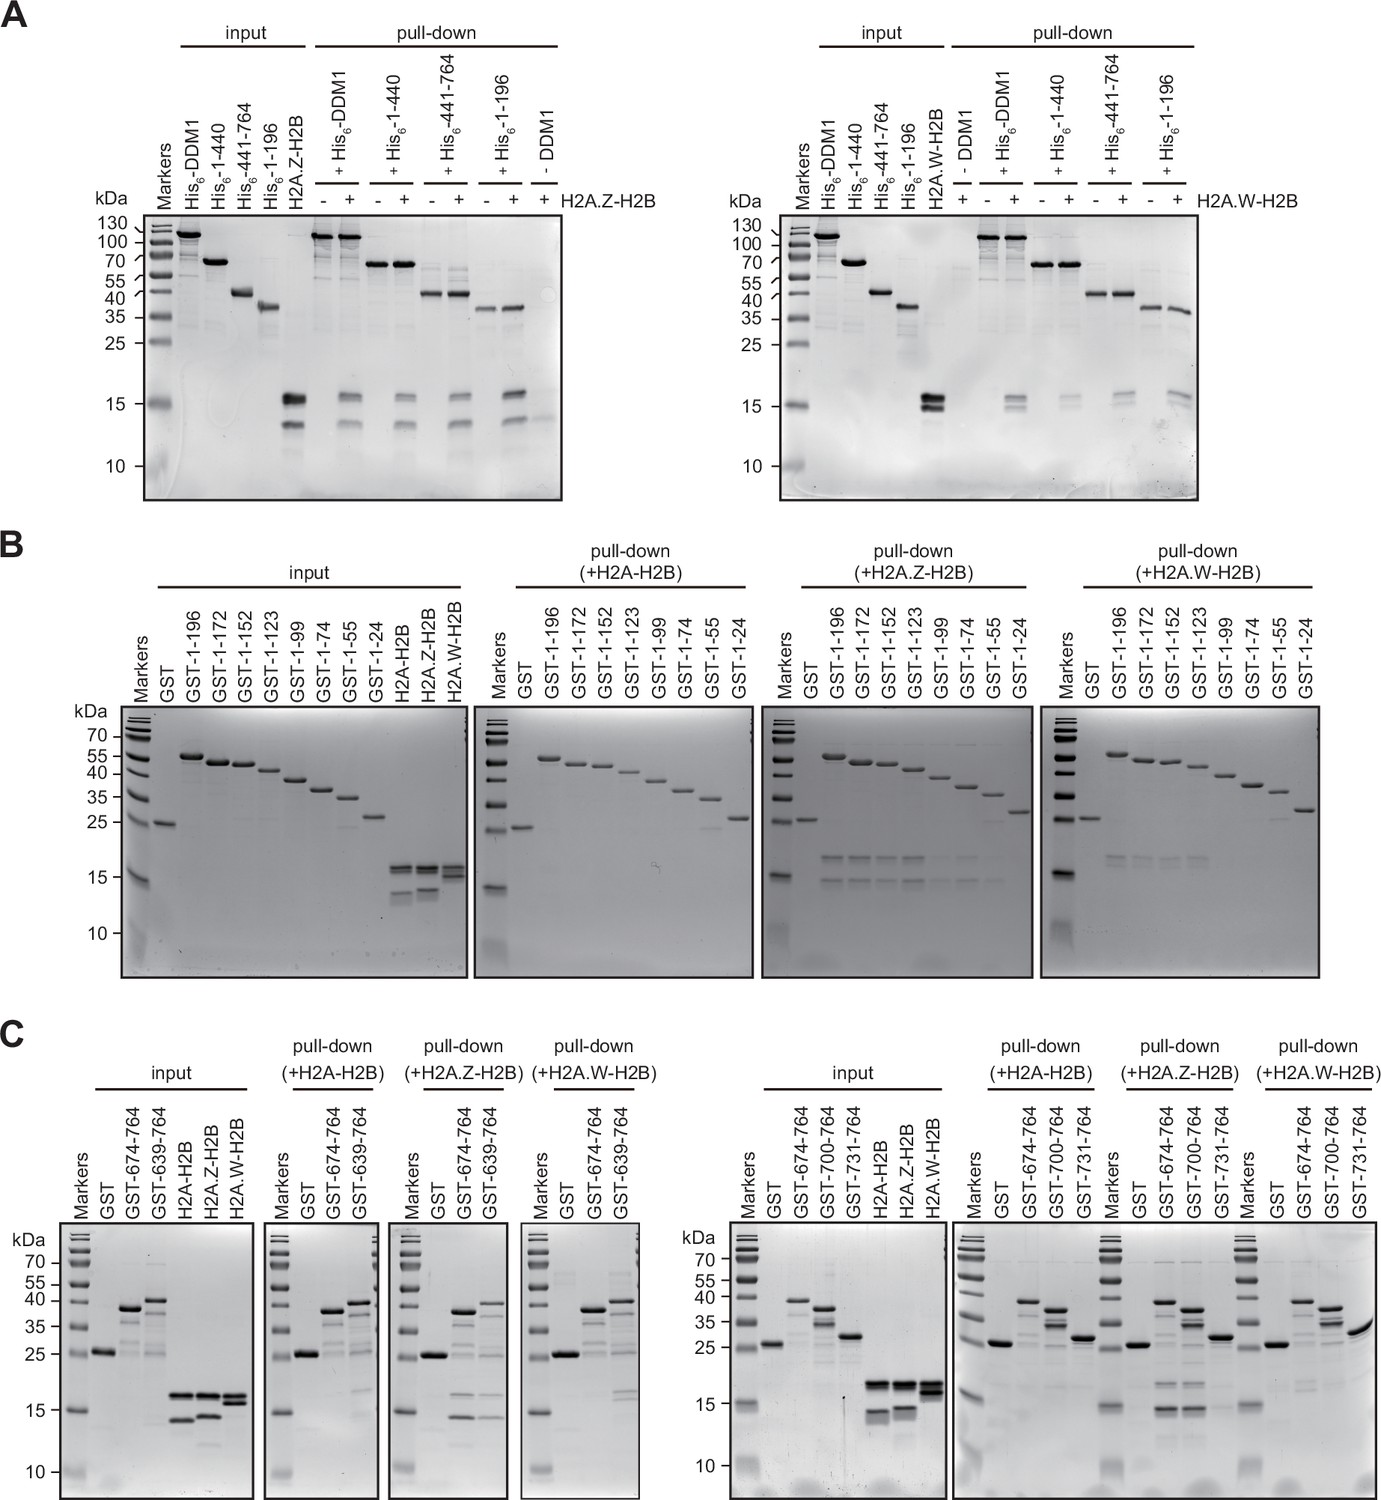
Interaction of Decreased in DNA Methylation (DDM1) and DDM1 deletion mutants with histone variants.
(A–C) Identification of H2A.W and H2A.Z binding sites in DDM1. His6- (A) or GST- (B and C) tagged DDM1 fragments, as indicated with amino acids numbers, were incubated with indicated H2A-H2B dimers and after washing samples were analyzed on 15% SDS-PAGE and stained with Coomassie. Original pictures of the gels are provided in Figure 3—figure supplement 2—source data 1.
-
Figure 3—figure supplement 2—source data 1
The souce data file contain the original pcitures of the gels.
- https://cdn.elifesciences.org/articles/87714/elife-87714-fig3-figsupp2-data1-v1.zip
Figure 4 with 2 supplements
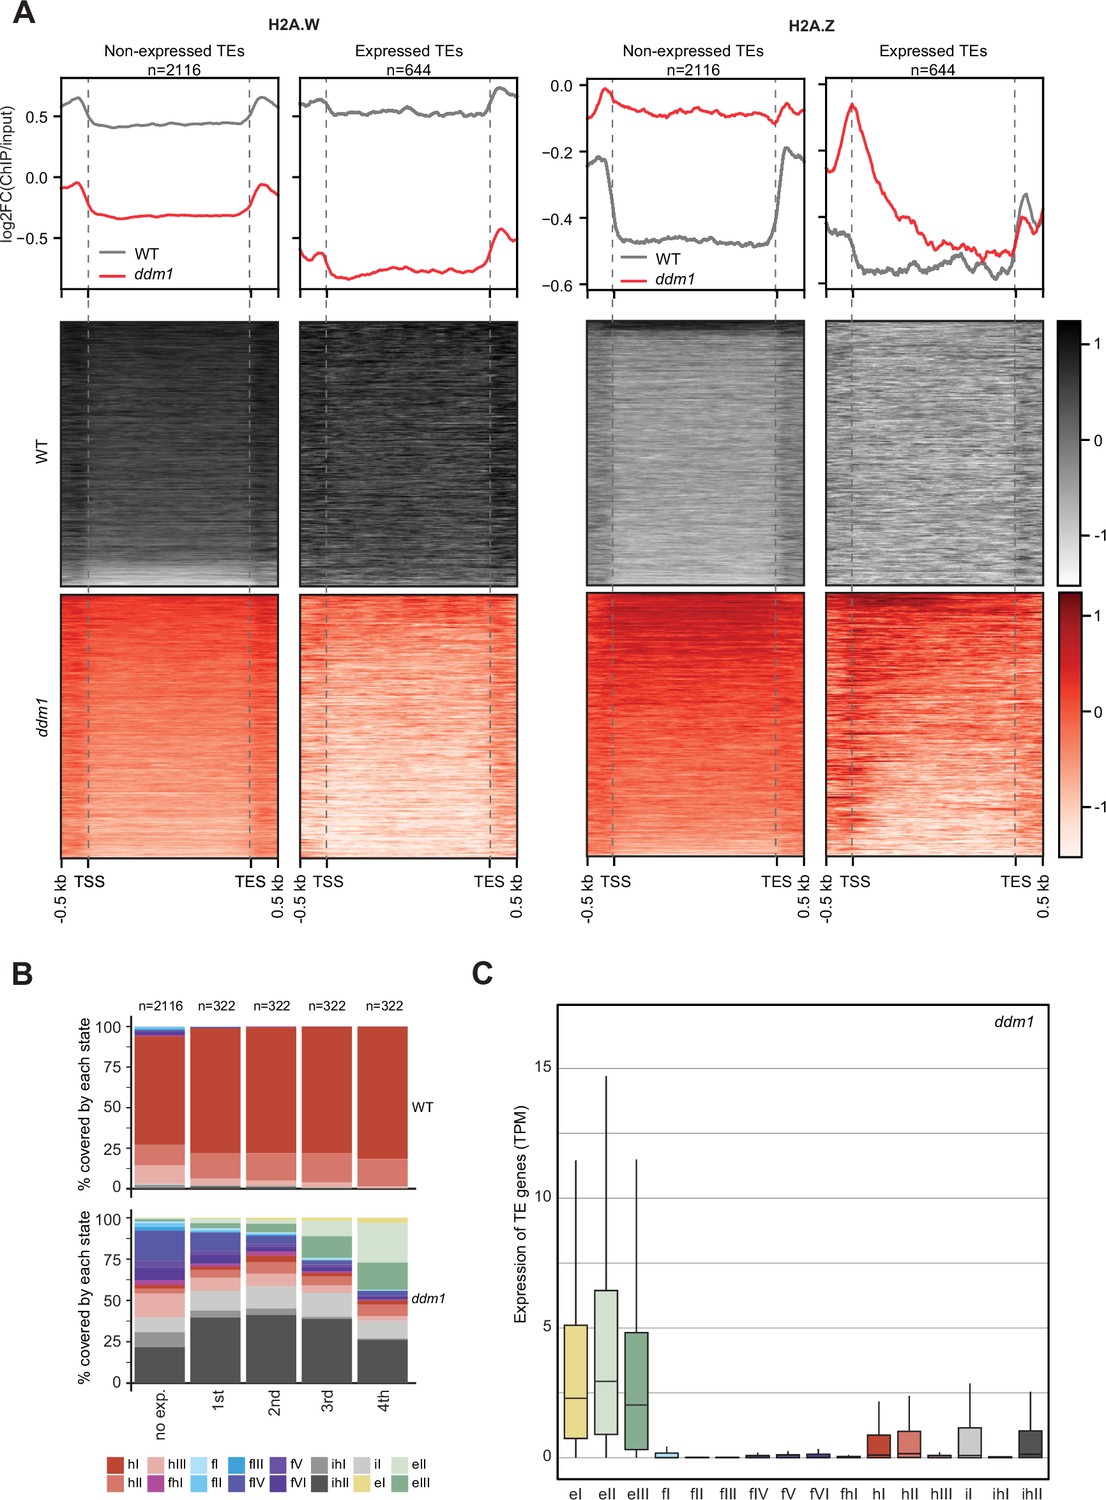
Impact of expression on chromatin states over TE genes in ddm1.
(A) Enrichment profiles of H2A.W.6 and H2A.Z.9 over TE genes in ddm1. TE genes were grouped by expression in ddm1 mutant. Out of the 3901 TE genes in the Arabidopsis genome annotation, 497 were excluded because they showed expression in wild-type, 2116 TE genes showed no expression in ddm1 (non-expressed TE genes) while 1288 TE genes were expressed. Because many of these TE genes showed very low expression levels, we divided the expressed TEs into 4 quartiles (322 TE genes each) based on their expression values where the 1st quartile contains TE genes with the lowest expression and the 4th quartile contains TE genes with the highest expression. Given that the TE genes in 1st and 2nd quartile showed nominal expression values, we placed only TE genes in 3rd and 4th quartile (644 TE genes) in the category of expressed TEs. n represents the number of TE genes in each group. (B) Stacked bar plots of the proportion of states in wild-type (top panel) and in ddm1 (bottom panel) overlapping TE genes grouped by expression in ddm1. (C) Box plot showing the expression of TE genes overlapping the 16 concatenated model states in ddm1.
Figure 4—figure supplement 1
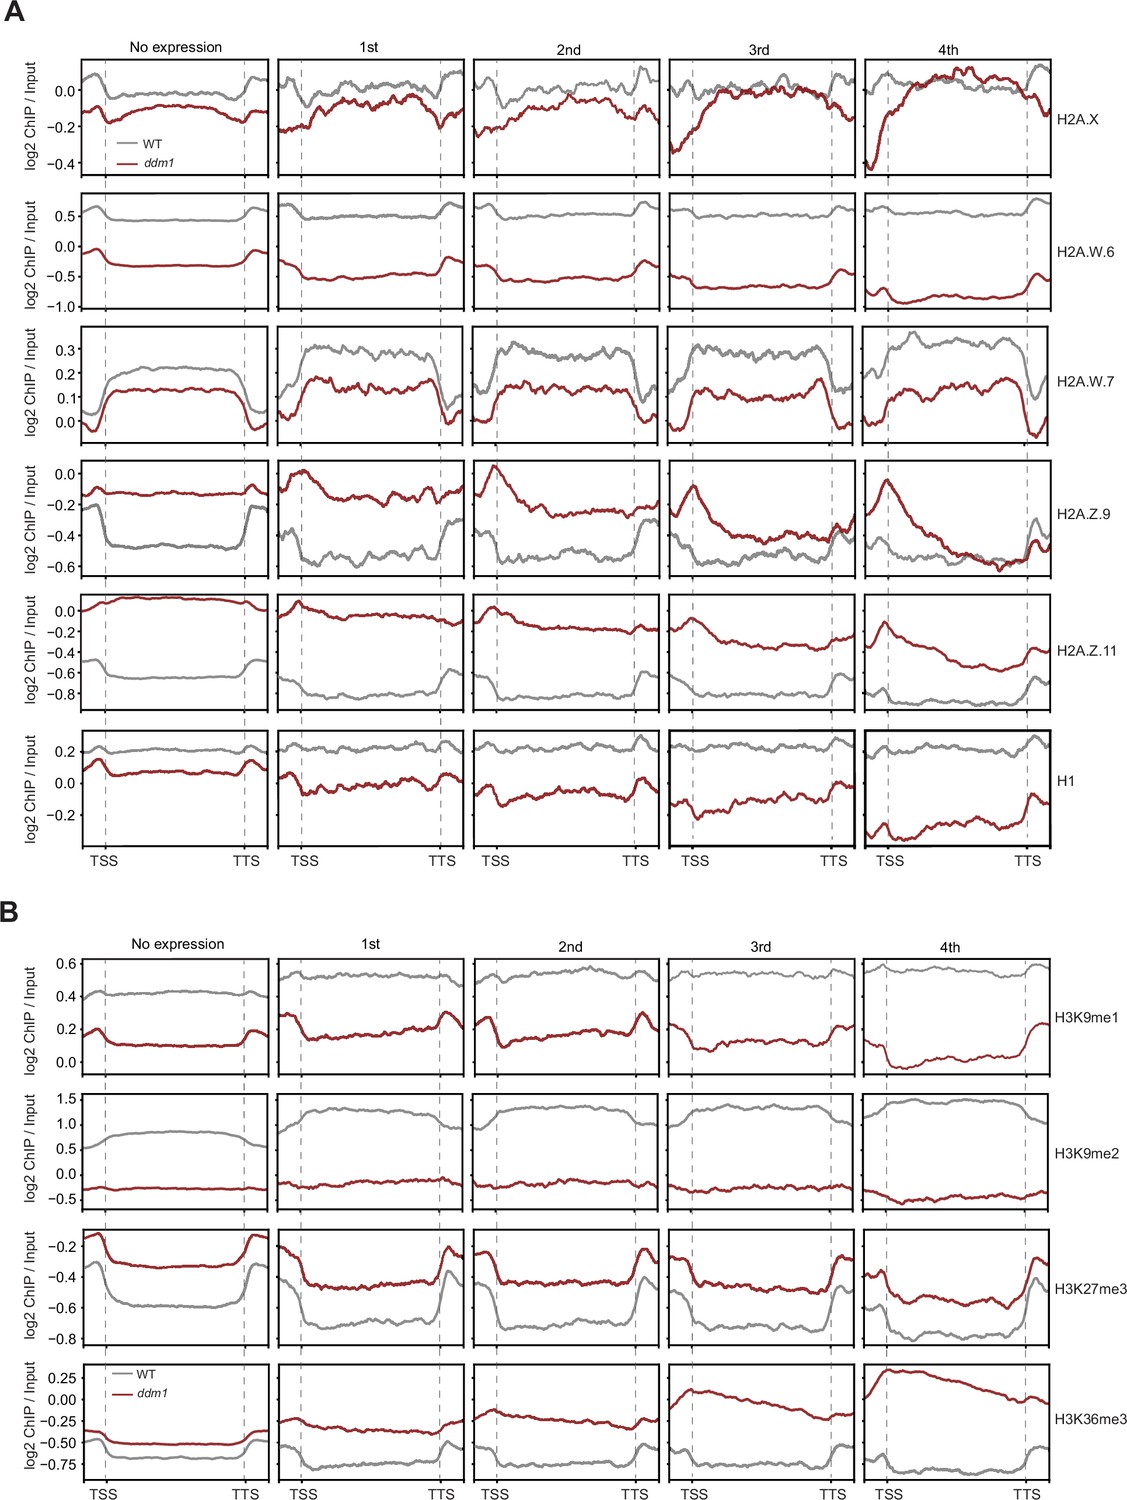
Analyses of the parameters that could correlate with the chromatin states with TE expression in ddm1.
Enrichment profiles of histone variants (A) and H3 modifications (B) plotted over groups of TE genes based on their expression in decreased in DNA methylation (ddm1) as defined in the legend for Figure 4A and Methods.
Figure 4—figure supplement 2
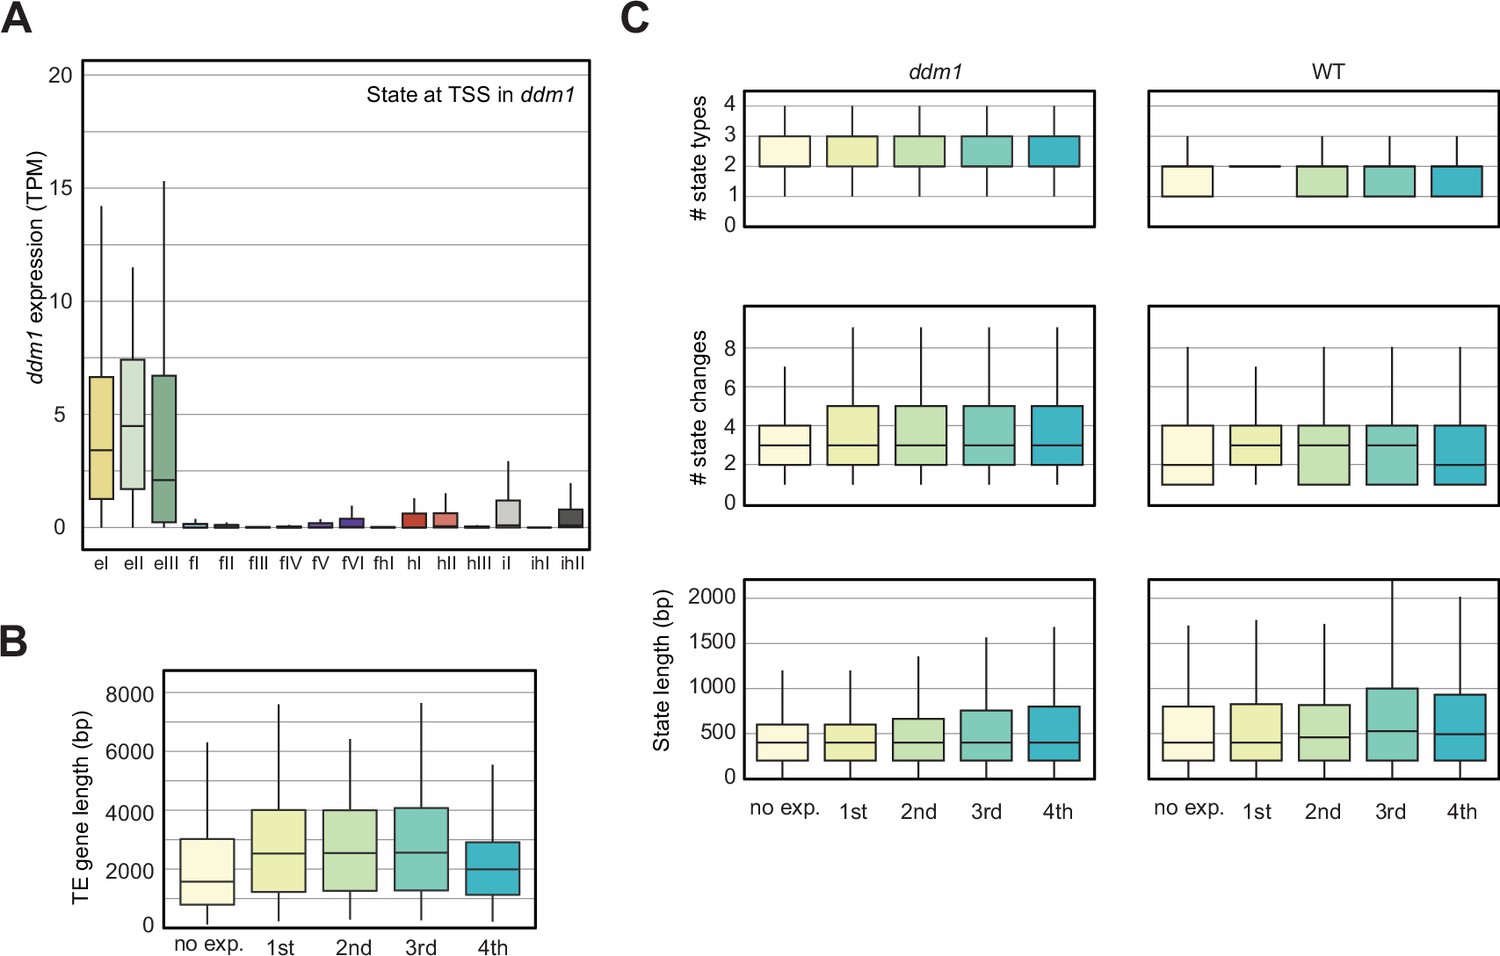
Analyses of the parameters that could correlate with the chromatin states with TE expression in decreased in DNA Methylation (ddm1).
(A) Box plot showing the expression of the TE genes grouped by the state overlapping the TSS in ddm1. See also Figure 4C. (B) Box plot showing the TE gene length distributions across the five different TE gene expression groups. (C) Box plots showing state statistics for TE genes per expression group in ddm1 and wild-type (WT). ‘# state types’ (top) is the number of different kinds of states present over the TE genes. ‘# state changes’ (middle) is the number of times there is a transition from one state to another and the bottom shows the length of the states overlapping the TE genes. No trend can be seen across expression groups, whereas all TE genes tend to have a larger diversity of states, more frequent transitions between states and hence shorter stretches of each state.
Tables
Key resources table
| Reagent type (species) or resource | Designation | Source or reference | Identifiers | Additional information |
|---|---|---|---|---|
| Antibody | anti-H2A.X.3/5 (Rabbit polyclonal) | Yelagandula et al., 2014 | WB: 1 μg/ml 5 μg per ChIP 10 μg per IP | |
| Antibody | anti-H2A.13 (Rabbit polyclonal) | Yelagandula et al., 2014 | WB: 1 μg/ml 5 μg per ChIP | |
| Antibody | anti-H2A.2 (Rabbit polyclonal) | This work (See Materials and methods) | WB: 1 μg/ml 5 μg per ChIP | |
| Antibody | anti-H2A.Z.9 (Rabbit polyclonal) | Yelagandula et al., 2014 | WB: 1 μg/ml 5 μg per ChIP 10 μg per IP | |
| Antibody | anti-H2A.Z.11 (Rabbit polyclonal) | This work (See Materials and methods) | WB: 1 μg/ml 5 μg per ChIP | |
| Antibody | anti-H2A.W.6 (Rabbit polyclonal) | Yelagandula et al., 2014 | WB: 1 μg/ml 5 μg per ChIP 10 μg per IP | |
| Antibody | anti-H2A.W.7 (Rabbit polyclonal) | Lorković et al., 2017 | WB: 1 μg/ml 5 μg per ChIP 10 μg per IP | |
| Antibody | anti-H3 (Rabbit polyclonal) | Abcam | Cat# ab1791, RRID:AB_302613 | WB: 0,5 μg/ml 5 μg per ChIP |
| Antibody | anti- H3K36me3 (Rabbit polyclonal) | Abcam | Cat# ab9050, RRID:AB_306966 | WB: 1 μg/ml 5 μg per ChIP 10 μg per IP |
| Antibody | anti-H3K27me3 (Rabbit polyclonal) | Millipore | Cat# 07–449, RRID:AB_310624 | WB: 1 μg/ml 5 μg per ChIP |
| Antibody | anti-H3K4me3 (Rabbit polyclonal) | Abcam | Cat# ab8580, RRID:AB_306649 | WB: 1 μg/ml 5 μg per ChIP 10 μg per IP |
| Antibody | anti-H3K4me1 (Rabbit polyclonal) | Abcam | Cat# ab8895, RRID:AB_306847 | WB: 1 μg/ml 5 μg per ChIP 10 μg per IP |
| Antibody | anti-H3K27me1 (Rabbit polyclonal) | Millipore | Cat# 17–643, RRID:AB_1587128 | WB: 1 μg/ml 5 μl per ChIP 20 μl per IP |
| Antibody | anti-H1 (Rabbit polyclonal) | Agrisera | AS11 1801 | 5 μg per ChIP |
| Antibody | anti-H4K20me1 (Rabbit polyclonal) | Abcam | Cat# ab9051, RRID:AB_306967 | 5 μg per ChIP |
| Antibody | anti-H3K9me1 (Rabbit polyclonal) | Abcam | Cat# ab8896, RRID:AB_732929 | WB: 1 μg/ml 5 μg per ChIP 10 μg per IP |
| Antibody | anti-H3K9me2 (Mouse monoclonal) | Abcam | Cat# ab1220, RRID:AB_449854 | WB: 1 μg/ml 5 μg per ChIP |
| Antibody | anti-H3K9ac (rabbit polyclonal) | Millipore | Cat# 17–615, RRID:AB_1163437 | WB: 1 μg/ml |
| Antibody | anti-H3K18ac (rabbit polyclonal) | Abcam | Cat# ab1191, RRID:AB_298692 | WB: 1 μg/ml |
| Antibody | anti-H3K23ac (rabbit polyclonal) | Abcam | Cat# ab47813, RRID:AB_880444 | WB: 1 μg/ml |
| Antibody | anti-H3K27ac (rabbit polyclonal) | Abcam | Cat# ab4729, RRID:AB_2118291 | WB: 1 μg/ml |
| Antibody | anti-H3K122ac (rabbit polyclonal) | Abcam | Cat# ab33309, RRID:AB_942262 | WB: 1 μg/ml |
| Antibody | anti-H3K27me2 (rabbit polyclonal) | Abcam | Cat# ab24684, RRID:AB_448222 | WB: 1 μg/ml |
| Antibody | anti-H3K36me2 (rabbit polyclonal) | Abcam | Cat# ab9049, RRID:AB_1280939 | WB: 1 μg/ml |
| Antibody | anti-HA (Rat monoclonal) | Roche | Cat# 11867423001, RRID:AB_390918 | WB: 0,5 μg/ml |
| Antibody | Rabbit IgG (monoclonal) | Abcam | Cat# ab171870, RRID:AB_2687657 | 10 μg per IP |
| Commercial assay or kit | Nugen Ovation Ultralow V2 DNA-Seq library prep kit | NuGen | Cat# 0344 | |
| Commercial assay or kit | NEBNext Ultra II DNA library prep kit for Illumina | New England Biolabs | Cat# E7645L | |
| Commercial assay or kit | Dynabeads Protein A | Invitrogen | Cat# 10746713 | Used for ChIP |
| Commercial assay or kit | Protein A Mag Separose | GE Healthcare (Cytiva) | Cat# 28951378 | Used for IP |
| Commercial assay or kit | Anti-HA Affinity matrix | Roche | Cat# 11815016001 | Used for IP |
| Software, algorithm | ChromHMM | Ernst and Kellis, 2012; Ernst and Kellis, 2017 | RRID:SCR_018141 | |
| Software, algorithm | Trim Galore | DOI:10.5281/zenodo.5127898. | RRID:SCR_011847 | |
| Software, algorithm | Bowtie 2 | Langmead and Salzberg, 2012 | RRID:SCR_016368 | |
| Software, algorithm | Picard | broadinstitute.github.io/picard/ | RRID:SCR_006525 | |
| Software, algorithm | Deeptools | Ramírez et al., 2016 | RRID:SCR_016366 |
Additional files
-
Supplementary file 1
Mapping statistics.
The file includes output statistics for mapping and trimming of all data included in the manuscript.
- https://cdn.elifesciences.org/articles/87714/elife-87714-supp1-v1.xlsx
-
MDAR checklist
- https://cdn.elifesciences.org/articles/87714/elife-87714-mdarchecklist1-v1.docx
Download links
A two-part list of links to download the article, or parts of the article, in various formats.
Downloads (link to download the article as PDF)
Open citations (links to open the citations from this article in various online reference manager services)
Cite this article (links to download the citations from this article in formats compatible with various reference manager tools)
Histone variants shape chromatin states in Arabidopsis
eLife 12:RP87714.
https://doi.org/10.7554/eLife.87714.3


