Approach-avoidance reinforcement learning as a translational and computational model of anxiety-related avoidance
- Institute of Cognitive Neuroscience, University College London, United Kingdom
- Research Department of Clinical, Educational and Health Psychology, University College London, United Kingdom
Figures
Figure 1
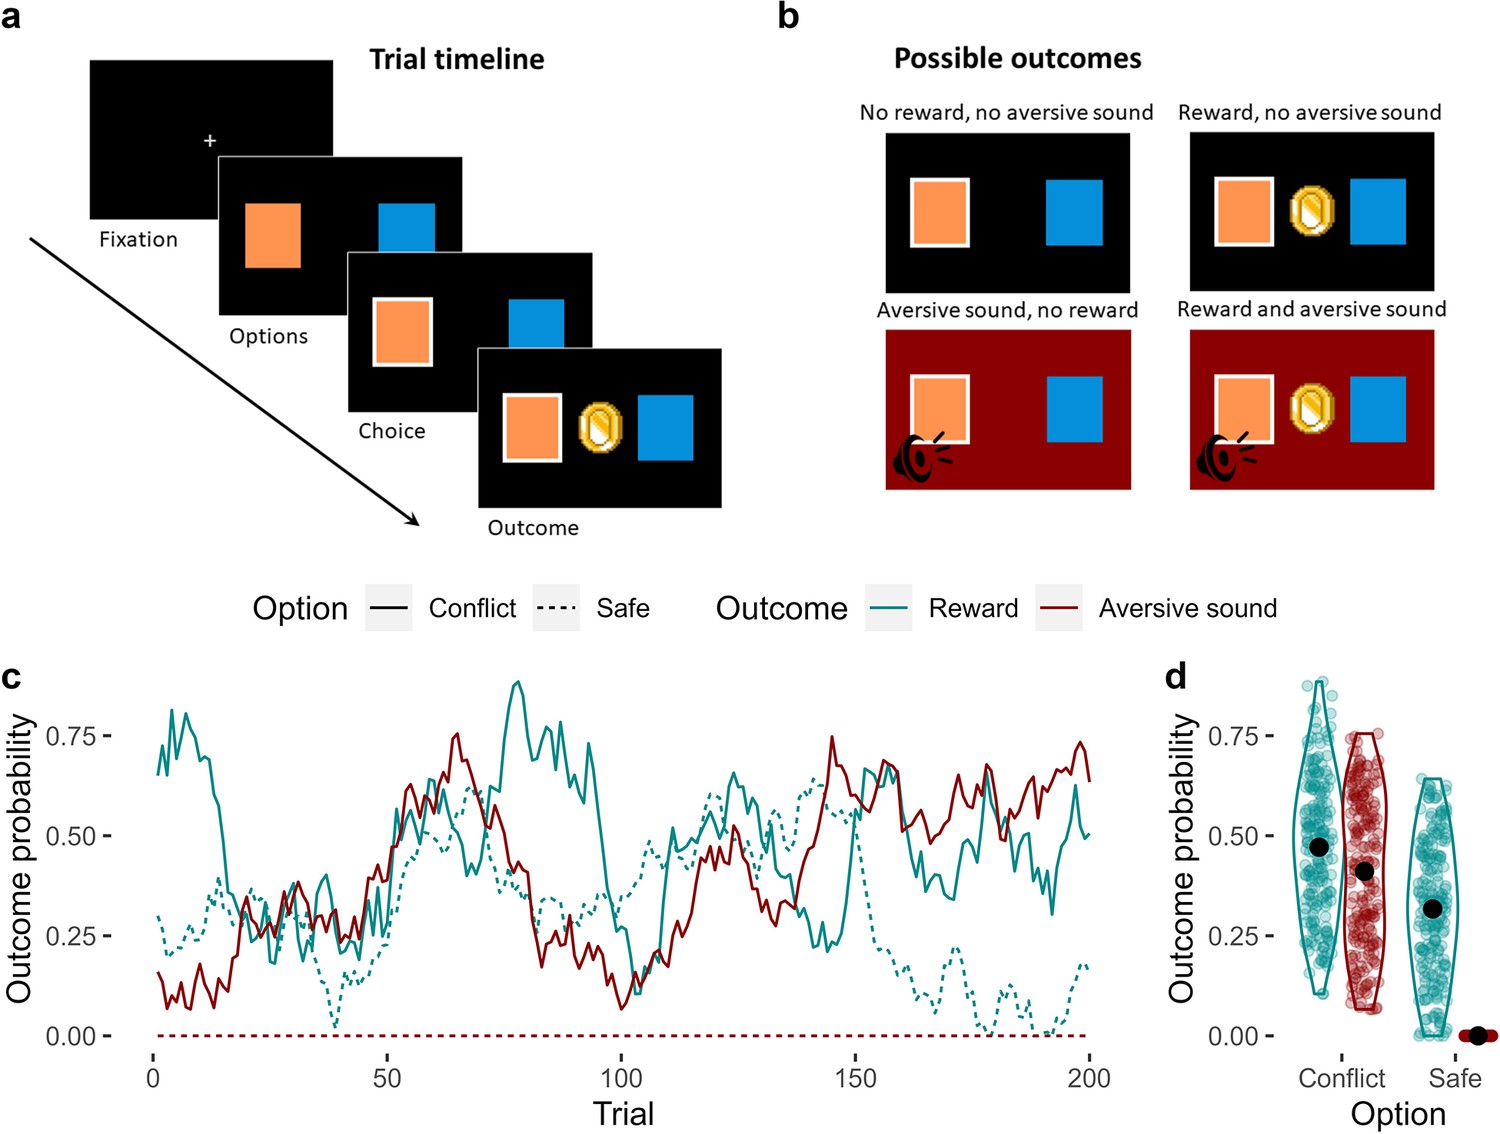
The approach-avoidance reinforcement learning task.
(a) Trial timeline. A fixation cross initiates the trial. Participants are presented with two options for up to 2 s, from which they choose one. The outcome is then presented for 1 s. (b) Possible outcomes. There were four possible outcomes: (1) no reward and no aversive sound; (2) a reward and no aversive sound; (3) an aversive sound and no reward; or (4) both the reward and the aversive sound. (c) Probabilities of observing each outcome given the choice of option. Unbeknownst to the participant, one of the options (which we refer to as the ‘conflict’ option – solid lines) was generally more rewarding compared to the other option (the ‘safe’ option – dashed line) across trials. However, the conflict option was also the only option of the two that was associated with a probability of producing an aversive sound (the probability that the safe option produced the aversive sound was 0 across all trials). The probabilities of observing each outcome given the choice of option fluctuated randomly and independently across trials. The correlations between these dynamic probabilities were negligible (mean Pearson’s r = 0.06). (d) Distribution of outcome probabilities by option and outcome. On average, the conflict option was more likely to produce a reward than the safe option. The conflict option had a variable probability of producing the aversive sound across trials, but this probability was always 0 for the safe option. Black points represent the mean probability.
Figure 2
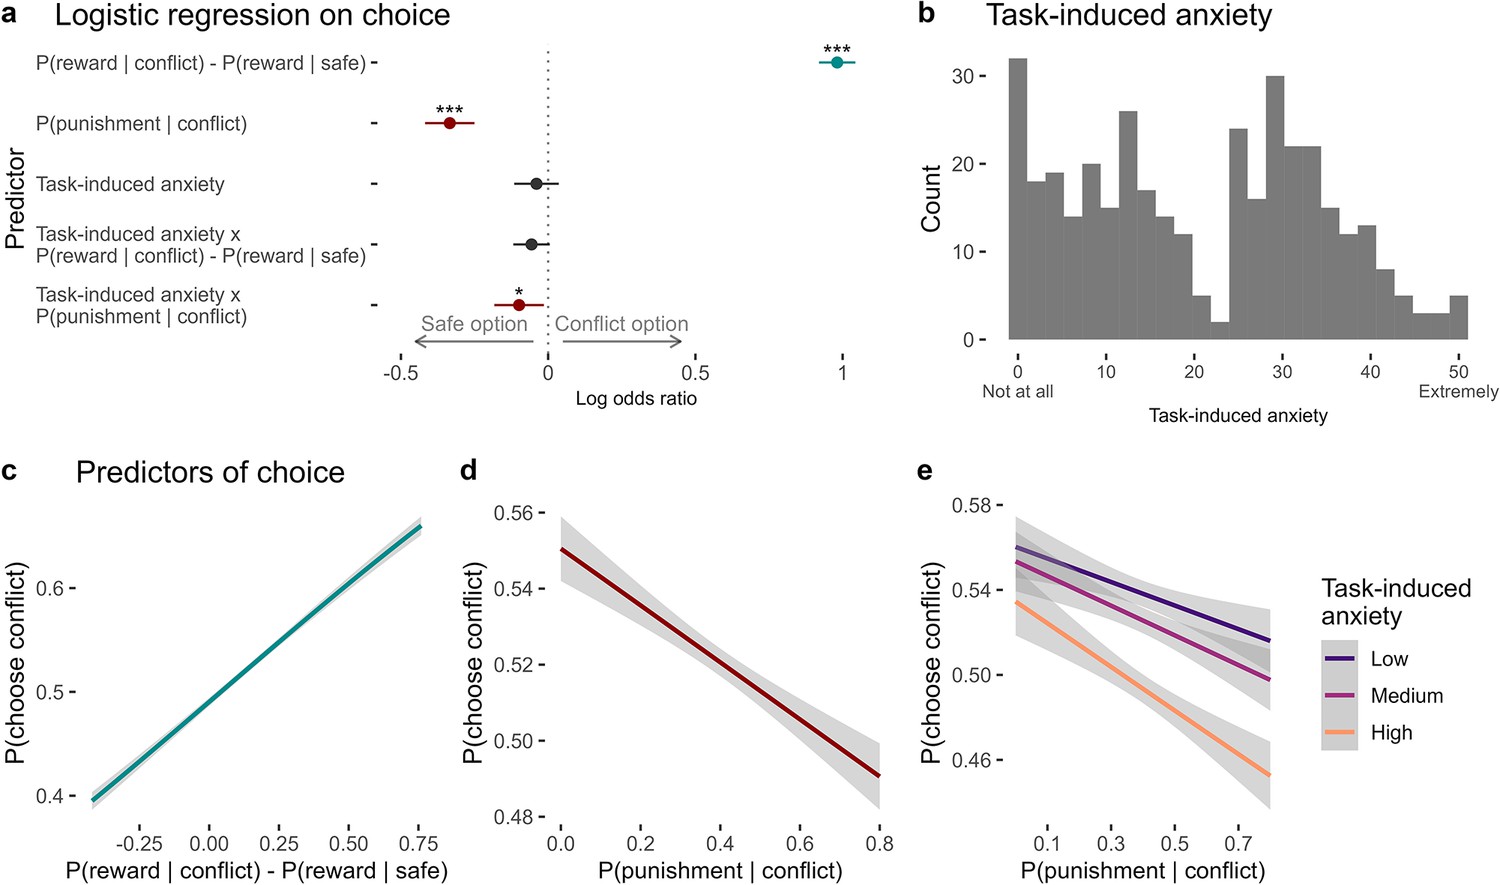
Predictors of choice in the approach-avoidance reinforcement learning task.
(a) Coefficients from the mixed-effects logistic regression of trial-by-trial choices in the task (n = 369). On any given trial, participants chose the option that was more likely to produce a reward. They also avoided choosing the conflict option when it was more likely to produce the punishment. Task-induced anxiety significantly interacted with punishment probability. Significance levels are shown according to the following: p < 0.05 – *; p < 0.01 – **; p < 0.001 – ***. Error bars represent confidence intervals. (b) Subjective ratings of task-induced anxiety, given on a scale from ‘Not at all’ (0) to ‘Extremely’ (50). (c) On each trial, participants were likely to choose the option with greater probability of producing the reward. (d) Participants tended to avoid the conflict option when it was likely to produce a punishment. (e) Compared to individuals reporting lower anxiety during the task, individuals experiencing greater anxiety showed greater avoidance of the conflict option, especially when it was more likely to produce the punishment. Note. Figures c–e show logistic curves fitted to the raw data using the ‘glm’ function in R. For visualisation purposes, we categorised continuous task-induced anxiety into tertiles. We show linear curves here since these effects were estimated as linear effects in the logistic regression models, however the raw data showed non-linear trends – see Appendix 11—figure 1.
Figure 3
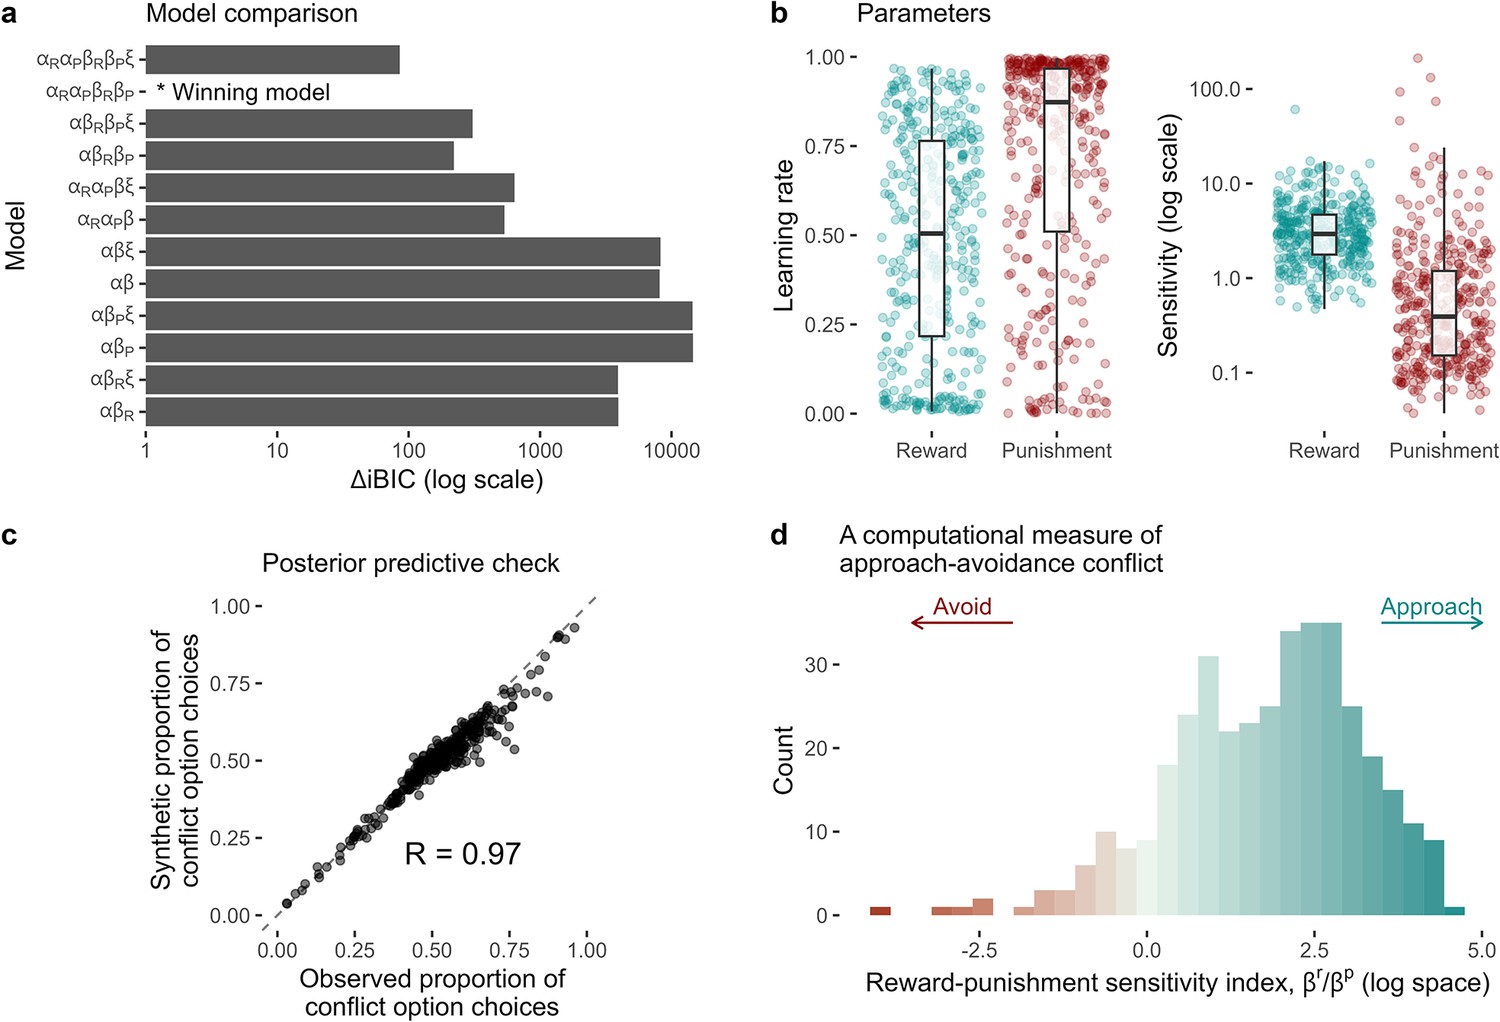
Computational modelling of approach-avoidance reinforcement learning.
(a) Model comparison results (n = 369). The difference in integrated Bayesian information criterion scores from each model relative to the winning model is indicated on the x-axis. The winning model included specific learning rates for reward () and punishment learning (), and specific outcome sensitivity parameters for reward () and punishment (). Some models were tested with the inclusion of a lapse term (). (b) Distributions of individual parameter values from the winning model. (c) The winning model was able to reproduce the proportion of conflict option choices over all trials in the observed data with high accuracy (observed vs predicted data r = 0.97). (d) The distribution of the reward-punishment sensitivity index – the computational measure of approach-avoidance bias. Higher values indicate approach biases, whereas lower values indicate avoidance biases.
Figure 4
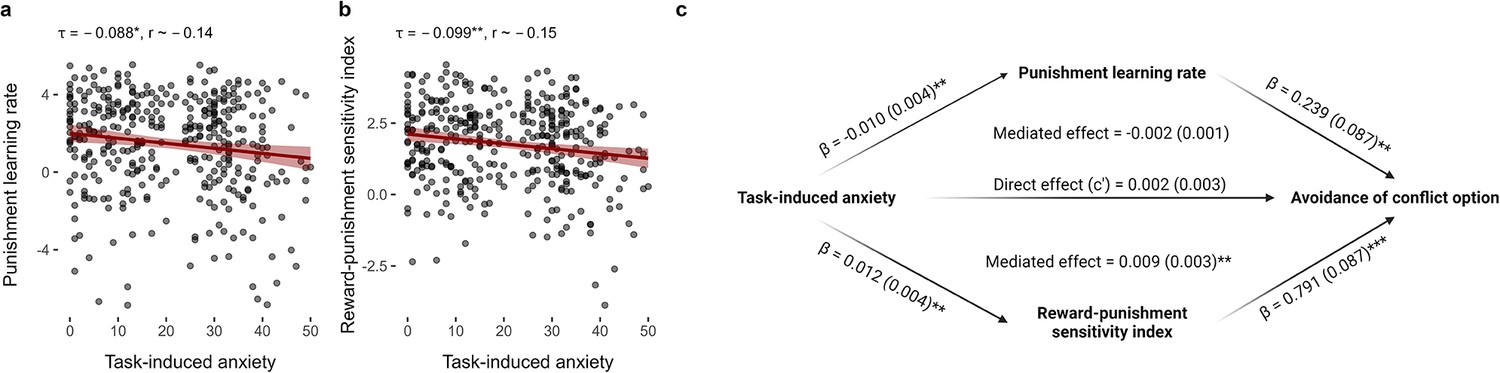
Relationships between task-induced anxiety, model parameters, and avoidance.
(a) Task-induced anxiety was negatively correlated with the punishment learning rate. (b) Task-induced anxiety was also negatively correlated with reward-punishment sensitivity index. Kendall’s tau correlations and approximate Pearson’s r equivalents are reported above each figure (n = 369). (c) The mediation model. Mediation effects were assessed using structural equation modelling. Bold terms represent variables and arrows depict regression paths in the model. The annotated values next to each arrow show the regression coefficient associated with that path, denoted as coefficient (standard error). Only the reward-punishment sensitivity index significantly mediated the effect of task-induced anxiety on avoidance. Significance levels in all figures are shown according to the following: p < 0.05 – *; p < 0.01 – **; p < 0.001 – ***.
Appendix 2—figure 1
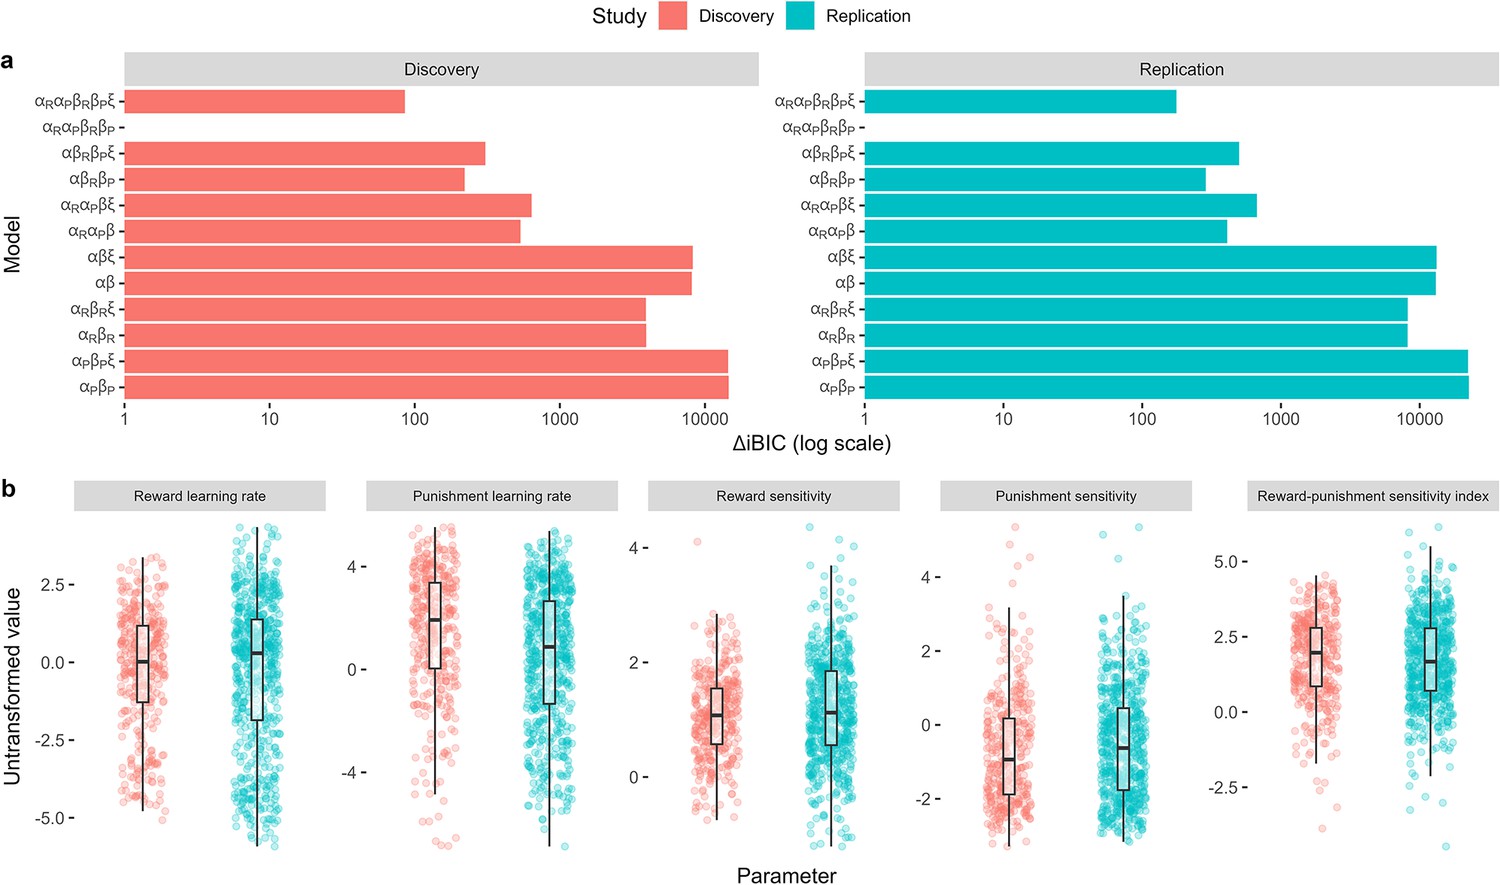
Model comparison and parameter distributions across studies.
(a) Model comparison results. The difference in integrated Bayesian information criterion scores from each model relative to the winning model is indicated on the x-axis. The winning model in both studies included specific learning rates for reward () and punishment learning (), and specific outcome sensitivity parameters for reward () and punishment (). Some models were tested with the inclusion of a lapse term (). (b) Distributions of individual parameter values from the winning model across studies. The reward-punishment sensitivity index constituted our computational measure of approach-avoidance bias, calculated by taking the ratio between the reward and punishment sensitivity parameters.
Appendix 2—figure 2
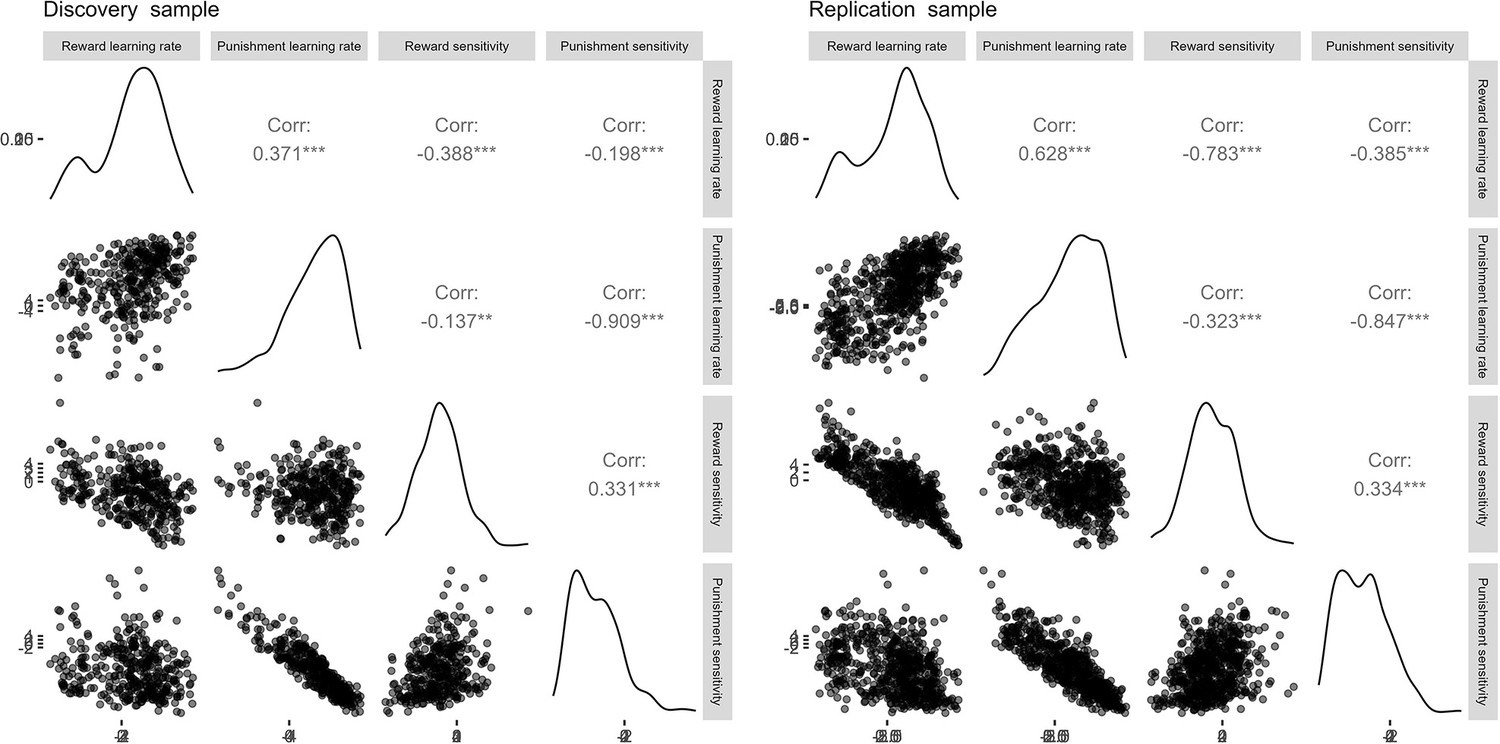
Correlation matrices for the estimated parameters across studies.
Lower-right diagonal of each matrix shows a scatterplot of cross-parameter correlations. Upper-right diagonal denotes the Pearson’s r correlation coefficients for each pair of parameters, based on the untransformed parameter values.
Appendix 3—figure 1
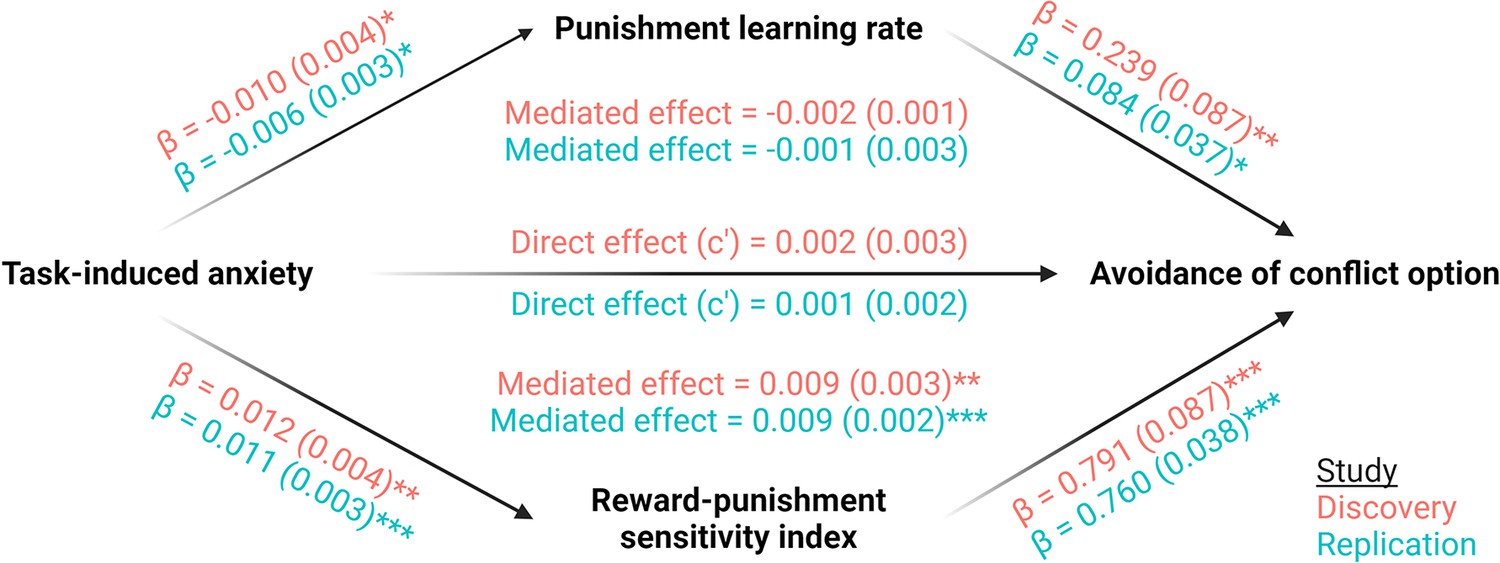
Mediation analyses across studies.
Mediation effects were assessed using structural equation modelling. Bold terms represent variables and arrows depict regression paths in the model. The annotated values next to each arrow show the regression coefficient associated with that path, denoted as coefficient (standard error). Only the reward-punishment sensitivity index significantly mediated the effect of task-induced anxiety on avoidance. Significance levels in all figures are shown according to the following: p < 0.05 – *; p < 0.01 – **; p < 0.001 – ***.
Appendix 4—figure 1
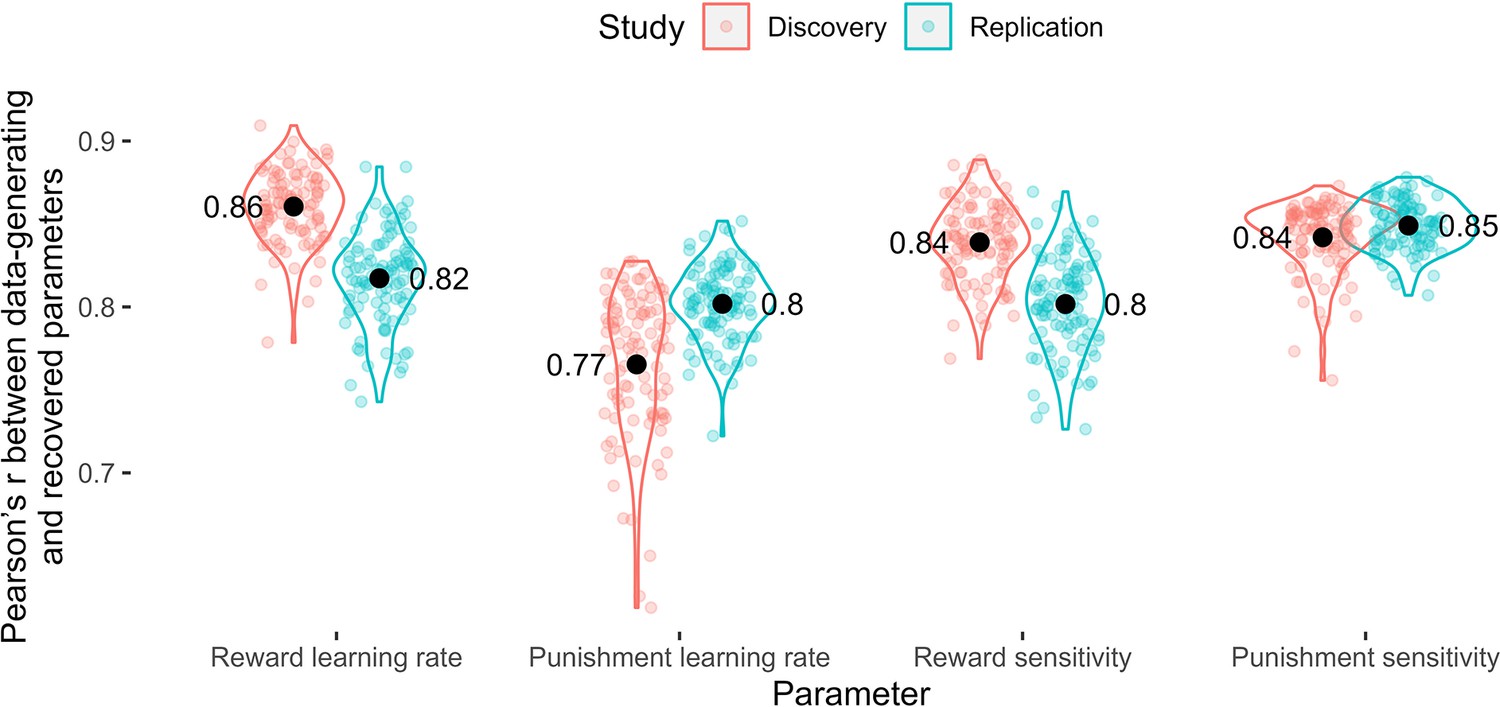
Parameter recovery.
Pearson’s r values across the data-generating and recovered parameters by parameter. Coloured points represent Pearson’s r values for each of 100 simulation iterations, and black points represent the mean value across simulations.
Appendix 5—figure 1
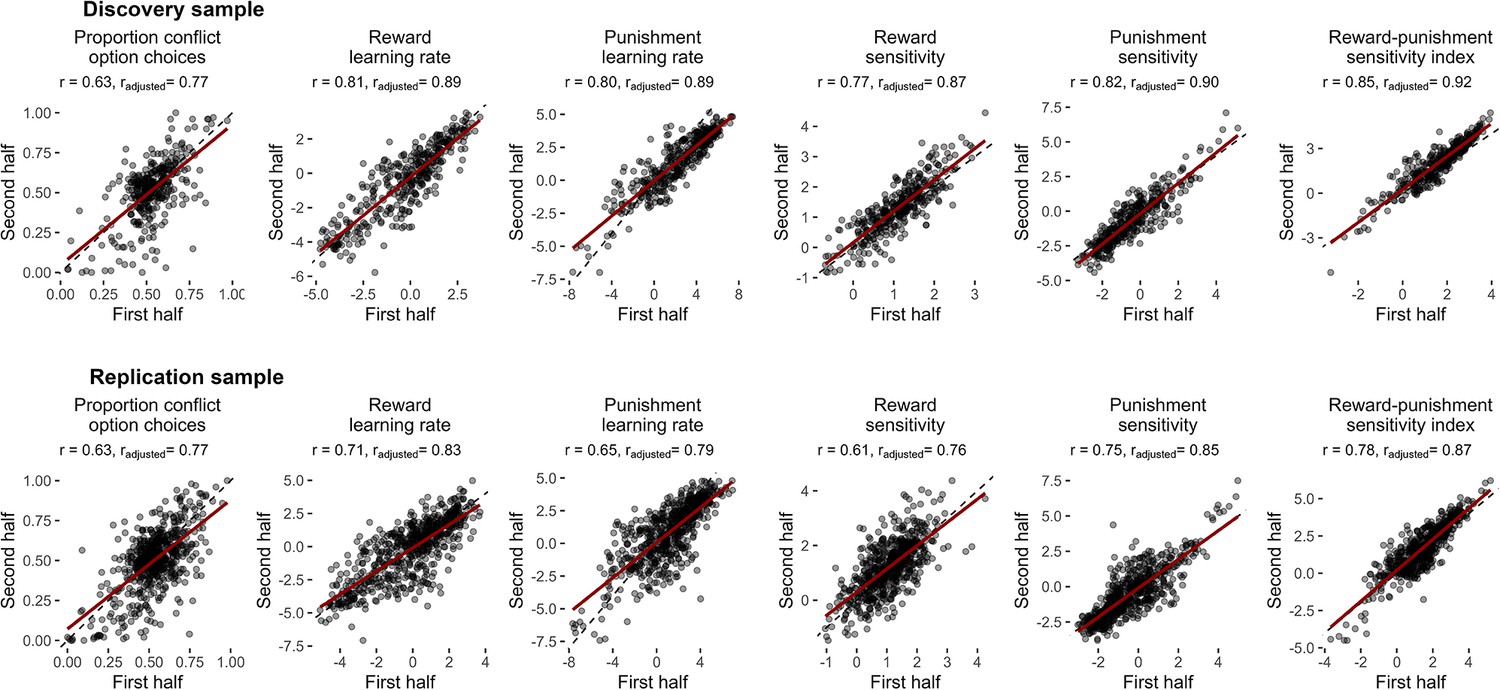
Split-half reliability of the task.
Scatter plots of measures calculated from the first and second halves of the task are shown with their estimates of reliability (Pearson's r values). Reliability estimates for the computational measures from the winning computational model were computed by fitting split-half parameters within a single model, then using the parameter covariance matrix to derive Pearson’s correlation coefficients for each parameter across halves. Reliability estimates are reported as unadjusted values (r) and after adjusting for reduced number of trials via Spearman-Brown correction (radjusted). Dotted lines represent the reference line, indicating perfect correlation. Red lines show lines-of-best-fit.
Appendix 6—figure 1
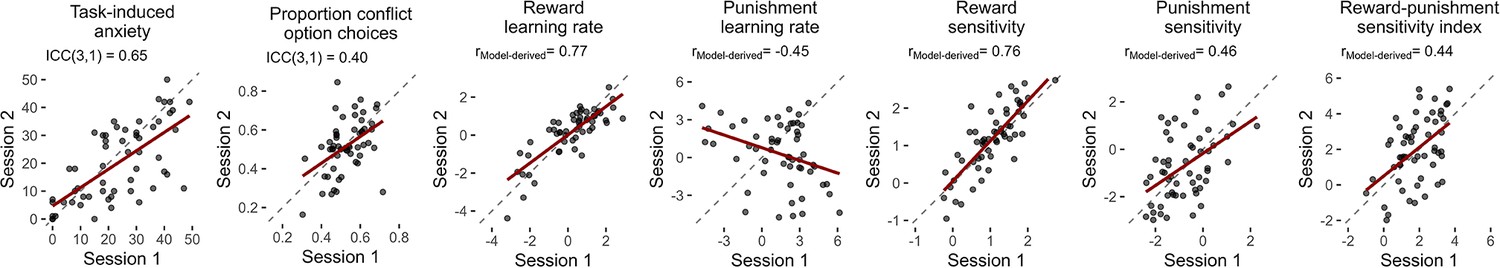
Test-retest reliability of the task.
Scatter plots of measures calculated from the test and retest sessions are shown with their estimates of reliability (intra-class correlations: ICCs; and Pearson's r values). Reliability estimates for the model-agnostic measures (task-induced anxiety, proportion of conflict option choices) were estimated using intra-class correlation coefficients. Reliability estimates for the computational measures from the winning computational model were computed by first fitting both sessions’ parameters within a single model, then using the parameter covariance matrix to derive a Pearson’s correlation coefficient (rModel-derived) for each parameter across sessions to be calculated from their covariance. Dotted lines represent the reference line, indicating perfect correlation. Red lines show lines-of-best-fit.
Appendix 7—figure 1
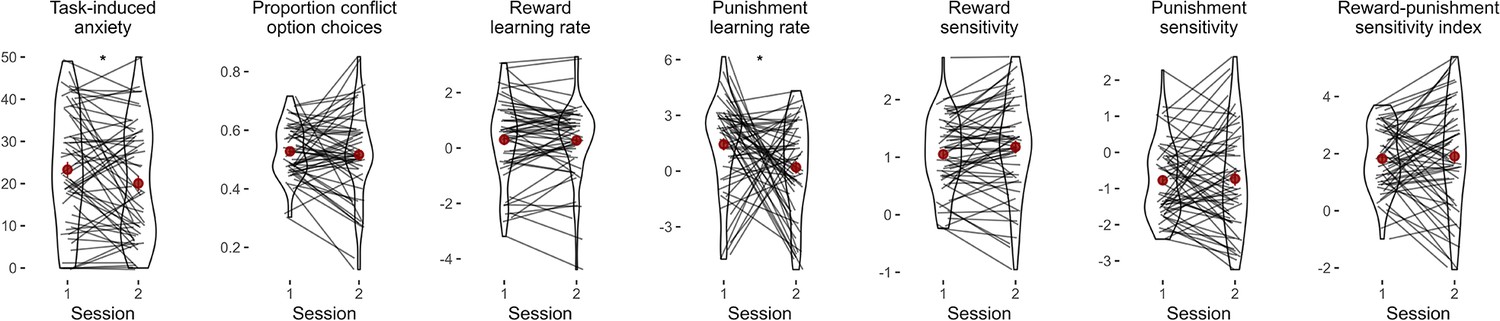
Task practice effects.
Comparison of behavioural measures and model parameters across time. Lines represent individual data, red points represent mean values, and red lines represent standard error bars. P-values of paired t-tests are annotated above each plot. Task-induced anxiety and the punishment learning rate was significantly lower in the second session, whilst the other measures did not change significantly across sessions. Significance levels are shown according to the following: p < 0.05 – *.
Appendix 8—figure 1
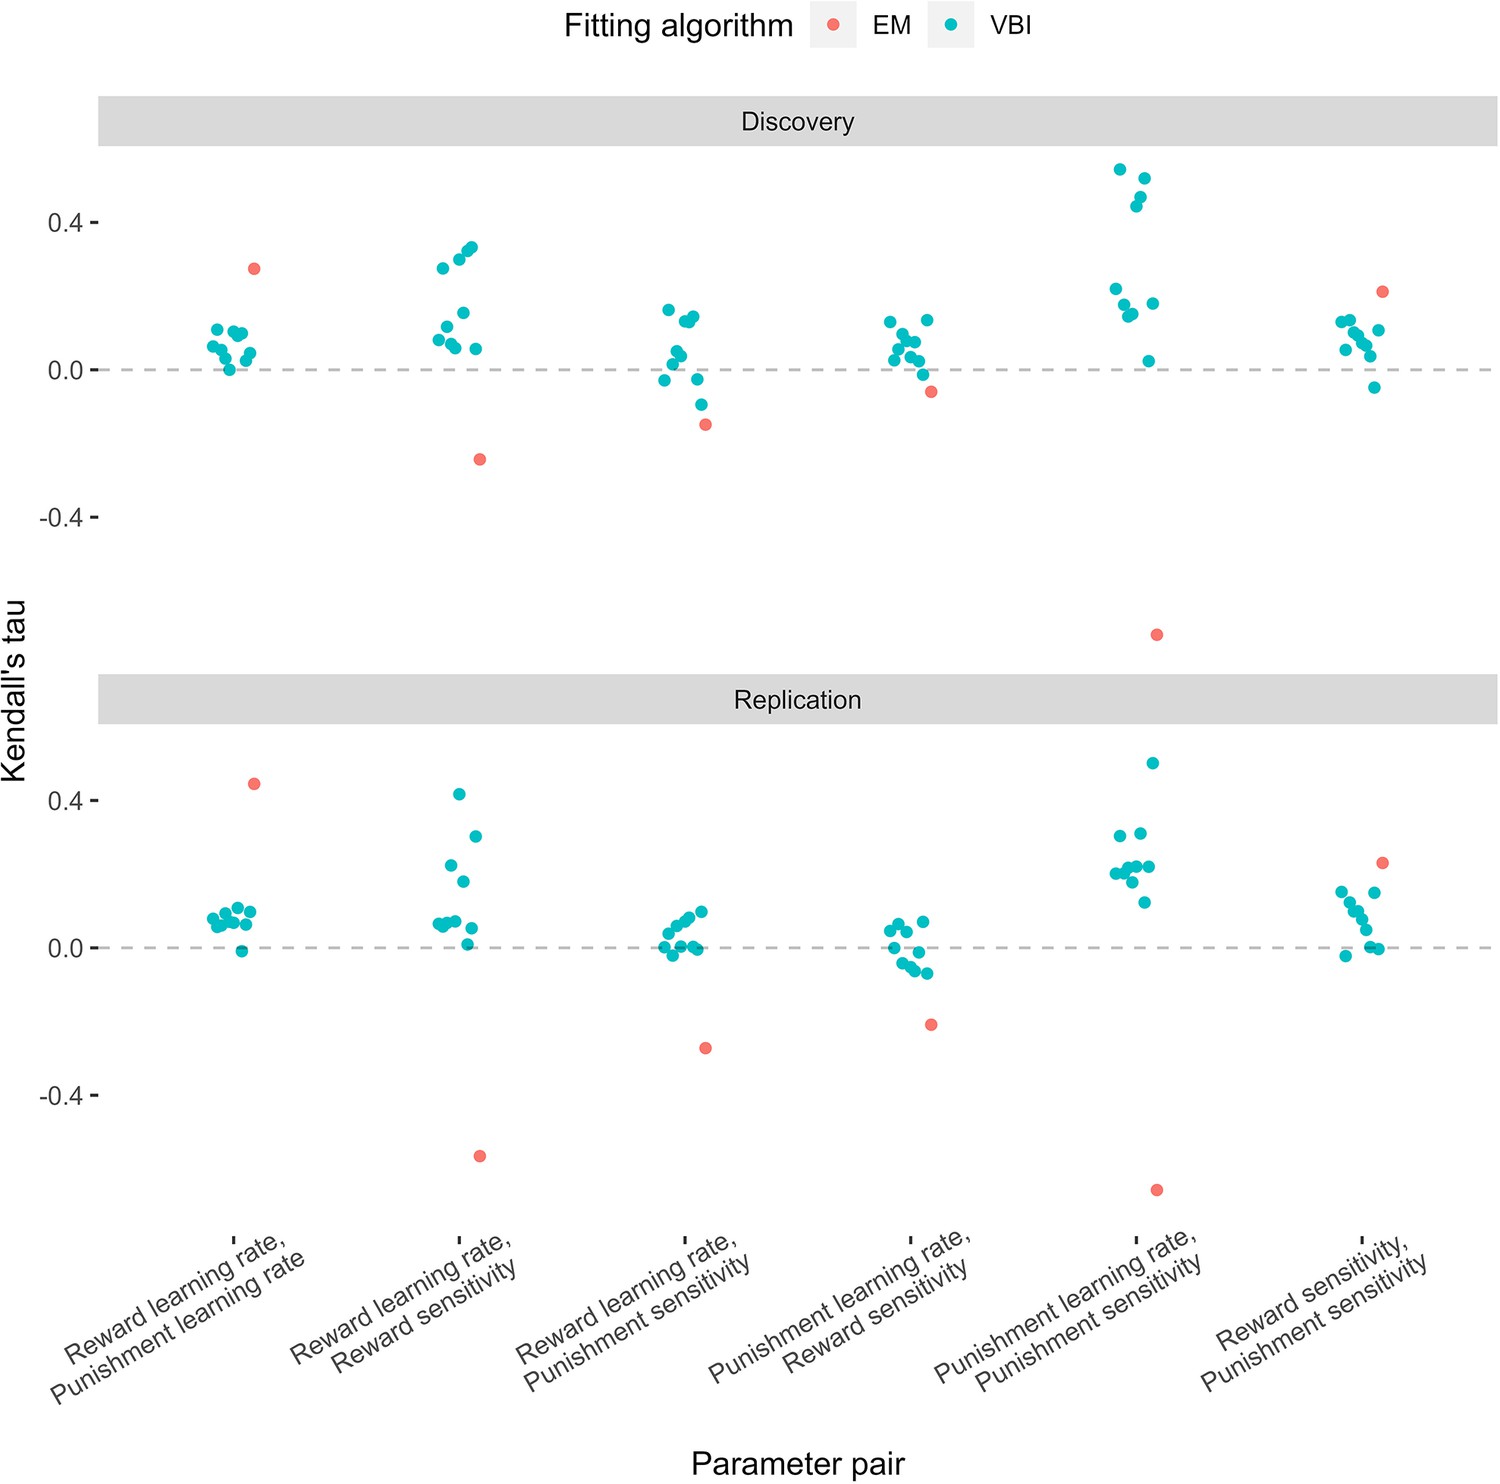
Inter-parameter correlations across the expectation maximisation (EM, red) and variational Bayesian inference (VBI, blue) algorithms.
Overall, the VBI algorithm produced lower correlations compared to EM.
Appendix 8—figure 2
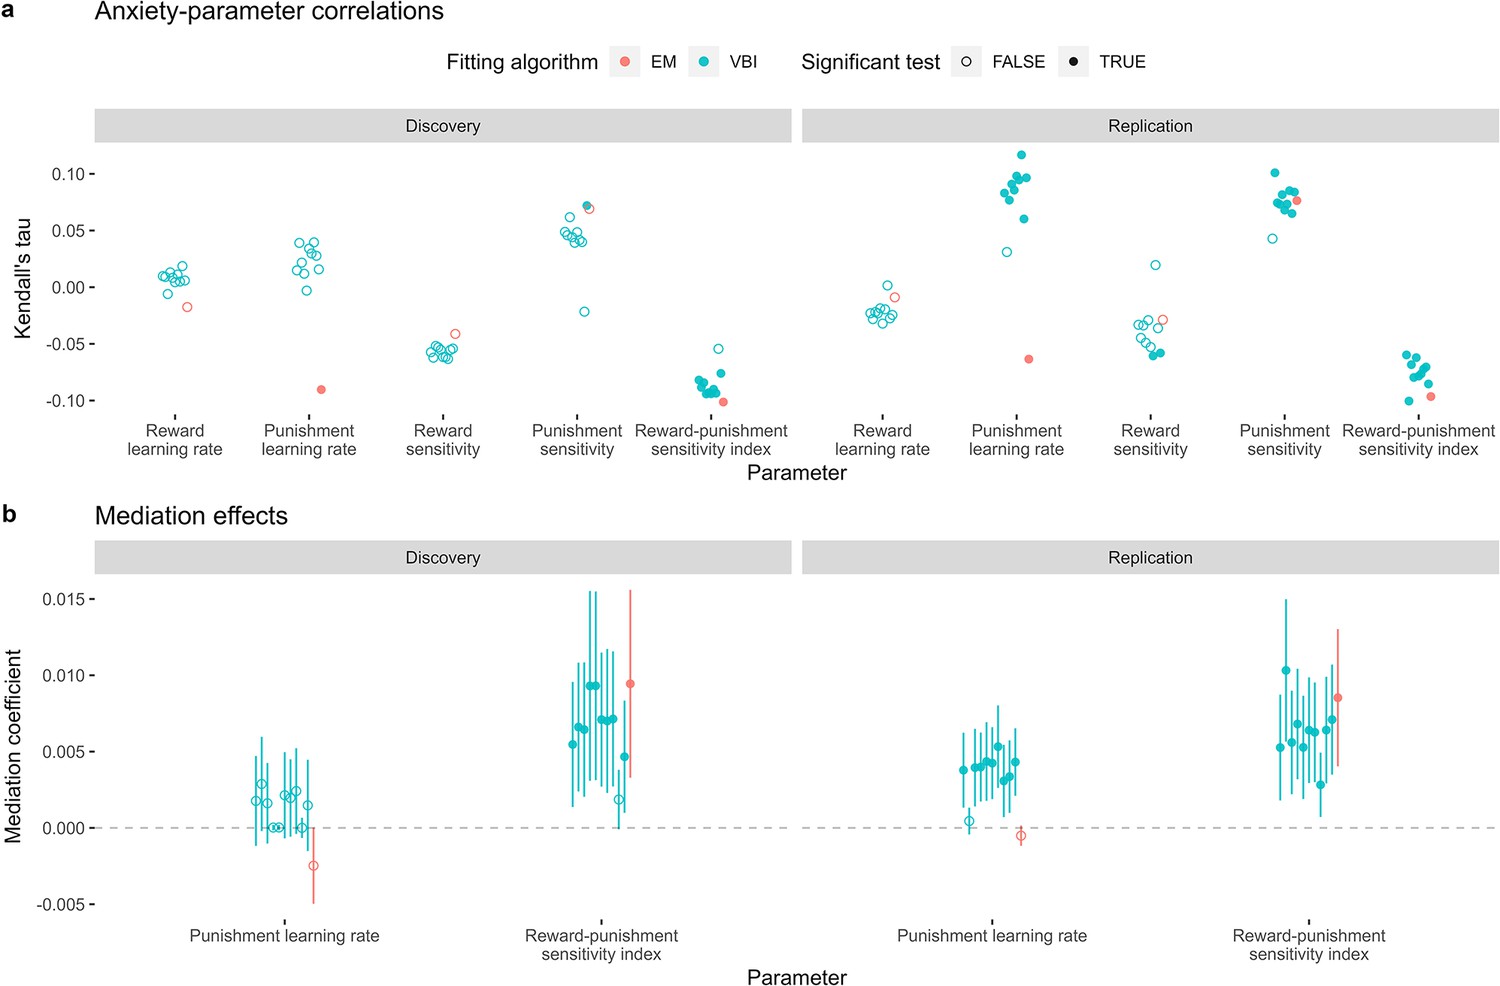
Sensitivity analysis of the computational findings relating to task-induced anxiety; comparing results when using parameters estimated via expectation maximisation (EM, red) and variational Bayesian inference (VBI, blue).
(a) Kendall’s tau correlations across each parameter and task-induced anxiety. (b) Mediating effects of the punishment learning rate and reward-punishment sensitivity index.
Appendix 9—figure 1
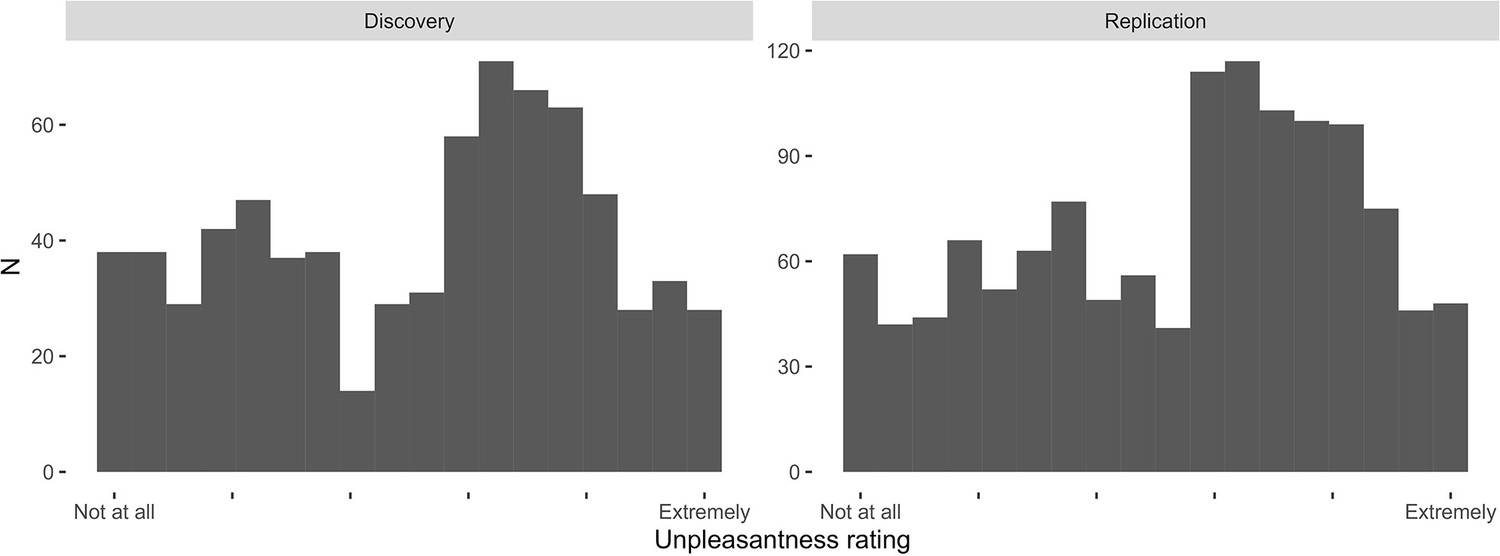
Distribution of self-reported punishment unpleasantness ratings.
Ratings were scored from ‘Not at all’ to ‘Extremely’ (encoded as 0 and 50, respectively). Distributions are shown across the discovery and replication samples.
Appendix 9—figure 2
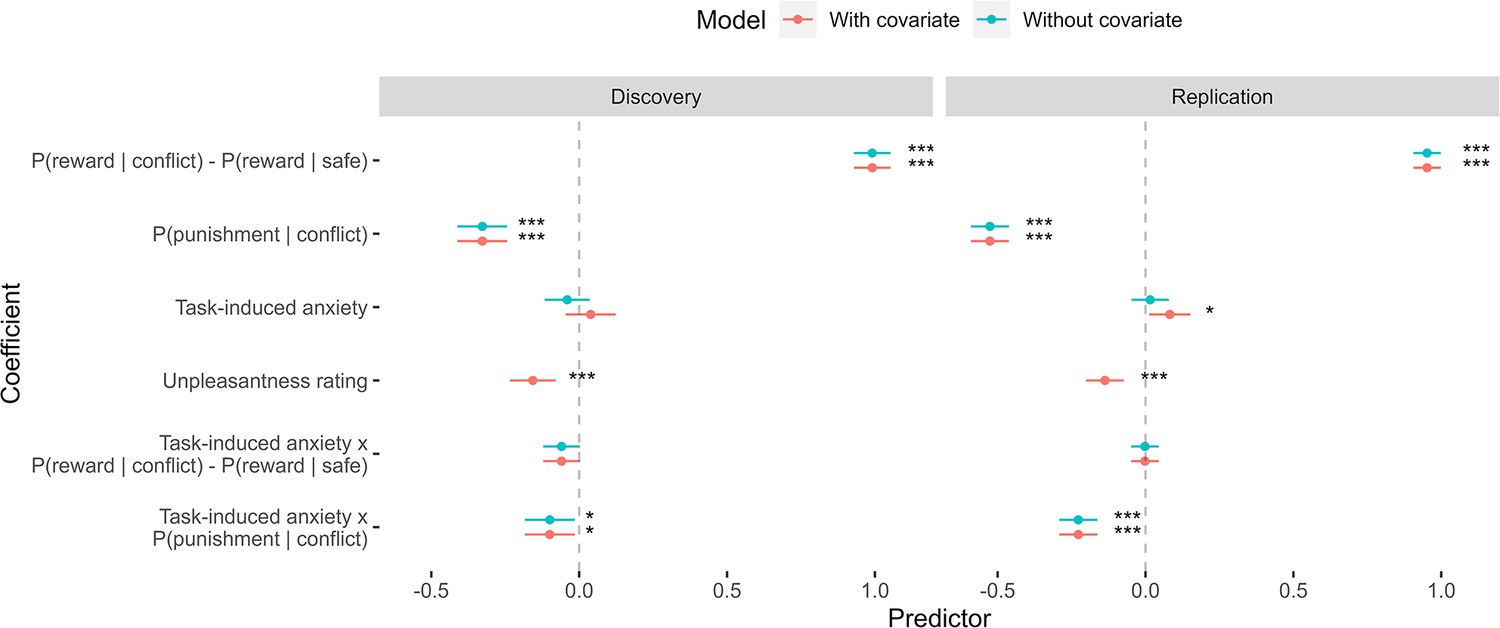
The effect of including unpleasantness ratings as a covariate in the hierarchical logistic regression models of task choices.
Dots represent coefficient estimates from the model, with confidence intervals. Models are shown for both the discovery and replication samples. Significance levels are shown according to the following: p < 0.05 – *; p < 0.01 – **; p < 0.001 – ***.
Appendix 9—figure 3
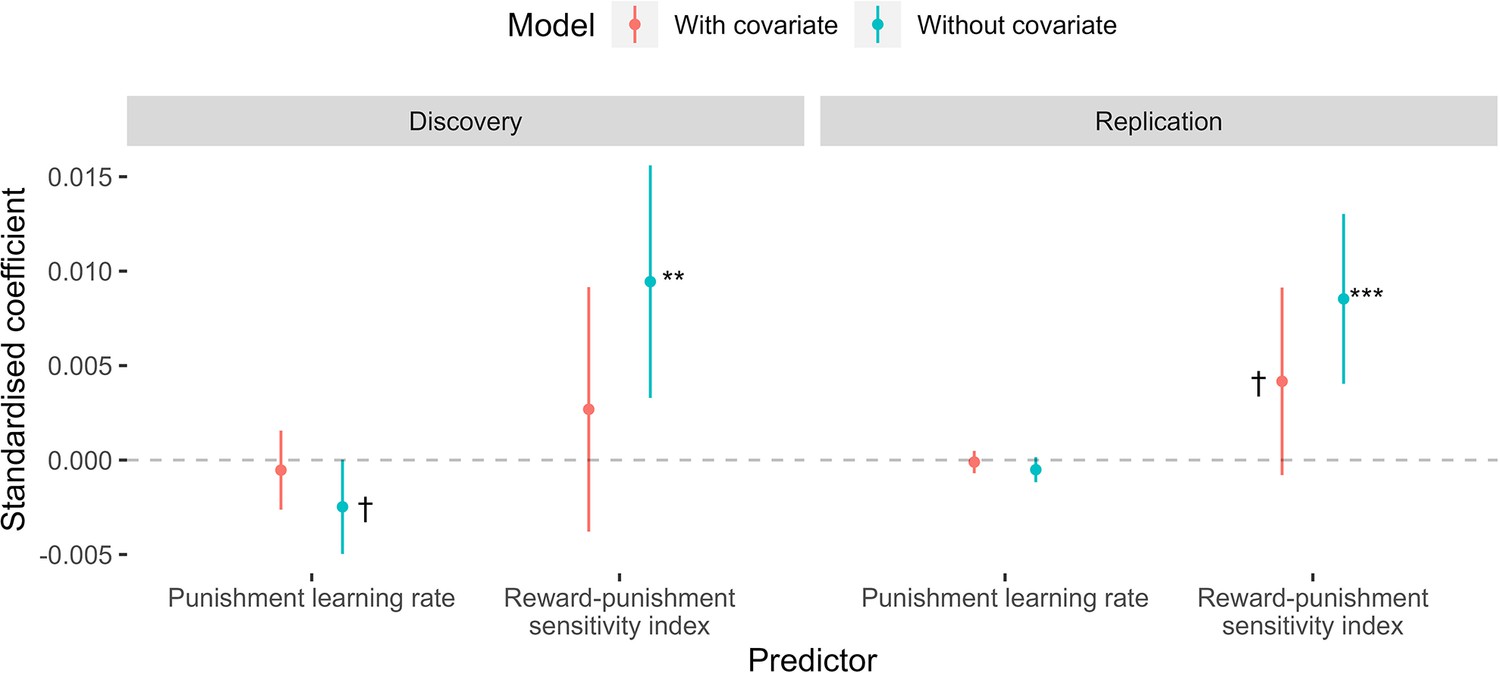
The effect of including unpleasantness ratings as a covariate in the mediation models.
Dots represent coefficient estimates from the model, with confidence intervals. Models are shown for both the discovery and replication samples. Significance levels are shown according to the following: p < 0.1 – †; p < 0.05 – *; p < 0.01 – **; p<0.001 – ***.
Appendix 9—figure 4
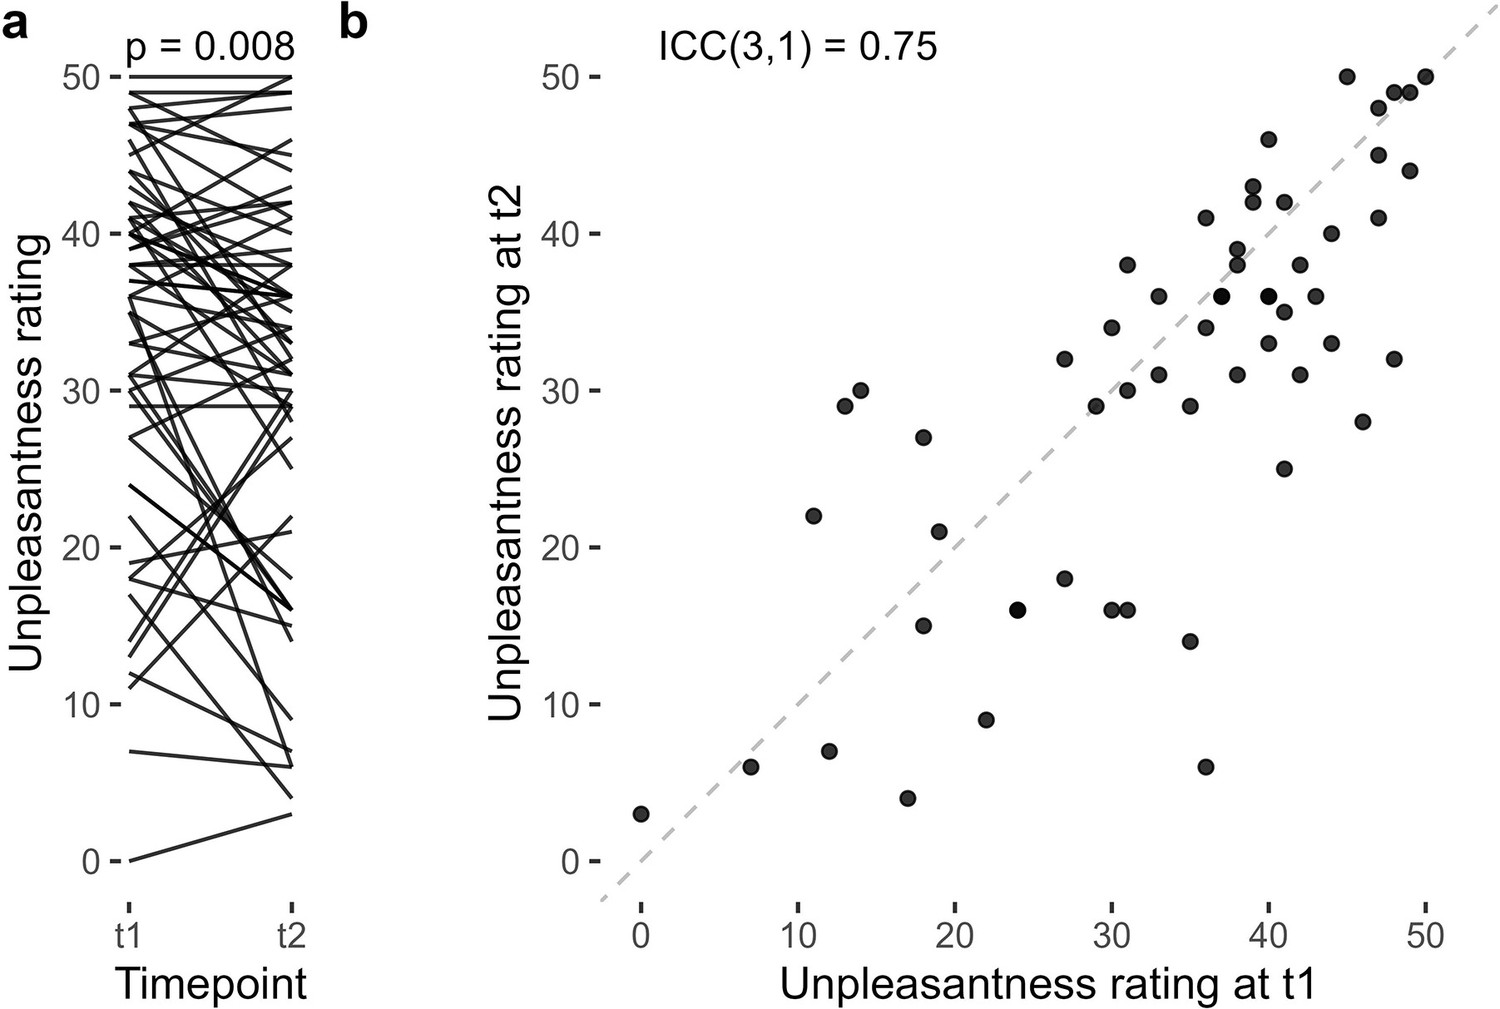
Test-retest reliability of unpleasantness ratings.
(a) Comparing unpleasantness ratings across timepoints, participants rated the punishments as significantly less unpleasant in the second session. (b) Correlation of ratings across timepoints.
Appendix 9—figure 5
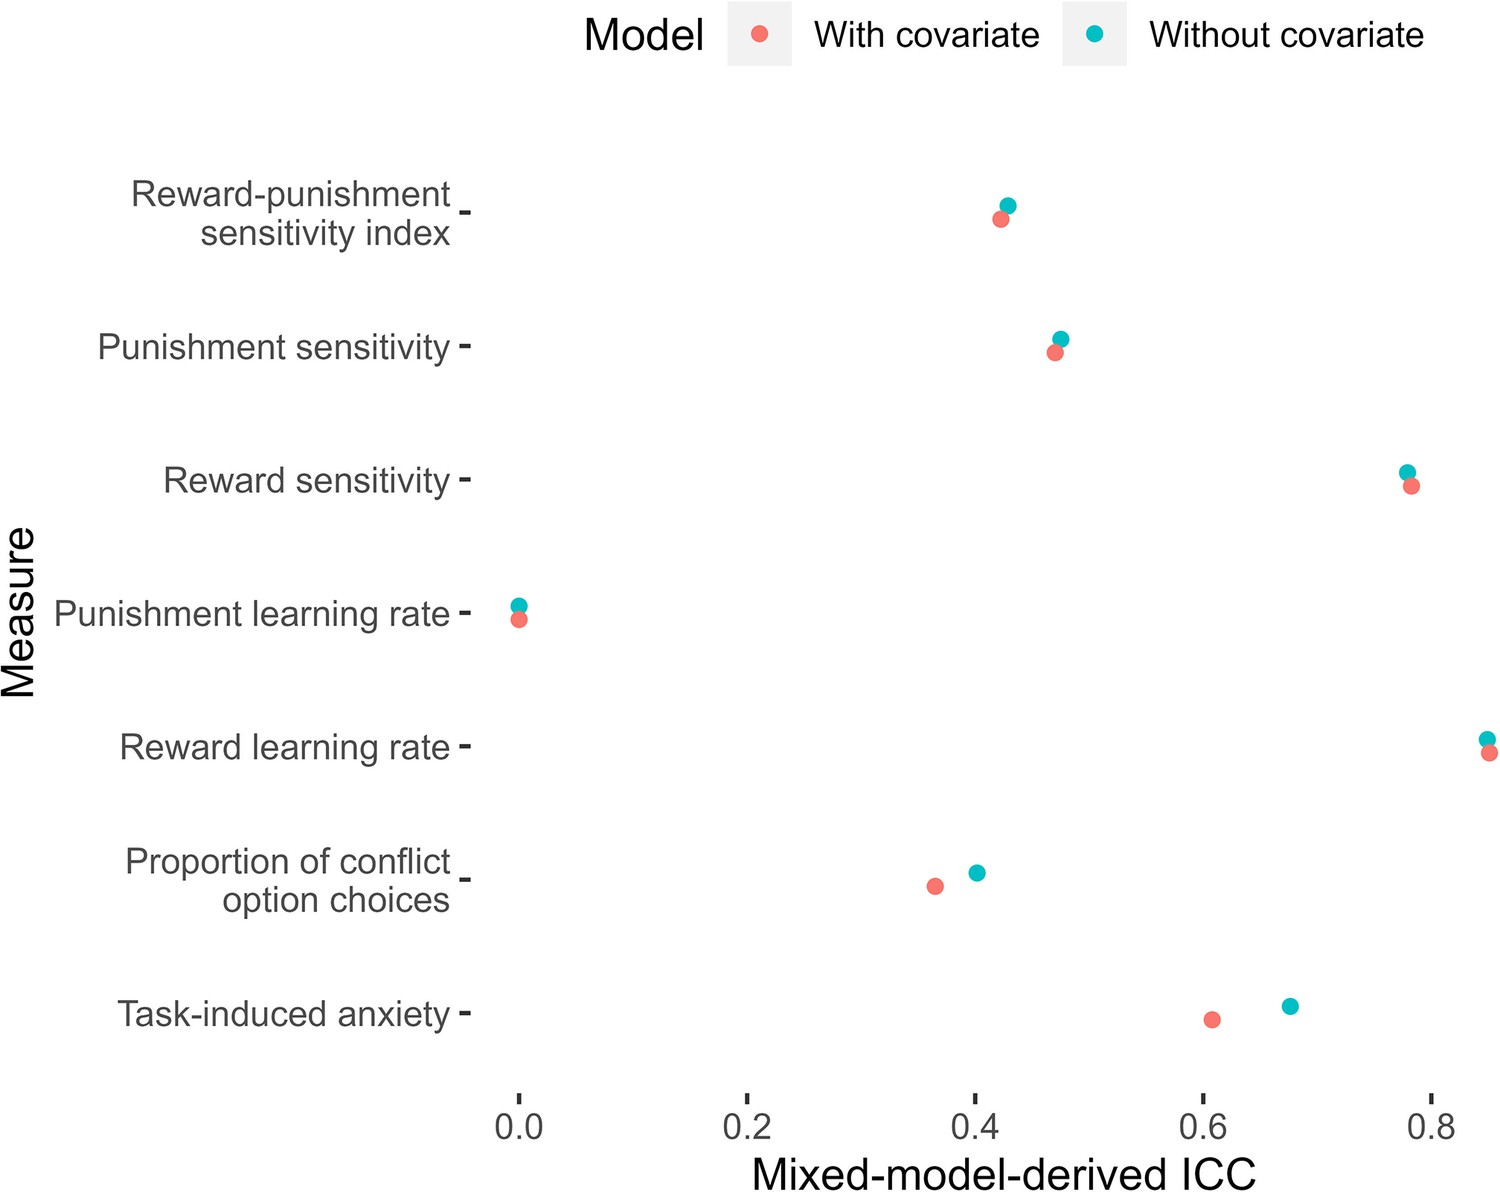
Mixed-model-derived intra-class correlation coefficients (ICCs) for measures of task performance, with and without accounting for unpleasantness.
Dots represent model-derived ICCs.
Appendix 11—figure 1
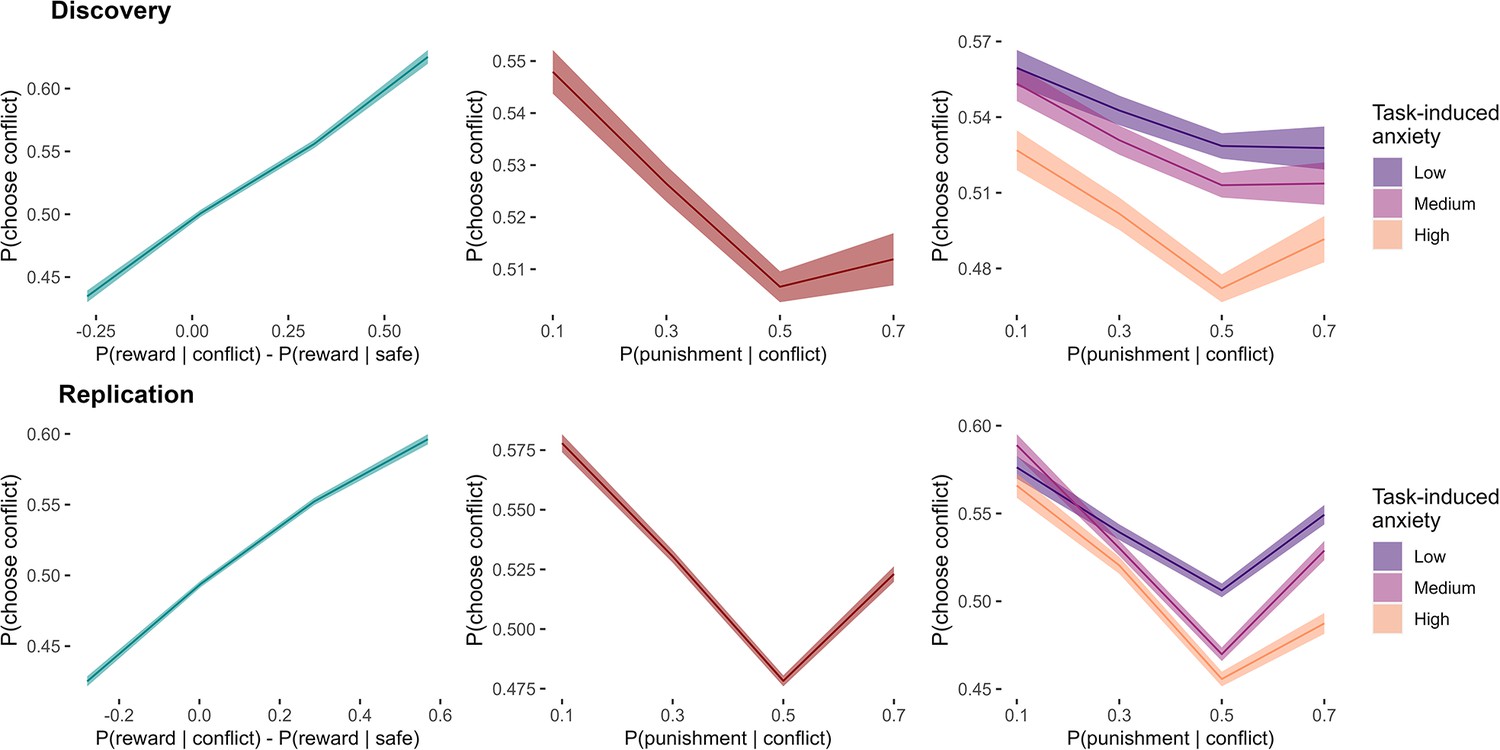
Effects of outcome probabilities on proportion of conflict option choices.
Mean probabilities of choosing the conflict arm across the sample are plotted with standard errors. The relationships between the drifting outcome probabilities in the task and group choice proportions showed non-linear trends in both the discovery and replication samples, especially for the effect of punishment probability on choice (both main effect and interaction effect with anxiety). Note. For visualisation purposes, the continuous predictors (based on the latent outcome probabilities or task-induced anxiety) were categorised into discrete bins.
Tables
Table 1
Model specification.
| Model | Parameters | |||
|---|---|---|---|---|
| Reward learning only | ||||
| Punishment learning only | ||||
| Symmetrical learning | ||||
| Asymmetric learning rates | ||||
| Asymmetric sensitivities | ||||
| Asymmetric learning rates and sensitivities | ||||
-
All custom model scripts are available online at https://osf.io/m3zev/.
Appendix 1—table 1
Statistical results across the discovery and replication samples, and the effect of data cleaning exclusions.
| Statistical test/model | Sub-test | Sample (without data cleaning) | |
|---|---|---|---|
| Discovery | Discovery | ||
| Hierarchical logistic regression; no task-induced anxiety | Reward coefficient | β = 0.98 ± 0.03, p < 0.001 | β = 0.95 ± 0.02, p < 0.001 |
| β = 0.95 ± 0.03, p < 0.001 | β = 0.90 ± 0.02, p < 0.001 | ||
| Punishment coefficient | β = –0.33 ± 0.04, p < 0.001 | β = –0.52 ± 0.03, p < 0.001 | |
| β = –0.29 ± 0.04, p < 0.001 | β = –0.50 ± 0.03, p < 0.001 | ||
| Distribution; task-induced anxiety | Mean = 21, SD = 14 | Mean = 22, SD = 13 | |
| Mean = 21, SD = 14 | Mean = 22, SD = 14 | ||
| Correlation; task-induced anxiety and choice | τ = –0.074, p = 0.033 | τ = –0.075, p = 0.005 | |
| τ = –0.068, p = 0.036 | τ = –0.081, p = 0.002 | ||
| Hierarchical logistic regression; with task-induced anxiety | Reward coefficient | β = 0.98 ± 0.03, p < 0.001 | β = 0.95 ± 0.02, p < 0.001 |
| β = 0.95 ± 0.03, p < 0.001 | β = 0.90 ± 0.02, p < 0.001 | ||
| Punishment coefficient | β = –0.33 ± 0.04, p < 0.001 | β = –0.52 ± 0.03, p < 0.001 | |
| β = –0.29 ± 0.04, p < 0.001 | β = –0.50 ± 0.03, p < 0.001 | ||
| Task-induced anxiety coefficient | β = –0.04 ± 0.04, p = 0.304 | β = 0.02 ± 0.03, p = 0.637 | |
| β = –0.03 ± 0.04, p = 0.377 | β = 0.003 ± 0.03, p = 0.925 | ||
| Interaction of task-induced anxiety and reward | β = –0.06 ± 0.03, p = 0.074 | β = –0.003 ± 0.02, p = 0.901 | |
| β = –0.05 ± 0.03, p = 0.076 | β = –0.006 ± 0.02, p = 0.774 | ||
| Interaction of task-induced anxiety and punishment | β = –0.10 ± 0.04, p = 0.022 | β = –0.23 ± 0.03, p < 0.001 | |
| β = –0.10 ± 0.04, p = 0.011 | β = –0.23 ± 0.03, p < 0.001 | ||
| Hierarchical logistic regression; with task-induced anxiety, no interaction | Reward coefficient | β = 0.99 ± 0.03, p < 0.001 | β = 0.95 ± 0.02, p < 0.001 |
| β = 0.95 ± 0.03, p < 0.001 | β = 0.89 ± 0.02, p < 0.001 | ||
| Punishment coefficient | β = –0.33 ± 0.04, p < 0.001 | β = –0.52 ± 0.03, p < 0.001 | |
| β = –0.29 ± 0.04, p < 0.001 | β = –0.50 ± 0.03, p < 0.001 | ||
| Task-induced anxiety coefficient | β = –0.09 ± 0.03, p = 0.012 | β = –0.08 ± 0.03, p = 0.005 | |
| β = –0.08 ± 0.03, p = 0.016 | β = –0.10 ± 0.03, p < 0.001 | ||
| Computational model comparison | Winning model | 2 learning rate, 2 sensitivity | 2 learning rate, 2 sensitivity |
| 2 learning rate, 2 sensitivity | 2 learning rate, 2 sensitivity | ||
| Correlation; task-induced anxiety and model parameters | Reward learning rate | τ = –0.019, p = 0.596 | τ = –0.010, p = 0.749 |
| τ = –0.006, p = 0.847 | τ = –0.012, p = 0.637 | ||
| Punishment learning rate | τ = –0.088, p = 0.015 | τ = –0.064, p = 0.019 | |
| τ = –0.073, p = 0.026 | τ = –0.074, p = 0.003 | ||
| Learning rate ratio | τ = 0.048, p = 0.175 | τ = 0.029, p = 0.282 | |
| τ = –0.037, p = 0.276 | τ = 0.045, p = 0.072 | ||
| Reward sensitivity | τ = –0.038, p = 0.286 | τ = –0.028, p = 0.285 | |
| τ = –0.047, p = 0.149 | τ = –0.023, p = 0.345 | ||
| Punishment sensitivity | τ = 0.068, p = 0.051 | τ = 0.076, p = 0.004* | |
| τ = 0.047, p = 0.153 | τ = 0.094, p < 0.001 | ||
| Reward-punishment sensitivity index | τ = –0.099, p = 0.005 | τ = –0.096, p < 0.001 | |
| τ = –0.084, p = 0.011 | τ = –0.103, p < 0.001 | ||
| Mediation | Punishment learning rate | β = – 0.002 ± 0.001, p = 0.052 | β = –0.001 ± 0.003, p = 0.132 |
| β = –0.001 ± 0.001, p = 0.222 | β = –0.001 ± 0.003, p = 0.031† | ||
| Reward-punishment sensitivity index | β = 0.009 ± 0.003, p = 0.003 | β = 0.009 ± 0.002, p < 0.001 | |
| β = 0.006 ± 0.002, p = 0.011 | β = 0.009 ± 0.002, p < 0.001 | ||
| Correlation; psychiatric symptoms and choice (overall proportion of conflict option choices) | GAD7 | τ = –0.026, p = 0.458 | τ = –0.001, p = 0.988 |
| τ = 0.005, p = 0.894 | τ = –0.002, p = 0.919 | ||
| PHQ8 | τ = –0.02, p = 0.579 | τ = –0.013, p = 0.639 | |
| τ = 0.014, p = 0.684 | τ = –0.012, p = 0.646 | ||
| BEAQ | τ = – 0.059, p = 0.010 | τ = –0.029, p = 0.286* | |
| τ = – 0.048, p = 0.151† | τ = –0.020, p = 0.423 | ||
| Correlation; psychiatric symptoms and task-induced anxiety | GAD7 | τ = 0.256, p < 0.001 | τ = 0.222, p < 0.001 |
| τ = 0.267, p < 0.001 | τ = 0.231, p < 0.001 | ||
| PHQ8 | τ = 0.233, p < 0.001 | τ = 0.184, p < 0.001 | |
| τ = 0.244, p < 0.001 | τ = 0.194, p < 0.001 | ||
| BEAQ | τ = 0.15, p < 0.001 | τ = 0.176, p < 0.001 | |
| τ = 0.172, p < 0.001 | τ = 0.17, p < 0.001 | ||
| Correlation; GAD7 and model parameters | Reward learning rate | τ = –0.06, p = 0.076 | τ = –0.03, p = 0.304 |
| τ = –0.061, p = 0.074 | τ = –0.028, p = 0.264 | ||
| Punishment learning rate | τ = –0.07, p = 0.077 | τ = –0.01, p = 0.621 | |
| τ = –0.037, p = 0.265 | τ = –0.017, p = 0.534 | ||
| Learning rate ratio | τ = –0.001, p = 0.999 | τ = –0.034, p = 0.229 | |
| τ = –0.032, p = 0.35 | τ = –0.026, p = 0.301 | ||
| Reward sensitivity | τ = –0.01, p = 0.802 | τ = –0.01, p = 0.745 | |
| τ = –0.005, p = 0.877 | τ = –0.009, p = 0.718 | ||
| Punishment sensitivity | τ = 0.05, p = 0.154 | τ = 0.003, p = 0.907 | |
| τ = 0.022, p = 0.513 | τ = 0.012, p = 0.633 | ||
| Reward-punishment sensitivity index | τ = –0.05, p = 0.149 | τ = 0.01, p = 0.746 | |
| τ = –0.023, p = 0.496 | τ = 0.007, p = 0.797 | ||
| Correlation; PHQ8 and model parameters | Reward learning rate | τ = –0.03, p = 0.396 | τ = –0.03, p = 0.219 |
| τ = –0.04, p = 0.239 | τ = –0.035, p = 0.17 | ||
| Punishment learning rate | τ = –0.06, p = 0.100 | τ = –0.01, p = 0.630 | |
| τ = –0.022, p = 0.504 | τ = –0.025, p = 0.348 | ||
| Learning rate ratio | τ = 0.008, p = 0.809 | τ = –0.033, p = 0.231 | |
| τ = –0.038, p = 0.259 | τ = –0.016, p = 0.521 | ||
| Reward sensitivity | τ = –0.012, p = 0.610 | τ = 0.01, p = 0.729 | |
| τ = –0.009, p = 0.801 | τ = 0.004, p = 0.901 | ||
| Punishment sensitivity | τ = 0.05, p = 0.179 | τ = –0.002, p = 0.948 | |
| τ = 0.008, p = 0.802 | τ = 0.012, p = 0.619 | ||
| Reward-punishment sensitivity index | τ = –0.06, p = 0.123 | τ = 0.02, p = 0.557 | |
| τ = –0.01, p = 0.773 | τ = 0.005, p = 0.867 | ||
| Correlation; BEAQ and model parameters | Reward learning rate | τ = –0.06, p = 0.085 | τ = –0.02, p = 0.394 |
| τ = –0.047, p = 0.147 | τ = –0.017, p = 0.503 | ||
| Punishment learning rate | τ = –0.08, p = 0.024 | τ = –0.03, p = 0.337* | |
| τ = –0.071, p = 0.032 | τ = –0.031, p = 0.228 | ||
| Learning rate ratio | τ = 0.018, p = 0.618 | τ = –0.005, p = 0.883 | |
| τ = 0.002, p = 0.938 | τ = 0.007, p = 0.759 | ||
| Reward sensitivity | τ = –0.01, p = 0.739 | τ = 0.01, p = 0.753 | |
| τ = –0.036, p = 0.29 | τ = 0.002, p = 0.927 | ||
| Punishment sensitivity | τ = 0.07, p = 0.061 | τ = 0.02, p = 0.477 | |
| τ = 0.05, p = 0.127 | τ = 0.025, p = 0.308 | ||
| Reward-punishment sensitivity index | τ = 0.02, p = 0.034 | τ = –0.01, p = 0.745* | |
| τ = – 0.073, p = 0.028 | τ = – 0.015, p = 0.548 | ||
-
Note. All correlations tests were conducted using permutation-based Kendall’s tau correlations, using 10,000 permutations per test. Symbols represent the following.
-
*
Inconsistent findings across discovery replication samples.
-
†
Inconsistent findings before and after data cleaning exclusions. Abbreviations: GAD7 – Generalised Anxiety Disorder 7-item scale; PHQ8 – Patient Health Questionnaire 8-item depression scale; BEAQ – Brief Experiential Avoidance Questionnaire.
Additional files
Download links
A two-part list of links to download the article, or parts of the article, in various formats.
Downloads (link to download the article as PDF)
Open citations (links to open the citations from this article in various online reference manager services)
Cite this article (links to download the citations from this article in formats compatible with various reference manager tools)
Approach-avoidance reinforcement learning as a translational and computational model of anxiety-related avoidance
eLife 12:RP87720.
https://doi.org/10.7554/eLife.87720.4


