FSHβ links photoperiodic signaling to seasonal reproduction in Japanese quail
- Department of Zoology, Science Campus, University of Allahabad, India
- School of Biodiversity, One Health and Veterinary Medicine University of Glasgow, United Kingdom
Figures
Figure 1 with 4 supplements
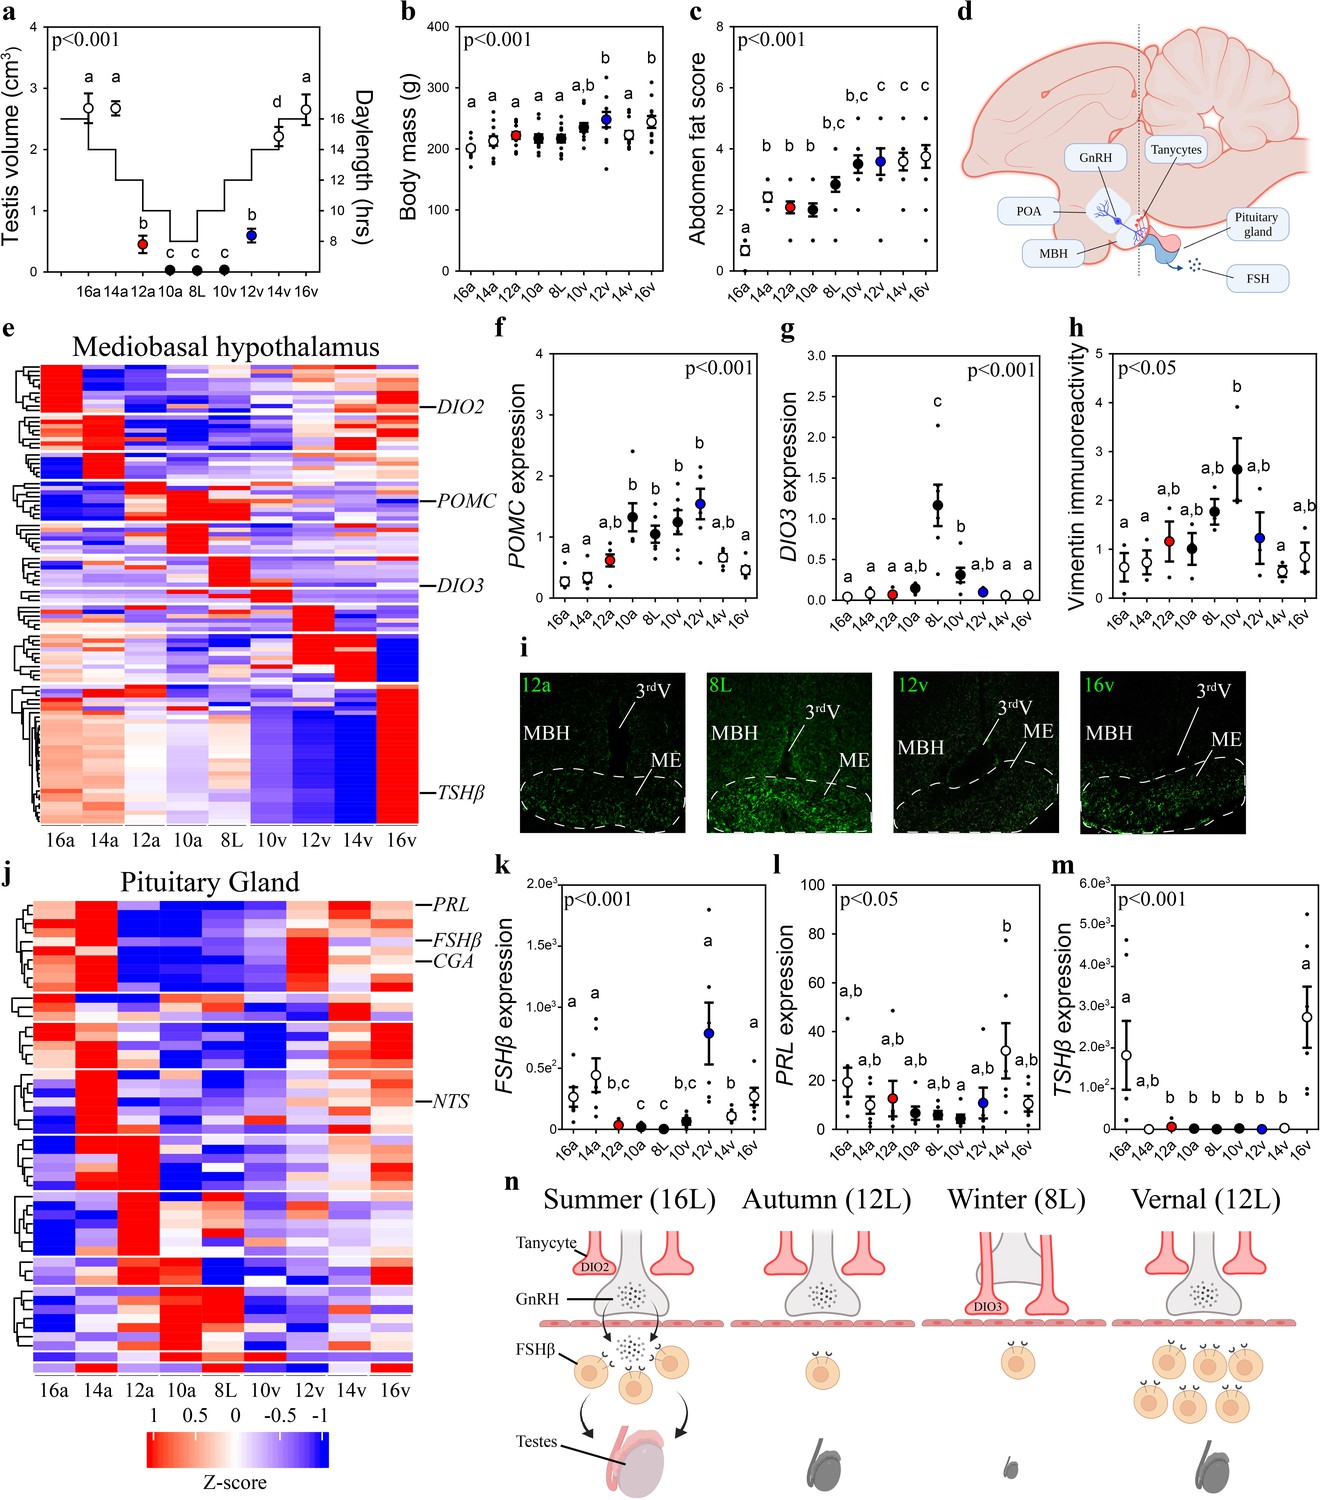
Vernal increase in pituitary FSHβ expression precedes the molecular switches in mediobasal hypothalamus and gonadal growth.
(a) Schematic representation of the simulated annual rhythm in photoperiod. Quail were collected in 16 hr light, 8 hr dark photoperiod and then every 2 weeks the photoperiod was decreased by 2 hr to 14 hr, 12 hr, 10 hr, and then an 8L short photoperiod. Photoperiod was then increased to mimic the vernal transition and birds were collected at 10, 12, 14, and 16 hr light photoperiods. Testis volume confirmed critical daylength (i.e., 12 hr) induced growth. (b) Body mass and (c) abdominal fat deposition increased until the autumnal equinox (12a), and then increased during the vernal photoperiod transitions. (d) Diagram highlighting hypothalamic preoptic area (POA), mediobasal hypothalamus (MBH), and pituitary gland. Tanycytes in the MBH gate GnRH release into the pituitary. (e) Heatmap of RNA-seq of MBH punches identified distinct wave of transcripts as quail transition across photoperiodic conditions. (f, g) Quantitative PCR (qPCR) assays for proopiomelanocortin (POMC) and deiodinase type-3 (DIO3) confirmed restricted activation during 10a–8L and 8L–10v phases, respectively. (h, i) Vimentin immunoreactivity in the median eminence (ME) show tanycytes morphology growth is limited to 10a, 8L, and 10v photoperiods. (j) Heatmap illustrating photoperiodic transitions in pituitary transcripts. (k–m) qPCRs confirmed that follicle-stimulating hormone-β (FSHβ) is elevated under non-stimulatory photoperiods followed by increased prolactin (PRL) in 14v and thyrotropin-stimulating hormone-β (TSHβ) in 16v. (n) Diagram summarizing that long photoperiods increased GNRH synthesis and release into the pituitary gland to stimulate FSHβ and induce testis growth. Transition to autumnal equinox phases results in reduced FSHβ expression and regressed testis. Prolonged exposure to short photoperiods inhibits GNRH expression, triggers tanycyte extension, maintains low FSHβ, and regressed testis. Vernal transitions in photoperiod to the equinox results in resumption of GNRH and elevated FSHβ expression without testis growth. Data are mean ± standard error of the mean (SEM), and residual dot plot. (a–c, f, g, k, m) One-way analysis of variance (ANOVA) with Bonferroni corrected Tukey’s test for multiple comparisons. (h, l) One-way ANOVA with Tukey tests for significant pairwise comparison. Letters denote significant difference between photoperiod phases. Raw data available in Figure 1—source data 1.
-
Figure 1—source data 1
Raw data.
- https://cdn.elifesciences.org/articles/87751/elife-87751-fig1-data1-v1.xlsx
-
Figure 1—source data 2
Seasonal MBH gene ontology analyses.
- https://cdn.elifesciences.org/articles/87751/elife-87751-fig1-data2-v1.xlsx
-
Figure 1—source data 3
Biodare2.0 analyses of seasonal mediobasal hypothalamus (MBH) transcripts.
- https://cdn.elifesciences.org/articles/87751/elife-87751-fig1-data3-v1.xlsx
-
Figure 1—source data 4
Seasonal pituitary gland gene ontology analyses.
- https://cdn.elifesciences.org/articles/87751/elife-87751-fig1-data4-v1.xlsx
-
Figure 1—source data 5
Biodare2.0 analyses of seasonal pituitary gland transcripts.
- https://cdn.elifesciences.org/articles/87751/elife-87751-fig1-data5-v1.xlsx
-
Figure 1—source data 6
Weighted gene co-expression network analyses.
- https://cdn.elifesciences.org/articles/87751/elife-87751-fig1-data6-v1.xlsx
-
Figure 1—source data 7
Transcription-binding motifs in the mediobasal hypothalamus transcripts.
- https://cdn.elifesciences.org/articles/87751/elife-87751-fig1-data7-v1.xlsx
-
Figure 1—source data 8
Transcription-binding motifs in the pituitary gland transcripts.
- https://cdn.elifesciences.org/articles/87751/elife-87751-fig1-data8-v1.xlsx
Figure 1—figure supplement 1

Heat-map of significant transcripts determined by BioDare2.0 for the mediobasal hypothalamus and pituitary gland.
(a) BioDare2.0 generated heatmaps representing the 398 transcripts found to be significant in the mediobasal hypothalamus and (b) 130 transcripts identified to be significant in the pituitary gland. Scale bar denotes significantly upregulated (red) and downregulated (blue) transcripts that display either rhythmic or spike patterns.
Figure 1—figure supplement 2

Assessment of photoperiodic, epigenetic and transcription-binding factors in the mediobasal hypothalamus and pituitary gland.
(a) GNRH expression in the preoptic area had a trend to significance suggesting low levels in 8L birds. (b–g) Mediobasal hypothalamic expression of deiodinase type-2 (DIO2), photoreceptors (neuropsin [OPN5], vertebrate ancient opsin [VA]), tanycytes (vimentin) immunoreactivity along the third ventricle (3rdV), DNA methyltransferase 3 (DNMT3a), and transcription-binding proteins myocyte enhancer factor 2a (MEF2a). (h–j) Pituitary gland transcript expression for DNMT3a MEF2a, and MEF2d. One-way analyses of variance (ANOVAs) were conducted to detected significance across the photoperiod treatment groups. Post hoc Tukey test was conducted after Bonferroni correction to identify significant pairwise comparisons. Letters denote significant difference between photoperiod groups (p < 0.05). Raw data available in Figure 1—source data 1.
Figure 1—figure supplement 3
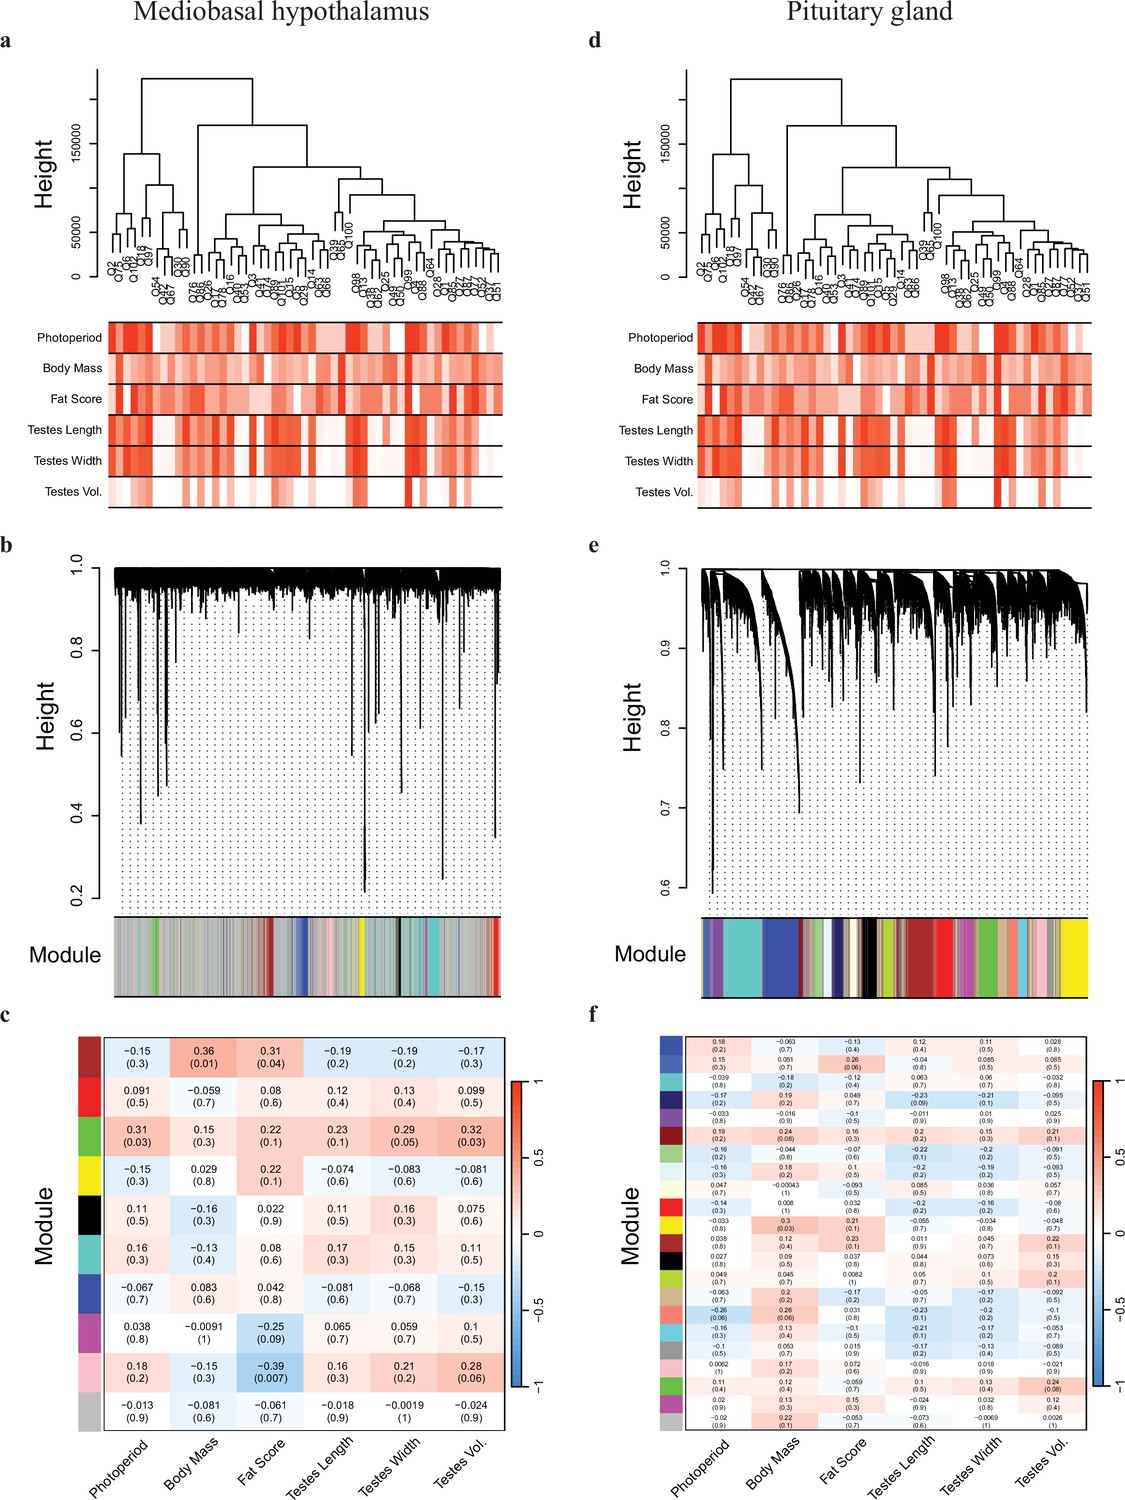
Weighted gene co-expression network analyses of the mediobasal hypothalamus (MBH) and pituitary gland transcripts.
The MBH (a) dendrogram and trait heatmap, (b) cluster dendrogram, and (c) module–trait relationships. The pituitary gland (d) dendrogram and trait heatmap, (e) cluster dendrogram, and (f) module–trait relationships.
Figure 1—figure supplement 4

CHiP-X enrichment analyses to identify DNA-binding motifs common across transcripts detected as significantly different based on BioDare2.0 analyses of the mediobasal hypothalamus (MBH) (a) and pituitary gland (b).
Thicker lines indicate stronger association across transcription factors. MBH had low commonality among transcripts, and several showed no association. Pituitary gland transcripts had strong association among a relative few transcription factors. These findings indicate strong tissue-specific recruitment of transcription factors to drive photoperiod-induced changes in transcript expression. Moreover, the strong association in the pituitary gland suggests few transcripts might orchestrate the seasonal change in expression. Abbreviations: BAF chromatin remodeling complex subunit 11A (BCL11A), Basic Helix-Loop-Helix family member E40 (BHLHE40), CCCTC-binding factor (CTCF), CCAAT Enhancer-binding protein Beta (CEBPB), E2F Transcription Factor 1, (E2F1), E2F Transcription Factor 4 (E2F4), E2F Transcription Factor 6 (E2F6), Early growth response 1 (EGR1), Jun Proto-Oncogene (JUN), MAX Interactor 1 (MXI1), MYC Associated zinc finger protein (MAZ), Myocyte Enhancer Factor 2A (MEF2A), Myoblast determination protein 1 (MYOD1), NK6 homeobox 2 (NKX62), PR domain zinc finger protein 1 (PRDM1), Regulatory factor X (RFX5), Spi-1 Proto-Oncogene (SPI1), Transcription factor 12 (TCF12), THAP Domain Containing 1 (THAP1), Zinc Finger with KRAB and SCAN Domains 1 (ZKSPAN1).
Figure 2 with 1 supplement
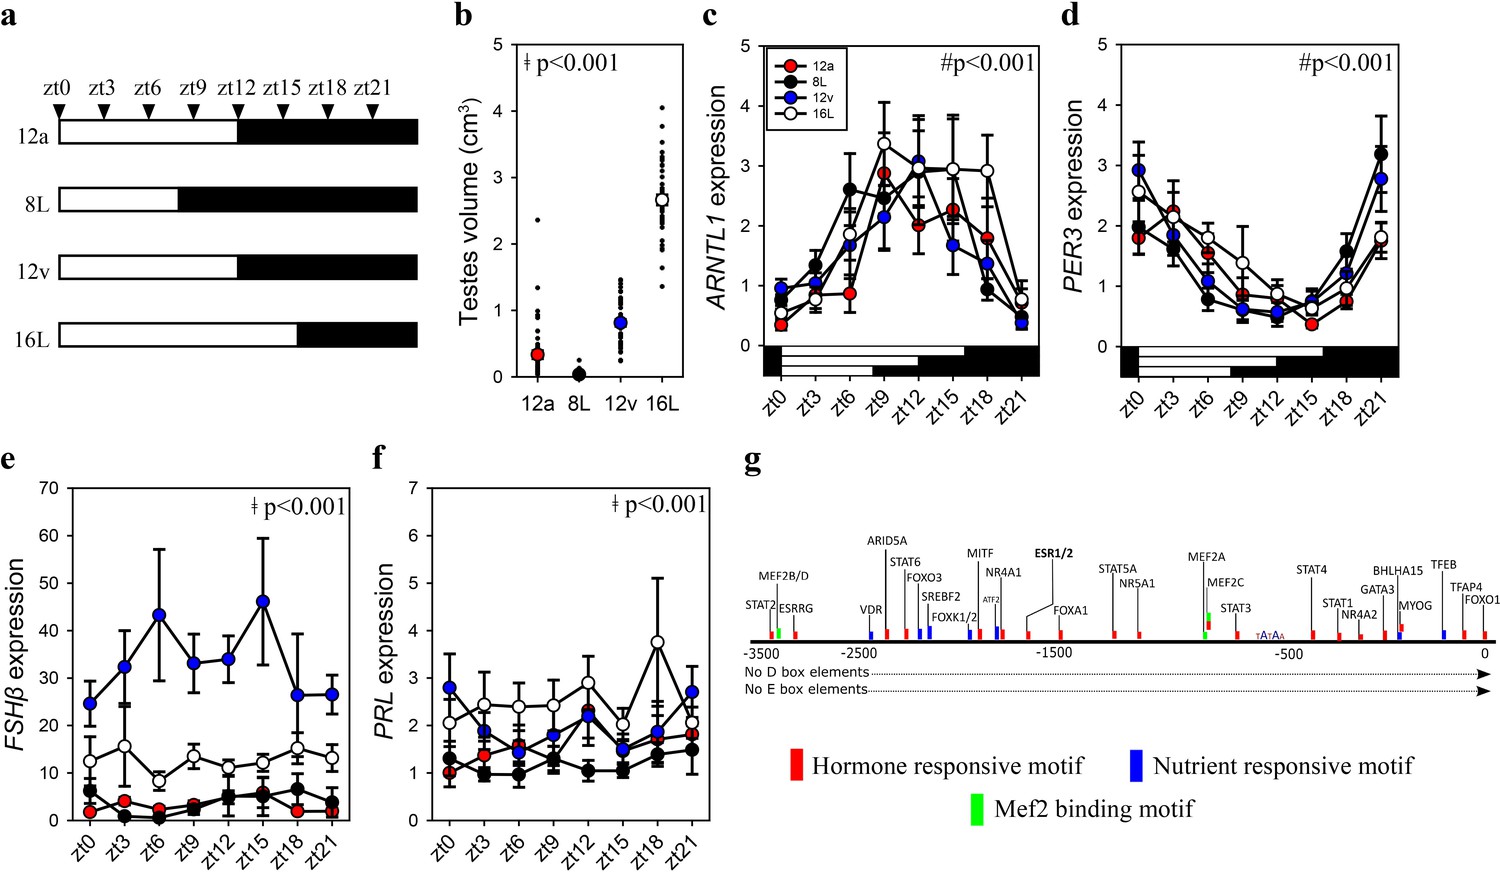
FSHβ expression is constitutively expressed during the vernal equinox.
(a) Schematic representation of four photoperiod treatment groups with arrows to indicate the daily sampling time. (b) Testes volume remained in a regressed non-functional state in autumnal equinox (12a), short photoperiod (8L), and vernal equinox (12v). Photoperiods that exceeded the critical daylength (i.e., >12 hr) induced testes growth. (c) Pituitary circadian clock gene ARNTL1 maintained daily rhythmic expression waveforms across all photoperiods (p < 0.001), there were no significant differences between photoperiod treatments (p = 0.42). (d)PER3 displayed a daily waveform across 12a, 8L, 12v, and 16L groups (p < 0.001) and was anti-phase compared to ARNTL1. There was no significant difference between photoperiod treatment (p = 0.31). (e) Follicle-stimulating hormone-β (FSHβ)expression was significantly higher in 12v compared to long photoperiod (16L; p < 0.001), autumnal equinox (12a; p < 0.001) and short photoperiod (8L; p < 0.001) but was not rhythmic (p = 0.66). (f) Similarly, PRL was high in 16L compared to 12a (p < 0.001), and 8L (p <0 .001), there was no significant daily rhythms (p = 0.52). (g) FSHβ promoter was devoid of circadian gene-binding D- and E-box motifs but contains a series of hormone and nutrient responsive motifs. (b–f) Two-way analysis of variance (ANOVA) followed by Tukey’s pairwise tests, rhythmic analyses were conducted using GraphPad Prism. ǂ indicates significant photoperiod treatment effects; # denotes significant time of day effect. Data are mean ± standard error of the mean (SEM) and residual dot plot (a–d). Raw data are available in Figure 1—source data 1.
-
Figure 2—source data 1
Daily waveform analyses.
- https://cdn.elifesciences.org/articles/87751/elife-87751-fig2-data1-v1.xlsx
-
Figure 2—source data 2
Follicle-stimulating hormone-β (FSHβ) promoter DNA motif and transcription-binding factors.
- https://cdn.elifesciences.org/articles/87751/elife-87751-fig2-data2-v1.xlsx
Figure 2—figure supplement 1

Circadian clock gene (ARNTL1, PER3) in the mediobasal hypothalamus (MBH) from Japanese quail collected every 3 hr under short photoperiod (8L), autumnal equinox (12a; 12L:12D), vernal equinox (12v; 12L:12D), and long photoperiod (16L).
(a) ARNTL1 had a significant time of day effect, but no significant photoperiod effect or significant interaction. (b) There was a significant effect of photoperiod on PER3 expression, but no significant time of day, or photoperiod treatment. (c) Thyroid hormone enzyme deiodinase type-2 (DIO2) expression in the quail MBH was observed to have a significant photoperiod effect and time of day, but no significant interaction. Two-way analysis of variance (ANOVA) was conducted for ARNTL1, PER3, and DIO2 expression. ǂ indicates significant photoperiod treatment effect; # denotes significant time of day effect; * indicates significant interaction. Plots are mean ± standard error of the mean (SEM) and horizontal white and black bars indicate lights ON or OFF, respectively. Rhythmic analyses are presented in Figure 1—source data 1.
Figure 3 with 1 supplement
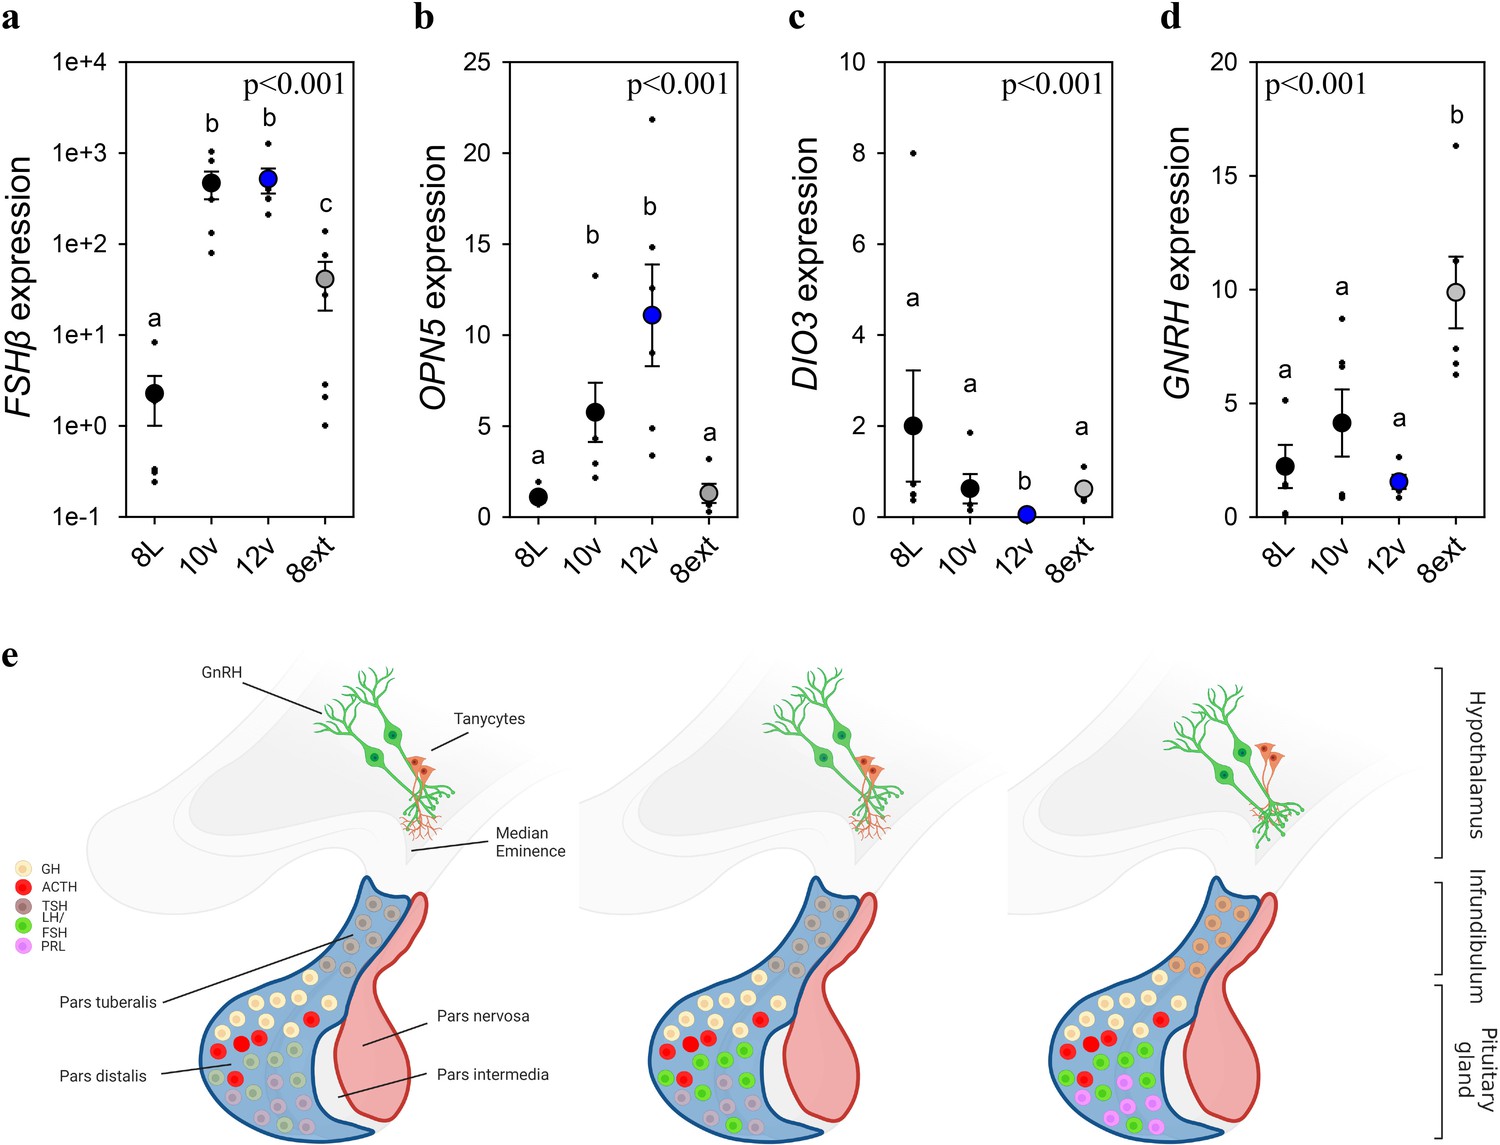
Endogenous and light-induced FSHβ expression in the pituitary gland.
(a) Follicle-stimulating hormone-β (FSHβ) expression increased during the photoinduced transition from 8L to 10v, and 12v. FSHβ also showed a smaller, yet significantly increased in expression after prolonged exposure to 8L. Y-axis is presented in log-scale due to the significant increase in FSHβ expression in 10v and 12v. (b)OPN5 was detected in the pituitary gland and showed a significant increase in expression in the transition to 10v and 12v, similar to FSHβ expression. (c)DIO3 was significantly reduced in 12v quail compared to all other treatment groups. (d)GNRH expression remained constant during the transition from 8L to 12v. However, continued exposure to 8L was observed to increase GNRH expression. Data are mean ± standard error of the mean (SEM) and residual dot plot (a–d). One-way analysis of variance (ANOVA) with Tukey’s test for multiple comparisons. Letters denote significant difference between photoperiod phases. Raw data are available in Figure 1—source data 1. (e) Schematic representation of the endogenous and light-dependent increase in pituitary cell types during the transition from 8L to stimulatory 16v light treatments. Increased color indicates increased transcript expression.
Figure 3—figure supplement 1

Endogenous and light-induced molecular switches in the quail mediobasal hypothalamus and pituitary gland.
(a) Schematic representation of the experimental timeline. A subset of quail was collected from short photoperiod (8L) and another group were kept on short photoperiod for an additional 4 weeks (8ext). Similar to the previous studies, another group of birds were transferred to 10L:14D for 2 weeks and another subset of birds were collected (10v). The final group of birds were transferred to 12L:12D for 2 weeks and served as the spring equinox group (12v). Quantitative PCR assays for MEF2a, DIO2, and DNMT3a expression in male quail housed in short photoperiod, spring transition to 10 hr light (10v), the spring equinox (12v), or in short photoperiods for an extended 4 weeks (8ext). (b) One-way analysis of variance (ANOVA) revealed MEF2a expression in the pituitary gland varied significantly across the photoperiodic conditions (F = 3.37, p < 0.05) and Tukey’s test identified higher levels in 10v compared to 8ext. (c) There was no significant difference in DIO2 expression in the pituitary gland (F = 2.83,p = 0.06). (d) Pituitary gland DNMT3a did not vary significantly across photoperiodic conditions (F = 0.68, p = 0.57). (e) DIO2 in the mediobasal hypothalamus was significantly different across photoperiods (F = 3.19, p < 0.05). Tukey’s test identified that 12v had higher levels compared to 8ext. Plot is mean ± standard error of the mean (SEM) with residual dot plots. Raw data are available in Figure 1—source data 1.
Additional files
-
Supplementary file 1
Two distinct pituitary cell types are involved in the external coincidence model for the avian photoperiodic response.
Short photoperiods activate an endogenously generated programmed to increase follicle-stimulating hormone-β (FSHβ) expression in the pars distalis of the pituitary gland. A gradual increase in non-stimulatory photoperiods, such as 10v and 12v, establish the photosensitive state and characterized by constituently expressed FSHβ. Photoperiods that extend beyond the critical daylength (e.g., >12v) activates thyrotropes thyrotropin-stimulating hormone-β (TSHβ) expression in the pars tuberalis of the pituitary gland. The coincidence timing of long day TSHβ with the short day photosensitivity induced by increased FSHβ expression results in gonadal development. Figure was created using BioRender.
- https://cdn.elifesciences.org/articles/87751/elife-87751-supp1-v1.pdf
-
Supplementary file 2
Quantitative PCR primer and parameter.
- https://cdn.elifesciences.org/articles/87751/elife-87751-supp2-v1.xlsx
-
Supplementary file 3
Bioinformatic pipeline.
- https://cdn.elifesciences.org/articles/87751/elife-87751-supp3-v1.pdf
-
MDAR checklist
- https://cdn.elifesciences.org/articles/87751/elife-87751-mdarchecklist1-v1.docx
-
Source code 1
R-code for analyses.
- https://cdn.elifesciences.org/articles/87751/elife-87751-code1-v1.zip
Download links
A two-part list of links to download the article, or parts of the article, in various formats.
Downloads (link to download the article as PDF)
Open citations (links to open the citations from this article in various online reference manager services)
Cite this article (links to download the citations from this article in formats compatible with various reference manager tools)
FSHβ links photoperiodic signaling to seasonal reproduction in Japanese quail
eLife 12:RP87751.
https://doi.org/10.7554/eLife.87751.3


