Sex-specific splicing occurs genome-wide during early Drosophila embryogenesis
- MCB department, Brown University, United States
- CCMB department, Brown University, United States
- Biology department, Johns Hopkins University, United States
Figures
Figure 1 with 1 supplement
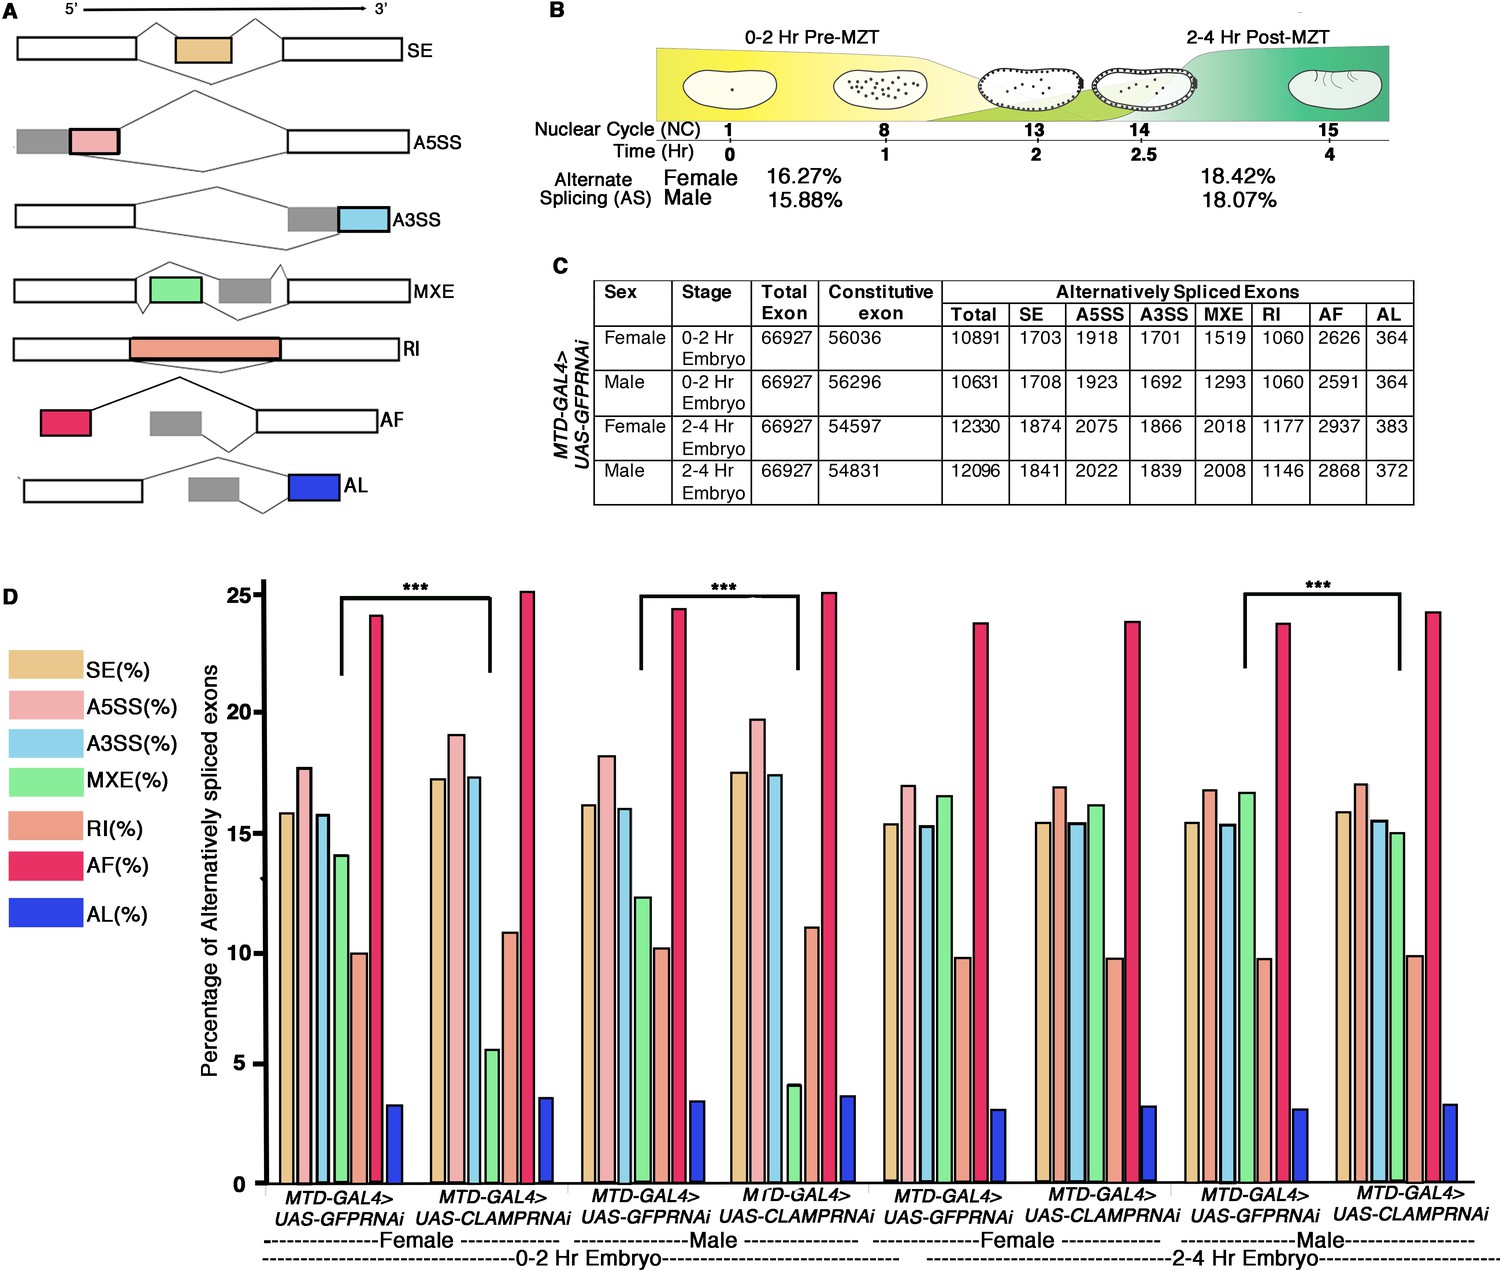
Alternative splicing (AS) during early Drosophila melanogaster embryonic development.
(A) Schematic diagrams showing seven different types of AS. The constitutive exons are depicted as white rectangles, whereas the alternatively spliced exons are in shades of gray and different colors rectangles according to type of AS. (B) Percentage of genes with AS in male and female early Drosophila embryos at the 0–2 hr/pre-MZT (maternal to zygotic transition) and 2–4 hr/post-MZT stages. (C) Table showing the number of exons in each AS category in control sexed embryos at the 0–2 hr/pre-MZT and 2–4 hr/post-MZT stages. (D) Bar plot showing the distribution of different types of AS (colored according to A) at 0–2 hr/pre-MZT and 2–4 hr/ post-MZT for female and male embryos in the presence (MTDGAL4>UAS-GFPRNAi) and absence (MTDGAL4>UAS-CLAMPRNAi) of maternal CLAMP (chromatin-linked adapter for MSL proteins). A Chi-square test was performed to determine if there is a significant difference between the percentage of each type of AS including mutually exclusive exon (MXE) splicing (black bar) in the presence vs. absence of CLAMP in each class of sample: female and male 0–2 hr/pre-MZT and 2–4 hr/post-MZT embryos. Statistically significant differences (p<0.001 marked by ***) were found between categories connected by solid black lines.
-
Figure 1—source data 1
Source data for Figure 1C.
- https://cdn.elifesciences.org/articles/87865/elife-87865-fig1-data1-v2.docx
Figure 1—figure supplement 1

Schematic diagram describing each step-in sequential order performed by the time2Splice pipeline.
Figure 2 with 3 supplements
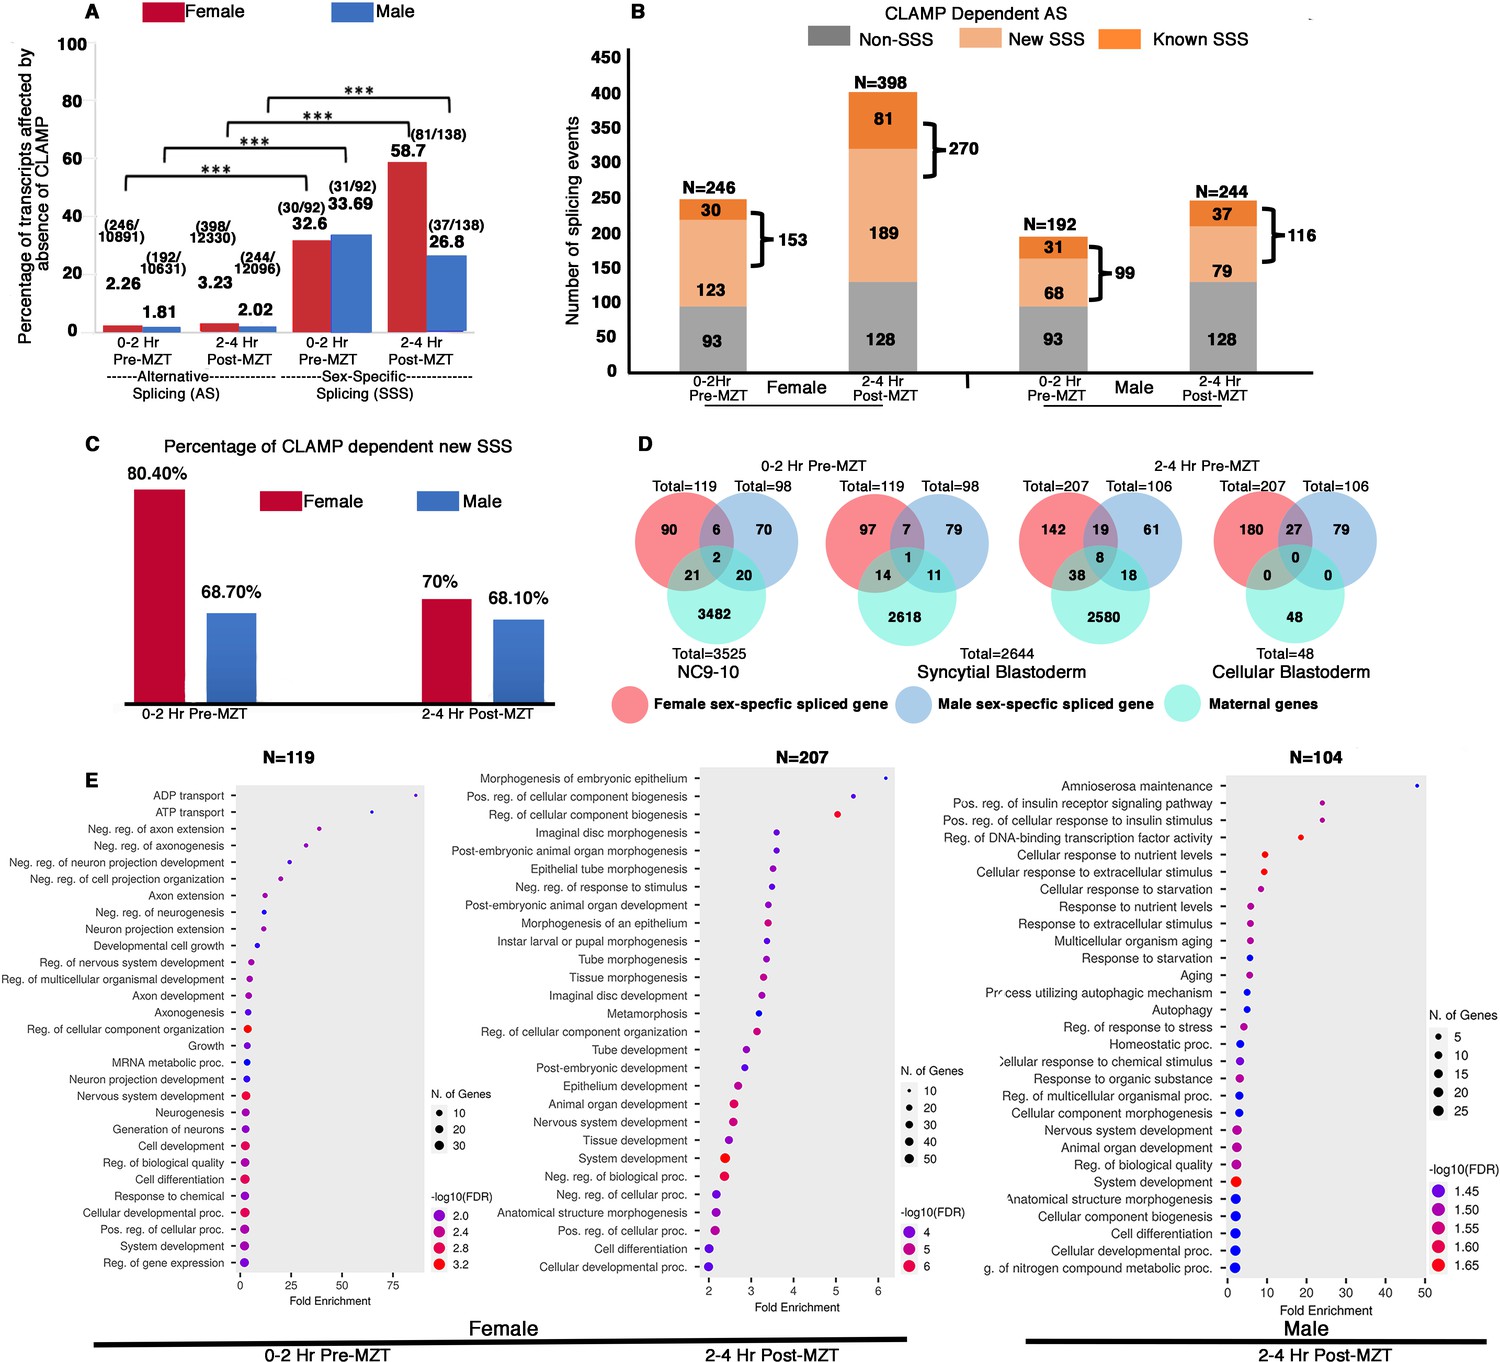
Maternal CLAMP (chromatin-linked adapter for MSL proteins) regulates sex-specific alternative splicing (AS) during early embryonic development.
(A) Bar graph showing the percentage of transcripts (raw values noted at the top of each bar) compared with total AS events or sex-specific splicing (SSS) events within parentheses listed at the top of each bar: number of splicing events regulated by CLAMP/total number of splicing events. We quantified transcripts whose splicing is regulated by maternal CLAMP at the 0–2 hr/pre-MZT (maternal to zygotic transition) and 2–4 hr/post-MZT stages in females (red bars) and males (blue bars). A Fisher’s exact test was performed with significance shown at p<0.001. (B) Bar plot showing the total number of splicing events undergoing CLAMP-dependent AS (N) in females and males at 0–2 hr/pre-MZT and 2–4 hr/post-MZT embryonic stages. Alternatively, spliced genes are divided into non-sex-specific (gray) and sex-specific (orange shades) sub-categories. CLAMP-dependent female and male SSS genes are divided into known (sex-specific in control samples: darker orange) and new (sex-specific only after depleting CLAMP: lighter orange) sub-categories identified from 0 to 2 hr/pre-MZT and 2–4 hr post-MZT/embryos. (C). Percentage of new female (red) and male (blue) CLAMP-dependent SSS genes in 0–2 hr/pre-MZT and 2–4 hr/post-MZT embryos that were not identified as different between males and females in control samples. (D). Female (red) and male (blue) CLAMP-dependent SSS genes compared with maternal genes (green, NC9-10 stage, N=3525; syncytial blastoderm stage, N=2644; cellular blastoderm stage, N=48) at 0–2 hr/pre-MZT (female, N=119 and male, N=98) and 2–4 hr/ post-MZT stages (female, N=207 and male, N=106). (E). Gene Ontology (GO) results for genes showing CLAMP-dependent female SSS in embryos at the 0–2 hr/pre-MZT stage and for genes exhibiting CLAMP-dependent female and male SSS in embryos at the 2–4 hr/post-MZT stage, using ShinyGO v0.75c: Gene Ontology Enrichment Analysis with an FDR cutoff of 0.05. We compared the gene list with a background of all protein-coding genes in the D. melanogaster genome. The number of genes in each group (N) listed at the top of each dot plot. Number of genes involved in each GO category noted as the size of the circle and GO biological processes plotted according to degree of fold enrichment along the x-axis. The size of the circle increases as the number of genes in that category increases. The color of the circle represents significance (p-value, -log10FDR). GO categories for male embryos at the 0–2 hr/pre-MZT stage are not shown because the gene set is small and therefore no enriched GO categories were identified.
Figure 2—figure supplement 1
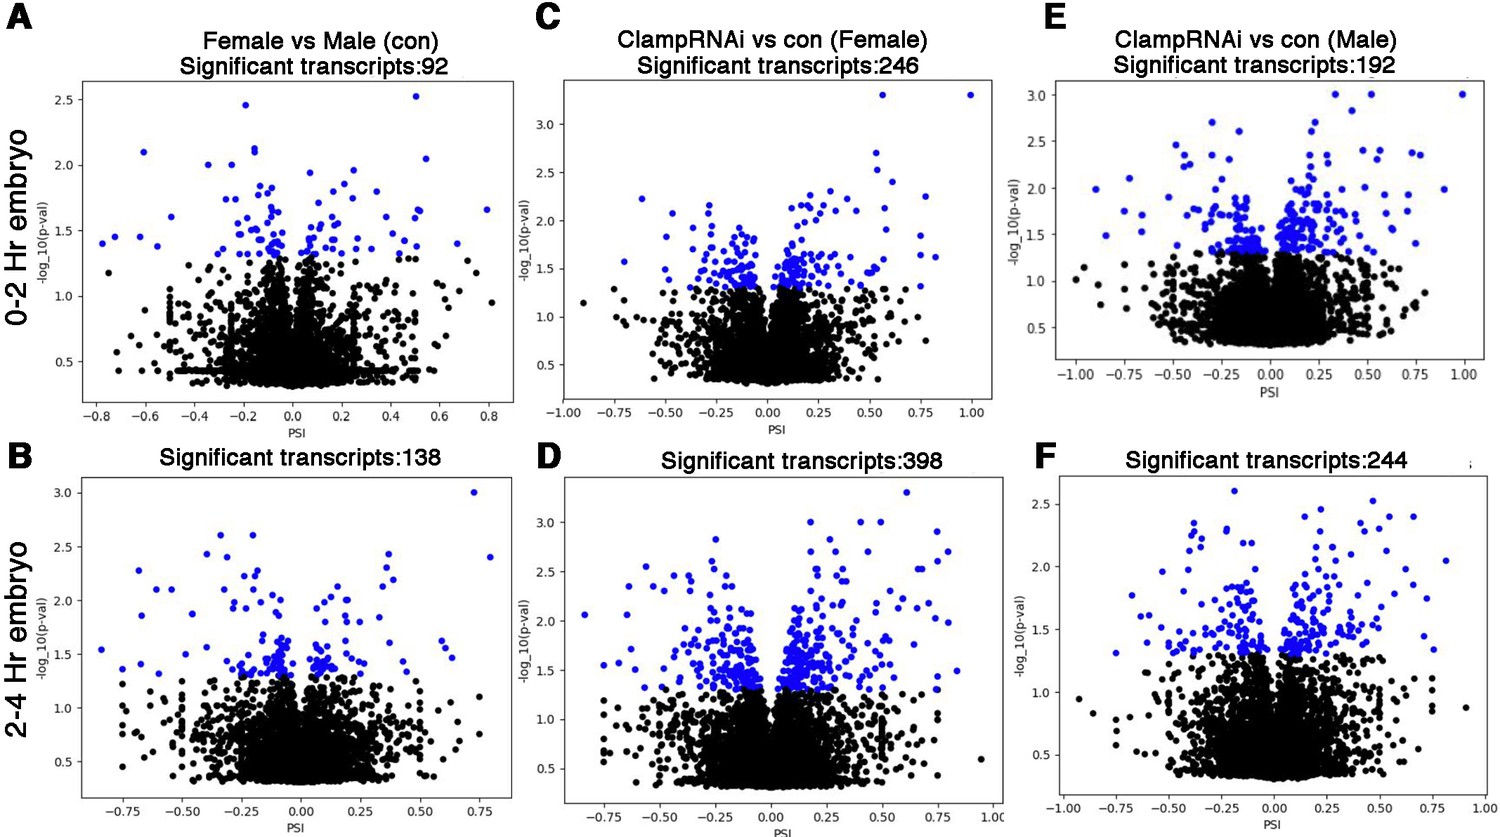
Sex-specific differences in alternative splicing in early D. melanogaster embryos.
(A–F) Volcano plots showing log10_pvalues for significant differences between percent spliced in (PSI) values for splicing events at early embryonic stages in female and male embryos 0–2 hr (A, C, E) and 2–4 hr (B, D, F). Significant changes are labeled as blue dots (p<0.05 and PSI minimum ±0.2). For example, PSI of +0.8 means 80% of the transcripts retained the exon, while negative PSI values mean reduced inclusion of the alternative exon.
Figure 2—figure supplement 2
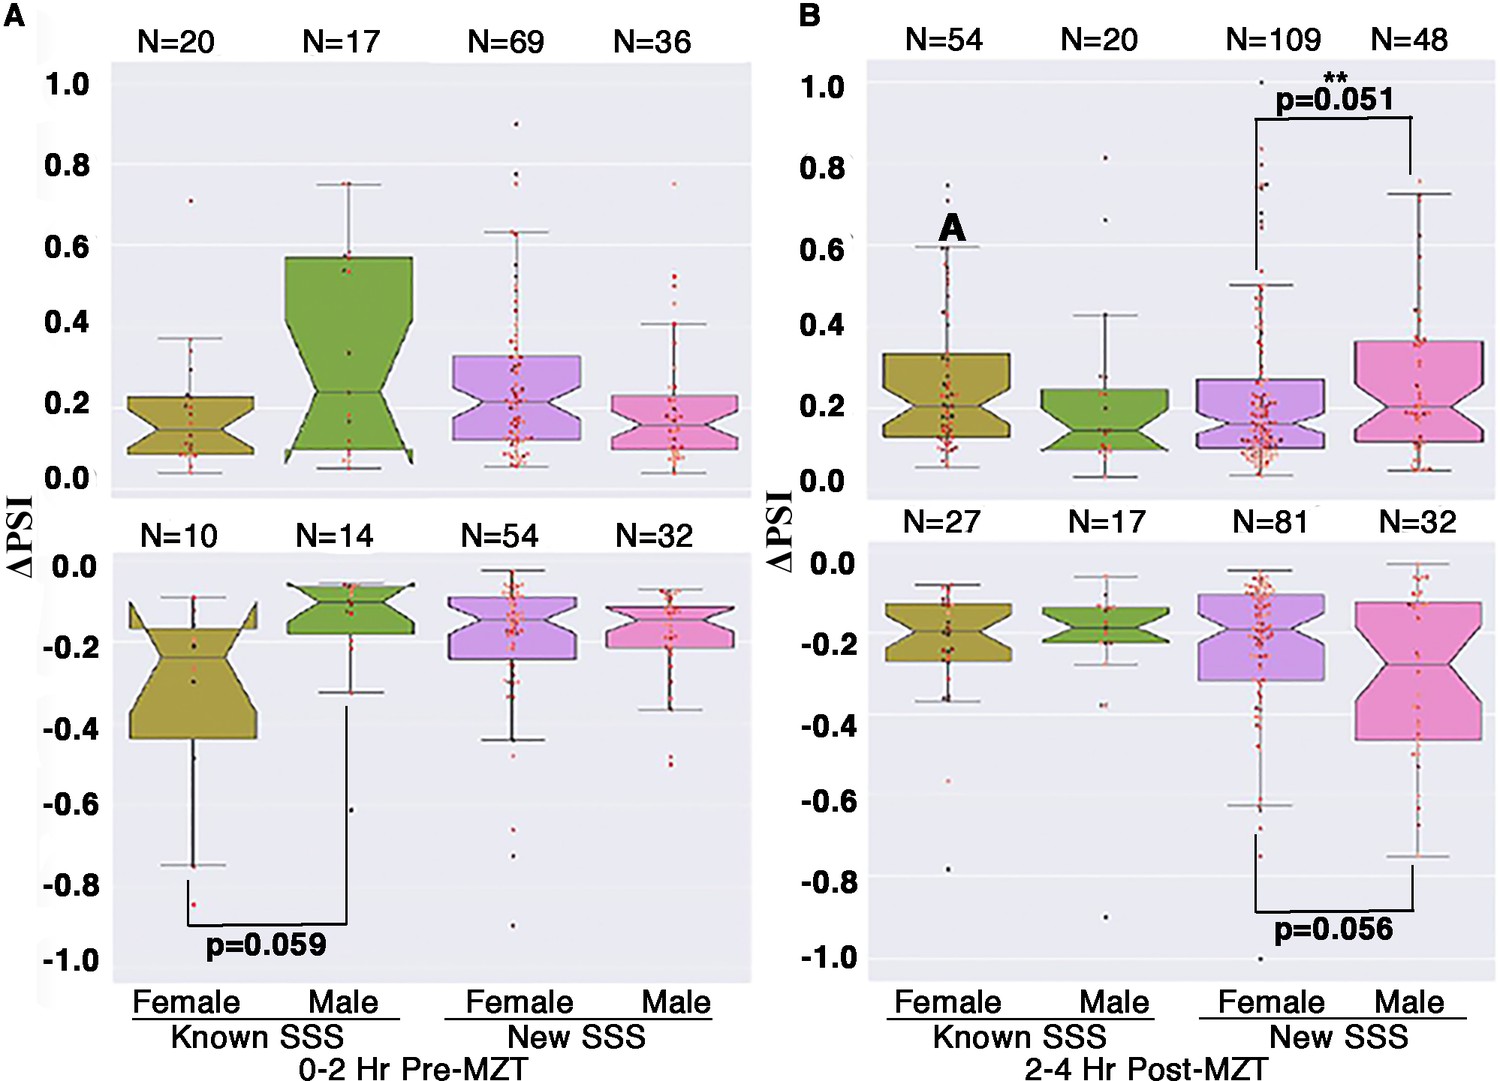
CLAMP (chromatin-linked adapter for MSL proteins) inhibits aberrant alternative splicing in post-MZT (maternal to zygotic transition) male embryos.
Box plot showing ΔPSI values for known (different between females and males in control samples) and new (not different in males and females in control samples) CLAMP-dependent sex-specific spliced events at 0–2 hr/pre-MZT and 2–4 hr/post-MZT female and male embryos. N denotes the total number of splicing events in each category, and p-values for groups showing significant differences are noted at the bottom of the line connecting the compared groups.
Figure 2—figure supplement 3
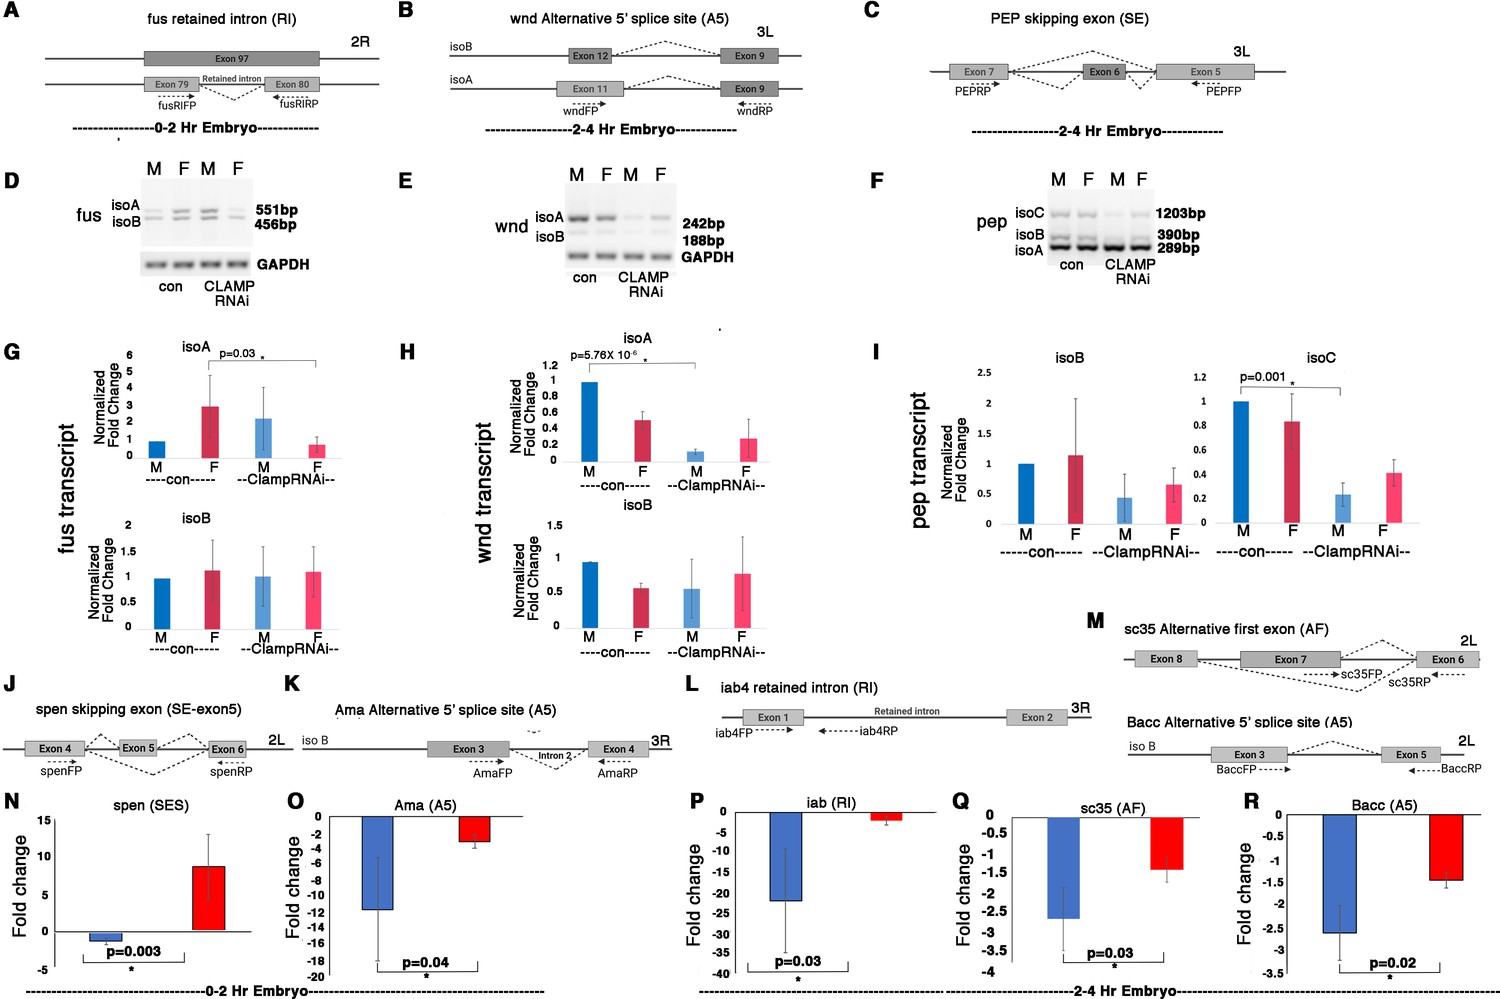
Validation of splicing differences at randomly chosen target genes where CLAMP (chromatin-linked adapter for MSL proteins) regulates sex-specific splicing by RT-PCR and qRT-PCR.
(A–C) Schematic showing alternative splicing events resulting in different isoforms of the same gene which are regulated by CLAMP and the position of primers (dotted arrows) used to detect these isoforms in RT-PCR assays. (D–F) Inverted agarose electrophoretic gel images show the expression level of each isoform detected using primers in the RT-PCR assays noted in (A–C) in male (M) and female (F) early embryos under control GFPRNAi as well as CLAMPRNAi conditions. (G–I). Bar plots showing the change in levels of specific isoforms resulting from alternative splicing events in male (blue) and female (red) early embryos under control GFPRNAi (deeper shade of blue and red) and CLAMPRNAi (lighter shade of blue and red) conditions. The isoform transcript levels are normalized by the levels of gapdh housekeeping gene transcript. p-Values (paired Student’s t-test) for groups showing significant differences (*) are noted at the top of the line connecting the compared groups (four replicates for each gene). (J–M). Schematic showing alternative splicing events resulting in different isoforms of the same gene which are regulated by CLAMP and the position of primers (dotted arrows) used to detect these isoforms by qRT-PCR analysis. (N–R) Bar plot showing fold changes in transcript levels of the isoform detected using primers shown in (J–M) of respective genes by qRT-PCR (three replicates) in the MTD-GAL4>CLAMPRNAi genotype when compared to the control (MTD-GAL4>GFPRNAi) genotype, in 0–2 hr/pre-MZT and 2–4 hr/post-MZT sexed embryos. Fold changes for each transcript differ significantly between males (blue) and females (red) (p≤0.05, Student’s t-test).
-
Figure 2—figure supplement 3—source data 1
Source data for Figure 2—figure supplement 3D, fus transcript levels.
- https://cdn.elifesciences.org/articles/87865/elife-87865-fig2-figsupp3-data1-v2.zip
-
Figure 2—figure supplement 3—source data 2
Source data for Figure 2—figure supplement 3D, E, and F, for gapdh transcript level.
- https://cdn.elifesciences.org/articles/87865/elife-87865-fig2-figsupp3-data2-v2.zip
-
Figure 2—figure supplement 3—source data 3
Source data for Figure 2—figure supplement 3E, wnd transcript levels.
- https://cdn.elifesciences.org/articles/87865/elife-87865-fig2-figsupp3-data3-v2.zip
-
Figure 2—figure supplement 3—source data 4
Source data for Figure 2—figure supplement 3F, pep transcript levels.
- https://cdn.elifesciences.org/articles/87865/elife-87865-fig2-figsupp3-data4-v2.zip
Figure 3
CLAMP (chromatin linked adapter for MSL proteins) has context-specific dual role in splicing and transcription at specific genomic loci.
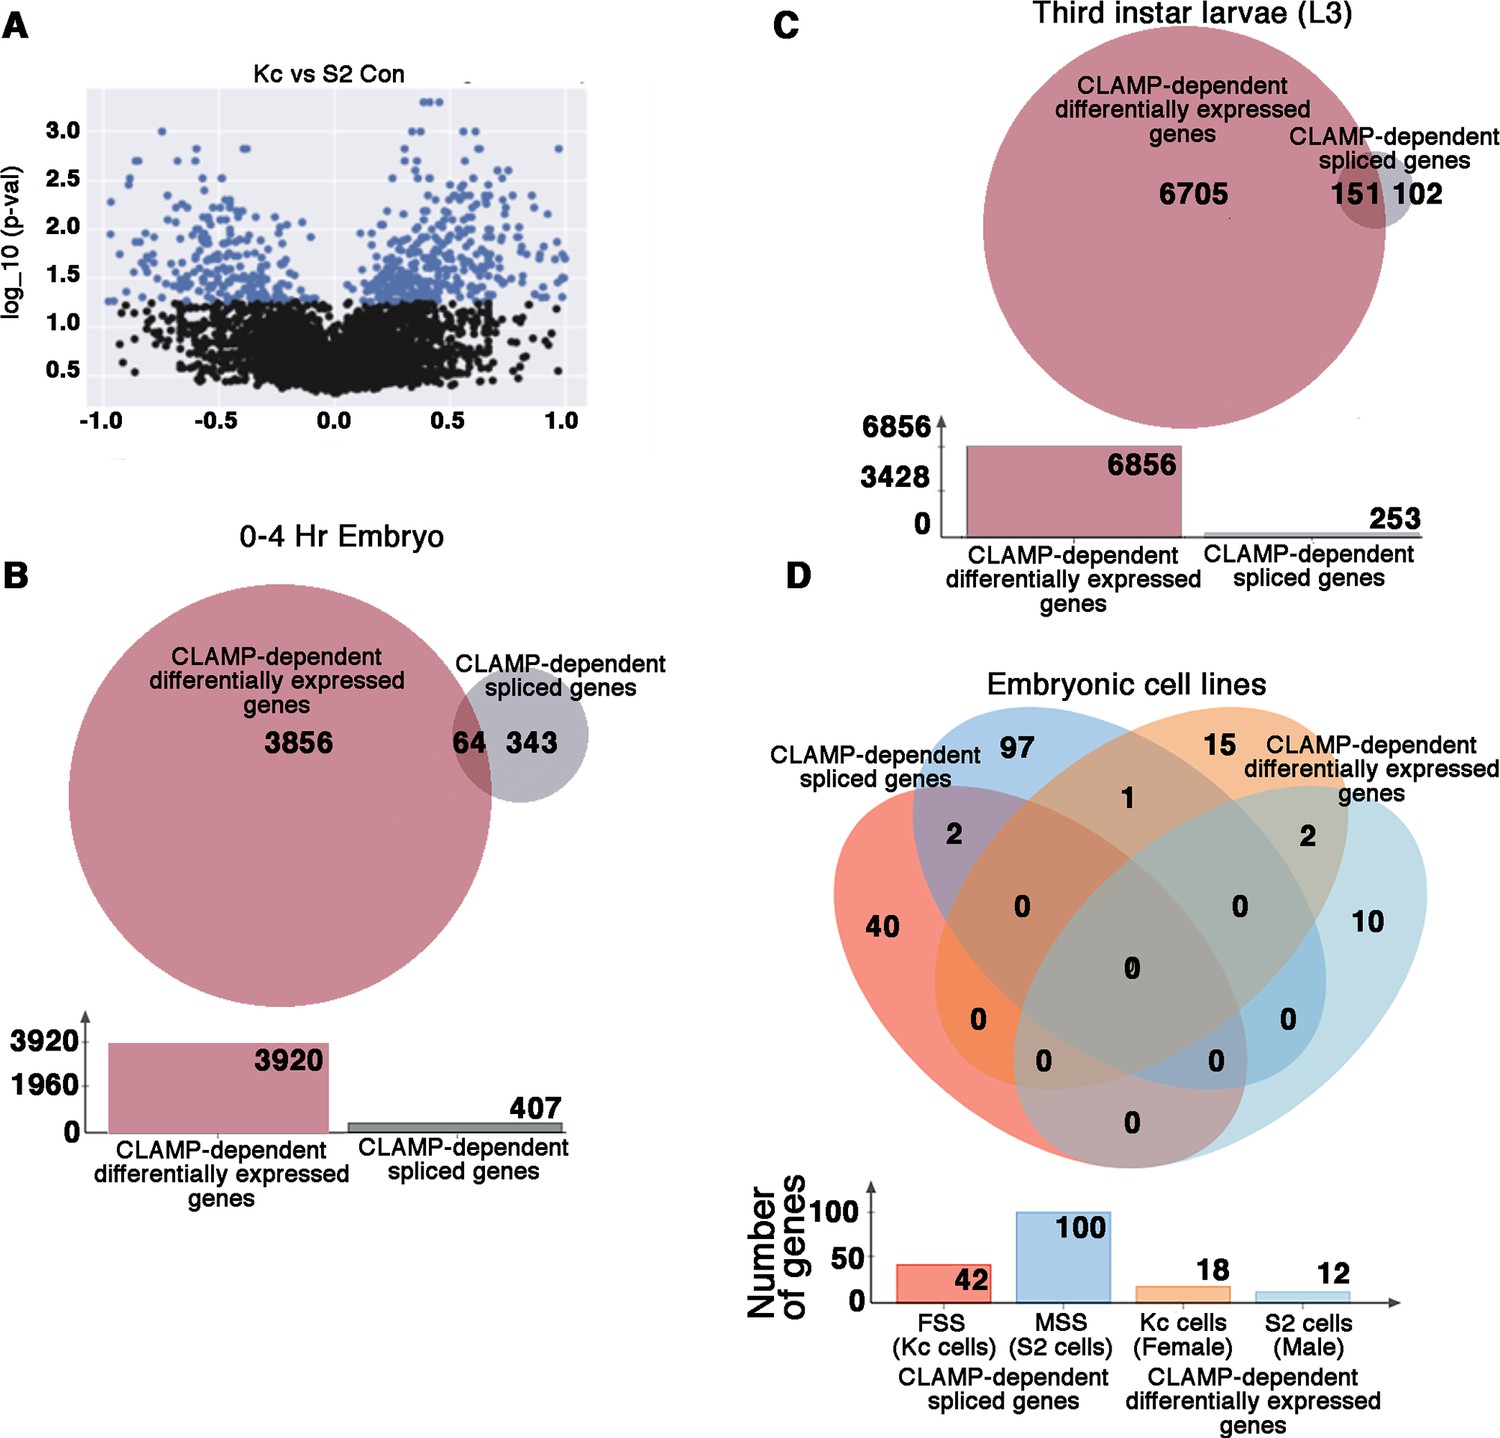
(A) Volcano plot showing log10_p-values for significant differences between percent spliced in (PSI) values for splicing events in female (Kc) and male (S2) Drosophila embryonic cell lines. Significantly changed splicing events (N=615) are labeled as blue dots (p<0.05 and PSI minimum ±0.2). (B–C) Venn diagram showing overlap between CLAMP-dependent spliced genes with CLAMP-dependent differentially expressed genes in third instar larvae (A) and 0–4 hr embryo (B). The total number of genes in each category is shown in the bar plot below the Venn diagram. (D). Venn diagram showing overlaps between dependent spliced genes in Kc (female) cells (pink circle) and S2 (male) cells (deep blue circle) with CLAMP-dependent differentially expressed genes in Kc (orange circle) and S2 cell lines (light blue circle). Bar plot shows the total number of genes in each category.
Figure 4 with 1 supplement
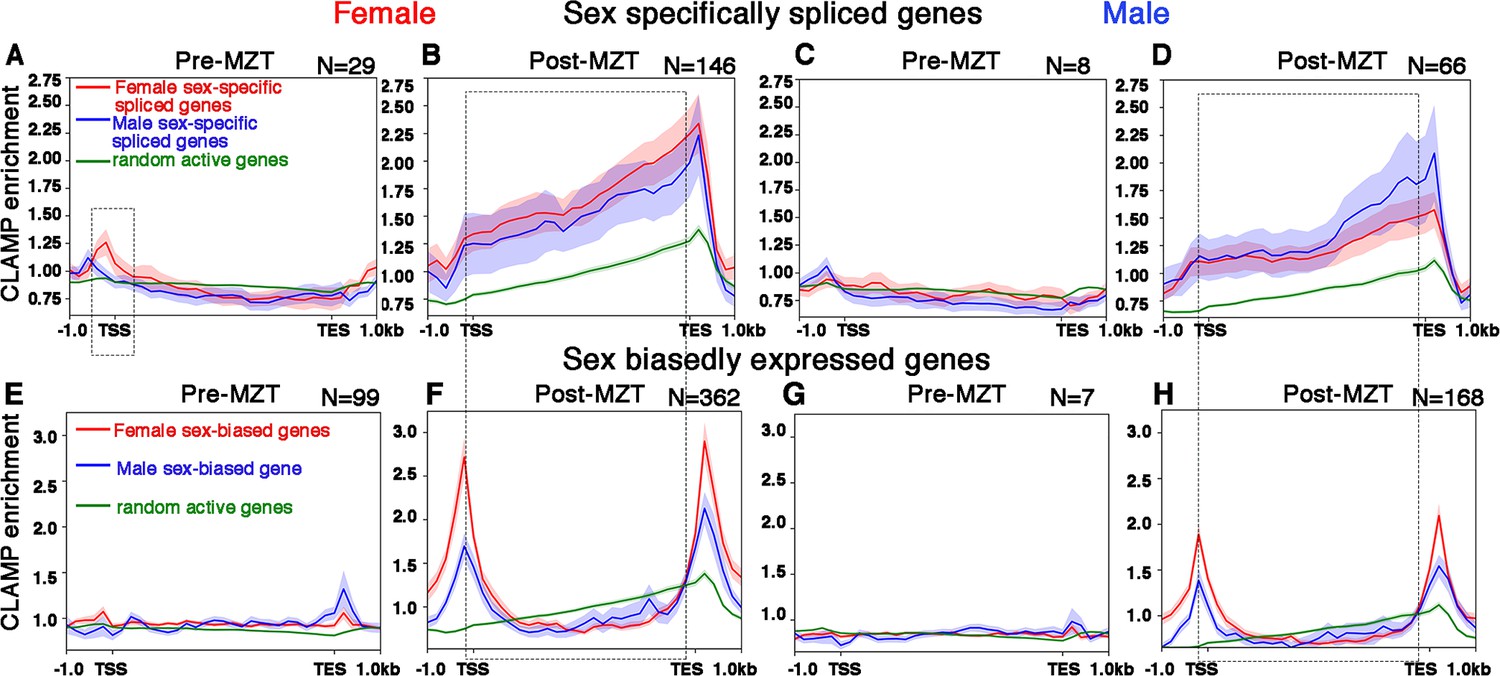
CLAMP (chromatin-linked adapter for MSL proteins) binds along the gene body of female and male sex-specifically spliced genes at the post-MZT (maternal to zygotic transition) embryonic stage.
(A–D) Average profiles for CLAMP binding at pre-MZT and post-MZT embryonic stages in females (A, C) and males (B, D) for genes spliced female-specifically (red line) and male-specifically (blue line) during the pre-MZT (A, B) and post-MZT (C, D) stages. (E–H) Average profiles for CLAMP binding to genes expressed in a sex-biased manner in females (red line) and males (blue line) during pre-MZT (E, F) and post-MZT (G, H) stage. Green lines in (A–H) represent CLAMP binding at a random set of active genes used as a control (see Materials and methods for details). Stippled regions in (A, C) (female, 0–2 hr pre-MZT) denote chromatin around the transcription start site (TSS) with more CLAMP binding in female sex-specifically spliced genes vs. male sex-specifically spliced genes. The dotted boxes in (A–H) highlight the gene body regions in CLAMP-dependent sex-specifically spliced genes and genes with CLAMP-dependent sex-biased expression. Number of genes in each group denoted as N.
Figure 4—figure supplement 1

CLAMP (chromatin-linked adapter for MSL proteins) binds to chromatin near splice junctions.
(A–D) Notched box plots representing distance between CLAMP peaks in sex-specifically spliced and sex-biased genes with the nearest splice junction in female (A, C) and male (B, D) 0–2 hr (A, B) and 2–4 hr (C, D) embryos. p-Values (Mann-Whitney test) for each group are noted at the top and those with significant differences and the compared groups are connected with a solid black line with an asterisk at the top *. t-Tests and KS-tests were also performed and showed the same results. (E–H) Notched box plots representing distance between CLAMP peaks in introns of the sex-specifically spliced and sex-biased genes and the nearest splice junction in female (E, G) and male (F, H) 0–2 hr (E, F) and 2–4 hr (G, H) embryos. p-Values (Mann-Whitney test) for each group are noted at the top for those with significant differences and the compared groups are connected with a solid black line with an asterisk at the top *. t-Test and KS-test were also performed and showed the same results.
Figure 5
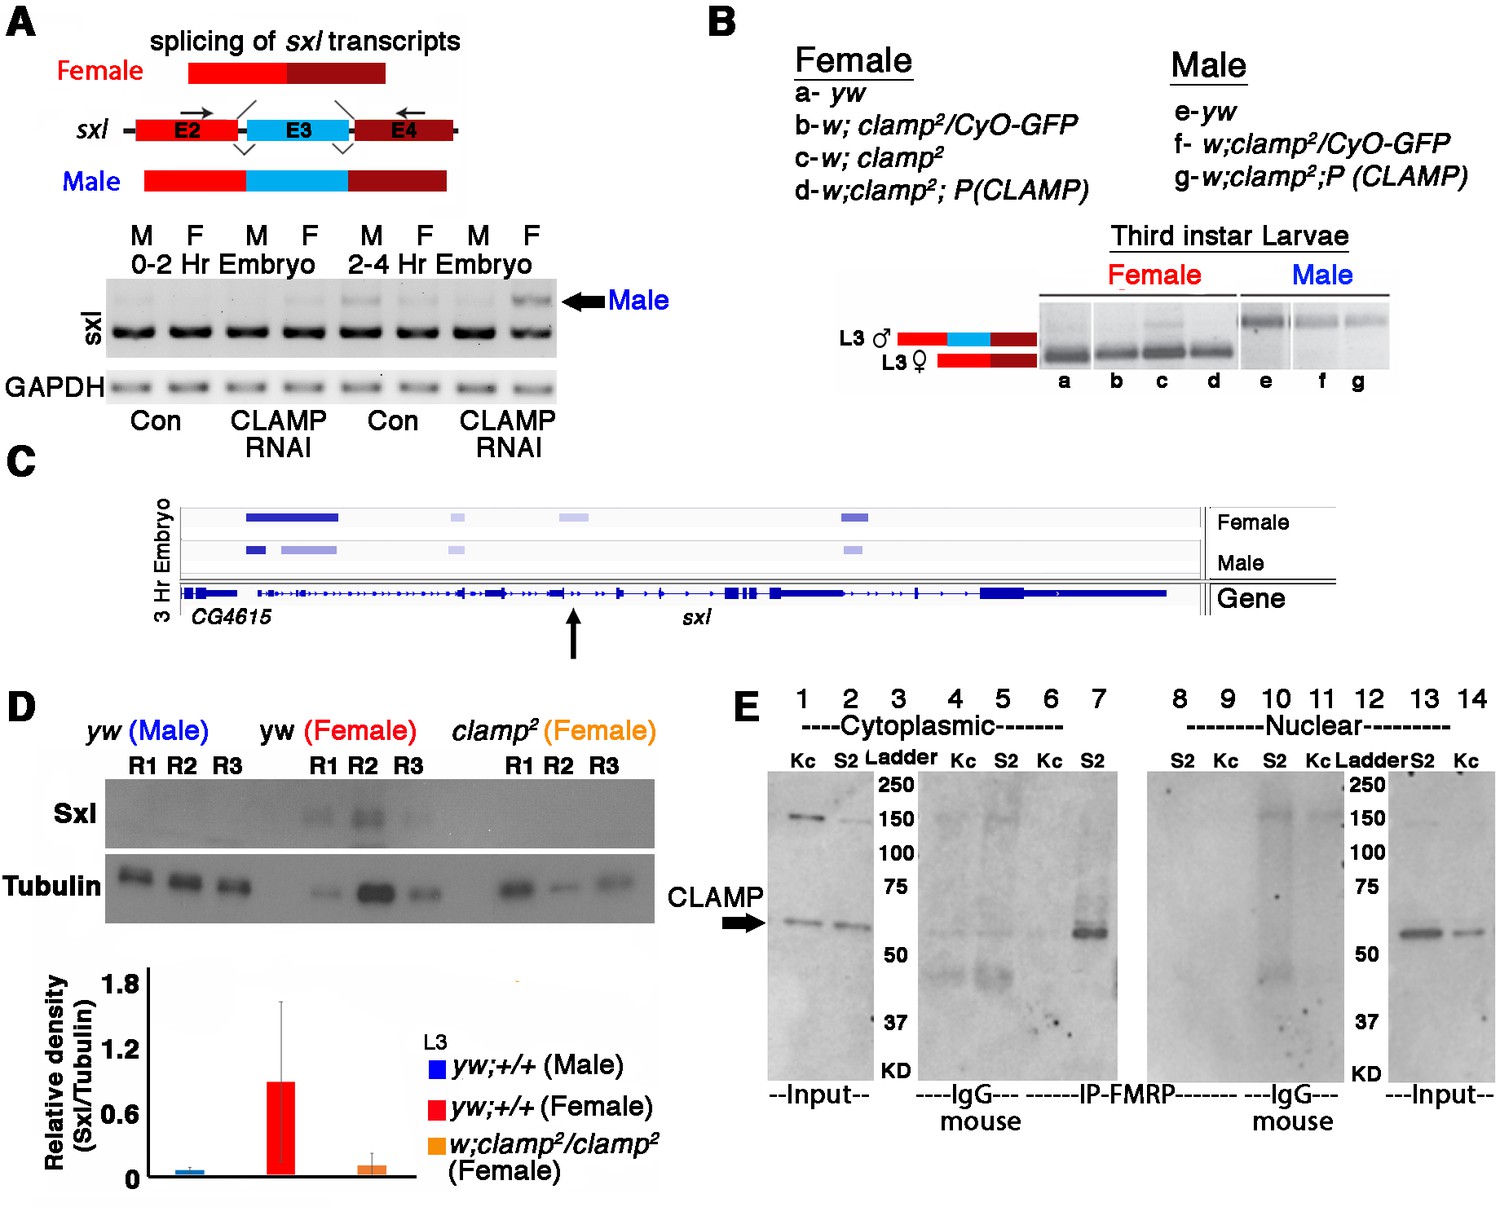
Alternative splicing of sxl transcript and Sxl protein levels is modulated by CLAMP (chromatin-linked adapter for MSL proteins) in females.
(A) RT-PCR electrophoresis gel images (inverted colors) showing splicing of sxl transcripts in 0–2 and 2–4 hr sexed embryos in the presence and absence of maternal CLAMP with a representative schematic of the splicing event at the top of the gel image. The arrow indicates the male-specific sxl transcript (number of replicates = 2). (B) Electrophoresis gel image (inverted colors) showing splicing of sxl transcripts in third instar larvae of females and males of genotypes listed in the key (a–g) with a representative schematic at the top of the gel image. (C) IGV browser image showing CLAMP ChIP-seq peaks (rectangular boxes in light blue) at the genomic locus for the sxl gene in male and female 3 hr embryos. For each sample, the narrow peak file is shown which is generated after peak calling. Arrow in C indicates region of sxl gene where CLAMP differentially bind in females and not in males. (D) Western blot showing the level of Sxl protein in genotypes (three replicates for each) mentioned below each lane. Tubulin levels were used as a protein loading control. Below the blot is the relative quantification of Sxl protein levels compared with Tubulin and each genotype is represented by separately colored bars. (E) Western blot for CLAMP in cytoplasmic and nuclear protein fractions from Kc (female) and S2 (male) cells after IP (immunoprecipitation) using mouse anti-FMRP. IgG-mouse was used as negative control (lanes 4, 5 and lanes 11 and 12).
-
Figure 5—source data 1
Source data for Figure 5A, sxl and gapdh transcript levels.
- https://cdn.elifesciences.org/articles/87865/elife-87865-fig5-data1-v2.zip
-
Figure 5—source data 2
Source data for Figure 5B, sxl transcript level.
- https://cdn.elifesciences.org/articles/87865/elife-87865-fig5-data2-v2.zip
-
Figure 5—source data 3
Source data for Figure 5D, Sxl protein level.
- https://cdn.elifesciences.org/articles/87865/elife-87865-fig5-data3-v2.zip
-
Figure 5—source data 4
Source data for Figure 5D, Tubulin protein level.
- https://cdn.elifesciences.org/articles/87865/elife-87865-fig5-data4-v2.zip
-
Figure 5—source data 5
Source data for Figure 5E, western blot for detecting CLAMP (chromatin-linked adapter for MSL proteins) in IP-FMRP samples in cytoplasmic cellular fractions (lanes 1–7).
- https://cdn.elifesciences.org/articles/87865/elife-87865-fig5-data5-v2.zip
-
Figure 5—source data 6
Source data for Figure 5E, western blot for detecting CLAMP (chromatin-linked adapter for MSL proteins) in IP-FMRP samples in cytoplasmic cellular fractions (lanes 8–14).
- https://cdn.elifesciences.org/articles/87865/elife-87865-fig5-data6-v2.zip
Figure 6
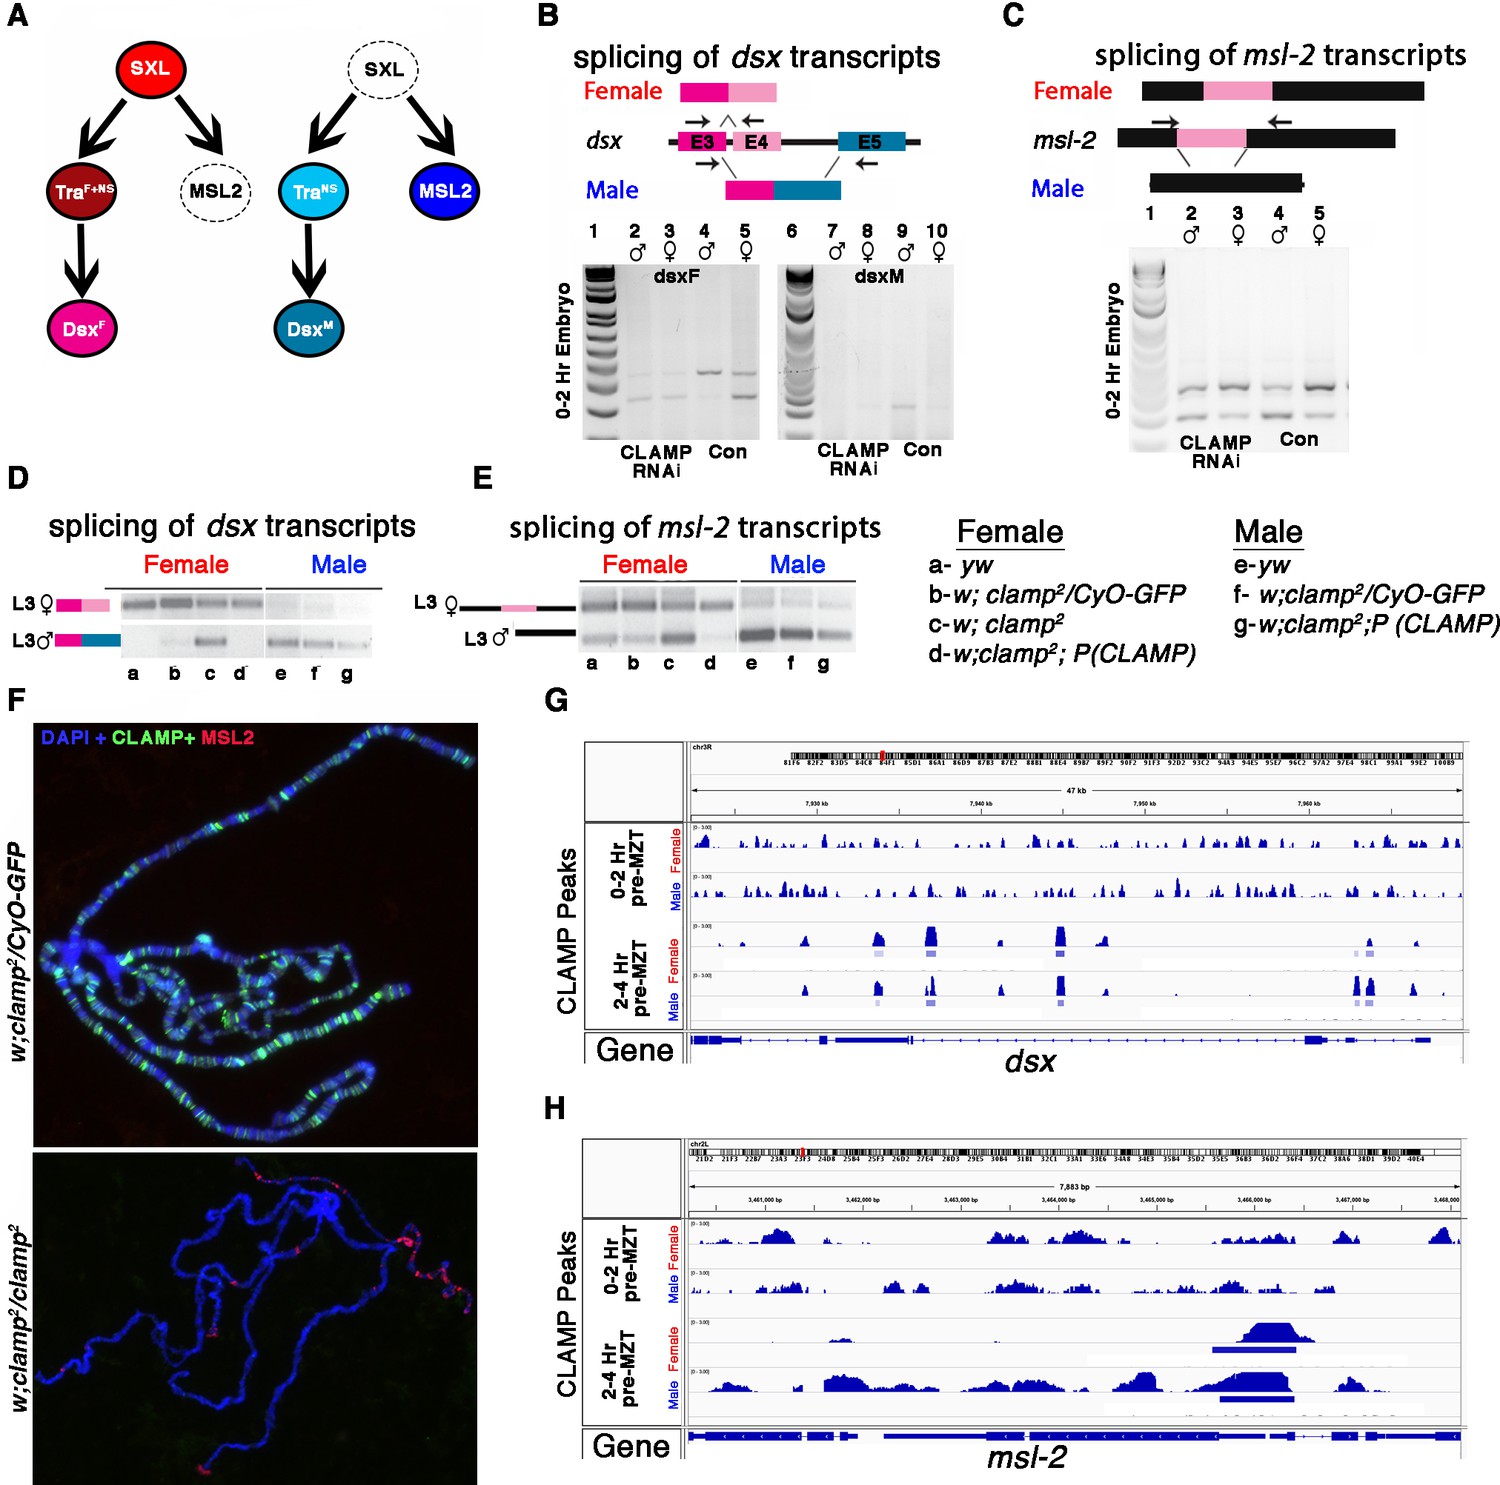
CLAMP (chromatin-linked adapter for MSL proteins)-dependent alternative splicing of components of the sex determination pathway.
(A) The sex determination pathway in Drosophila is regulated by master regulator sex lethal (SXL). (B–C) RT-PCR electrophoresis gel images from 0 to 2 hr embryonic RNA samples (lanes 2–5 and 7–10) showing splicing of dsx (B) and msl2 (C) transcripts in females (lanes 3, 5, 8, 10) and males (lanes 2, 4, 7, 9). Embryos were laid by MTD-GAL4>GFP RNAi control (lanes 4, 5, 9, 10) and MTD-GAL4>CLAMP RNAi (lanes 2, 3, 7, 8) females. The schematic above each gel image shows the female and male splice variants of the dsx (B) and msl2 (C) transcripts. (D) IGV browser screen shot showing CLAMP peaks (rectangular boxes in light blue) at the genomic locus for the dsx genes in male and female 0–2 hr/pre-MZT (maternal to zygotic transition) and 2–4 hr/ post-MZT embryos. The bigwig file (upper track) and the corresponding narrow peak file (lower track) are both shown. (E–F) Electrophoresis gel image from third instar larval samples (a–g) showing splicing of dsx (E) and msl2 (F) transcripts in females (lanes a–d) and males (lanes e–g). a–g genotypes are the same as in panel (A). The schematics at the top of each gel image show female and male splice variants of dsx (E) and msl2 (F) transcripts. (G) Fluorescent microscopy images of polytene chromosomes from the third instar salivary gland in the genotypes listed to the left of each panel (heterozygous control and clamp2 null) show the distribution of CLAMP (green) and MSL2 (red) on chromatin (blue, DAPI). (H) IGV browser screen shot showing CLAMP peaks (rectangular boxes in light blue) at the genomic locus for the msl-2 in male and female 0–2 hr/pre-MZT and 2–4 hr/post-MZT embryos. The bigwig file (upper track) and the corresponding narrow peak file (lower track) are both shown.
-
Figure 6—source data 1
Source data for Figure 6B, dsx transcript level (lanes 1–5).
- https://cdn.elifesciences.org/articles/87865/elife-87865-fig6-data1-v2.zip
-
Figure 6—source data 2
Source data for Figure 6B, dsx transcript level (lanes 6–10).
- https://cdn.elifesciences.org/articles/87865/elife-87865-fig6-data2-v2.zip
-
Figure 6—source data 3
Source data for Figure 6C, msl-2 transcript level (lanes 1–5).
- https://cdn.elifesciences.org/articles/87865/elife-87865-fig6-data3-v2.zip
-
Figure 6—source data 4
Source data for Figure 6D, dsx transcript level in L3 female (lanes a–g, top row).
- https://cdn.elifesciences.org/articles/87865/elife-87865-fig6-data4-v2.zip
-
Figure 6—source data 5
Source data for Figure 6D, dsx transcript level in L3 male (lanes a–g, bottom row).
- https://cdn.elifesciences.org/articles/87865/elife-87865-fig6-data5-v2.zip
-
Figure 6—source data 6
Source data for Figure 6E, msl-2 transcript level (lanes a–g).
- https://cdn.elifesciences.org/articles/87865/elife-87865-fig6-data6-v2.zip
Author response image 1

Maternal CLAMP regulates sex-specific alternative splicing during early embryonic development.
Gene Ontology (GO) results for genes showing CLAMP-dependent female sex-specific splicing in embryos at the 0-2 Hr pre-MZT stage and for genes exhibiting CLAMP-dependent female and male sex-specific splicing in embryos at the 2-4 Hr post-MZT stage. The size of the circle increases as the number of genes in that category increases. The color of the circle represents significance (p-value). GO categories for male embryos at the 0-2 Hr pre-MZT stage are not shown because the gene set is small, and no enriched GO categories were identified.
Tables
Key resources table
| Reagent type (species) or resource | Designation | Source or reference | Identifiers | Additional information |
|---|---|---|---|---|
| Genetic reagent (D. melanogaster) | MTD-Gal4 | Bloomington Drosophila Stock Center | BDSC:31777; FLYB:FBtp0001612; RRID:BDSC_31777 | FlyBase symbol: P{GAL4-nos.NGT} |
| Genetic reagent (D. melanogaster) | UAS-CLAMPRNAi[val22] | Bloomington Drosophila Stock Center | BDSC: #57008; | |
| Genetic reagent (D. melanogaster) | B[s]/Dp(2:y)CB25–4, y+, Rsp[s]B[s]; SPSD/CyO | Bloomington Drosophila Stock Center | BDSC: #64332; | |
| Genetic reagent (D. melanogaster) | +; SD72/CyO | Cynthia Staber, Stowers Institute | ||
| Genetic reagent (D. melanogaster) | 19–3, yw, Rsp[s]- | Cynthia Staber, Stowers Institute | ||
| Genetic reagent (D. melanogaster) | y1, w 1118; clamp2 /CyO | Urban et al., 2017a | ||
| Cell line (D. melanogaster) | S2 | Drosophila Genomic Resource Center (DGRC) | FBtc0000181 | Cell line maintained in N. Perrimon lab; FlyBase symbol: S2-DRSC |
| Cell line (D. melanogaster) | Kc167 | Drosophila Genomic Resource Center (DGRC) | FBtc0000001 | |
| Antibody | Anti-CLAMP (Rabbit polyclonal) | Erica Larschan | RRID: AB_2195548 | IF (1:1000), WB (1:1000) |
| Antibody | Anti-Tubulin (Rabbit monoclonal) | Abcam | Cat# ab52866, RRID: AB_869989 | WB (1:5000) |
| Antibody | Anti-SXL (Mouse monoclonal) | Fatima Gebauer | WB (1:500) | |
| Antibody | Anti-MSL2 (Rat monoclonal) | Peter Becker | IF (1:500) | |
| Antibody | Anti-FMRP (Mouse monoclonal) | DSHB | 5B6 RRID:AB_528253 | IP-1:10 |
| Others | Anti-mouse IgG M-280 Dynabeads | Invitrogen, USA | Catalog number: 11202D | Magnetic Beads for IP |
| Others | Cell line RNA-seq | NCBI, GEO (This paper) | #GSE220439 | RNA sequencing data |
| Others | Third instar larvae (L3) RNA-seq | NCBI, GEO (This paper) | #GSE220455 | RNA sequencing data |
| Software, algorithms | SUPPA | Trincado et al., 2018 | ||
| Software, algorithms | time2splice | This paper | https://github.com/ashleymaeconard/time2splice | |
| Software, algorithms | deeptools | Ramírez et al., 2014 | http://deeptools.ie-freiburg.mpg.de |
Additional files
-
Supplementary file 1
List of sex-specific splicing events in early Drosophila embryos.
(a–h) List of CLAMP (chromatin linked adapter for MSL proteins)-dependent sex-specific splicing events in 0–2 hr pre-MZT (maternal to zygotic transition) embryo (a–d) and 2–4 post-MZT hr embryo (e–h).
- https://cdn.elifesciences.org/articles/87865/elife-87865-supp1-v2.xlsx
-
Supplementary file 2
Summarizing the results and functions of the validated target genes at which splicing requires CLAMP (chromatin linked adapter for MSL proteins).
- https://cdn.elifesciences.org/articles/87865/elife-87865-supp2-v2.docx
-
Supplementary file 3
List of sex-specific splicing events in third instar Larvae (L3).
(a–c) List of all and sex-specific splicing events in Drosophila third instar larvae (L3) that require CLAMP (chromatin linked adapter for MSL proteins) (a), list of genes whose splicing in females (b) and males (c) is affected by loss of CLAMP.
- https://cdn.elifesciences.org/articles/87865/elife-87865-supp3-v2.xlsx
-
Supplementary file 4
List of splicing events in S2 and Kc Drosophila embryonic cell lines.
(a–d) List of differential splicing events between Kc (female) and S2 (male) cell lines (a), all CLAMP (chromatin linked adapter for MSL proteins)-dependent splicing events in Drosophila sexed embryonic cell lines (b), female- (c) and male- (d) specific splicing events in Drosophila sexed embryonic cell lines affected by loss of CLAMP.
- https://cdn.elifesciences.org/articles/87865/elife-87865-supp4-v2.xlsx
-
Supplementary file 5
List of CLAMP dependent differentially expressed genes in third instar larvae (L3).
(a–b) List of all CLAMP (chromatin linked adapter for MSL proteins)-dependent differentially expressed genes in Drosophila male (a) and female (b) third instar larvae (L3).
- https://cdn.elifesciences.org/articles/87865/elife-87865-supp5-v2.xlsx
-
Supplementary file 6
CLAMP DNA binding data listing sex-specifically regulated genes bound by CLAMP.
(a–c) List of CLAMP (chromatin linked adapter for MSL proteins)-dependent spliced genes which are directly bound by CLAMP (a), list of sex-specifically spliced genes (b) and sex-biasedly expressed genes (c) in 0–2 and 2–4 hr male and female pre-MZT (maternal to zygotic transition) and post-MZT embryos, respectively.
- https://cdn.elifesciences.org/articles/87865/elife-87865-supp6-v2.xlsx
-
Supplementary file 7
List of Sxl targets which require CLAMP for sex-specific splicing.
(a–b) List of CLAMP (chromatin linked adapter for MSL proteins)-dependent male and female specifically spliced genes which are direct SXL targets (a). List of primers used to validate splicing events requiring CLAMP in Figure 2—figure supplement 3 (b).
- https://cdn.elifesciences.org/articles/87865/elife-87865-supp7-v2.xlsx
-
MDAR checklist
- https://cdn.elifesciences.org/articles/87865/elife-87865-mdarchecklist1-v2.docx
Download links
A two-part list of links to download the article, or parts of the article, in various formats.
Downloads (link to download the article as PDF)
Open citations (links to open the citations from this article in various online reference manager services)
Cite this article (links to download the citations from this article in formats compatible with various reference manager tools)
Sex-specific splicing occurs genome-wide during early Drosophila embryogenesis
eLife 12:e87865.
https://doi.org/10.7554/eLife.87865


