How microscopic epistasis and clonal interference shape the fitness trajectory in a spin glass model of microbial long-term evolution
- Courant Institute of Mathematical Sciences, New York University, United States
- Janelia Research Campus, United States
- Department of Mathematics, University of Wisconsin–Madison, United States
- Mathematics Group, Lawrence Berkeley National Laboratory, United States
- Weizmann Institute of Science, Israel
- John A. Paulson School of Engineering and Applied Sciences, Harvard University, United States
Figures
Figure 1
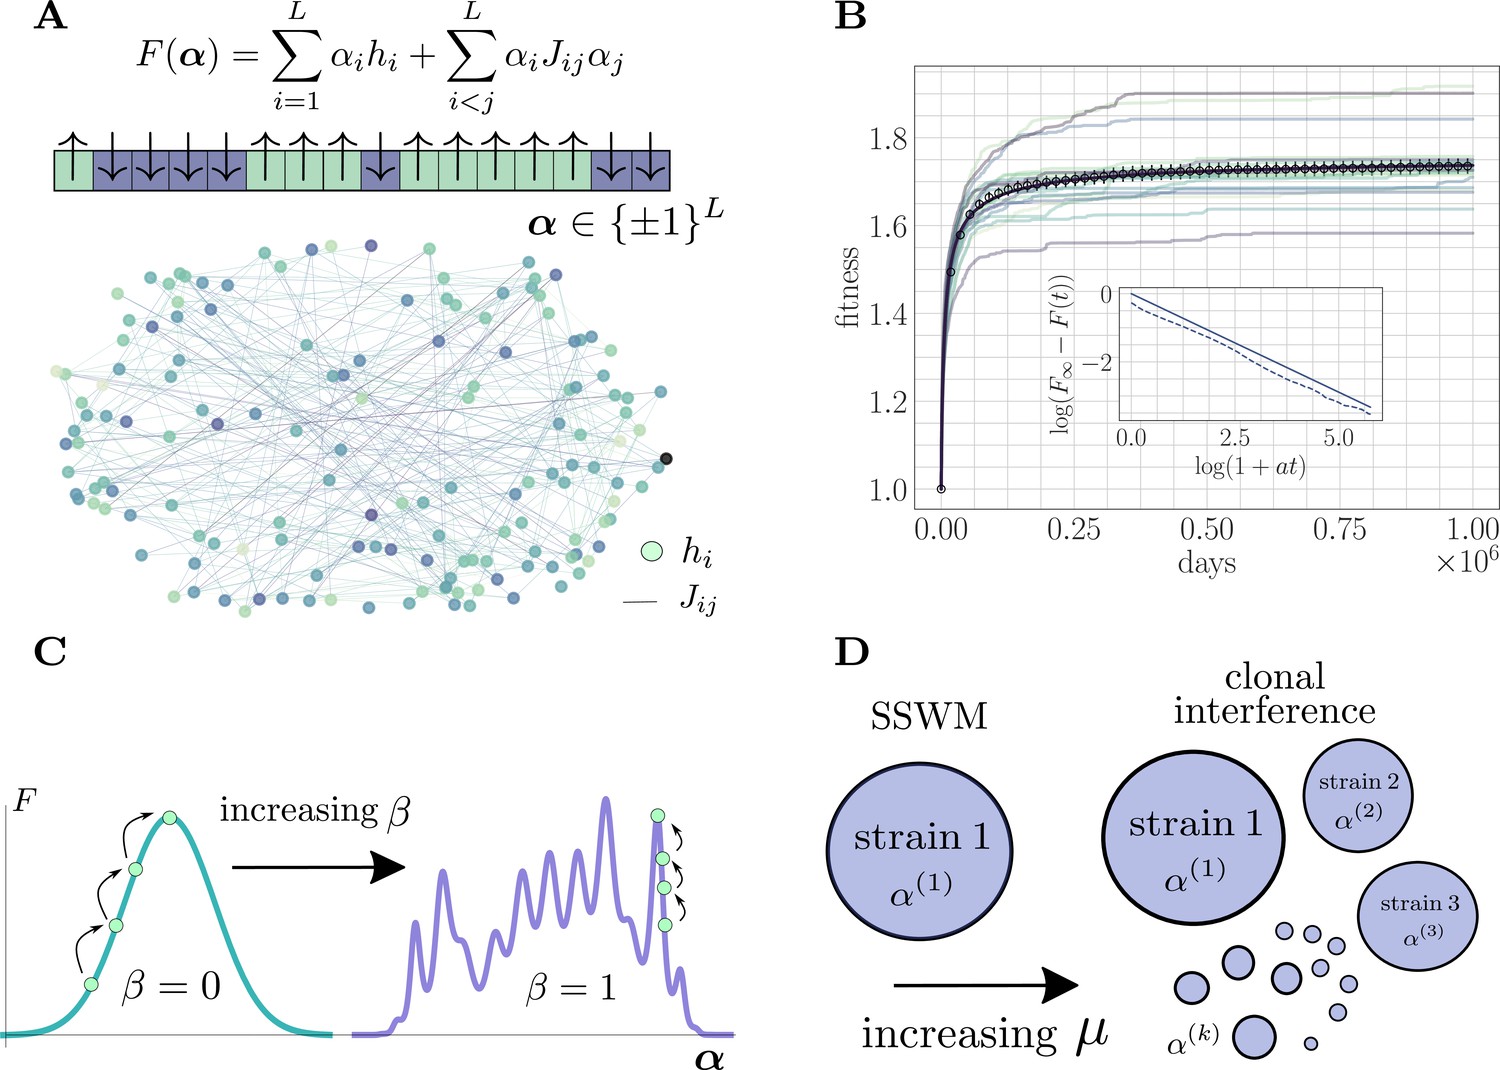
The microscopic epistasis model.
(A) The fitness of a given strain is defined by its genotype . Each gene contributes independent of the background genotype and an epistatic contribution due to its interaction with all other genes. The and values are drawn randomly, and the relative magnitudes of the two contributions can be tuned by adjusting a parameter . Each gene interacts, on average, with a fraction of other genes. The fitness landscape is thus described by a disordered network, here shown for and , with color indicating magnitude and connectivity demonstrating the sparsity pattern of the . (B) A typical hill-climbing trajectory with both clonal interference () and microscopic epistasis (). Replicate trajectories are displayed in low opacity, while the mean over all replicates is shown in open circles with error bars depicting the standard error of the mean. The mean fitness is consistent with a power-law relaxation with exponent (solid). The inset displays the trajectory (dashed) and the best-fit power law (solid, shifted for visual clarity) on a log-log scale. (C) As β is increased, the epistatic contribution becomes more significant, and the landscape smoothly becomes more rugged. (D) As the mutation rate increases, the magnitude of clonal interference can be smoothly tuned.
Figure 2
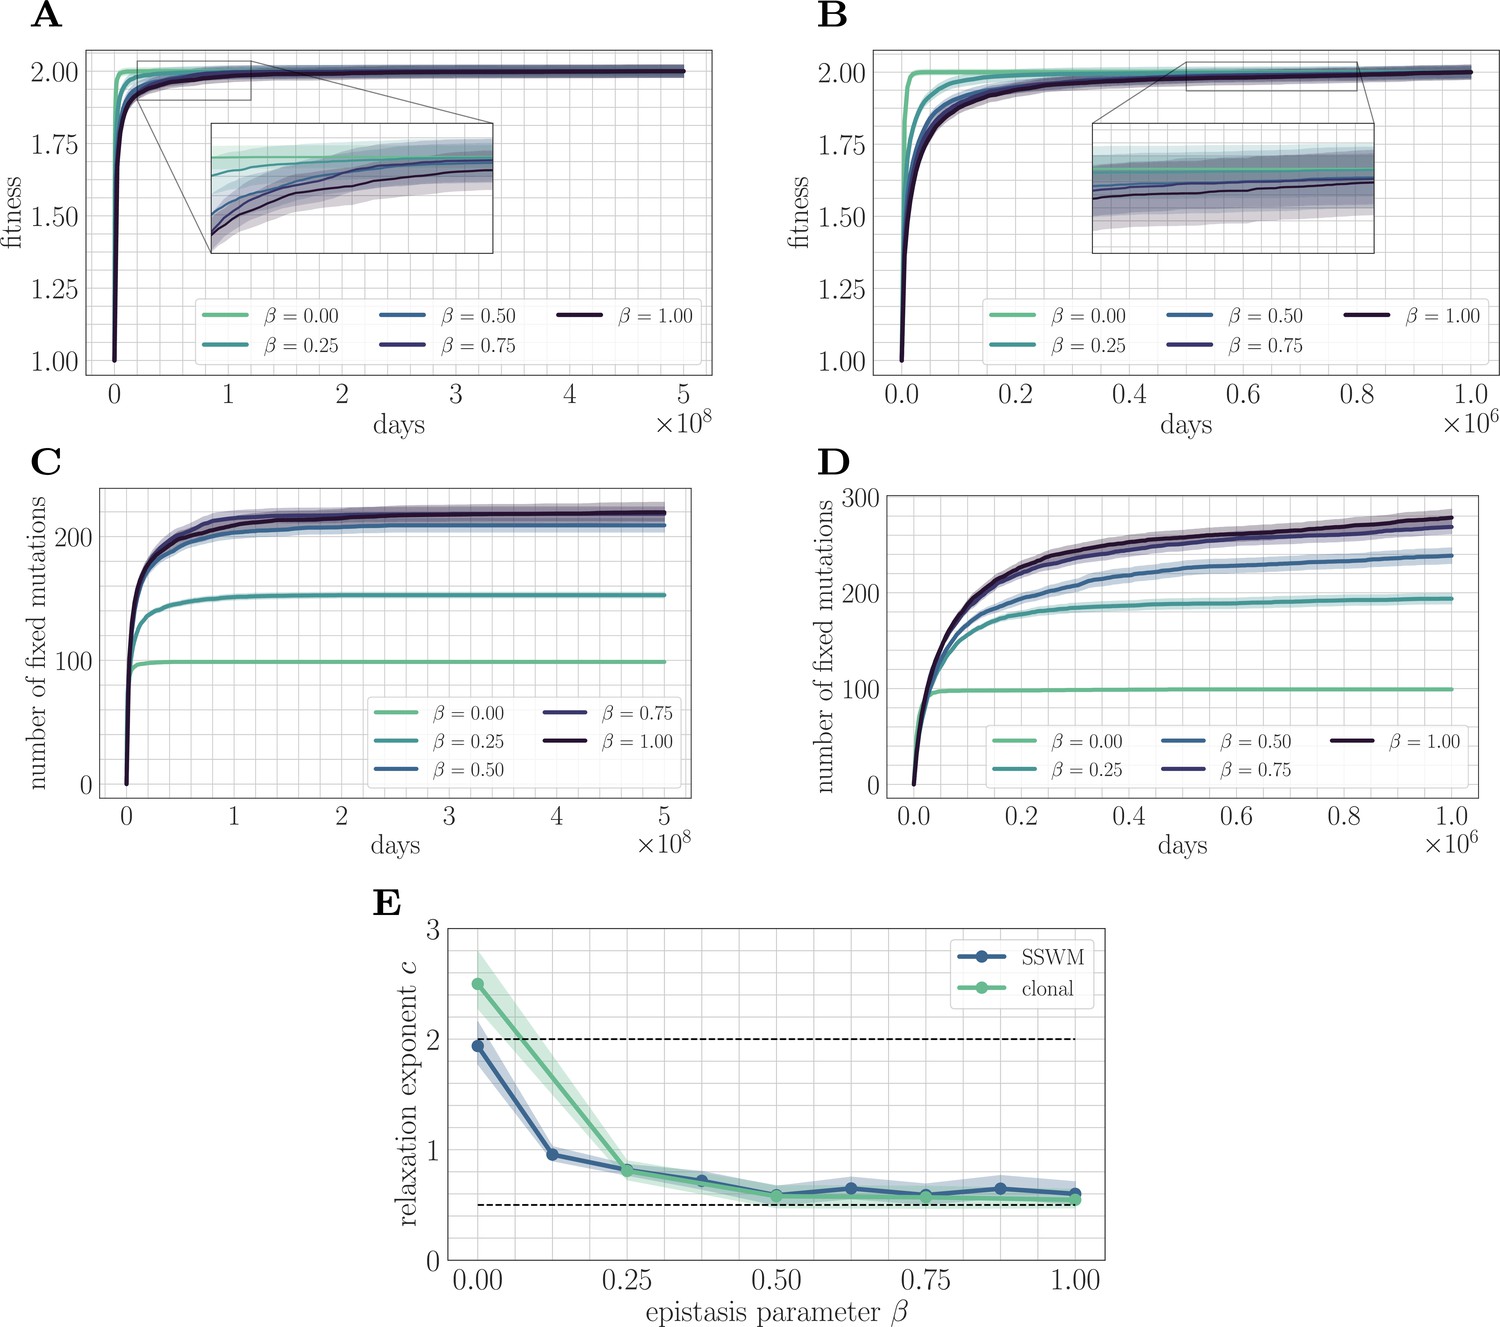
Increasing landscape ruggedness slows the fitness trajectory.
Left: SSWM. Right: Clonal interference. Error bars for the first four panes (shown as shaded regions, for this and other figures) indicate standard error of the mean over replicates. (A) Normalized fitness trajectories as a function of in the SSWM limit (). Higher values of β exhibit a slower approach towards the fitness peak. (B) Normalized fitness trajectories in the clonal interference regime (). (C) Substitution trajectories in the SSWM limit (). Higher values of β lead to a greater number of fixed mutations. (D) Substitution trajectories in the clonal interference regime (). (E) Fitness relaxation exponents as a function of in the SSWM limit and clonal interference regimes. As increases, the fitness relaxation slows. Dashed lines indicate analytically computable exponents for and for in the SSWM regime. Error bars indicate 95% quantiles computed from the bootstrap distribution (for details, see 'Further simulation details').
Figure 3
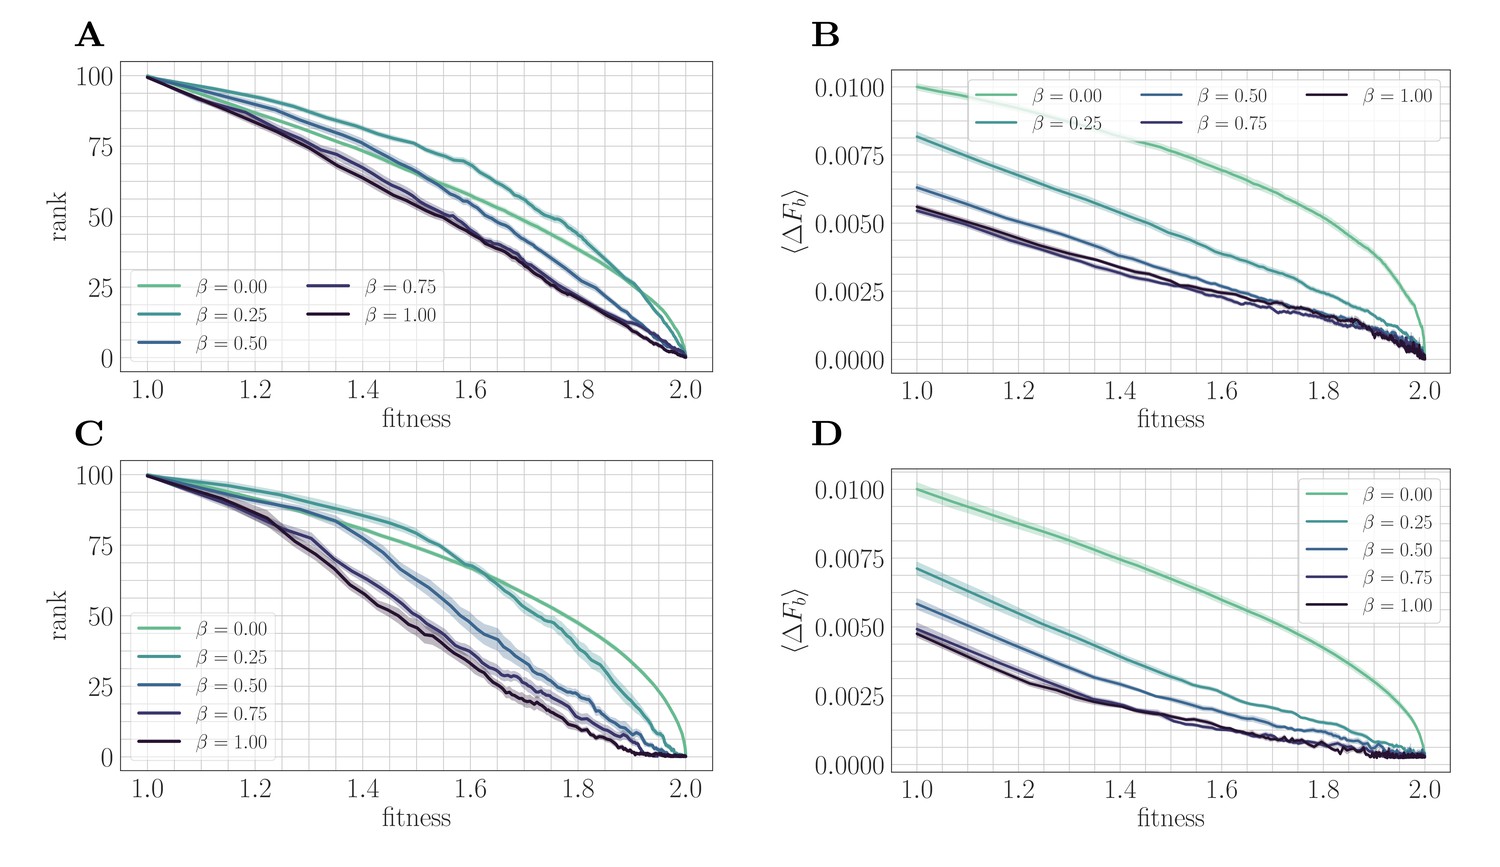
A mapping to a fitness-parameterized landscape as a function of .
Top: SSWM. Bottom: Clonal interference. Error bars in the first four panes indicate standard error of the mean over replicates. (A) Rank as a function of fitness in the SSWM regime. The functional form of changes significantly as β varies, progressing from a concave decreasing function for towards a linear form for . For all , the rank decreases monotonically with . (B) Expected normalized beneficial fitness increment as a function of normalized fitness in the SSWM regime. Global epistasis emerges naturally in our model, leading to a linear decrease in with for all nonzero values of β. For all values of β, the increment decreases monotonically with β. (C/D) Rank/expected increment as a function of fitness with clonal interference; similar observations hold as for SSWM.
Figure 4
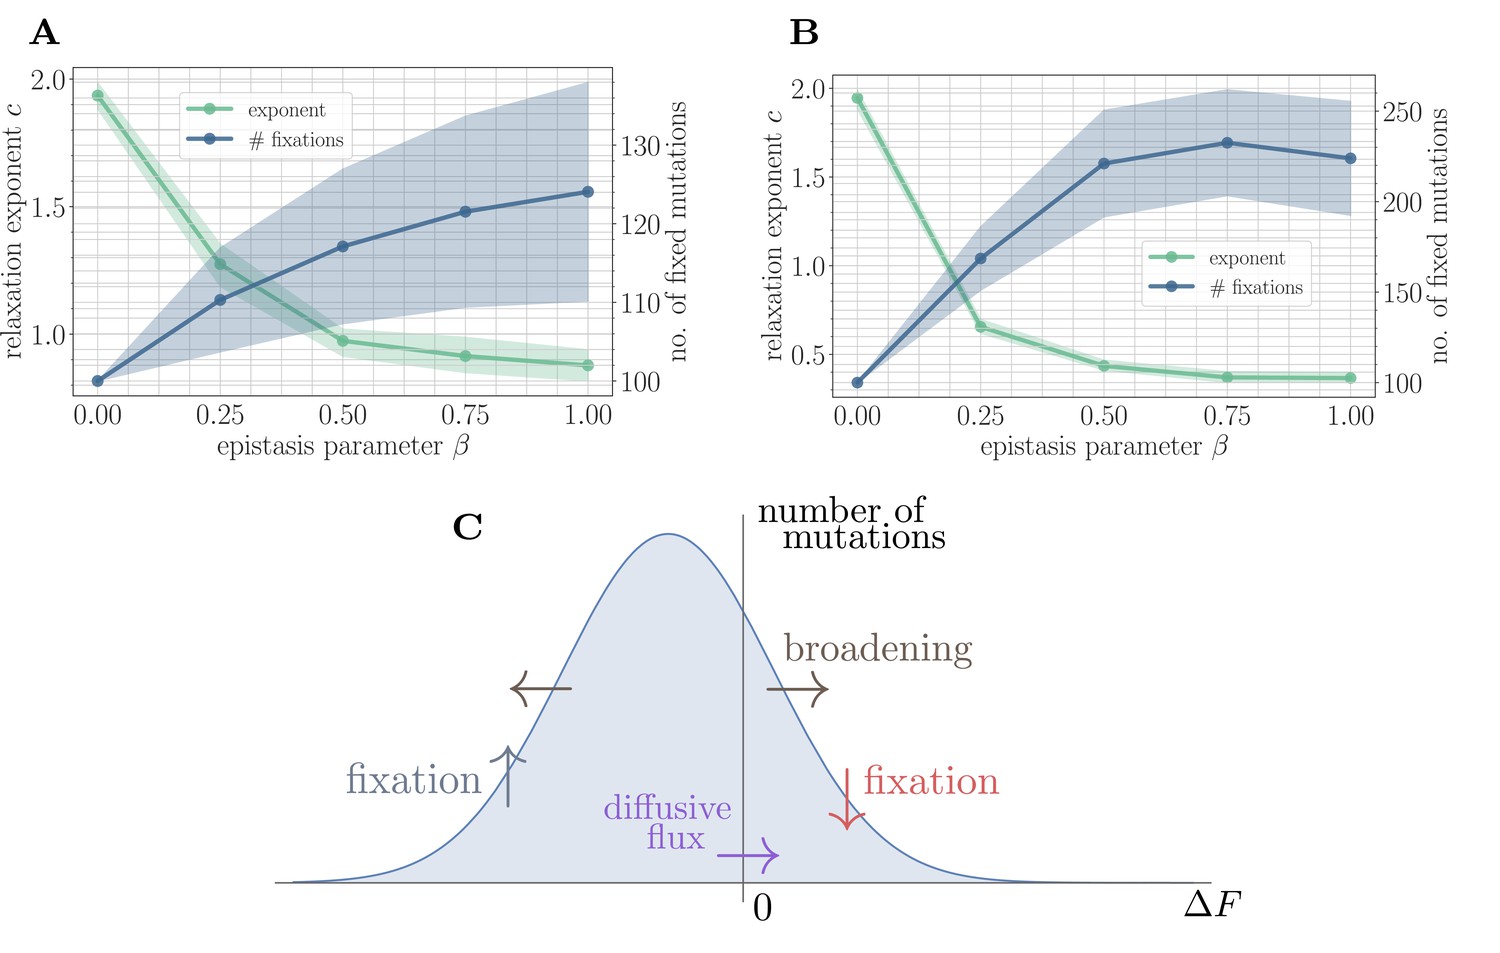
A simple random walk model captures the generation of beneficial mutations and a decreasing exponent with increasing microscopic epistasis.
(A) Fitness relaxation exponent and number of fixed mutations to reach a local fitness maximum (zero rank) as a function of β, computed within a random walk model (which neglects correlations). The model predicts a monotonically decreasing exponent and a monotonically increasing number of fixations as a function of β. Error bars around exponents indicate 95% quantiles from the bootstrap distribution (100 samples) while central line depicts the median. Error bars around the number of fixations indicate the standard deviation over 200 replicates and central line the mean. (B) Analogous figure to (A), but within the SSWM approximation using a coarse-grained Gillespie simulation framework (where correlations develop over time). The behavior is qualitatively similar to the random walk model, though the exponent decreases further and the number of fixation events is larger. (C) Illustration of the diffusive generation of mutations. As beneficial mutations fix, the beneficial half of the distribution of fitness increments is depleted and transported to the deleterious half. Each fixation event causes the distribution to broaden due to the epistatic interaction, which combines with a buildup of deleterious mutations to create a diffusive flux from the deleterious half to the beneficial half of the distribution.
Figure 5
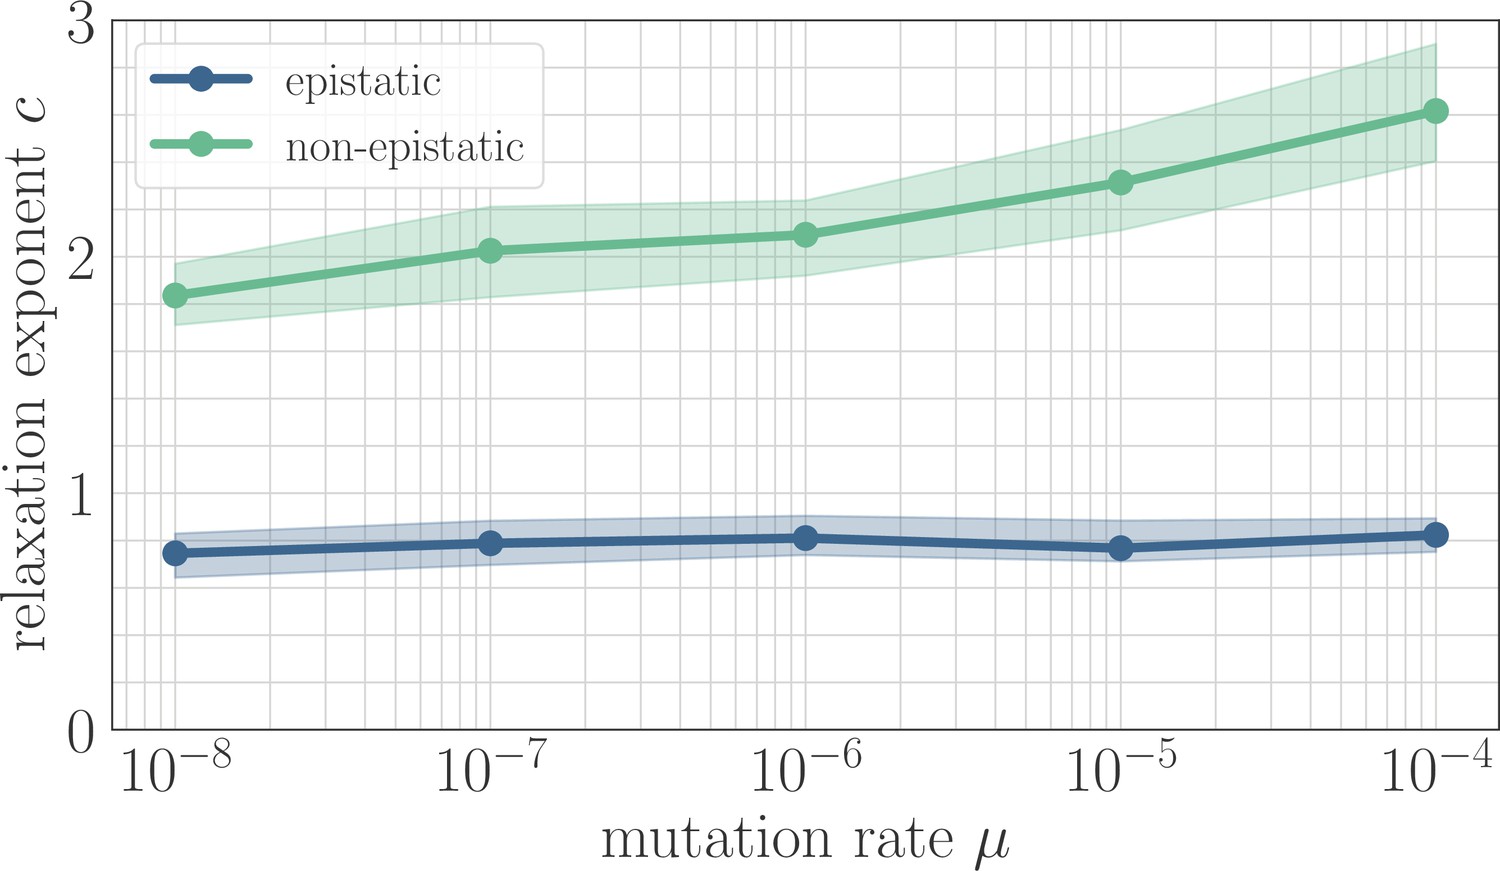
The effect of clonal interference on the fitness trajectory depends on the strength of microscopic epistasis.
Results of fitting the power law in Equation 2 as a function of µ. The relaxation exponent increases monotonically with µ for the non-epistatic model , while the exponent remains essentially constant in the epistatic model .
Figure 6
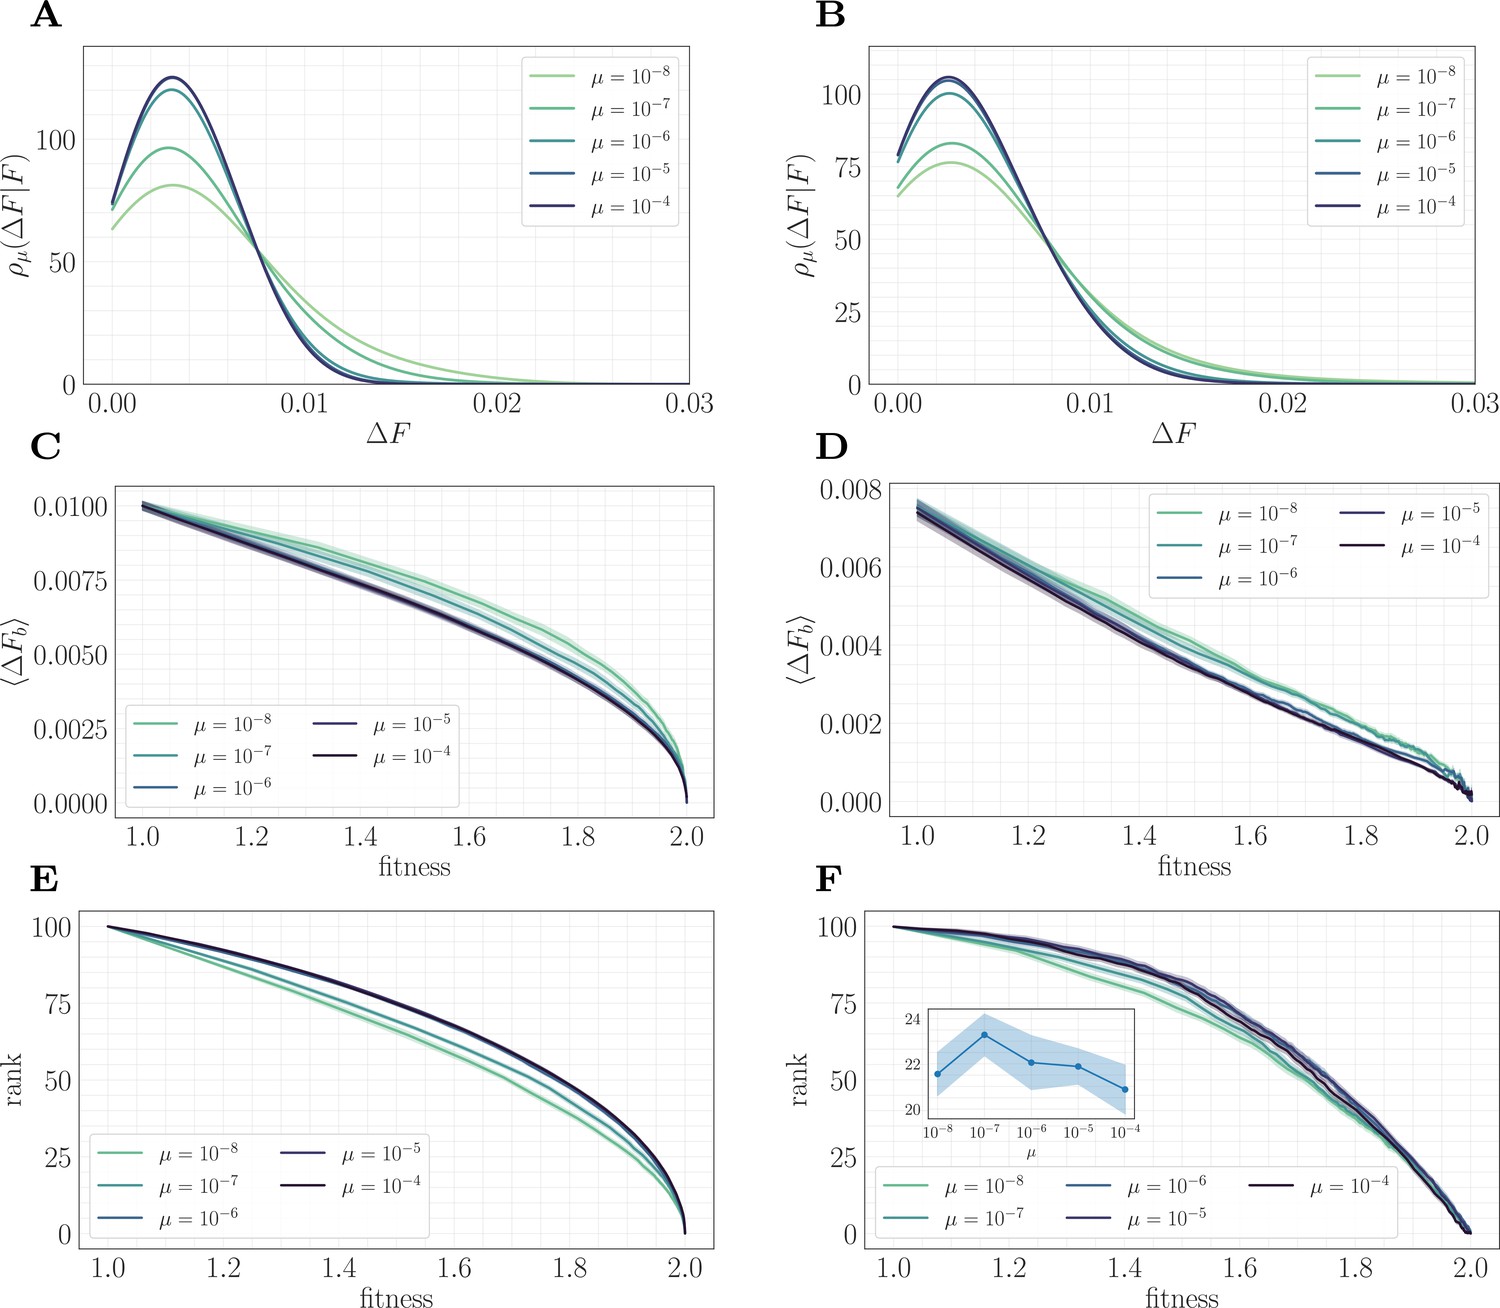
A mapping to a fitness-parameterized landscape as a function of µ.
Left: non-epistatic (). Right: epistatic (). (A/B) Unlike in classical fitness-parameterized models, the level of clonal interference cannot be tuned independently from the landscape. Because clonal interference modifies fixation probabilities, the conditional distribution of fitness effects depends on µ both with and without epistasis (epistatic: ; non-epistatic: . Distributions were approximated via kernel density estimation with a bandwidth parameter ). (C/D) Expected beneficial increment as a function of fitness. Both with and without epistasis, the expected increment tends to decrease with increasing µ at fixed fitness, capturing the fact that higher µ favors the fixation of mutations with higher effect. (E/F) Average rank as a function of fitness. Without epistasis, the rank increases with increasing µ at fixed fitness. With epistasis, the rank curves behave non-monotonically in µ at fixed fitness, and become comparable at high fitness. Inset in (F) shows rank as a function of µ for fixed , highlighting the non-monotonic behavior.
Appendix 1—figure 1
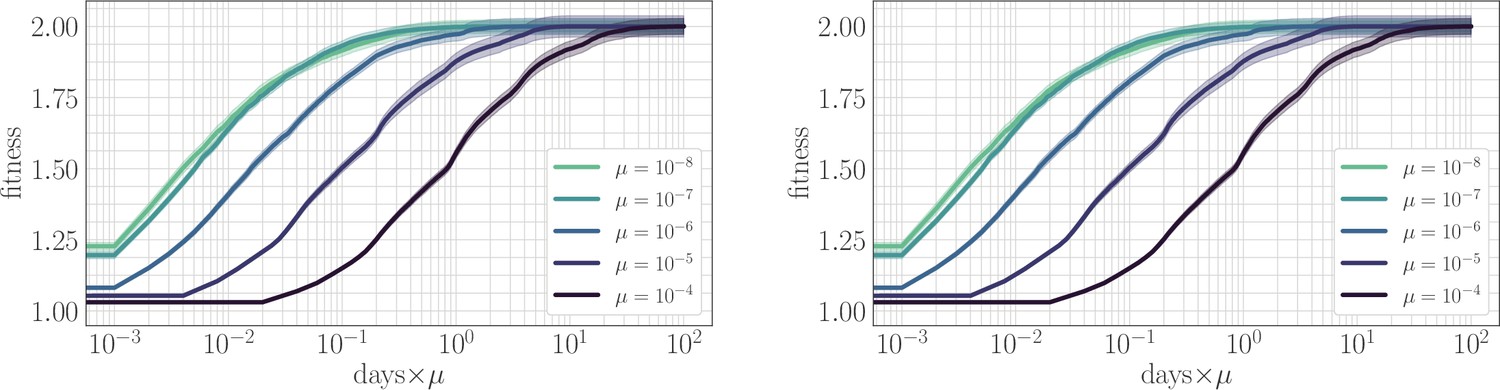
The effect of clonal interference on the fitness trajectory: re-scaling by µ.
Left: epistatic. Right: non-epistatic. When measuring time in units of the mutation rate, clonal interference slows the fitness trajectory due to a suppresion of fixation probabilities. All trajectories are initialized at one, consistent with previous result: logarithmic time axis hides the very early time dynamics.
Appendix 1—figure 2
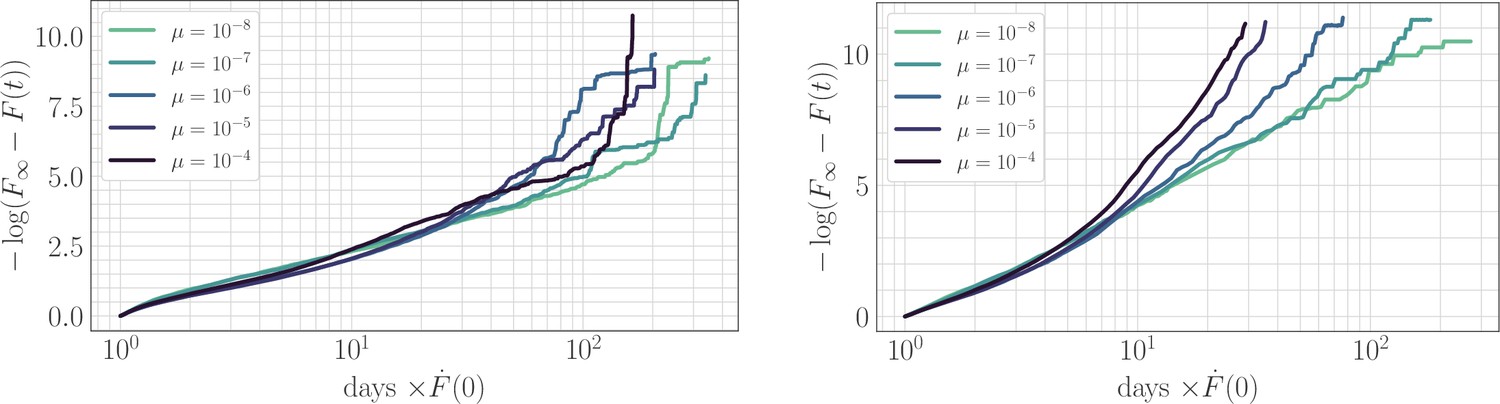
The effect of clonal interference on the fitness trajectory: rescaling by .
Left: epistatic. Right: non-epistatic. Geometrically, rescaling time by the initial rate of fitness increase ensures that slower trajectories reach the fitness peak at a later time, in qualitative agreement with the results of power-law fitting. Assuming a power law functional form as in the main text, at long times becomes linear with slope given by the exponent . The asymptotic slope increases with µ without microscopic epistasis (left, ), but does not clearly depend on the mutation rate with microscopic epistasis (right, ).
Appendix 1—figure 3
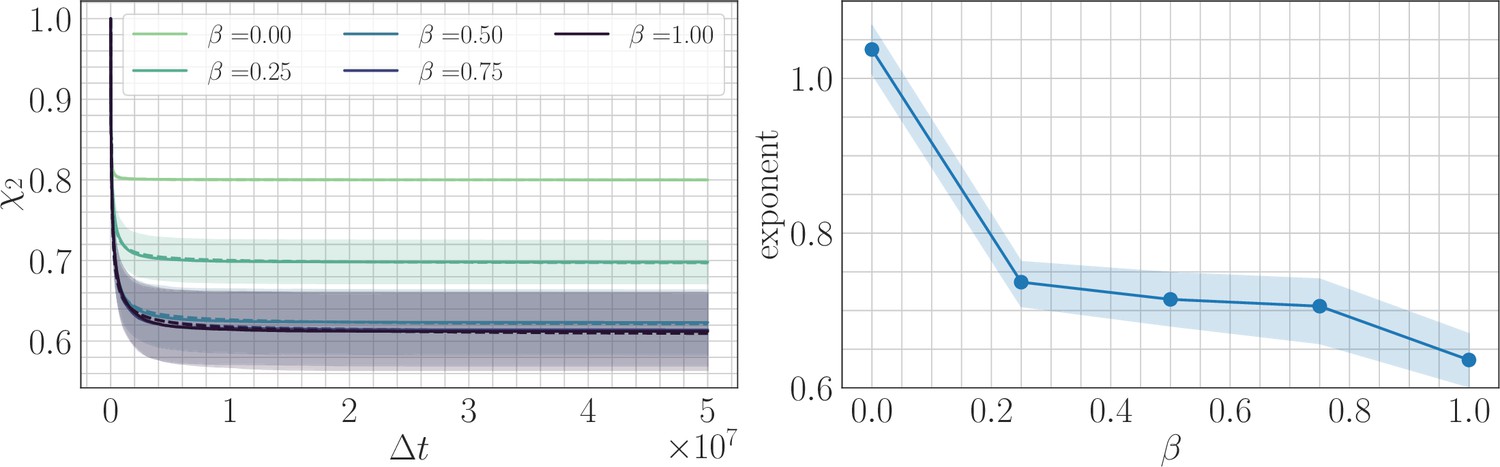
Two point correlation function.
(Left) trajectories as a function of β and the lag time in the SSWM limit. Solid lines show the mean over 200 independent trajectories and errorbars show ± one standard deviation. Dashed line shows best fit to the power law . (Right) Relaxation exponents for as a function of β. Similar to the fitness trajectory, the exponent decreases with increasing β. Solid point shows median of the bootstrap distribution computed over 250 estimates; errorbars show 95% confidence intervals.
Appendix 1—figure 4
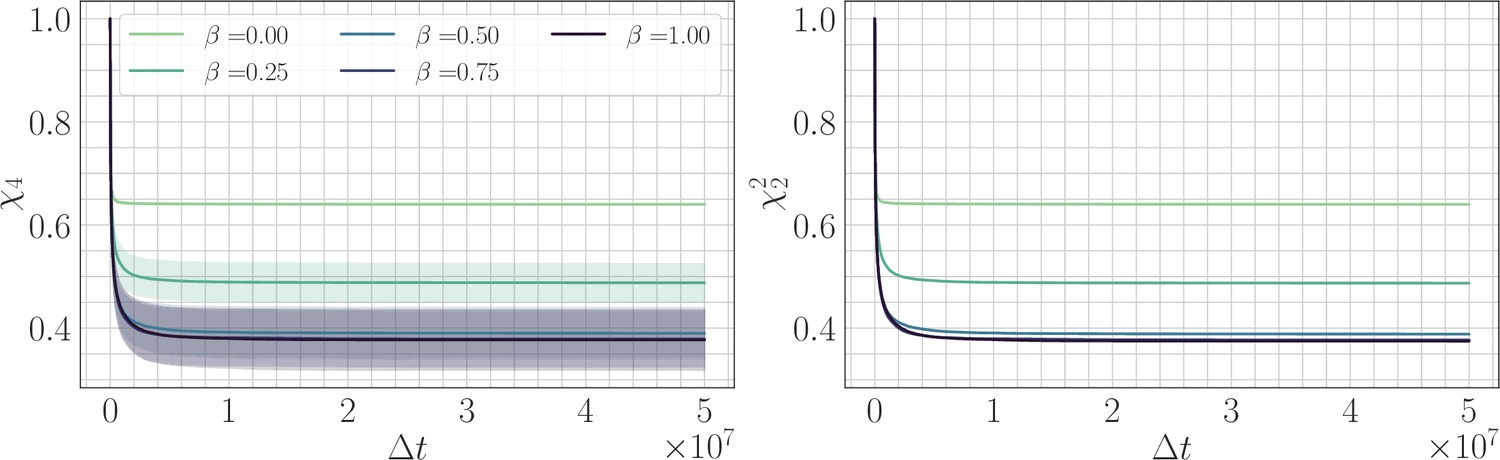
Four-point correlation function.
(Left) trajectories as a function of β and the lag time in the SSWM limit. Solid lines show the mean over 200 independent trajectories and errorbars show ± one standard deviation. (Right) trajectories as a function of β. Because the genomic average of is approximately equal to an average over trajectories, we find that . Visually, the mean trajectories are nearly indistinguishable.
Additional files
Download links
A two-part list of links to download the article, or parts of the article, in various formats.
Downloads (link to download the article as PDF)
Open citations (links to open the citations from this article in various online reference manager services)
Cite this article (links to download the citations from this article in formats compatible with various reference manager tools)
How microscopic epistasis and clonal interference shape the fitness trajectory in a spin glass model of microbial long-term evolution
eLife 12:RP87895.
https://doi.org/10.7554/eLife.87895.3


