Binding to nucleosome poises human SIRT6 for histone H3 deacetylation
- Department of Integrated Structural Biology, IGBMC, Institut de Génétique et de Biologie Moléculaire et Cellulaire (IGBMC), France
- Université de Strasbourg, IGBMC UMR 7104-UMR-S 1258, France
- CNRS, UMR 7104, France
- Inserm, UMR-S 1258, France
- Université de Lorraine and CNRS, UMR 7019 LPCT, France
Figures
Figure 1 with 5 supplements
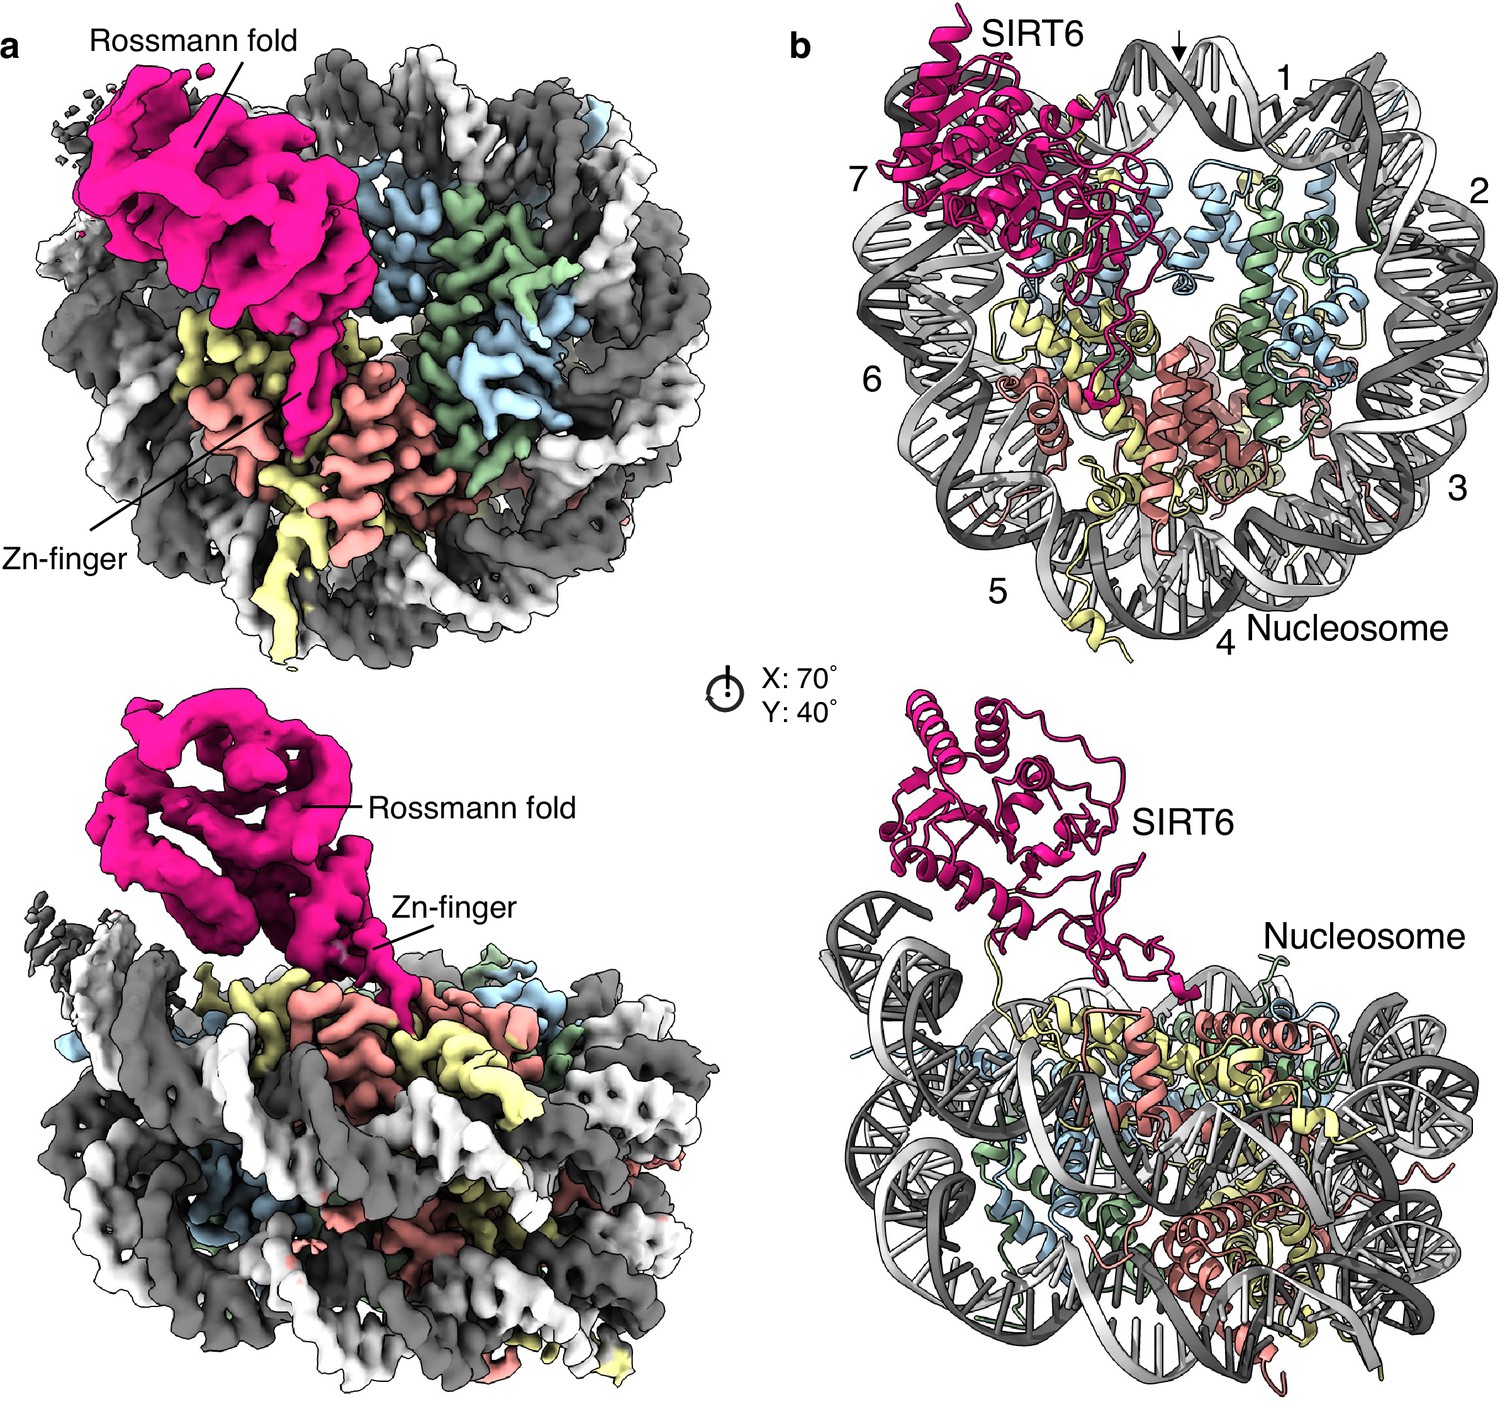
Structure of human SIRT6 in complex with the nucleosome.
(a) Front (top) and side (bottom) views of a composite cryo-EM reconstruction of human SIRT6-nucleosome. Maps from focused refinements of SIRT6 (magenta – Rossmann fold and Zn-finger domains labelled) and the nucleosome (H2A – yellow; H2B – orange; H3 – blue; H4 – green; DNA – light and dim grey). (b) Corresponding views of the atomic model of the complex.
Figure 1—figure supplement 1
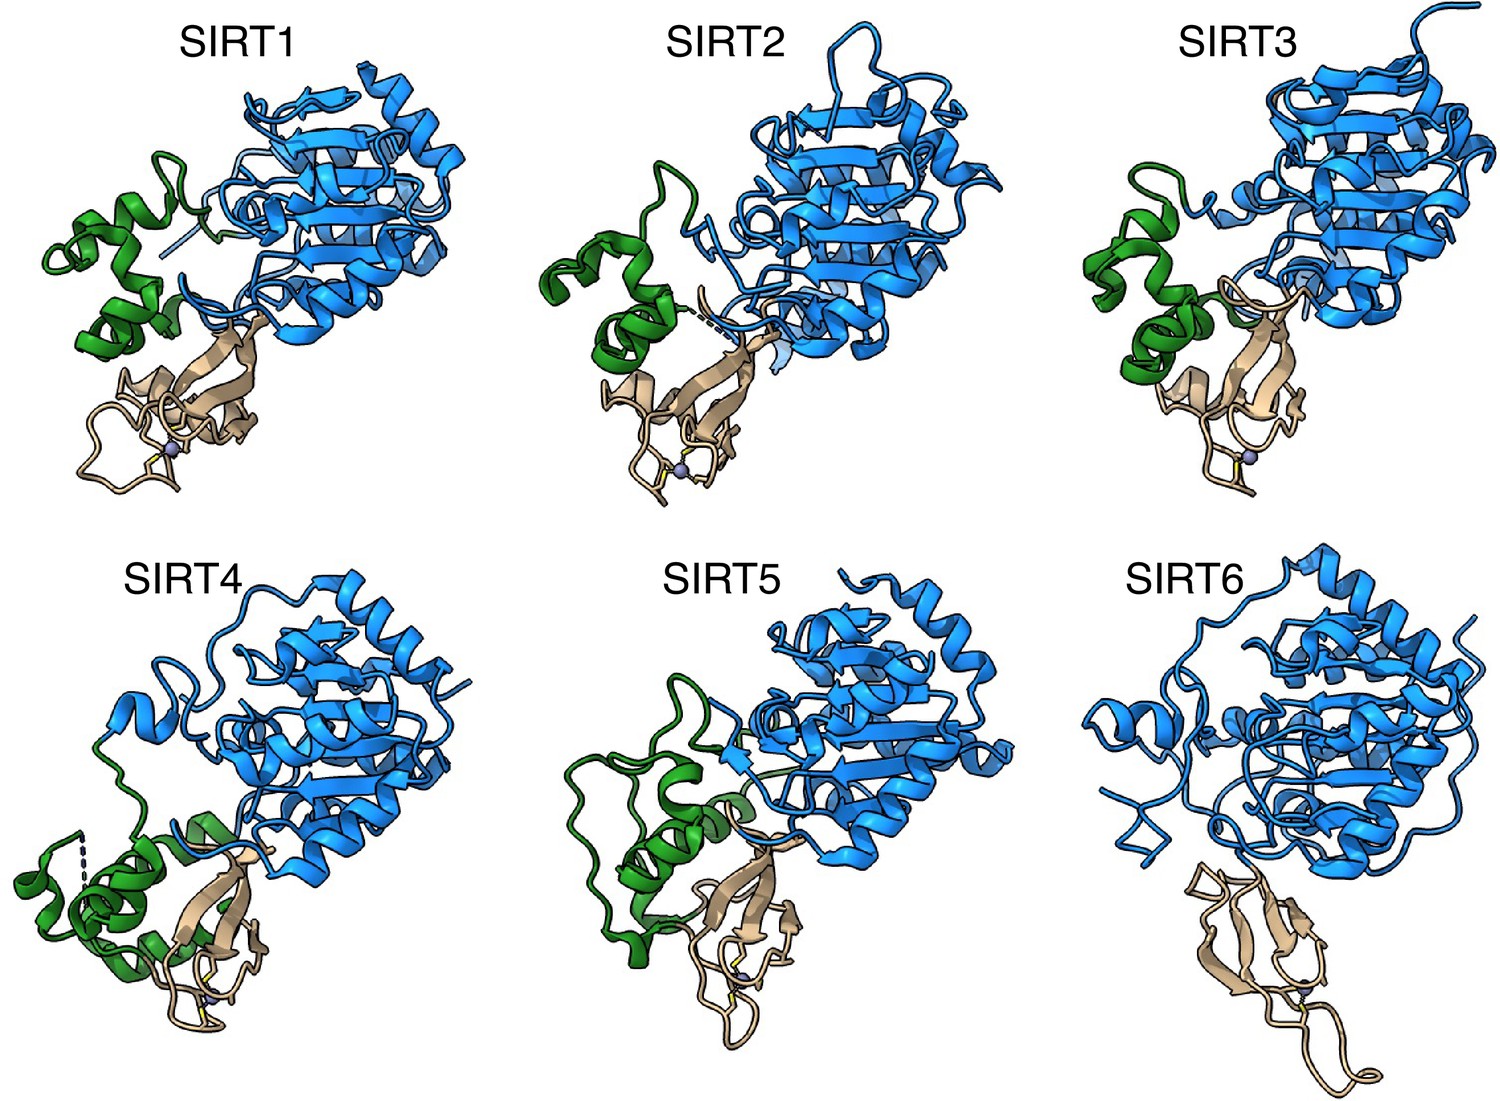
SIRT6 lacks the helix bundle between the Rossmann fold and the Zinc-finger domains.
The structures of human sirtuins are depicted – the Rossmann fold domain in blue, Zinc-finger in tan and the helix bundle between the two in green.
Figure 1—figure supplement 2

Cryo-EM data analysis strategy for SIRT6-nucleosome – dataset 1.
(a) Complete data processing scheme. Maps colored in rainbow represent the local resolution of the reconstructions. Hollow blue volume represents the mask used for focused classification and refinement. FSC curves are depicted as a function of resolution in angstrom. CryoSPARC v.3 and v.4 were used to generate the 3.6 Å overall resolution map of SIRT6-nucleosome complex. RELION 3 was used for classifications of flexible regions, corresponding to the Rossmann fold domain of SIRT6. (b) Original micrograph of SIRT6-nucleosome complex. (c) Two-dimensional class averages showing high-resolution structural features.
Figure 1—figure supplement 3
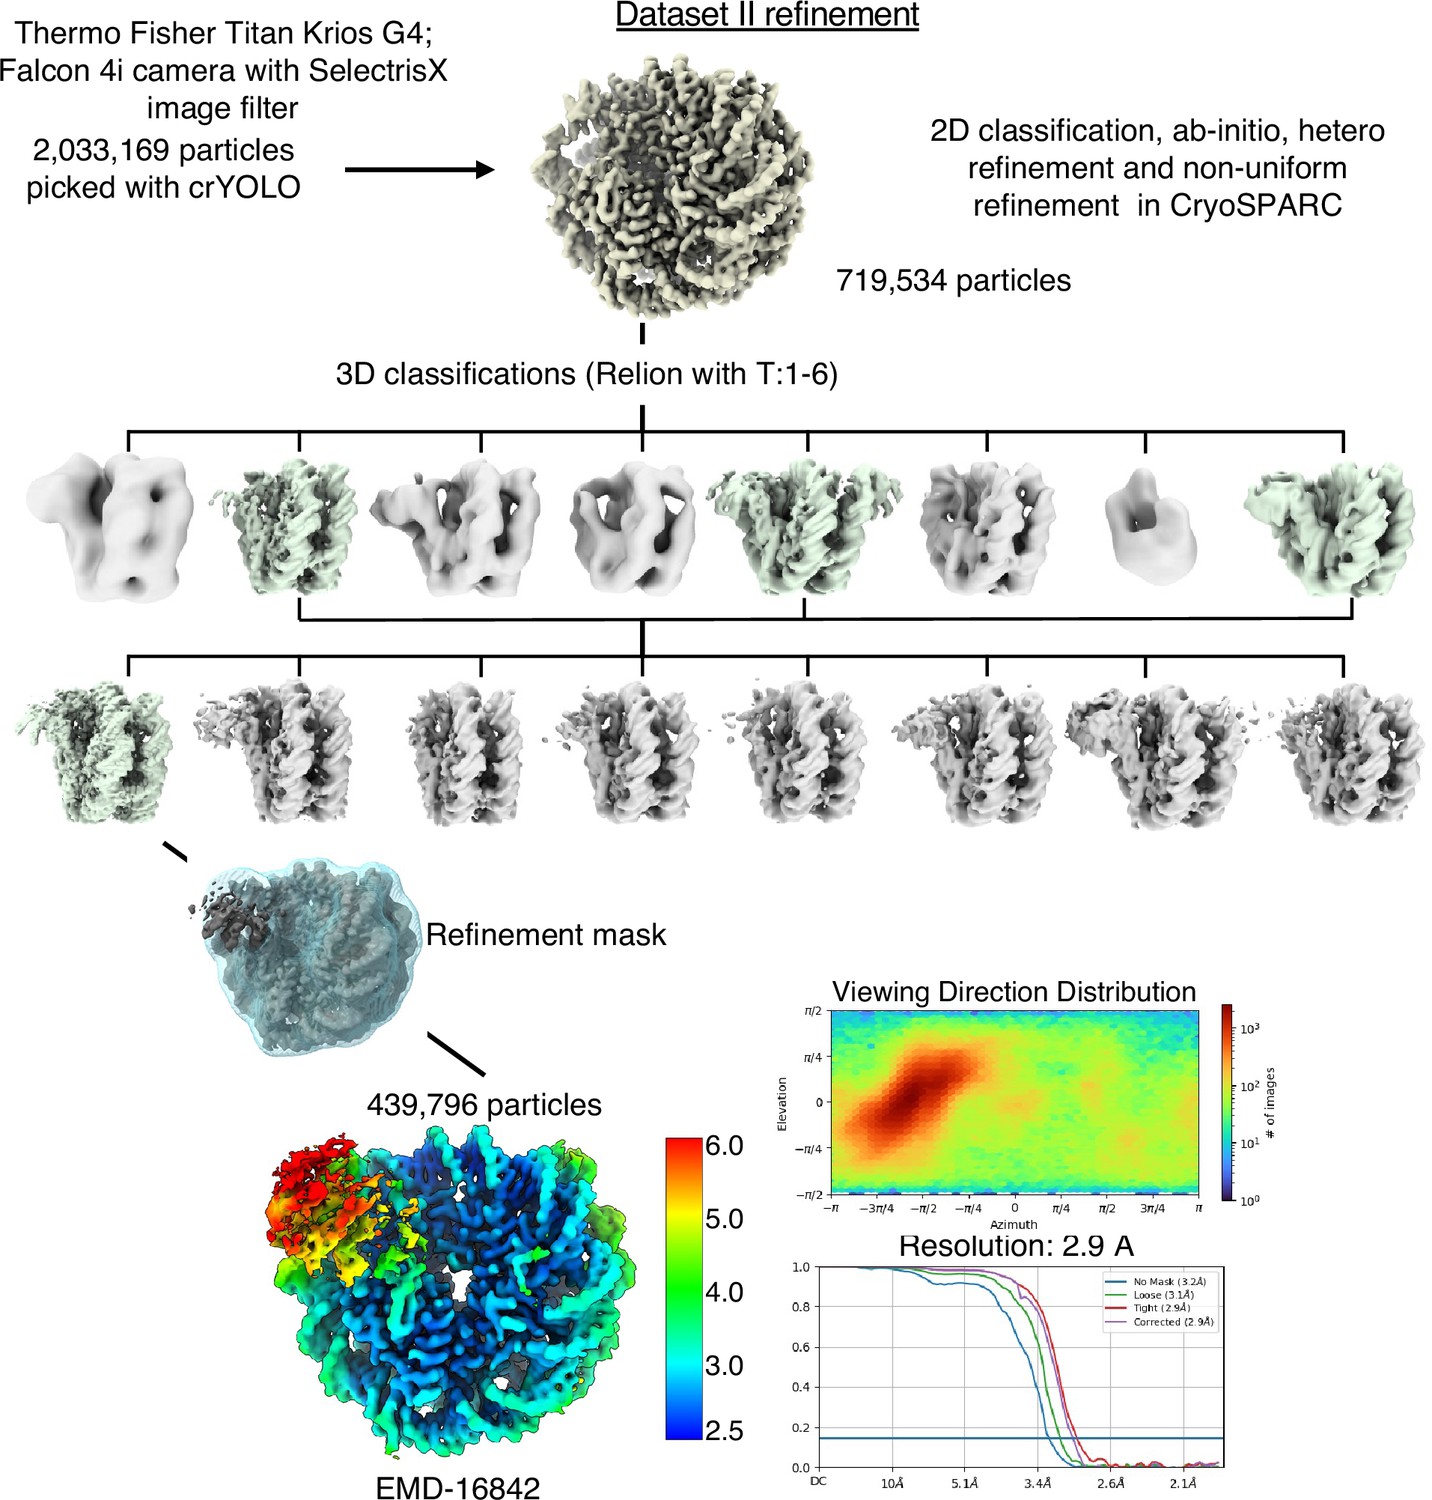
Cryo-EM data analysis strategy for SIRT6-nucleosome – dataset 2.
Complete data processing scheme. Maps colored in rainbow represent the local resolution of the reconstructions. FSC curves are depicted as a function of resolution in angstrom. CryoSPARC v.3 and v.4 and Relion 3 were used for 3D classification and to generate the 2.9 Å overall resolution map of SIRT6-nucleosome complex.
Figure 1—figure supplement 4

Representative regions illustrating the quality of the cryo-EM map of SIRT6 bound to nucleosome.
(a) Close-up view of the SIRT6 Zn-finger interacting with the nucleosomal acidic patch. (b) View showing map details around the nucleosome dyad. (c) SIRT6 Rossmann fold domain interaction with the DNA. (d) Density used to trace H2A tail.
Figure 1—figure supplement 5

SIRT6 binds to and displaces the “looser” DNA terminus.
(a) Cryo-EM densities of the nucleotide base pairs at the dyad (yellow) and positions ± 4 (green) showing the orientation of the DNA in the SIRT6-nucleosome complex. Besides the dyad, the positions ± 4 are also asymmetric in the nucleosome with the Widom-601 DNA. (b) The binding of SIRT6 to the nucleosome alters the path of the terminus DNA by 37°. Nucleosomal DNA is compared with (dim grey) and without (white) bound SIRT6. (c) The same views as in panel b with the cryo-EM maps. (d) Nucleosome without SIRT6 has no deviation of the DNA termini. PDB 3LZ0 was fitted to the nucleosome structure.
Figure 2 with 2 supplements
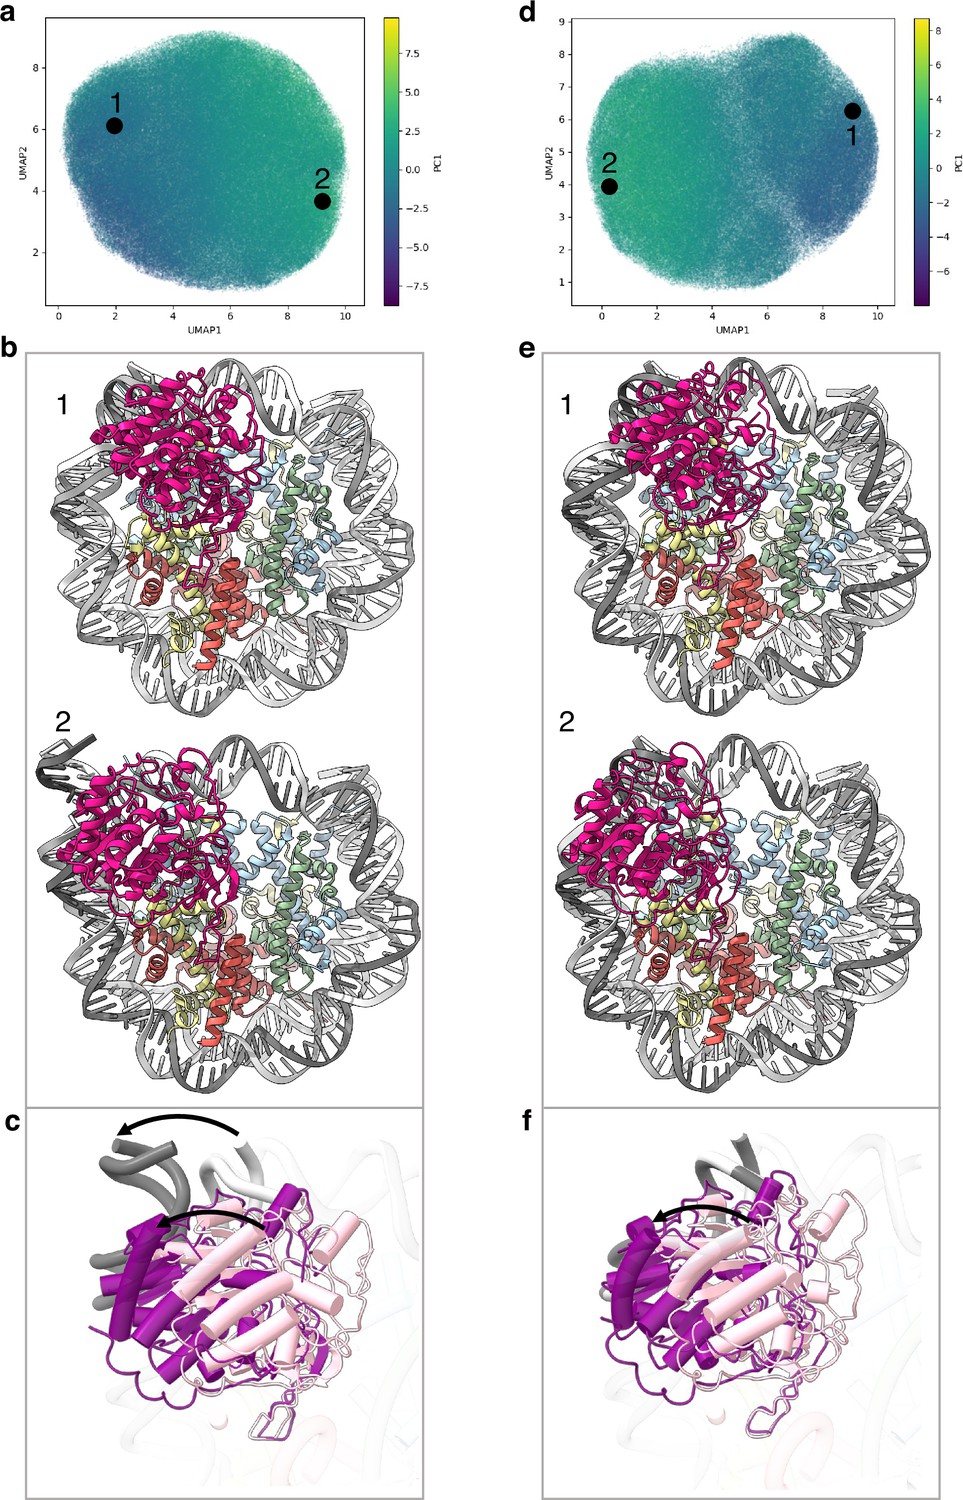
Flexibility of the SIRT6 Rossmann fold.
(a) UMAP projection of the latent embeddings of a subset of SIRT6-nucleosome particles representing the concerted movement of the Rossmann fold and the DNA terminus. (b) Structural representation of the two endpoints of the latent embeddings shown in panel a. (c) Overlay of the DNA ends and the SIRT6 Rossmann fold of two endpoints shown in panel b. Arrows show their displacements between the two endpoints. (d) UMAP projection of the latent embeddings of another subset of SIRT6-nucleosome particles representing the movement of the Rossmann fold with respect to the nucleosomal DNA. (e) Structural representation of the two endpoints of the latent embeddings shown in panel b. (f) Overlay of the DNA ends and the SIRT6 Rossmann fold of two endpoints shown in panel e. Arrow show the displacement of the Rossmann fold between the two endpoints.
Figure 2—figure supplement 1

Schematic representation of CryoDRGN analyses.
Particle images from CryoSPARC refinement were Fourier cropped to a size of 128x128 pixels. They were subjected to CryoDRGN analysis (run1). Ten representative volumes of the first Principal component is depicted. Particles from classes with similar DNA end positions were pooled and refined in CryoSPARC. Particles from this new refinement were re-analysed with CryoDRGN (run2). Ten representative volumes of the first Principal component is depicted.
Figure 2—figure supplement 2
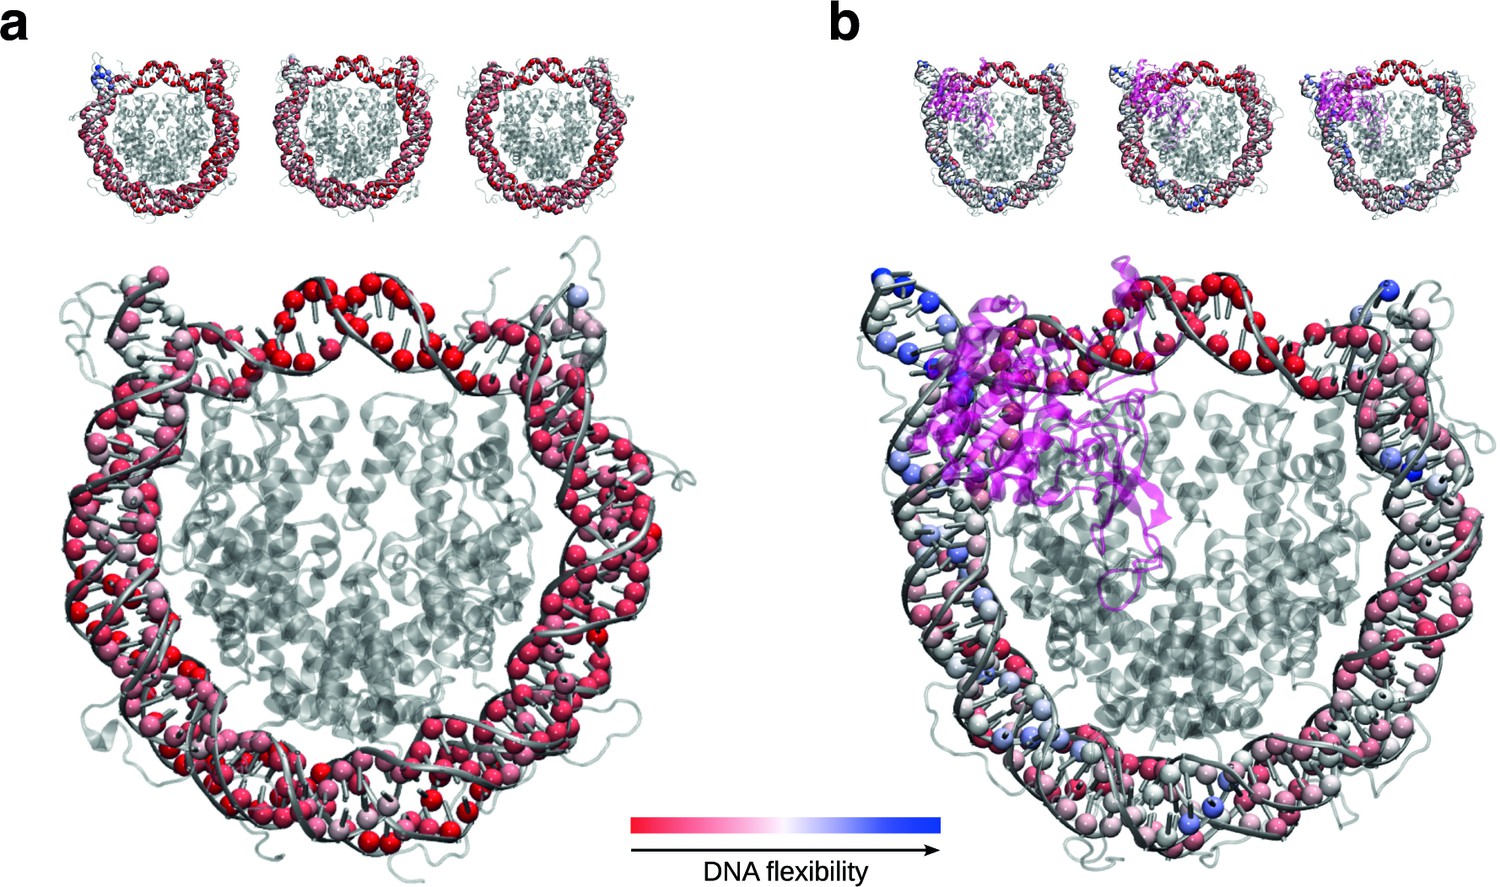
SIRT6 binding renders DNA termini more flexible.
(a) Projection of per residue flexibility contribution calculated from molecular dynamics simulations of the nucleosome without SIRT6. The balls at the DNA residues are colored according to the residue’s relative contribution to the DNA overall flexibility. The three replicates are shown on the top and the projected average on the bottom. (b) The same analysis is shown for the SIRT6 bound nucleosome. Rendered with VMD1.9.3.
Figure 3 with 3 supplements
Binding of SIRT6 to the nucleosome.
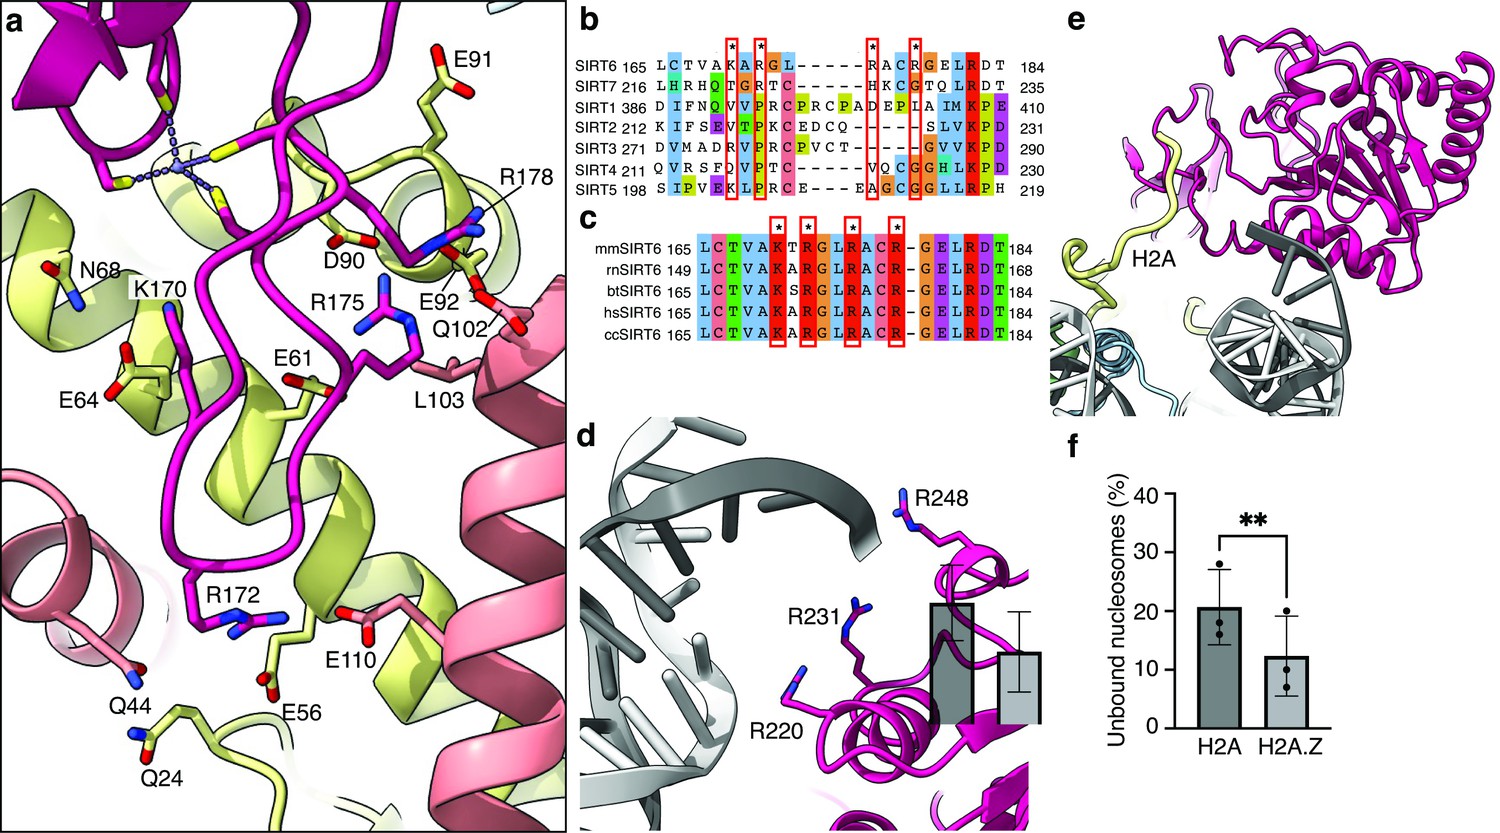
(a) Close-up view on zinc-finger interactions with the acidic patch. Color code as in Figure 1. (b) Protein sequence alignment of human sirtuins. Red boxes and asterisks depict the residues of SIRT6 interacting with the acidic patch of the nucleosome. (c) Protein sequence alignment of SIRT6 from different species highlighting the same amino acids as in panel b. Organisms: mm Mus musculus, rn Rattus norvegicus, bt Bos taurus, hs Homo sapiens and cc Castor canadensis. (d) Depiction of the three arginines of SIRT6 (magenta) interacting with the DNA (grey). (e) H2A c-terminal tail (yellow) interacts with SIRT6(magenta). (f) SIRT6 binding to H2A or H2AZ containing nucleosomes. Bars show the fraction of residual nucleosomes that did not shift with bound SIRT6 in an electron-mobility shift assay (Figure 3—figure supplement 3). Bars represent mean ± SD of three biological replicates (shown as dots). ** indicates a statistically significant difference between the fraction of residual H2A and H2A.Z containing nucleosomes (p=0.0016 in paired t-test).
Figure 3—figure supplement 1
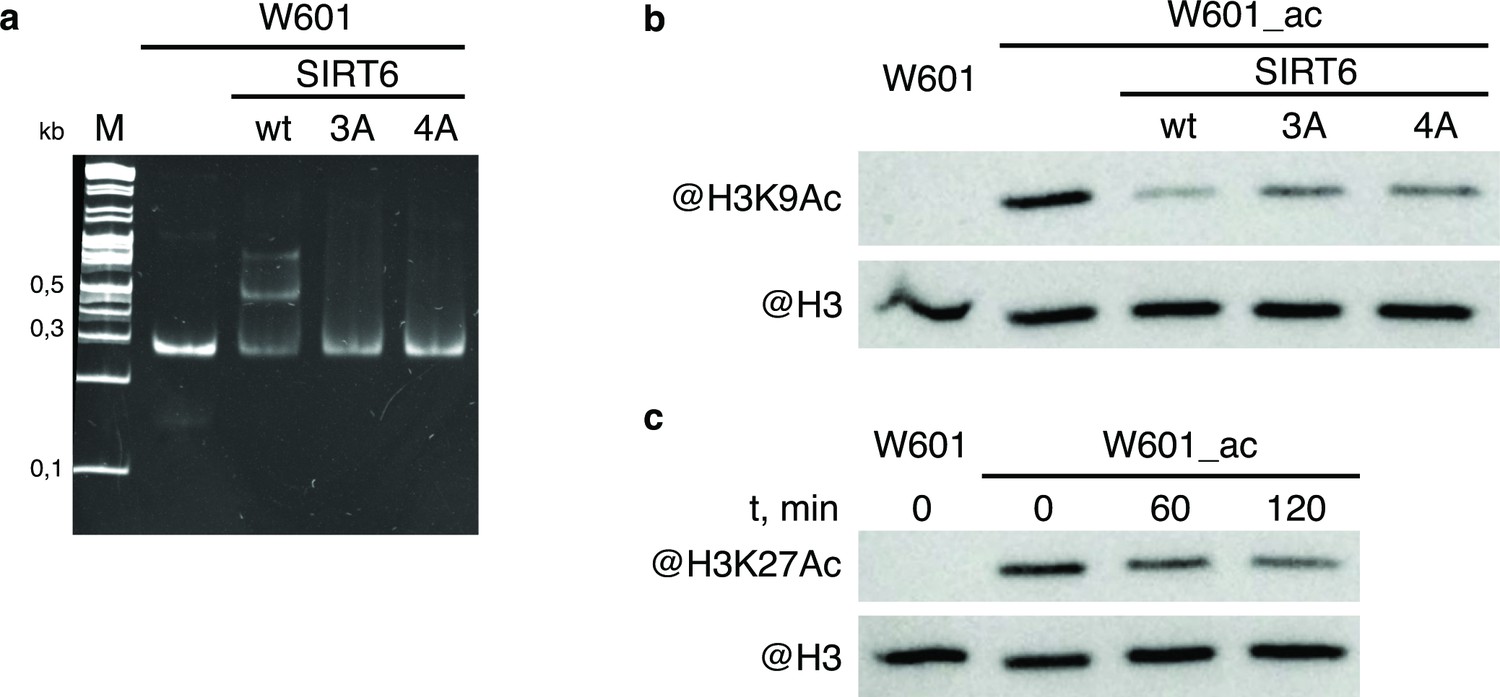
WT and mutant SIRT6 - interactions with nucleosome and deacetylation activity.
(a) Electrophoretic mobility shift assay to test binding of Widom-601 nucleosome to wt and mutant SIRT6. Lower and upper shifted bands visible in SIRT6 wt lane likely correspond to one or two SIRT6 molecules bound to one nucleosome. (b–c) Deacetylation activity of SIRT6 and its mutants. W601_ac denotes SAGA-acetylated Widom-601 nucleosome. (b) Western blot analysis of H3K9Ac deactylation by wt, 3 A, or 4 A SIRT6. (c) Western blot analysis of H3K27Ac deacetylation by SIRT6.
Figure 3—figure supplement 2
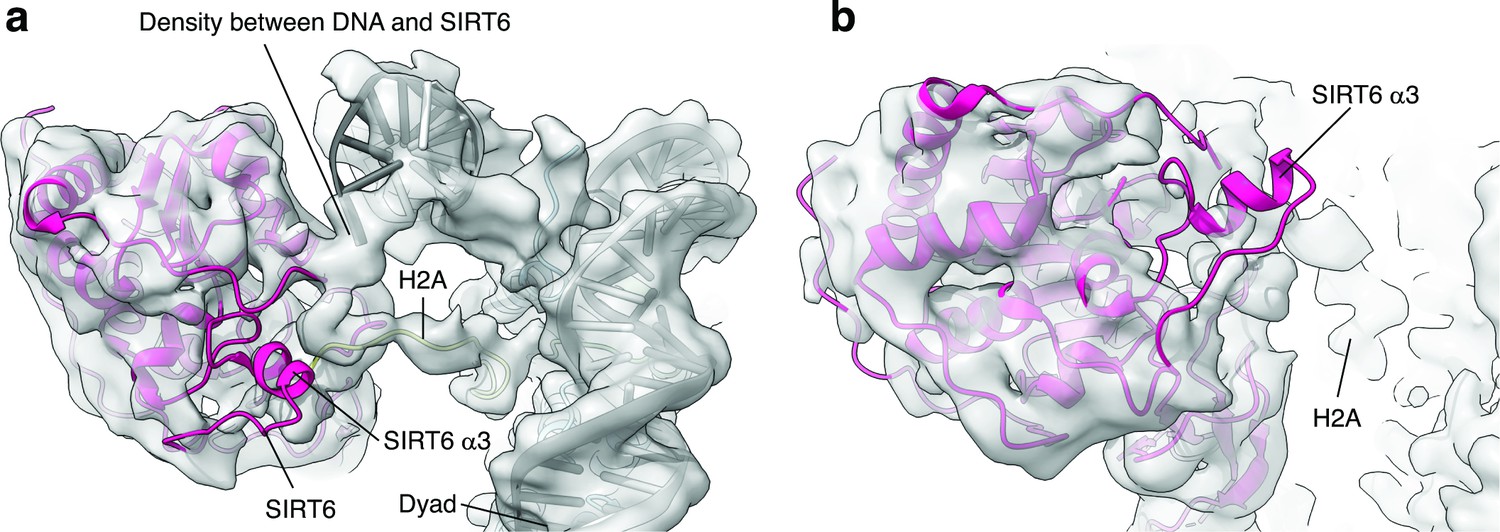
SIRT6 rearrangement upon nucleosome binding.
(a) Top view of the SIRT6 bound nucleosome. Two distinct densities were observed between SIRT6 and the DNA. (b) Side view of the SIRT6 bound nucleosome. The third helix of SIRT6 (α3), which is part of the cofactor binding loop is not present in the structure.
Figure 3—figure supplement 3
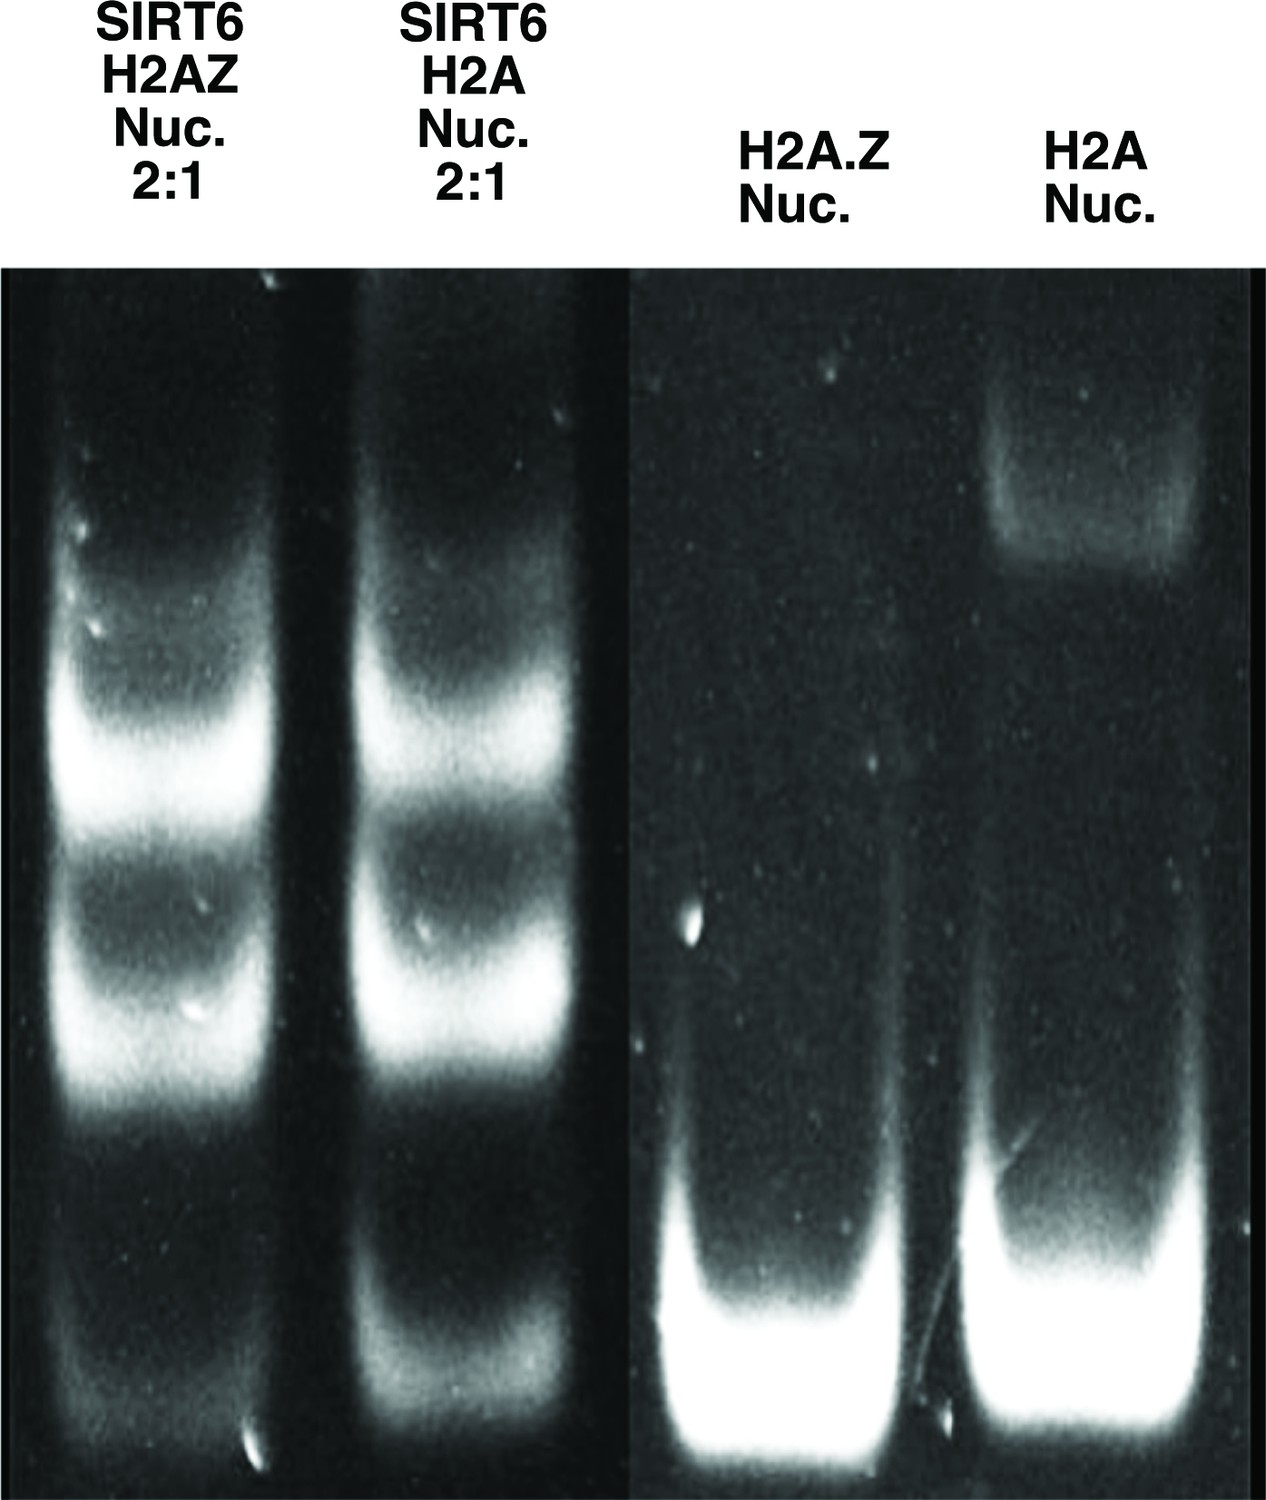
Electrophoretic mobility shift assay comparing SIRT6 binding to H2A.
Z containing nucleosomes and canonical (H2A containing) ones. Used for creating Figure 3f.
Figure 4
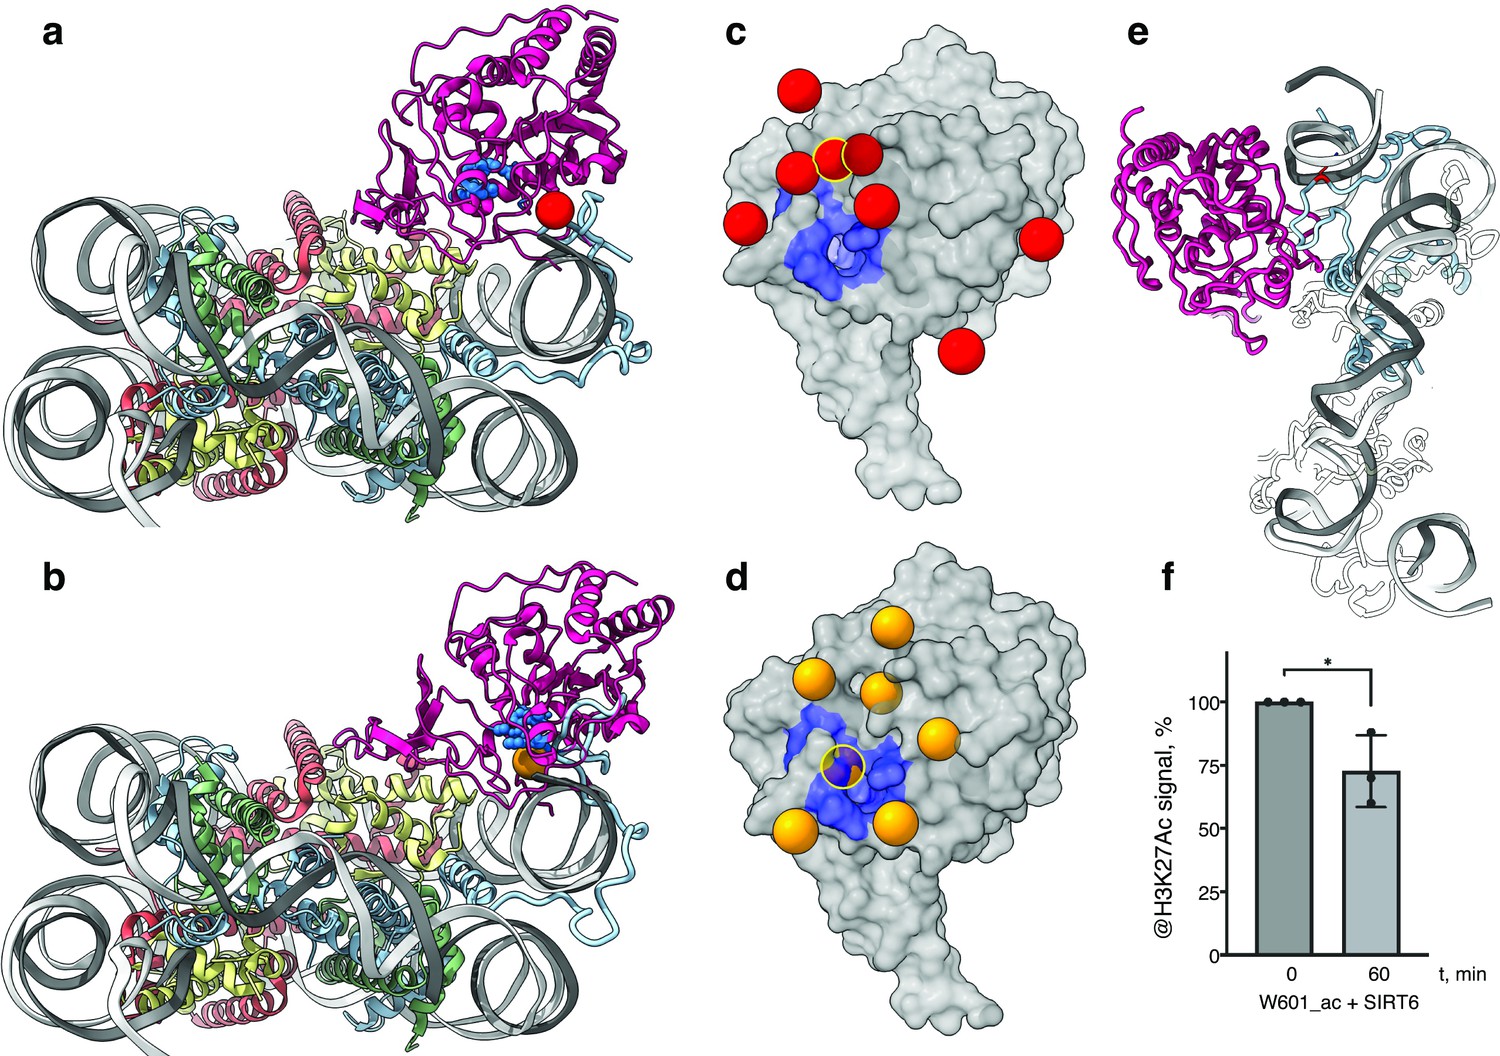
SIRT6 poised to deacetylate lysine residues of H3.
(a) Side View of SIRT6 bound to the nucleosome with histone H3 K9 residue (red sphere) closest to the SIRT6 active site (blue spheres) from a set of molecular dynamics simulations. (b) Side View of SIRT6 bound to the nucleosome with histone H3 K18 residue (orange sphere) closest to the SIRT6 active site from a set of molecular dynamics simulations. (c) All H3K9 positions (red spheres) in close proximity (<15 Å) to the SIRT6 active site (blue) taken from a set of 15 molecular dynamics simulations and depicted on the surface view of SIRT6 bound to nucleosome. (d) All H3K18 positions (orange spheres) in close proximity (<15 Å) to the SIRT6 active site (blue) taken from a set of 15 molecular dynamics simulations and depicted on the surface view of SIRT6 bound to nucleosome. (e) Molecular dynamics simulations show that H3 c-terminal tail (blue) can protrude toward SIRT6 in a space formed between the histone octamer and the DNA. H3K27 is shown in red. (f) Quantification analysis of H3K27ac bands intensities in deacetylation assay. Bars show percentage of signal detected in western blot run with anti-H3K27ac antibodies. Bars represent mean ± SD of three biological replicates (shown as dots). * indicates a statistically significant difference between the 0 min (control) and 60 min (SIRT6 treatment) fraction of acetylated H3K27 (p=0.0396 in one-way paired t-test).
Tables
Key resources table
| Reagent type (species) or resource | Designation | Source or reference | Identifiers | Additional information |
|---|---|---|---|---|
| Strain, strain background (Escherichia coli) | BL21-RIL | N/A | ||
| Recombinant DNA reagent | SIRT6 (plasmid) | AddGene | #28271 | SIRT6 (PDB: 3PKJ) in pET28a-LIC |
| Recombinant DNA reagent | Mutant SIRT6 (DNA fragment) | SynBio | K170A, R172A, R175A, R178A, R220A, R231A and R248A | |
| Recombinant DNA reagent | Widom601 DNA (plasmid) | Dyer et al., 2004 | Gift from Dr. K. Mohideen-Abdul. | |
| Recombinant DNA reagent | X. laevis H2A, H2B, H3, H4 histones (plasmids) | Luger et al., 1999; Dyer et al., 2004 | Gift from Dr. K. Mohideen-Abdul. | |
| Recombinant DNA reagent | Human H2A.Z.1 (plasmid) | AddGene | #42629 | H2A.Z.1 in pET28a |
| Antibody | H3K27ac (rabbit monoclonal) | CellSignaling | #8173 S | Diluted: 1:1000 |
| Antibody | H3K9ac (rabbit polyclonal) | Abcam | Ab4441 | Diluted: 1:2500 |
| Antibody | H3 (mouse monoclonal) | CellSignaling | #14269 S | Diluted: 1:1000 |
| Software, algorithm | SerialEM | v4.1 | Automated data collection | |
| Software, algorithm | EPU | Thermo Fisher | v3.4 | Automated data collection |
| Software, algorithm | Warp | Warp | v1.0.9 | Micrograph preprocessing |
| Software, algorithm | cryoSPARC | cryoSPARC | v4 | Image analysis |
| Software, algorithm | RELION | RELION | v3.1 | Image analysis |
| Software, algorithm | crYOLO | crYOLO | v1.9.6 | Particle picking |
| Software, algorithm | cryoDRGN | cryoDRGN | v1.1 | Image analysis – structural flexibility analysis |
| Software, algorithm | DeepEMhancer | DeepEMhancer | v0.8 | Map sharpening |
| Software, algorithm | UCSF Chimera/ChimeraX | UCSF ChimeraX | v1.16/1.6 | Rigid body fitting, visualisation and figures |
| Software, algorithm | Isolde | Isolde | v1.6 | Flexible fitting, model refinement |
| Software, algorithm | PHENIX | PHENIX | v1.21 | Model refinement |
| Software, algorithm | AMBER20 suit | AMBER20 | MD simulations |
Additional files
-
Supplementary file 1
Supplementary information for cryo-EM and molecular dynamics symulations.
(a) Cryo-EM data collection, refinement and validation statistics. (b) Frequency of conformational clusters for each MD ensemble. Clusters featuring the H3 tail protruding between the DNA and the octamer are marked by a star.
- https://cdn.elifesciences.org/articles/87989/elife-87989-supp1-v1.docx
-
MDAR checklist
- https://cdn.elifesciences.org/articles/87989/elife-87989-mdarchecklist1-v1.docx
Download links
A two-part list of links to download the article, or parts of the article, in various formats.
Downloads (link to download the article as PDF)
Open citations (links to open the citations from this article in various online reference manager services)
Cite this article (links to download the citations from this article in formats compatible with various reference manager tools)
Binding to nucleosome poises human SIRT6 for histone H3 deacetylation
eLife 12:RP87989.
https://doi.org/10.7554/eLife.87989.5


