Age-associated changes in lineage composition of the enteric nervous system regulate gut health and disease
- Division of Gastroenterology, Dept of Medicine, Beth Israel Deaconess Medical Center, United States
- Division of Medical Sciences, Harvard Medical School, United States
- Center for Neurogastroenterology, Department of Medicine, Johns Hopkins University – School of Medicine, United States
- Department of Genetic Medicine, Johns Hopkins University – School of Medicine, United States
- Division of Gastroenterology, Stanford University – School of Medicine, United States
- Center for Cancer Research, National Cancer Institute, United States
- Department of Neuroscience, Johns Hopkins University – School of Medicine, United States
- Kavli Neurodiscovery Institute, Johns Hopkins University – School of Medicine, United States
- Department of Medicine, Mayo Clinic, United States
Figures
Figure 1 with 1 supplement
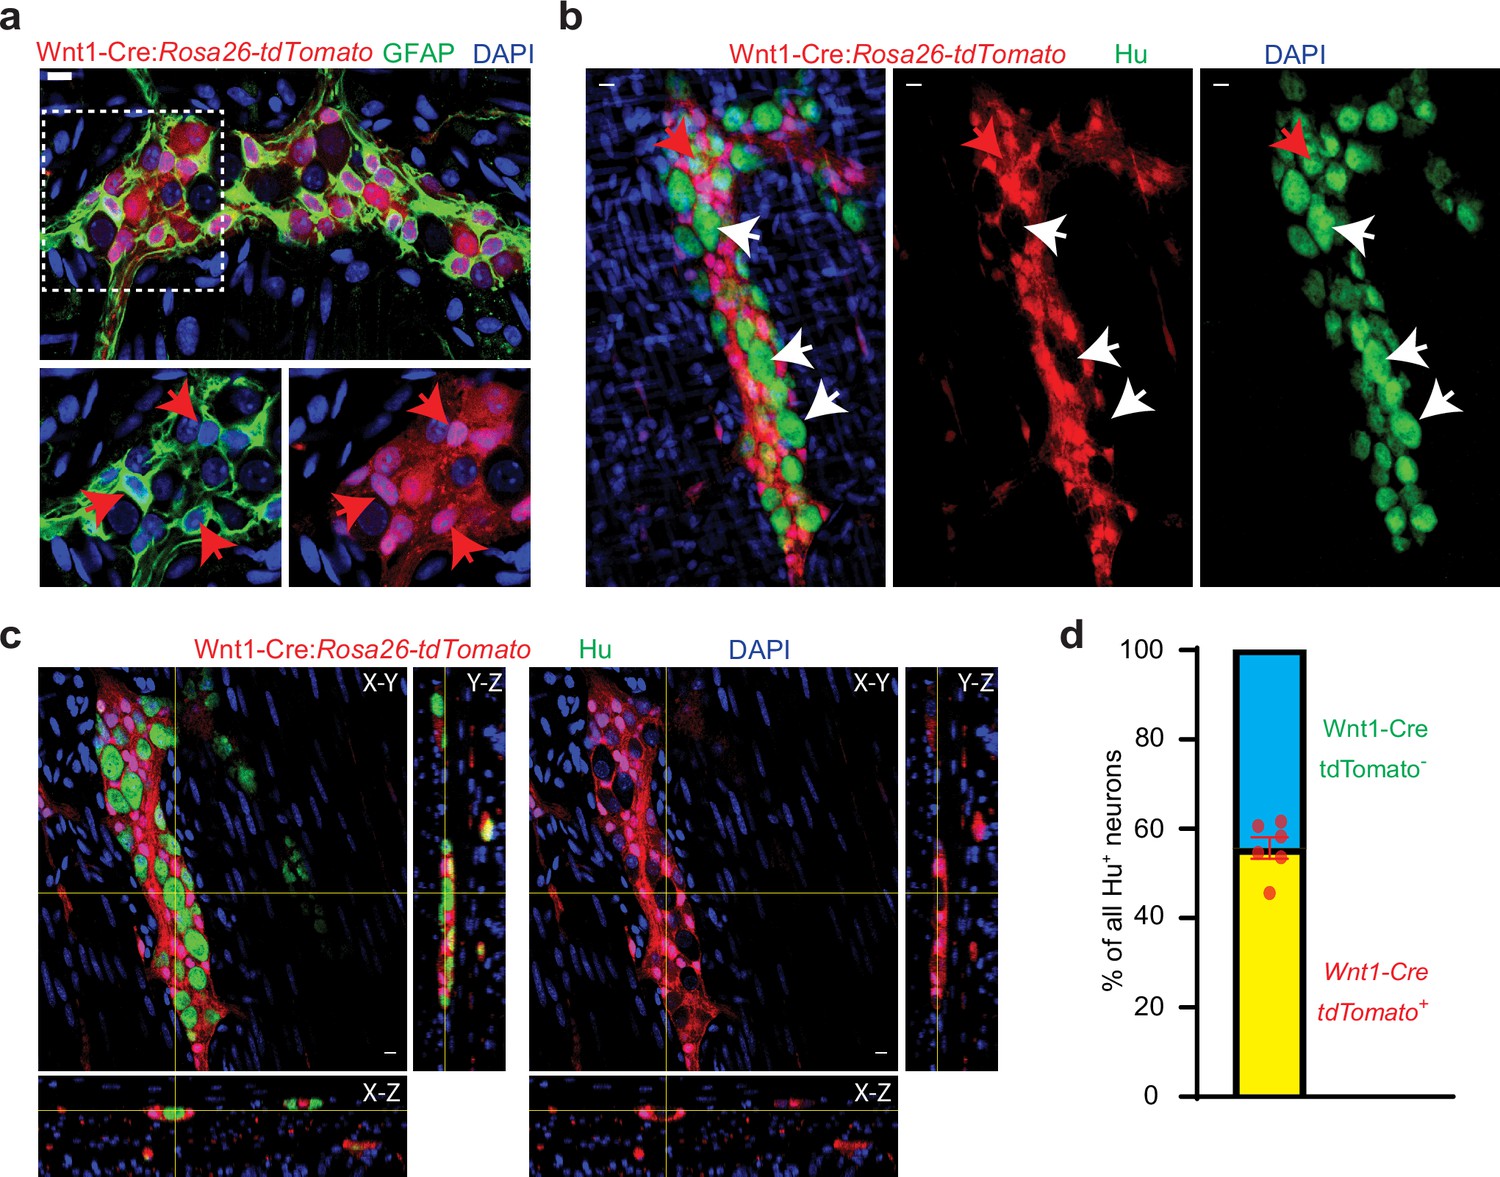
Half of all adult small intestinal myenteric neurons are derived from a non-neural crest lineage.
(a) Enteric glia, labeled with GFAP (green) in the myenteric plexus from an adult Wnt1-Cre:Rosa26lsl-tdTomato mouse. Inset is magnified in color segregated panels, showing GFAP+ glia co-expressing tdTomato (red, red arrows). Nuclei are labeled with DAPI (blue). Scale bar = 10 µm. (b) Two-dimensional representation of a three-dimensional stack of images shows enteric neurons, labeled with Hu (green), in the myenteric plexus from an adult Wnt1-Cre:Rosa26lsl-tdTomato mouse. Enteric neurons either express tdTomato (red arrow) or not (white arrows). Nuclei are labeled with DAPI (blue). Scale bar = 10 µm. (c) Orthogonal views of the image (b) shows the lack of tdTomato expression in a particular Hu-immunolabeled enteric neuron. (d) Quantification of tdTomato+ and tdTomato- neurons in the myenteric ganglia of 6 P60 Wnt1-Cre:Rosa26lsl-tdTomato mice. Data represents Mean ± SEM.
Figure 1—figure supplement 1

Presence and absence of tdTomato reporter expression in the myenteric ganglia of adult neural crest lineage-traced mice.
(a) Hu-immunostained Wnt1-Cre:Rosa26 lsl-tdTomato LM-MP tissue, where tdTomato-expression (red) marks neural crest-derived cells, and Hu (green) labels myenteric neurons, we observed the presence of higher intensity fluorescence (red arrows) and lower intensity fluorescence (orange arrows) in various tdTomato+ neurons. The myenteric ganglia also contained Hu+ neurons that did not express tdTomato (green arrow) and these neurons alone were deemed to be non-neural crest-derived neurons. Scale bar denotes 10 µm. (b) Reporter non-expressing Hu-immunolabeled neurons (green, green arrows) can be observed both through the expression of the tdTomato reporter (red), as well as on antibody labeling of the tdTomato reporter (gray). (c) Freshly harvested small intestinal tissue from Wnt1-Cre:Rosa26 lsl-tdTomato mice when imaged under ×20 magnification of a live tissue fluorescence microscope shows the presence of cells that express tdTomato (red) and those that don’t. (d) Cells showing hyper-aggregation of the tdTomato reporter can be found in freshly harvested full-thickness small intestinal myenteric plexus in tissues imaged under ×20 magnification of a live tissue fluorescence microscope. (e) Myenteric ganglia from fixed LM-MP tissue of adult Wnt1-Cre:Rosa26 lsl-tdTomato mice show show hyper-aggregation of tdTomato (white arrow) when imaged using a confocal microscope. Nuclei are stained with nuclear marker DAPI (blue). Scale bar denotes 10 µm. (f) Cells showing hyper-aggregation of tdTomato (red, red arrow) show no detectable nuclear labeling with DAPI (blue) or of pan-neuronal marker Hu (green, green arrow). Scale bar denotes 10 µm. In addition, interrogation of two other neural crest-specific lineage-traced mouse lines confirms our observations with Wnt1-Cre:Rosa26 lsl-tdTomato mice. (g) In Wnt1-Cre:Hprt lsl-tdTomato adult male mice, tdTomato expression (red) is present only in a subset of Hu-immunolabeled (green) neurons (red arrows) while it is not detected in other Hu-expressing neurons (green). Similarly, (h) only a subpopulation of Hu+ adult enteric neurons (green) is derived from the neural crest, as seen by its co-expression of tdTomato (red, red arrows) in the Pax3Cre:Rosa26 lsl-tdTomato mice while other neurons that do not express tdTomato (white arrows) are inferred to be not derived from the neural crest. Scale bar denotes 10 µm. (i) Orthogonal views of small intestinal villus from a Wnt1-Cre:Rosa26 lsl-tdTomato mouse that shows presence of tdTomato-expressing (red) neural crest-derived fibers inside the villus but a complete lack of tdTomato-expression by intestinal epithelial cells. Nuclei are labeled with DAPI (blue). Scale bar denotes 10 µm. (j) Representational image of the myenteric plexus from a Rosa26lsl-tdTomato mouse without any Cre driver showing that in absence of Cre recombinase to drive tdTomato expression, there is a lack of tdTomato expression in this layer. Nuclei are labeled with DAPI (blue). Scale bar denotes 10 µm. (k) Representational image of the myenteric plexus from a Rosa26lsl-EGFP mouse without any Cre driver showing that in absence of Cre recombinase to drive EGFP expression, there is a lack of EGFP expression in this layer. Nuclei are labeled with DAPI (blue). Scale bar denotes 10 µm. (l) Western blot image showing detection of two different loading amounts of the recombinant HuB protein by the rabbit polyclonal antibody against HuC/D (abcam). Molecular Weight marker with defined band sizes indicated on the right.
-
Figure 1—figure supplement 1—source data 1
Antibodies against HuC and HuD also recognize HuB protein.
- https://cdn.elifesciences.org/articles/88051/elife-88051-fig1-figsupp1-data1-v1.pdf
Figure 2 with 2 supplements
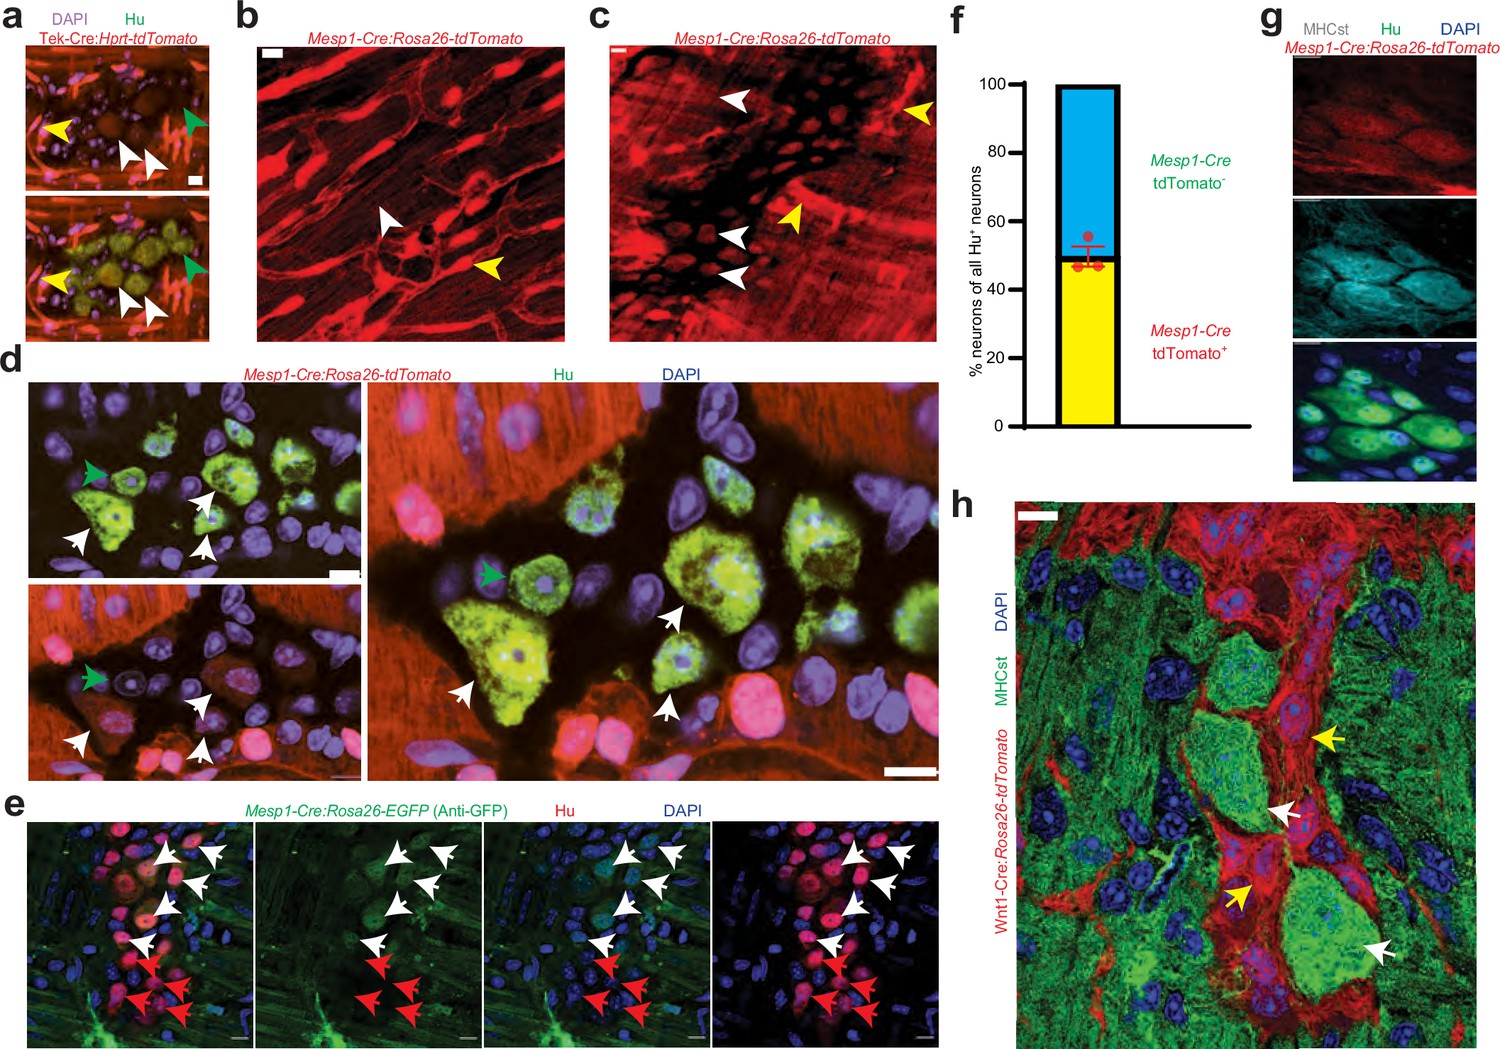
Mesoderm-lineage-tracing and marker expression provide evidence of the mesodermal-derivation of half of all adult small intestinal myenteric neurons.
(a) Small intestinal LM-MP from adult male Tek-Cre:Hprtlsl-tdTomato shows the presence of Tek-derived and hence mesoderm-derived tdTomato+ (red) Hu+ (green) neurons (white arrows) and non-mesoderm-derived tdTomato- neurons (green arrows). Vascular cells depict higher fluorescence intensity (yellow arrow) than cells in the ganglia. Nuclei are labeled with DAPI. Scale bar = 10 µm. Cardiac and small intestinal tissues from (b) heart and (c) small intestinal LM-MP layer of adult male Mesp1Cre:Rosa26lsl-tdTomato mice shows the presence of variable tdTomato expression in cells of these tissues. While cardiomyocytes in heart and cells within the myenteric ganglia (white arrows) exhibit lower tdTomato fluorescence, similar to the tissues from Tek-cre:Hprt lsl-tdTomato mice in (a), the vascular cells exhibit higher fluorescence intensity (yellow arrows). Scale bar = 10 µm. (d) Small intestinal LM-MP from adult male Mesp1Cre:Rosa26 lsl-tdTomato mouse shows the presence of mesoderm-derived tdTomato+ (red) Hu+ (green) neurons (white arrows) and non-mesoderm-derived tdTomato- neurons (green arrows). Nuclei are labeled with DAPI. Scale bar = 10 µm. (e) Small intestinal LM-MP from adult male Mesp1Cre:Rosa26 lsl-EGFP mouse, when immunostained with antibodies against GFP and against Hu, shows the presence of mesoderm-derived EGFP+ (green) Hu+ (red) neurons (white arrows) and non-mesoderm-derived EGFP- neurons (red arrows). Nuclei are labeled with DAPI. Scale bar = 10 µm. (f) Quantification of tdTomato-expressing and non-expressing neurons in the myenteric ganglia of 3 P60 Mesp1Cre:Rosa26 lsl-tdTomato mice. Data represents Mean ± SEM. MHCst immunolabeling exclusively marks all the (g) mesoderm-derived adult Hu+ (green) neurons in the small intestinal LM-MP of Mesp1Cre:Rosa26 lsl-tdTomato mice; and (h) all the non-NC-derived neurons in the small intestinal LM-MP of Wnt1-Cre: Rosa26 lsl-tdTomato mice (white arrows). MHCst does not label tdTomato+ NC-derived cells (yellow arrows). Nuclei are stained with DAPI (blue). Scale bar = 10 µm.
Figure 2—figure supplement 1

Tek-expressing and Mesp1-expressing mesodermal lineage contributes to adult enteric neurons.
(a) Adult small intestinal LM-MP layer from a male Tek-EGFP mouse, where EGFP expression (green) labels Tek-expressing cells was immunostained with specific antibodies against the pan-neuronal marker PGP9.5 (red) and imaged under a confocal microscope. The Tek-EGFP expression did not label any cells within the myenteric plexus marked by PGP9.5. Nuclei are labeled with DAPI (blue). Scale bar denotes 10 µm. (b) We observed the presence of higher intensity fluorescence (red arrows) and lower intensity fluorescence (green arrow) in various tdTomato+ cells in a section of heart tissue from a 6-month-old Mesp1Cre:Rosa26lsl-tdTomato adult male mouse, where tdTomato (red) labels Mesp1-derived cells of the mesodermal lineage that includes cardiomyocytes and vasculature. Nuclei are stained by DAPI (blue). Scale bar denotes 10 µm. (c) Adult small intestinal LM-MP layer from a 6-month-old male Mesp1Cre:Rosa26lsl-tdTomato mouse, where tdTomato (red) cells are mesoderm-derived cells, was immunostained with specific antibodies against the pan-neuronal marker Hu (green) and imaged under a confocal microscope. tdTomato-expressing cells outside the ganglia (red arrows) were brighter than tdTomato+ neurons inside the ganglia (green arrows). Nuclei are labeled with DAPI (blue). Scale bar denotes 10 µm. (d) Adult small intestinal LM-MP layer from a 2 month old male Mesp1Cre:Rosa26lsl-EGFP mouse, where EGFP+ cells are mesoderm-derived, was immunostained with specific antibodies against the reporter EGFP (green) and the pan-neuronal marker Hu (red) and imaged under a confocal microscope. A population of Hu-immunolabeled neurons were also labeled with antibodies against EGFP (green arrows) while other neurons were not (red arrows), suggesting the derivation of EGFP+ neurons from the Mesp1-expressing mesoderm. (e) No primary control for the Anti-GFP immunostaining showed very weak EGFP expression in the fixed LM-MP tissue from these animals. Nuclei were labeled with DAPI (blue). Scale bar = 10 µm. Consistent with the observations made with the tdTomato reporter in this transgenic line, the Mesp1Cre:Rosa26lsl-EGFP animals also show a brighter reporter signal in the vasculature and a dimmer reporter signal in the myenteric neurons. (f) MHCst+ (cyan) labels all tdTomato+ (red) Hu+ (green) adult neurons (white arrows) but not the tdTomato- neurons (yellow arrow) in the mesoderm-specific Tek-Cre:Hprtlsl-tdTomato lineage-traced lines. Nuclei are stained with DAPI (blue). Scale bar = 10 µm.
Figure 2—figure supplement 2
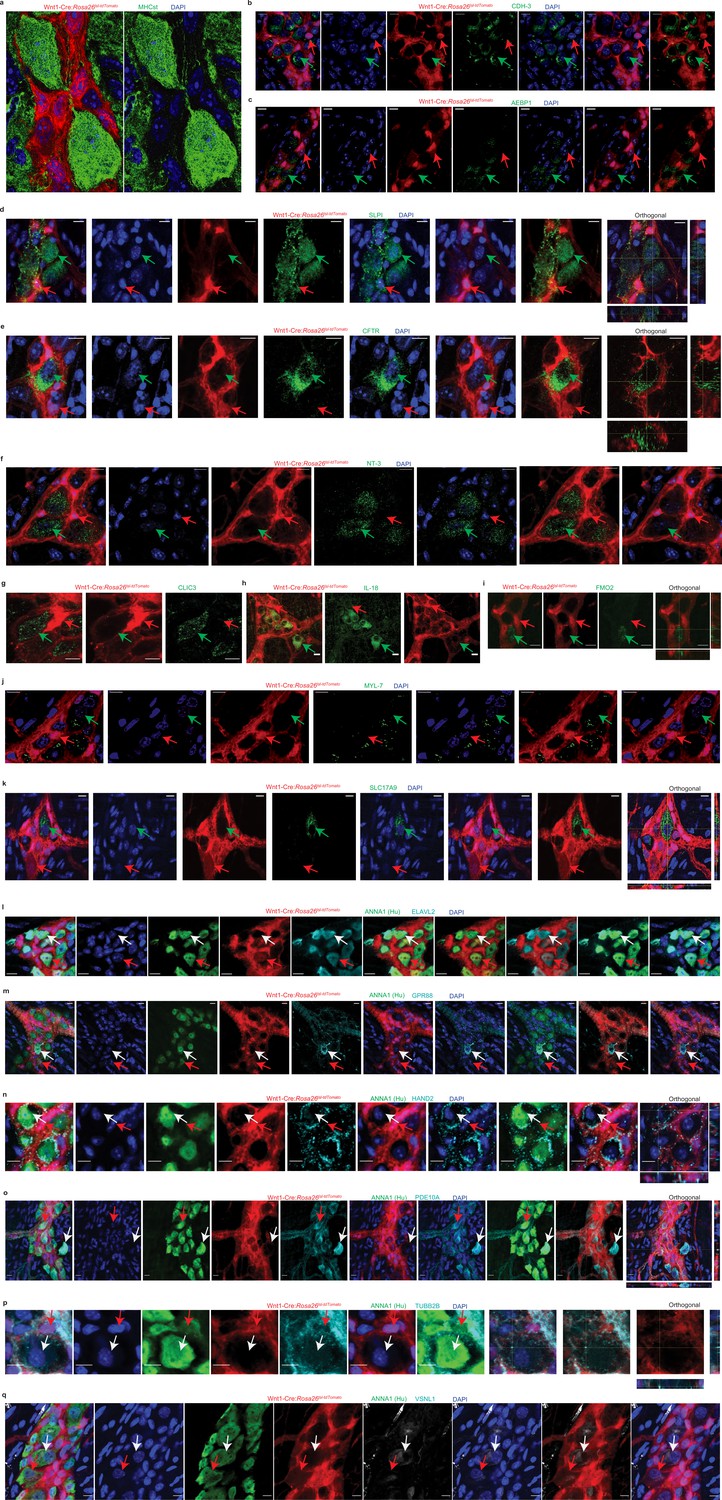
Validation of MENs-specific markers by immunohistochemistry and confocal microscopy.
Small intestinal LM-MP from several adult 5-month-old male Wnt1-Cre:Rosa26 lsl-tdTomato mice, where tdTomato-expression (red) labels neural crest-derived cells, was used to ascertain and validate the expression of the novel MENs marker and of known neuronal marker genes. (a) The myenteric ganglion shown in Figure 2h is presented here as a merged image (where MHCst immunostaining and tdTomato-expression are shown together) and with MHCst immunostaining without tdTomato signal to better appreciate the presence of MHCst-expressing neurons in the ganglia. MHCst-specific antibody S46 (green) was found to label tdTomato non-expressing cells within the myenteric ganglia as well as cells outside of the myenteric ganglia. Neural crest-derived cells within the myenteric ganglia expressed tdTomato. Nuclei are labeled with DAPI (blue). Scale bar denotes 10 µm. The immunostaining of the MENs-markers elucidated through scRNAseq analyses: (b) CDH3, (c) AEBP1, (d) SLPI, (e) CFTR, (f) NT-3, (g) CLIC3, (h) FMO2, (i) IL-18, (j) MYL-7, and (k) SLC17A9 (all immunolabeled cells in these panels are green; green arrows) was found to be localized to or enriched in cells without tdTomato expression, while the tdTomato+ cells were found to show not to express these MENs-specific markers (red arrow). In addition, we also immunolabeled the myenteric ganglia from this transgenic mouse line with known neuronal markers (gray) and with antibodies against the pan-neuronal marker Hu (green) to show that the neuronal markers Elavl2 or HuB (l), GPR88 (m), HAND2 (n), PDE10A (o), TUBB2B (p), and VSNL1 (q) were expressed by both tdTomato+ (red arrow) and tdTomato- Hu+ neurons. Orthogonal views of images where 3D image z-stacks were obtained are provided for better visualization of marker expression in the 3D space. Nuclei in these tissues were labeled with DAPI (blue). Scale bar denotes 10 µm.
Figure 3
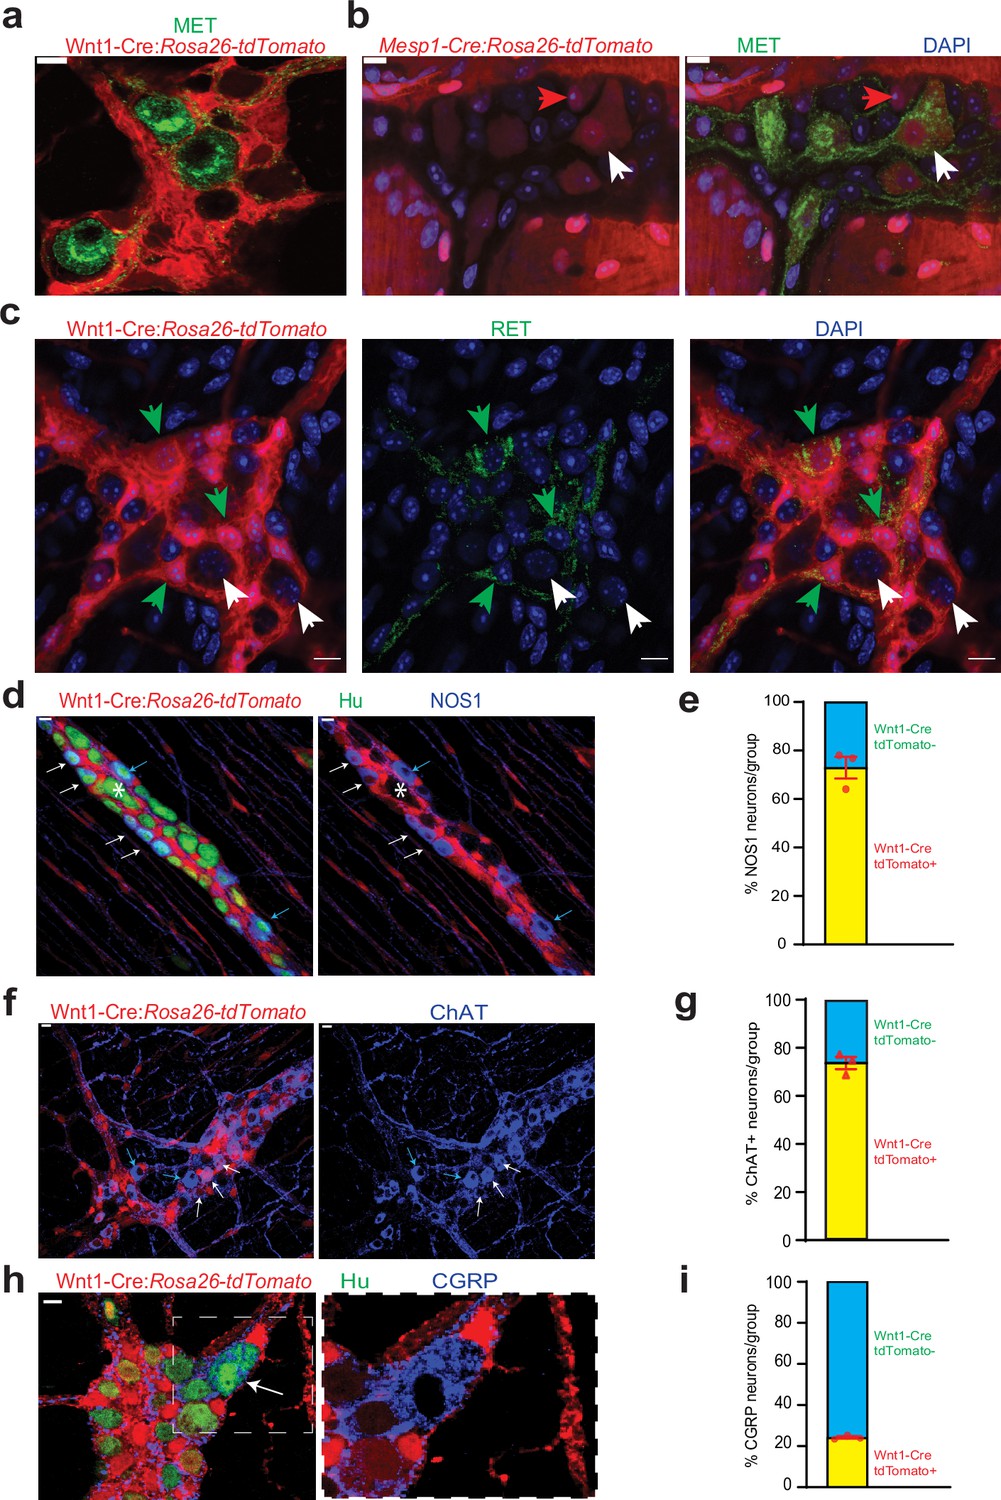
Cellular and molecular phenotyping of MENs and NENs.
MET immunostaining (green) labels (a) Wnt1-Cre:Rosa26 lsl-tdTomato- MENs and (b) a population of Mesp1Cre: Rosa26 lsl-tdTomato+ MENs (white arrow) while not labeling all MENs (red arrow). (c) RET immunostaining (green) only labels Wnt1-Cre:Rosa26 lsl-tdTomato+ NENs (green arrow) and not tdTomato- MENs (white arrows). (d) NOS1 is expressed by both tdTomato+ NENs (red, white arrows) and tdTomato- MENs (blue arrows) in an adult Wnt1-Cre:Rosa26 lsl-tdTomato mouse, but most MENs do not express NOS1 (marked by *). (e) NEN lineage contains significantly higher proportions of NOS1+ neurons compared to MEN lineage in Wnt1-Cre:Rosa26 lsl-tdTomato mice. Data represent mean ± S.E.M. p<0.0001; Fisher’s exact test. (f) ChAT is expressed by both tdTomato+ NENs (red, white arrows) and tdTomato- MENs (blue arrows) in an adult Wnt1-Cre:Rosa26 lsl-tdTomato mouse. (g) NEN lineage contains significantly higher proportions of ChAT+ neurons compared to MEN lineage in Wnt1-Cre:Rosa26 lsl-tdTomato mice. Data represent mean ± S.E.M. p<0.0001; Fisher’s exact test. (h) Both tdTomato+ (red) and tdTomato- neurons in the myenteric plexus of an adult Wnt1-Cre:Rosa26 lsl-tdTomato mouse (Hu, green) express CGRP (blue) Inset showing a tdTomato- CGRP+ neuron (white arrow) is magnified on the right. (i) MEN lineage contains significantly higher proportions of CGRP+ neurons compared to NEN lineage in Wnt1-Cre:Rosa26 lsl-tdTomato male mice. Data represent mean ± S.E.M. P<0.0001; Fisher’s exact test. Nuclei in (b) and (c) are labeled with DAPI (blue). Scale bar for all images denotes 10 µm.
Figure 4 with 3 supplements
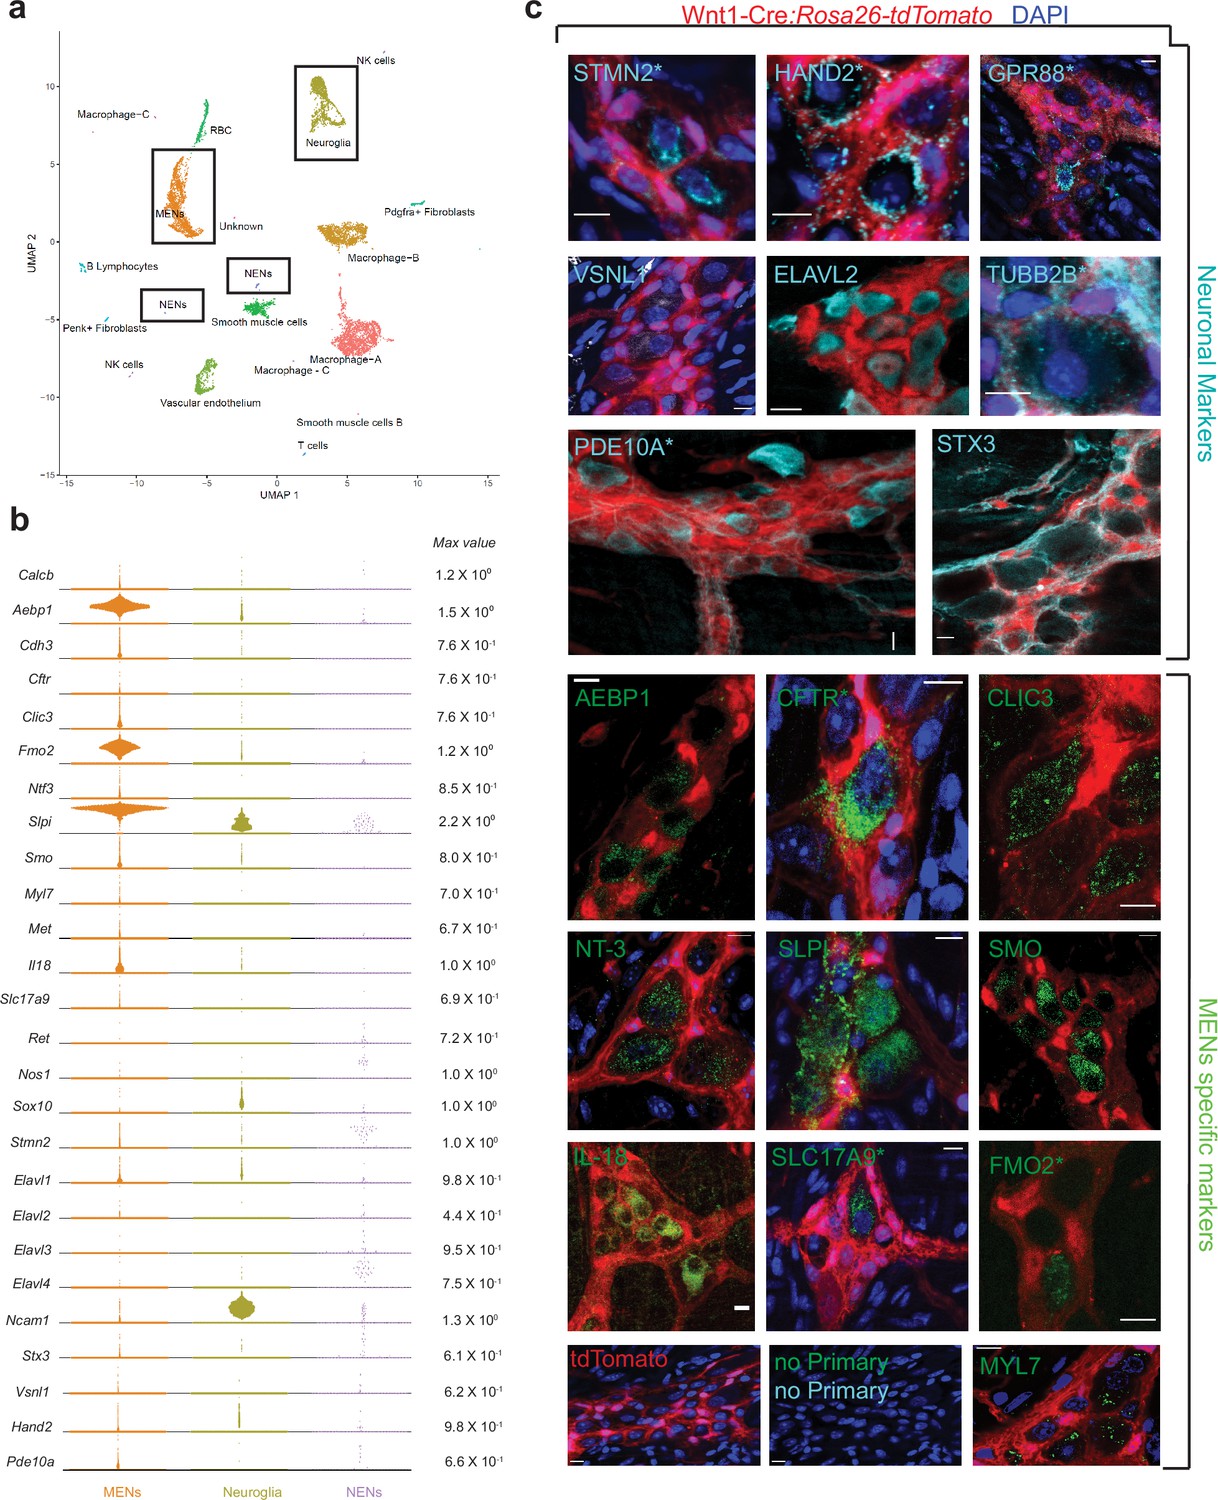
scRNAseq-analyses identifies the distinct transcriptomic profile of the MENs.
(a) UMAP representation of 11,123 sequenced high-quality cells that were identified as meeting a 200 UMI minimum threshold with a mitochondrial read ratio of less than 20%. Clusters were annotated by markers that were found to be cell-type specific by searching UniProt, Allen Cell Atlas and Pubmed databases. Cells of the neural crest lineage were then identified as NENs by their expression of neural crest marker gene Ret and Neuroglia by their expression of Ncam1 and Sox10, or as MENs by co-expression of Calcb (CGRP), Cdh3, and Met genes. (b) Visualization of expression of select MEN-specific and neuronal markers using quasi-violin plots. “Max value” represents the scale for the log-normalized expression of each gene. (c) Validation of the MENs-specific marker genes discovered in the scRNAseq analyses by immunohistochemistry and confocal microscopy of small intestinal LM-MP from adult male Wnt1-Cre:Rosa26 lsl-tdTomato mice. Expression of neuronal markers STX3, VSNL1, STMN2, HAND2, GPR88, PDE10A, ELAVL2, and TUBB2B (Gray, green arrows) was found in tdTomato- MENs. Immunostaining of the proteins AEBP1, CFTR, CLIC3, NT-3, SLPI, SMO, IL-18, SLC17A9, FMO2 and MYL7 (green; green arrows) was found to be localized to tdTomato- MENs. tdTomato+ (red) NC-cells did not immunostain for these markers (red arrows). Panel also shows tissue from Wnt1-Cre:Rosa26 lsl-tdTomato mouse with no primary controls (stained with AlexaFluor 488 and AlexaFluor 647 antibodies). Figures with * annotations are 2D representation of 3D stacks of images. Nuclei in some panels were labeled with DAPI (blue). Scale bar denotes 10 µm.
-
Figure 4—source data 1
Top expressed genes by the Calcb-expressing clusters and the putative MENs cluster in data from May-Zhang et al, along with top-expressed genes in the MENs cluster in our data.
Highlighted genes between MENs clusters from our data and data from May-Zhang et al and from Drokhlyansky et al show similar gene expression profiles between the clusters.
- https://cdn.elifesciences.org/articles/88051/elife-88051-fig4-data1-v1.pdf
Figure 4—figure supplement 1

scRNAseq metrics.
(a) MENs are significantly larger in size as compared to the NENs, as the mean Feret’s Diameter of the tdTomato-negative neurons (MENs) in Wnt1-Cre:Rosa26 lsl-tdTomato mice is significantly more than that of the tdTomato+ NENs. Student’s t-test; p-value <0.01. (b, c) UMAP representation of sequenced cells generated from 10 X Genomics Chromium-derived libraries from the two mouse samples, taken from separate littermate adult male mice, shows similar representation of their cells across the various clusters. (d) Quasiviolin plot of expressed genes provide a comparison of important MEN-specific and neuronal genes between the NENs and MENs clusters in the adult ileal May-Zhang et al. dataset and the NENs, Neuroglial, and MENs clusters in our scRNAseq dataset. (e) Top genes that are pattern drivers for the four MEN-specific NMF patterns along with their gene weights. (f) The four MEN-specific patterns were together used to label a group of cells (True) that together showed increased usage of the MEN-specific patterns, when compared to other cell types (False) in the adult ileal snRNAseq dataset from May-Zhang et al., 2021. (g) Top-expressed genes in the group of cells (f) that showed higher utilization of the MEN-specific patterns, compared to other cells in the dataset. (h) Representation of the four MEN-specific NMF patterns in the UMAP of our data and the projection of the May-Zhang et al., 2021 murine ileal dataset and the entire gut mesenchymal single cell RNA seq dataset by Elmentaite et al., 2021 into the MEN-specific patterns highlights cell clusters that show higher usage of the four NMF patterns. Bottom row shows increasing usage of these patterns with age in the entire mesenchymal gut cell atlas data.
Figure 4—figure supplement 2
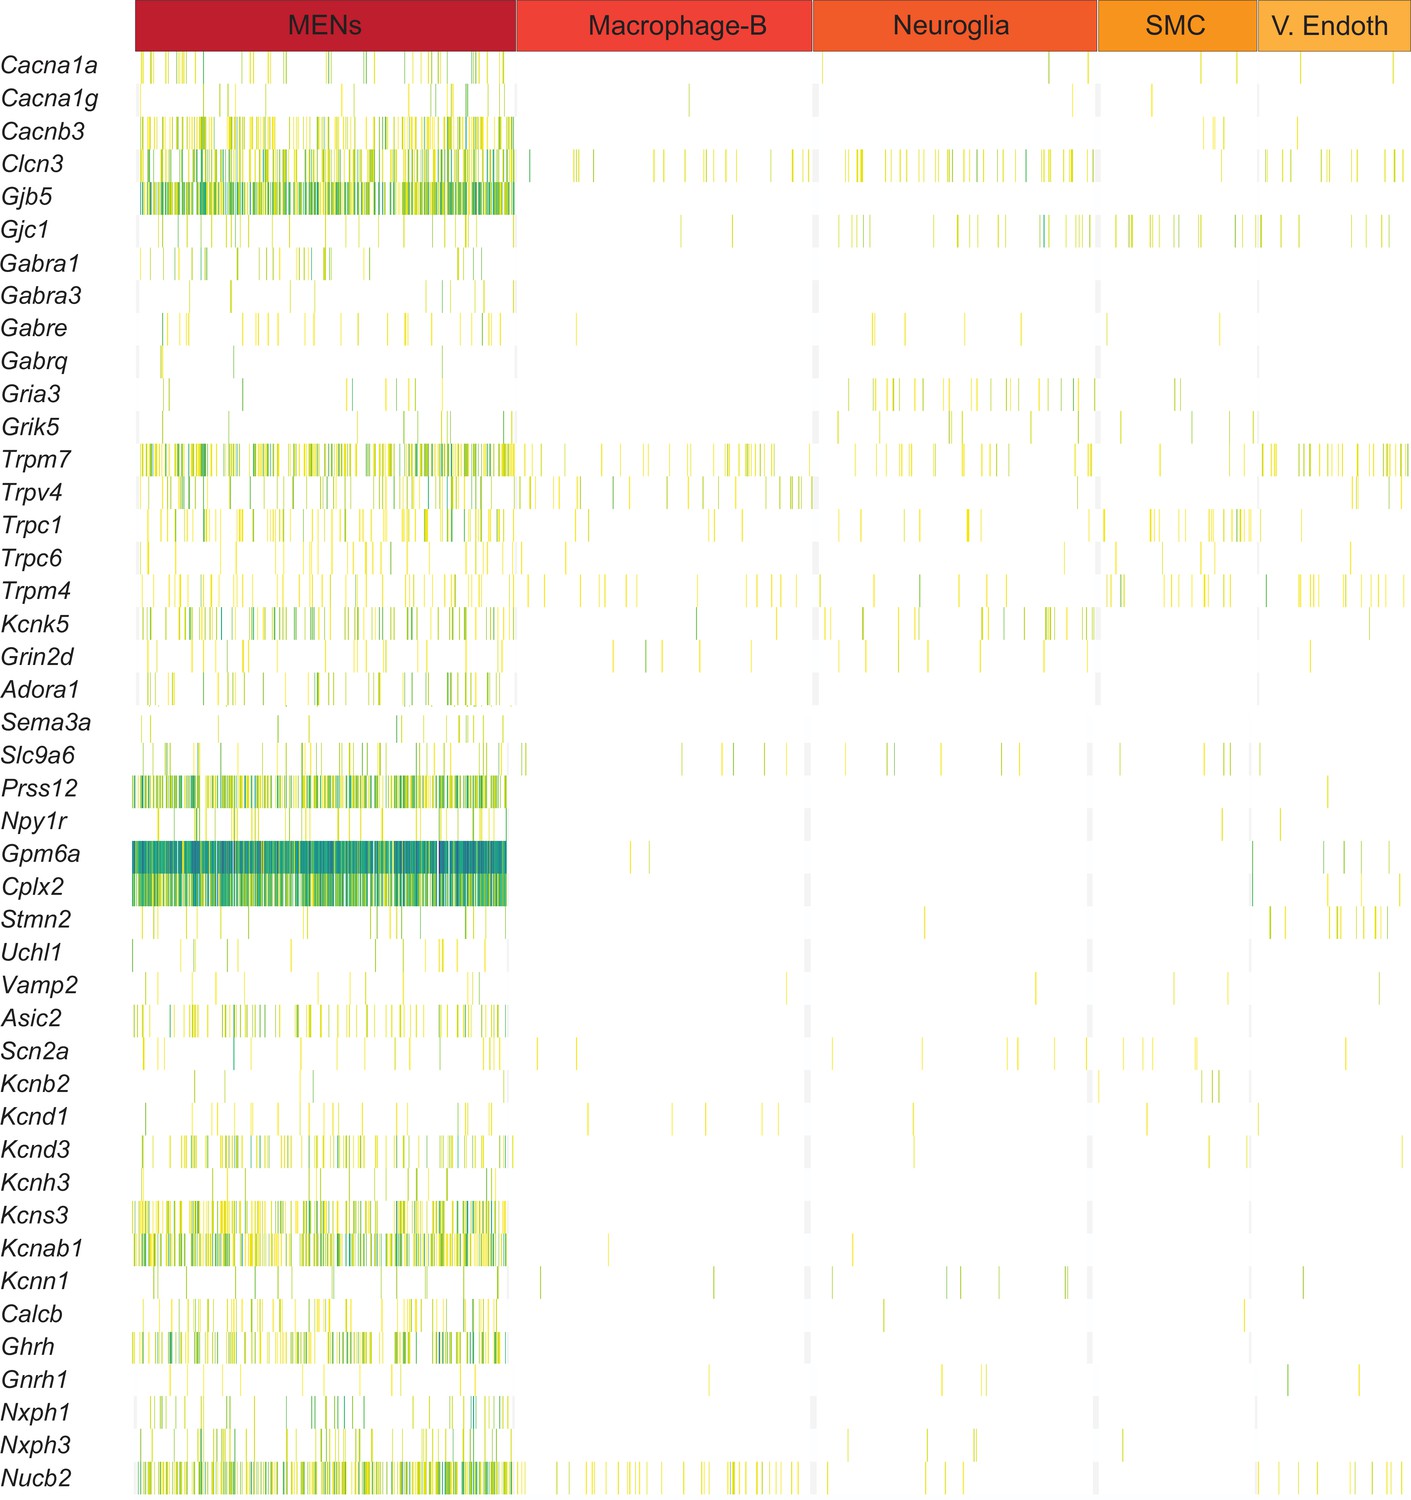
Expression of neuronally significant genes by MENs.
Sparklines plot of gene expression in various cell clusters, as revealed by single cell transcriptomics of diverse LM-MP cells from small intestinal tissue of two 6-month-old mice, show that expression of some genes is enriched in the MENs cluster, when compared to the other major clusters of cells in the dataset. Lower to higher expression in the plot is represented by yellow to blue gradient. Subsequent analyses shows that proteins coded by these genes are neuronally significant.
Figure 4—figure supplement 3
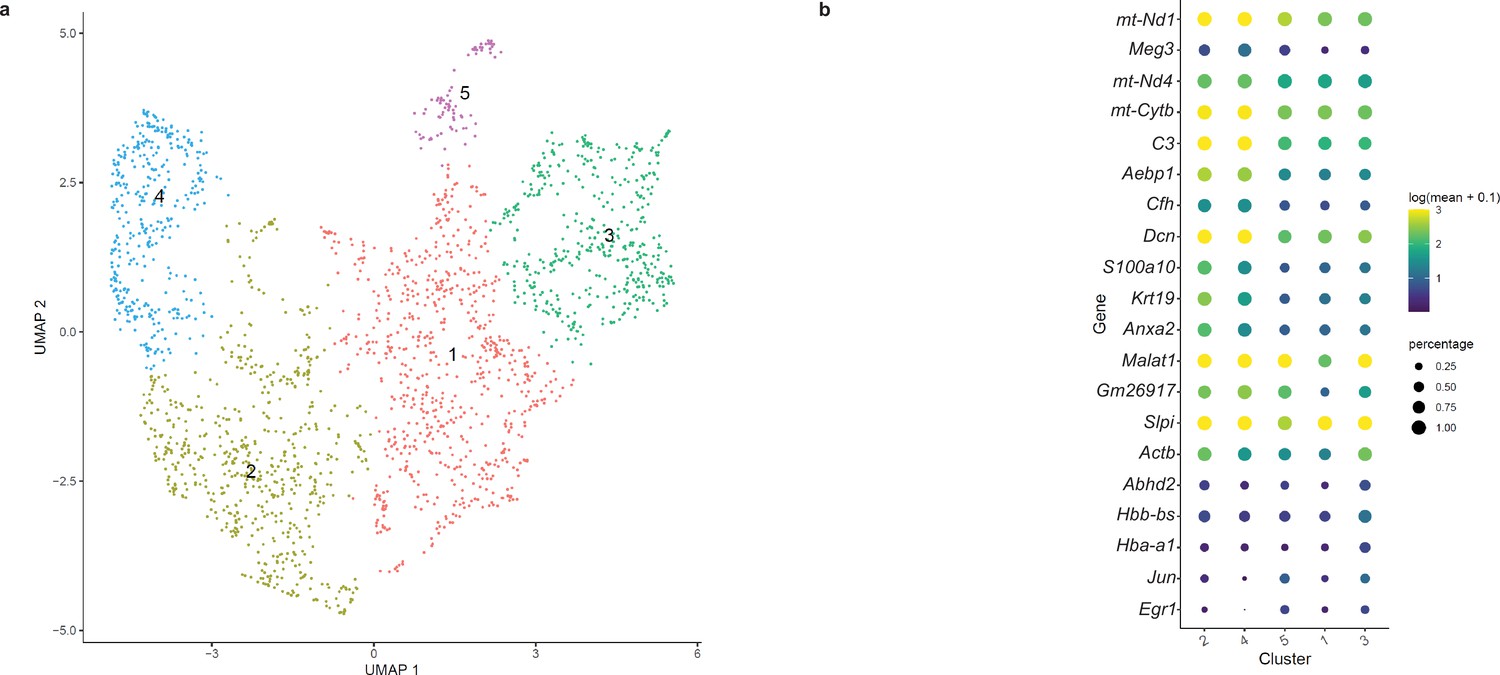
Sub-clustering MENs in the scRNAseq dataset generated from 6-month-old mice.
(a) Sub-clustering the MENs cluster from our scRNAseq dataset into five distinct clusters (b) was found to be not based on the expression of cluster-specific marker genes.
Figure 5 with 1 supplement
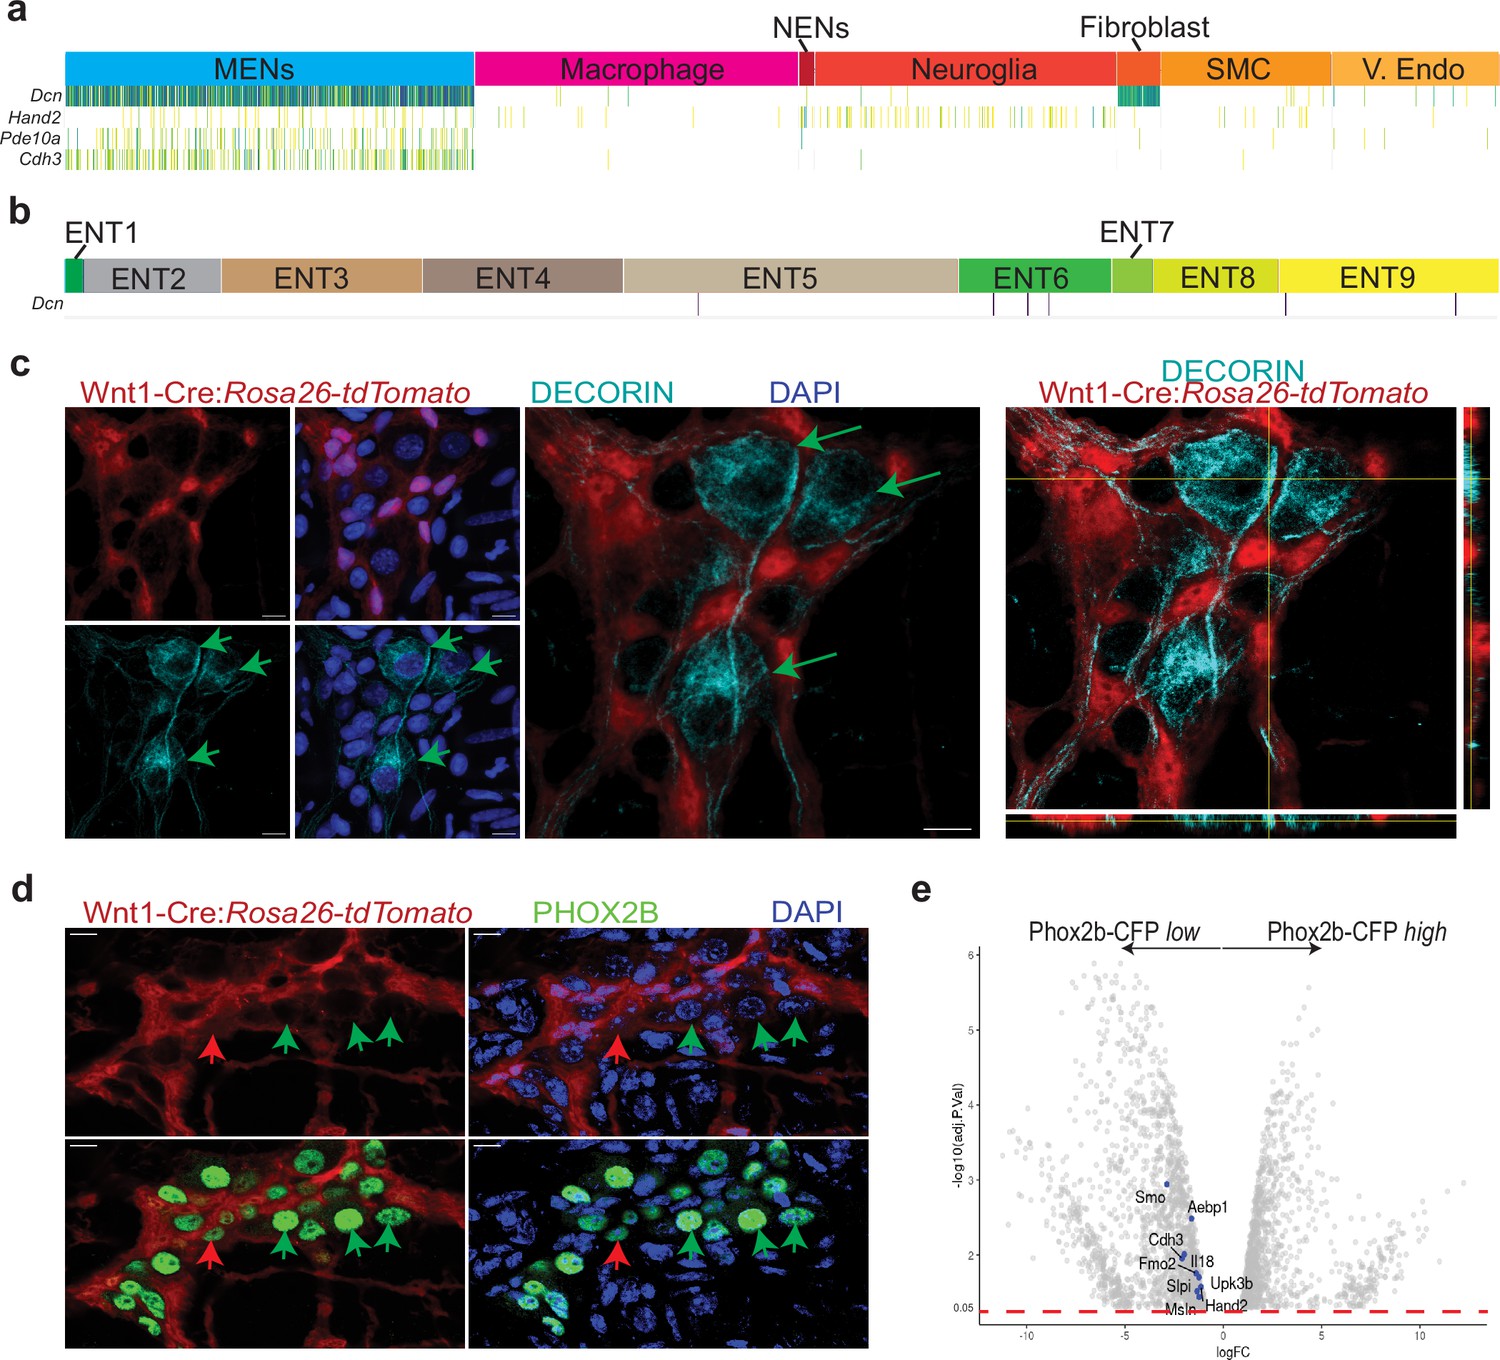
MENs express the mesenchymal gene Decorin and the ENS-specific gene Phox2b.
(a) Sparkline representation plot of the top 90 percentile of expressed genes in the various scRNAseq cell clusters from the adult murine LM-MP tissue of a 6-month-old mouse shows that the MENs cluster, which expresses the genes Cdh3, Pde10a, and Hand2, also expresses significant amounts of the mesenchymal gene Decorin (Dcn). Darker colors of the sparkline plot represent higher expression. (b) Sparkline representation plot of the neural crest-derived enteric neurons from the Zeisel et al. dataset shows that the Decorin gene is not found expressed by most neural crest-derived enteric neurons. (c) Two-dimensional representation views and orthogonal view of a myenteric ganglion from the small intestinal LM-MP of adult male Wnt1-Cre:Rosa26 lsl-tdTomato mouse, where tdTomato (red) is expressed by neural crest-derived cells, when immunostained with antibodies against DECORIN (grey) shows that the DECORIN-expressing myenteric cells (green arrows) do not express tdTomato and hence are non-neural crest-derived MENs. Nuclei are labeled with DAPI. Scale bar = 10 µm. (d) Representative image of a myenteric ganglion from the small intestinal LM-MP of adult male Wnt1-Cre:Rosa26 lsl-tdTomato mouse, where tdTomato (red) is expressed by neural crest-derived cells, when immunostained with antibodies against PHOX2b (green) shows that the PHOX2b-expression is found in myenteric cells that do not express tdTomato (green arrows, and hence are not neural crest-derived cells, or MENs) as well as in tdTomato-expressing neural crest-derived NENs (red arrow). Nuclei are labeled with DAPI. Scale bar = 10 µm. (e) Volcano plot of gene expression profiles of Phox2b-expressing cells, which were sorted based on their CFP expression level, shows that the expression of MENs marker genes Smo, Aebp1, Cdh3, Fmo2, Il18, Slpi, Upk3b, Msln, and Hand2 is significantly enriched in the Phox2b-CFPlow fraction. Red dotted line shows the padjusted value of 0.05.
Figure 5—figure supplement 1
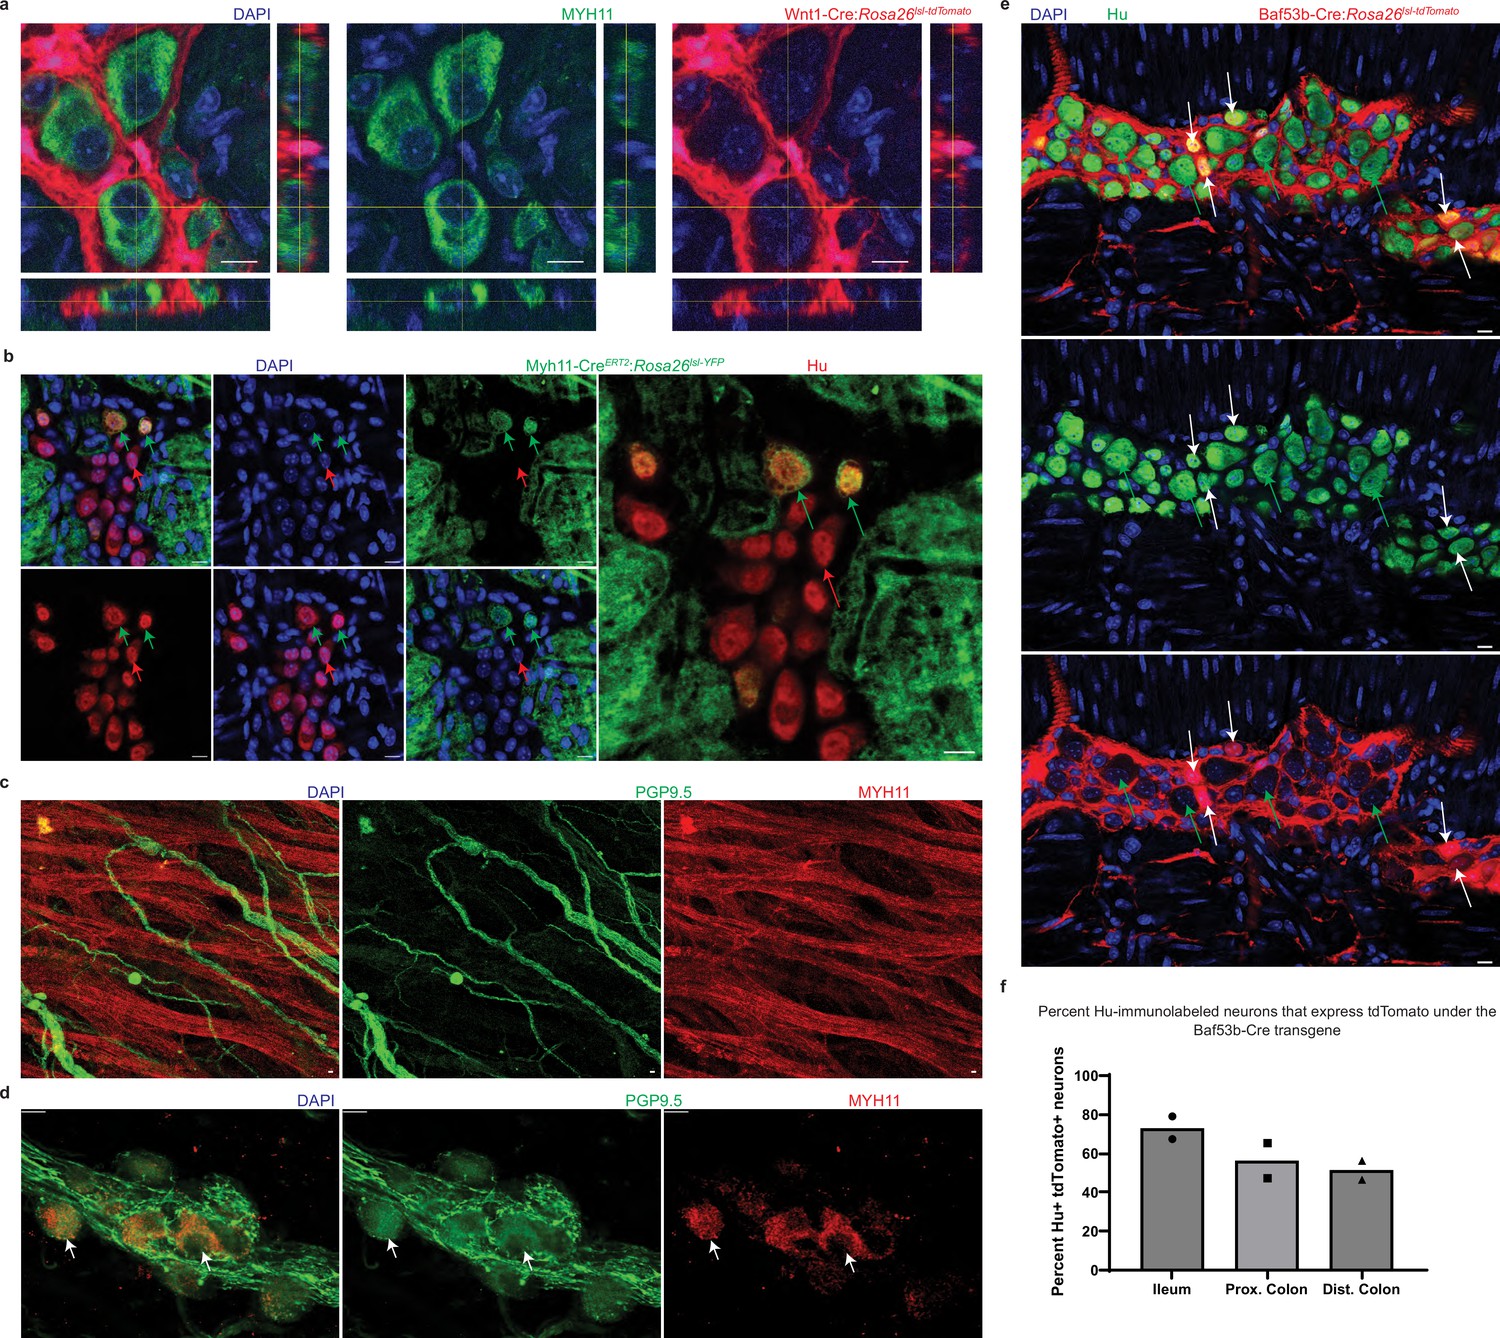
Expression of mesodermal marker MYH11, and reporter expression under the Baf53b-Cre transgenic line in post-natal myenteric neurons.
(a) Orthogonal views of a myenteric ganglion of an adult Wnt1-Cre:Rosa26 lsl-tdTomato mouse, where tdTomato (red) is expressed by neural crest-derived cells, shows that immunolabeling with a MYH11-specific antibody (green) labels tdTomato non-expressing cells. Nuclei are labeled with DAPI (blue). Scale bar denotes 10 µm. (b) Representative image of the myenteric plexus layer from a Myh11CreERT2:Rosa26lsl-YFP adult male mouse, which was dosed with tamoxifen for two consecutive weeks, and which when immunostained with antibodies against YFP/GFP (green) and the pan-neuronal marker Hu (red), shows the presence of YFP-expressing neurons (green arrows) in the myenteric ganglia that also contains YFP negative neurons (red arrow). Nuclei are labeled with DAPI (blue). Scale bar denotes 10 µm. (c) Immunostaining of healthy human adult duodenal tissue with antibodies against the pan-neuronal marker PGP9.5 (green) and MYH11 (red), shows that in the circular muscularis layer of the tissue, MYH11 labels the smooth muscle and not the PGP9.5 immunostained nerve fibers and cell bodies. Scale bar denotes 10 µm. (d) Immunostaining of healthy human adult duodenal tissue with antibodies against the pan-neuronal marker PGP9.5 (green) and MYH11 (red), shows that in the myenteric ganglia, MYH11 immunolabels a subset of PGP9.5-expressing myenteric neurons (white arrows). Scale bar denotes 10 µm. (e) Representative image of a myenteric ganglion from a Baf53b-Cre:Rosa26lsl-tdTomato adult male mouse, where tdTomato (red) is expressed by Baf53b expressing cells or those derived from Baf53-expressing cells, when immunostained with antibodies against the pan-neuronal marker Hu (green), shows the presence of neurons that express tdTomato (white arrows) along with neurons that do not express tdTomato (green arrows). Nuclei are labeled with DAPI (blue). Scale bar denotes 10 µm. (f) Graphical representation of the proportions of tdTomato-expressing Hu+ myenteric neurons in the LM-MP tissue of two male P21 Baf53b-Cre:Rosa26lsl-tdTomato mice shows that myenteric ganglia from ileum, proximal colon, and distal colon contain significant proportions of neurons that do not express tdTomato under the Baf53b-Cre transgenic line.
Figure 6
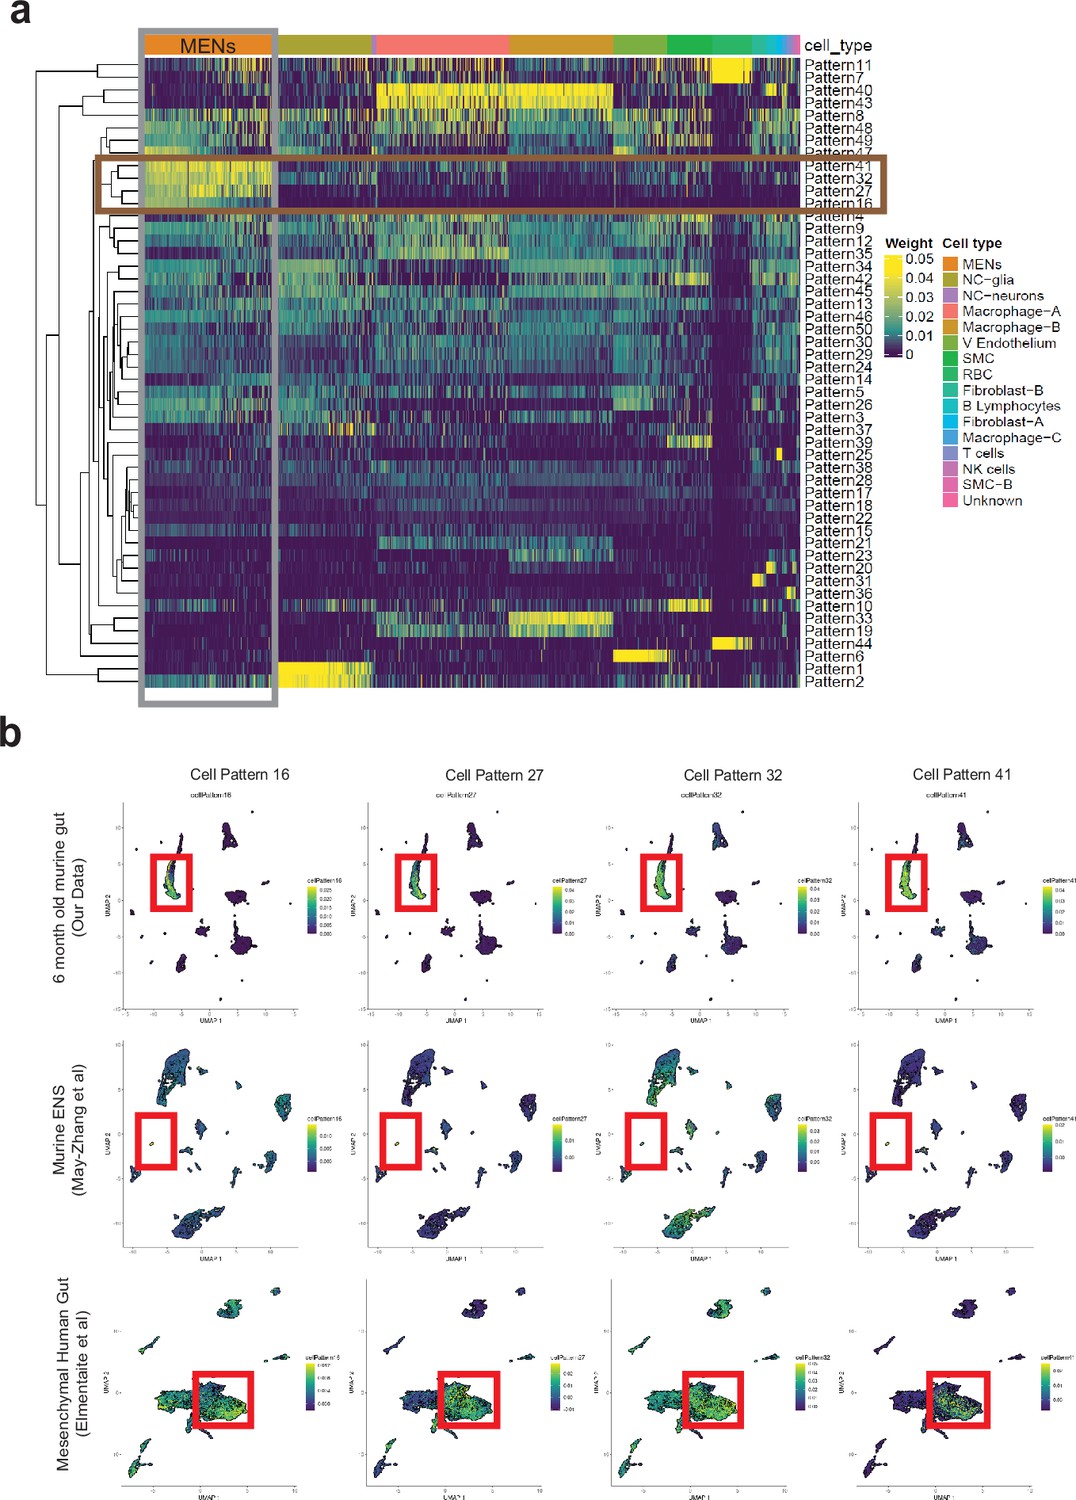
Computational analyses using projectR identifies MENs in publicly available murine and human transcriptomic datasets.
(a) Heatmap of cell weights for the patterns learned by NMF (k=50). Hierarchical clustering was calculated using Euclidean distance. Multiple clusters annotated as the same cell type are merged. The four most specific MENs patterns (16, 27, 32, and 41) are selected. (b) In addition to using the four MEN-specific NMF patterns to label the MENs cluster in our scRNAseq dataset (plots in top row), two other transcriptomic datasets: May-Zhang et al.’s murine ileal ENS snRNAseq dataset May-Zhang et al., 2021 (plots in second row), and Elmentaite et al., 2021 gut mesenchymal scRNAseq dataset (plots in third row), were projected into the defined four MEN-specific pattern space using ProjectR. Raw projected cell weights were visualized using previously learned UMAP embedding. The cell clusters that show high pattern usage are shown bounded by the red square. Plots in the final row shows projection of healthy post-natal mesenchymal cells from Elmentaite et al., 2021 into the four MEN-specific NMF patterns, which again show a population of cells showing high MEN-specific pattern utilization.
Figure 7
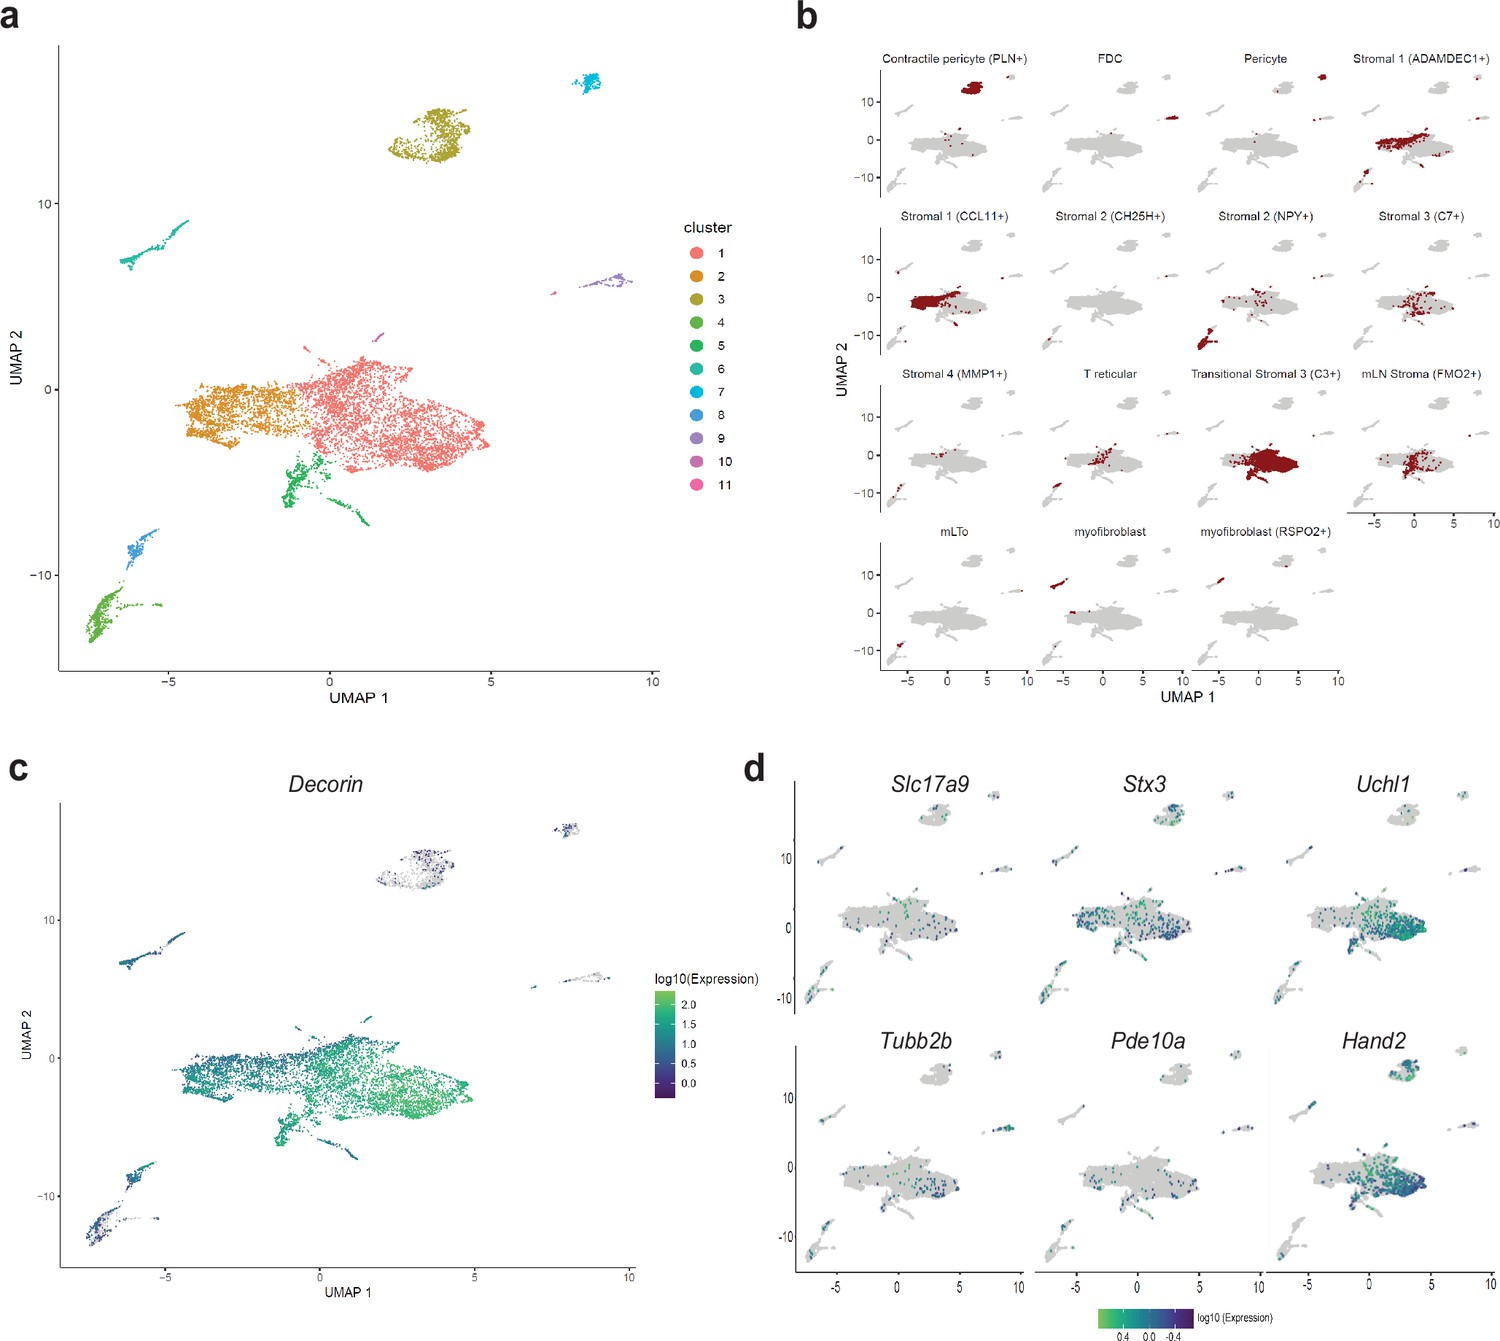
Detection of MENs in human single cell RNA sequencing data.
(a) UMAP representation of scRNAseq data from Elmentaite et al., 2021’s healthy post-natal mesenchymal cells from the human gut . (b) Breakdown for previously published annotated features of the post-natal health subset of the gut cell atlas as presented in Elmentaite et al., 2021. (c) Expression of the MENs marker gene Dcn in the UMAP representation of healthy post-natal data from Elmentaite et al., 2021., which was annotated as clusters of mesenchymal cells. (d) Expression of neuronal marker genes Slc17a9, Stx3, Uchl1, Tubb2b, Pde10a, and Hand2 in the UMAP representation of healthy post-natal data from Elmentaite et al., 2021, which was annotated as clusters of mesenchymal cells.
Figure 8
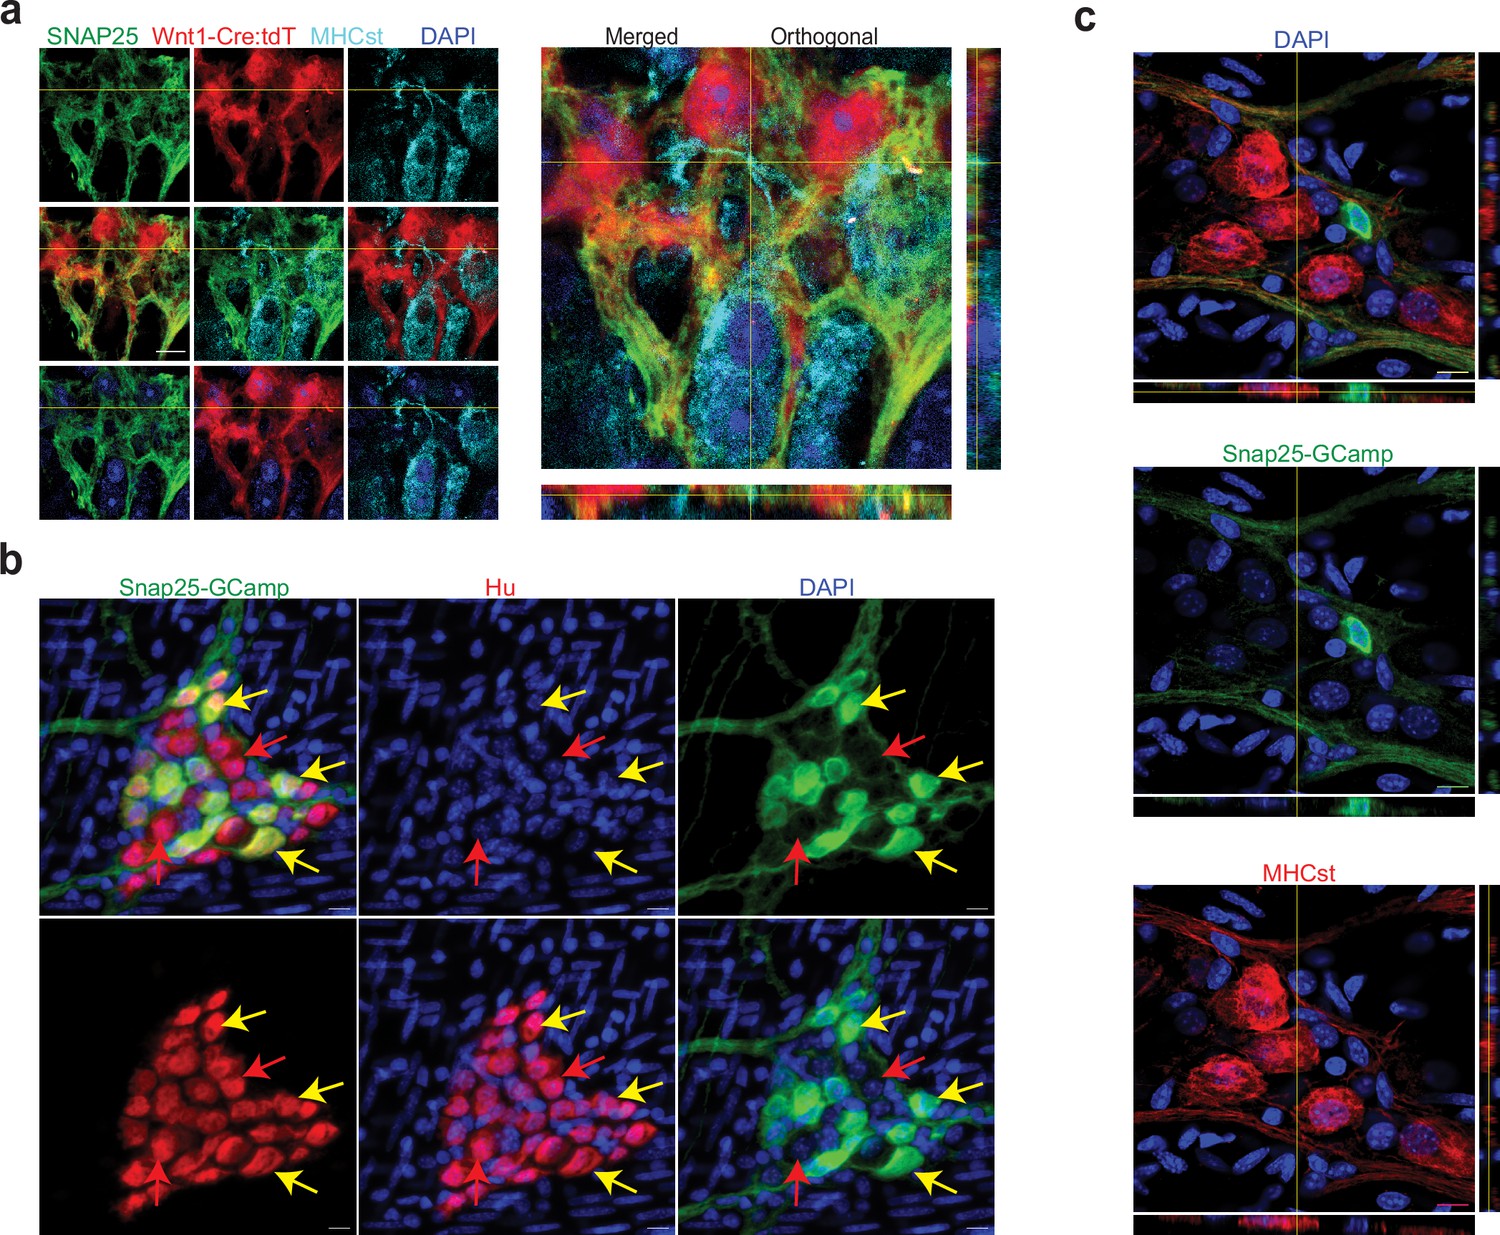
Validation of SNAP-25 as a NENs marker.
(a) SNAP-25 expression is restricted to the neural crest lineage in the adult myenteric ganglia. SNAP-25 expression (green) co-localizes with tdTomato (red) but not with the MENs marker MHCst (cyan) as observed in 2D and orthogonal views of a myenteric ganglia from a Wnt1-Cre:Rosa26 lsl-tdTomato mouse that was immunolabeled with antibodies against MHCst and SNAP-25. Nuclei were labeled with DAPI (blue). Scale bar denotes 10 µm. (b) In the adult male Snap25GcaMP knock-in mice, the expression of Snap25-GCaMP/GFP (green) is restricted to a subset of Hu-expressing (red) myenteric neurons in the adult murine small intestinal myenteric ganglia (yellow arrows), while many neurons (red arrows) do not show any detectable expression of Snap25. Nuclei were labeled with DAPI (blue). Scale bar denotes 10 µm. (c) Orthogonal views of z-stack of an image of the myenteric ganglion from the small intestinal LM-MP tissue from an adult male Snap25GcaMP knock-in mice shows that the expression of Snap25-GCaMP/GFP (green) is exclusive of the expression of the MENs marker MHCst (red). Nuclei were labeled with DAPI (blue). Scale bar denotes 10 µm.
Figure 9 with 1 supplement
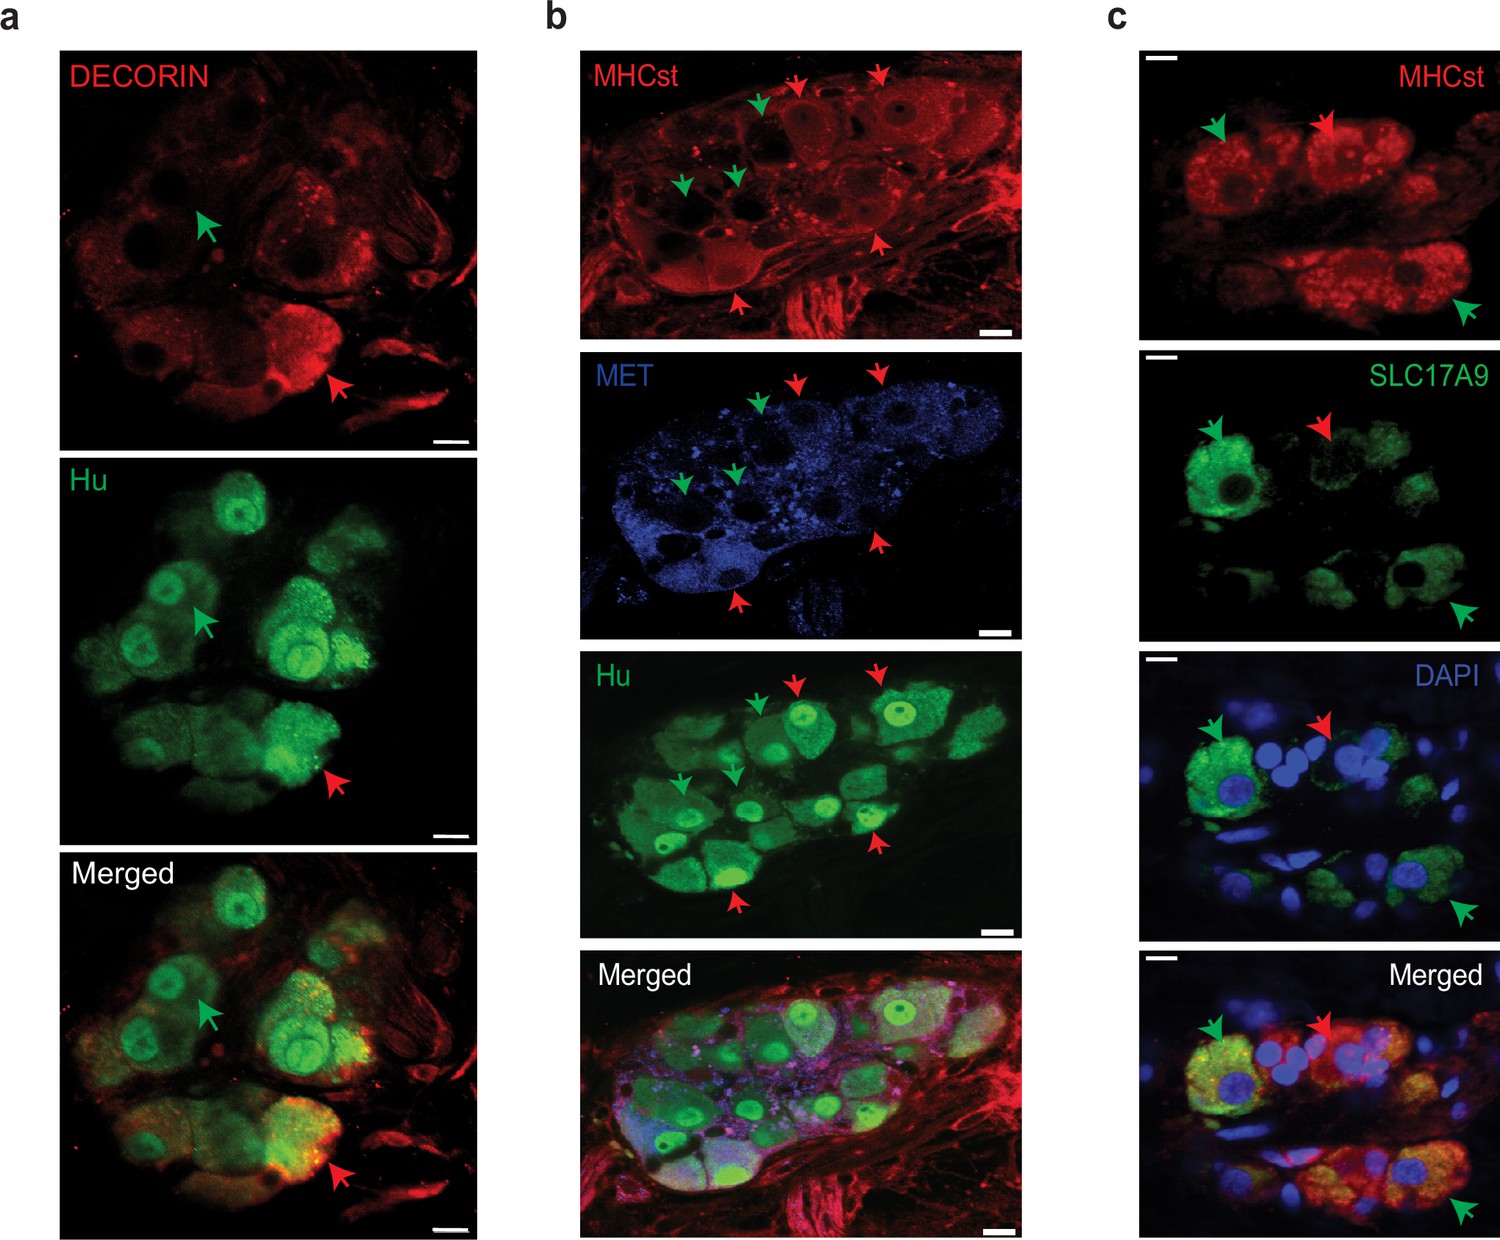
Observation of MENs marker expression in the adult human myenteric ganglia.
(a) Hu-expressing small intestinal myenteric neurons (green) from the normal human duodenal tissue, when immunolabeled with antibodies against the MENs marker DECORIN (red) identifies putative human MENs (red arrows) and NENs (green arrows) by presence or absence of DECORIN immunolabeling. Scale bar denotes 10 µm. (b) Hu-expressing small intestinal myenteric neurons (green) from the normal human duodenal tissue, when immunolabeled with antibodies against the MENs marker MHCst (red) and MET (blue) identifies putative human MENs (red arrows) and NENs (green arrows) by presence or absence of these MENs markers. Scale bar denotes 10 µm. (c) Immunolabeling myenteric tissue with antibodies against the MENs markers SLC17A9 (green, green arrows) and MHCst (red) shows SLC17A9 expression in a subset of MHCst-expressing (red) neurons. Subset of MHCst-expressing cells do not express SLC17A9 (red arrow). Nuclei are labeled with DAPI (blue) in the normal human duodenal tissue. Scale bar denotes 10 µm.
Figure 9—figure supplement 1

Putative mesoderm-derived enteric neurons (MENs) are present in adult human myenteric ganglia.
(a, b) The mesodermal specific markers, MET and MHCst are expressed by a subpopulation of human enteric neurons. Myenteric ganglia from normal duodenal tissue of two different adult human subjects express the pan-neuronal marker Hu (green), with distinct subpopulations positive and negative for MET (blue) and MHCst (red). MET and MHCst-expressing neurons (red arrows) in the human ENS are assumed to be MENs and those not expressing these MENs markers (green arrows) are presumably NENs. Nuclei are labeled with DAPI (gray). Scale bar = 10 µm. (c) The mesodermal specific marker DECORIN is expressed by a subpopulation of human enteric neurons. Myenteric ganglia from normal human duodenal tissue when immunostained with antibodies against the pan-neuronal marker Hu (green) and DECORIN (red) shows the presence of DECORIN-expressing myenteric neurons, which are assumed to be MENs. Nuclei are labeled with DAPI (blue). Scale bar = 10 µm. (d) Distribution of the various mesenchymal clusters of the post-natal healthy gut cell atlas data generated by Elmentaite et al., 2021 by donor age. For the age of each donor, the proportion of cells annotated as belonging to each cluster is shown. Proportions of Cluster 1 are observed to expand with age.
Figure 10 with 1 supplement
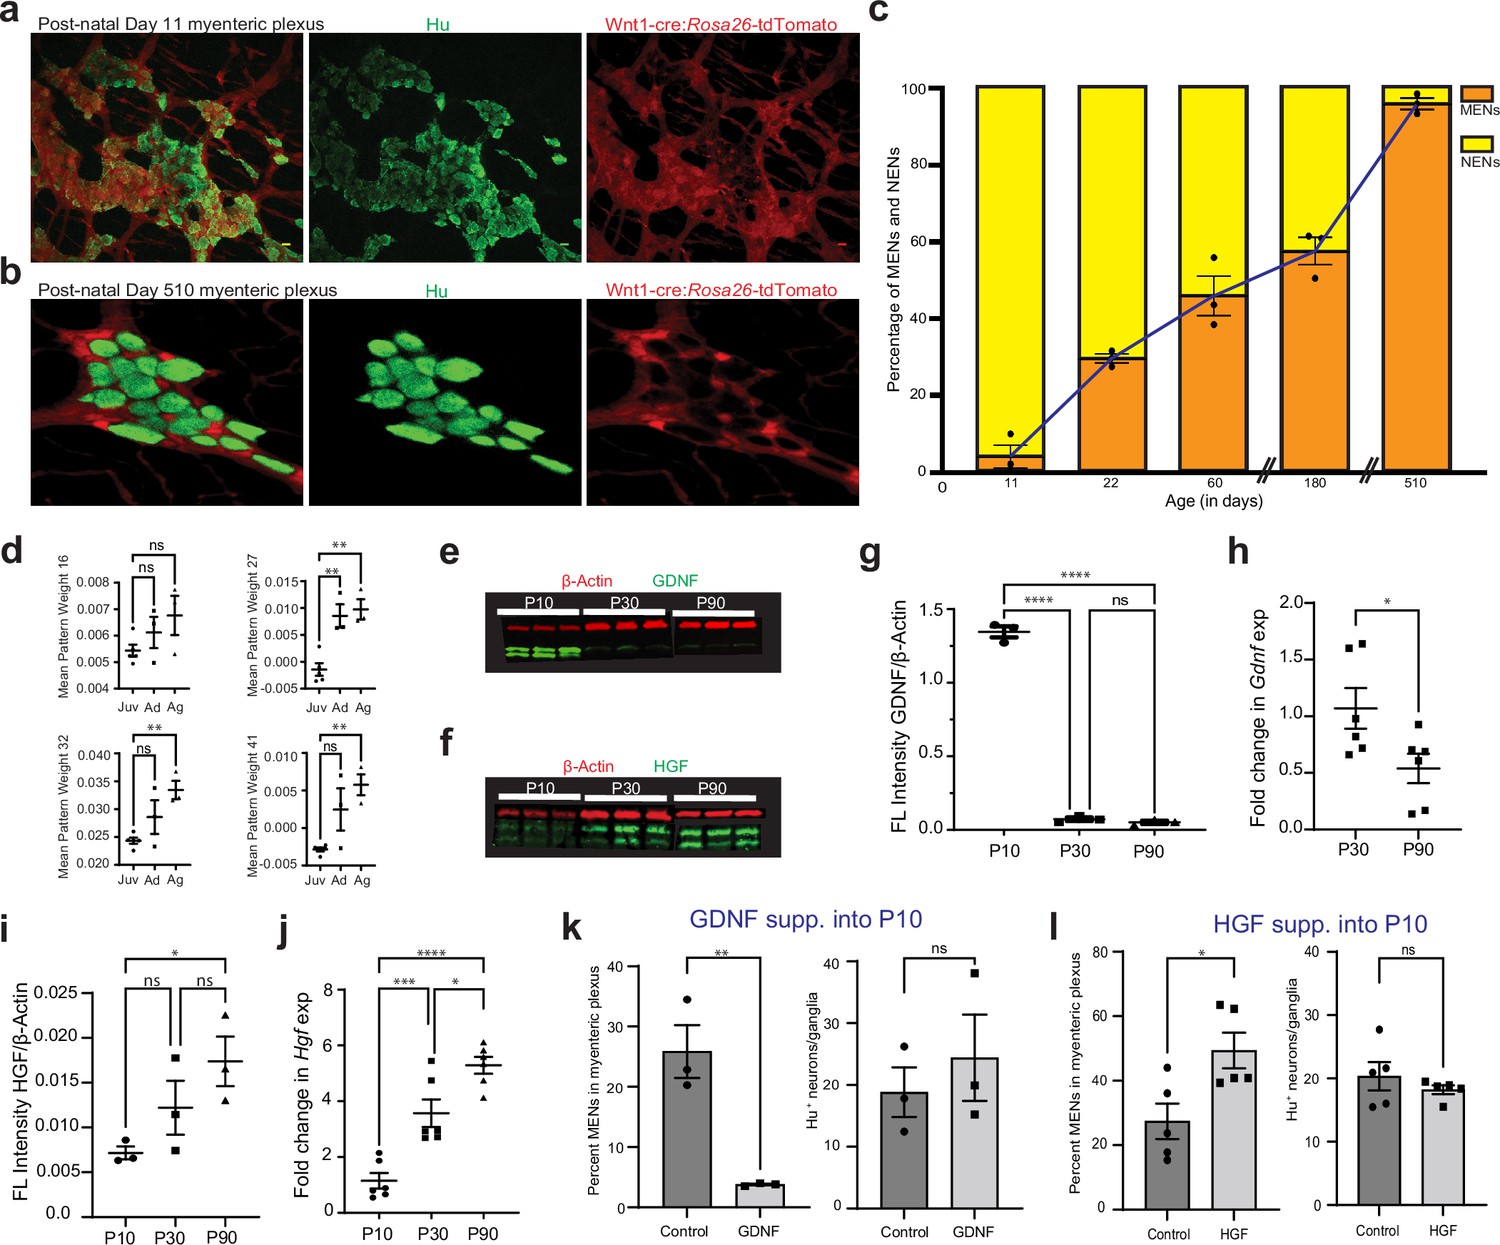
GDNF and HGF signaling regulate age-dependent changes in NENs and MENs proportions.
(a, b) Immunostaining myenteric plexus tissue from juvenile and mature Wnt1-Cre:Rosa26 lsl-tdTomato mice with antibodies against the pan-neuronal marker Hu (green). (c) Age-associated loss of NENs and gain of MENs in the small intestinal LM-MP of maturing and aging Wnt1-Cre:Rosa26 lsl-tdTomato mice. Data represent mean ± S.E.M. (d) Mean ± SEM of the four MEN-specific pattern weights in the human mesenchymal cell populations from Elmentaite et al., 2021, wherein data from age ranges of 4–12 years was clubbed together as Juvenile (Juv), data from age ranges of 20–50 years was clubbed together as Adult (Ad), and data from age ranges of 60–75 years was clubbed together as Aged (Ag). Every datapoint refers to mean projected pattern weight for cells within a defined age or age range, where Juv data comprise of ages 4, 6, 9, 10, 12 years; Ad data comprise of age ranges 20–25, 25–30, and 45–50 years; and finally Ag data comprise of age ranges 60–65, 65–70, and 70–75 years. One-way (ANOVA **=p < 0.01). (e) Western blot analyses of GDNF (green) and the house-keeping protein β-actin (red) expression in LM-MP tissues from mice of ages P10, P30, and P90. (n=3 mice per group; each sample is a biological replicate). Fluorescent intensities of the two bands of GDNF (that correspond to ~25 kD bands of protein marker) were quantified together. The lower band of GDNF is present only in the P10 tissues and disappears in P30 and P90 adult murine tissues. (f) Western blot analyses of HGF (green) and the house-keeping protein β-Actin (red) expression in LM-MP tissues from mice of ages P10, P30, and P90. (n=3 mice per group; each sample is a biological replicate). Fluorescent intensities of the two bands of HGF (that are between 50 kD and 37 kD bands of the protein marker) were quantified together. (g) The normalized fluorescent intensity of GDNF protein to house-keeping protein β-Actin compared between the three age groups. GDNF presence was highest in P10 group and was significantly reduced in P30 and P90 groups. Data represent mean ± S.E.M. One-way ANOVA **** p<0.001. (h) Age-dependent decrease in Gdnf mRNA transcript expression (normalized to the house-keeping gene Hprt) in the myenteric plexuses of P30 and P90 old mice. Data represent mean ± S.E.M. Student’s t-test *p<0.05. (i) The normalized fluorescent intensity of HGF protein to house-keeping protein β-Actin was compared between the three age groups. HGF expression significantly increased from P10 through P90. Data represent mean ± S.E.M. One-way ANOVA *p<0.05. (j) Age-dependent increase in Hgf mRNA transcript expression (normalized to the house-keeping gene Hprt) in the myenteric plexuses of P10, P30, and P90 old mice. Data represent mean ± S.E.M. One-way ANOVA * p<0.05, *** p<0.01, **** p<0.001. (k) Percent proportions of tdTomato- MENs and mean Hu+ neurons/ganglia in LM-MP of cohorts of Wnt1-Cre:Rosa26 lsl-tdTomato mice that were dosed with GDNF or Saline from P10 to P20 age. Data represent mean ± S.E.M. Student’s t-test ** p<0.01. (l) Percent proportions of tdTomato- MENs and mean Hu+ neurons/ganglia in LM-MP of cohorts of Wnt1-Cre:Rosa26 lsl-tdTomato mice that were dosed with HGF or Saline from P10 to P20 age. Data represent mean ± S.E.M. Student’s t-test * p<0.05.
-
Figure 10—source data 1
Western blot data of RET and GDNF proteins.
- https://cdn.elifesciences.org/articles/88051/elife-88051-fig10-data1-v1.pdf
-
Figure 10—source data 2
Western blot data of HGF protein.
- https://cdn.elifesciences.org/articles/88051/elife-88051-fig10-data2-v1.pdf
Figure 10—figure supplement 1

HGF and GDNF ratios in maturing and adult murine gut.
(a) Ratio of HGF:GDNF values in fluorescence intensities of their western blots (normalized to their own house-keeping protein Beta Actin) from the small intestinal LM-MP of post-natal mice at different ages during their maturation. (b) Ratio of HGF:GDNF expression values from the full thickness small intestinal tissue of adult mice taken from the Tabula muris database (Almanzar et al., 2020). (c) Analyses of human plasma proteome from 1025 individuals was performed by Sathyan et al., 2020 and the correlation of various plasma proteomes with aging was calculated. Of the genes that showed significant correlation with age (p<0.05), we found that the HGF levels in human plasma correlated positively with age (above 0), while the levels of GDNF and RET correlated negatively with age (below 0).
Figure 11 with 1 supplement
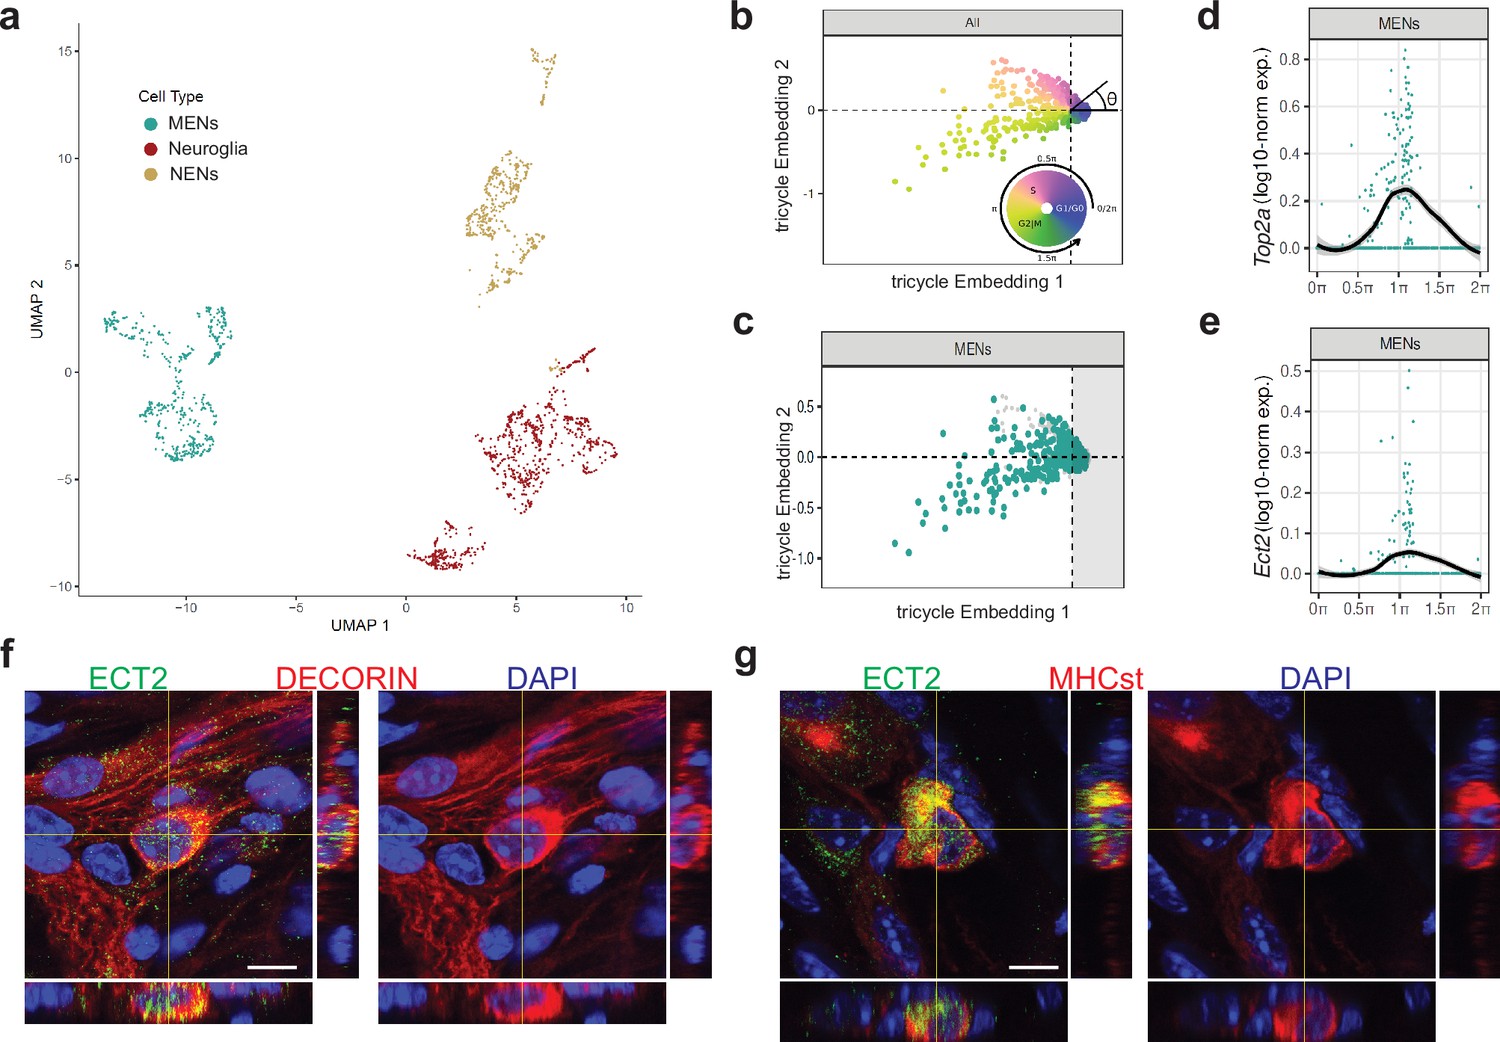
Ect2-expression labels a population of cycling MENs.
(a) UMAP representation of the cells of the MENs, NENs, and Neuroglia clusters from scRNAseq of cells from the small intestinal LM-MP tissue of two post-natal day 21 (P21) mice. (b) Tricycle analyses of ENS cell-types with their cell cycle positions. The continuous cell cycle position (theta) is measured as the angle from the origin. Anti-clockwise representation of cells that are represented between 1.5π and 0.5π space on the embedding are increasingly present within the quiescent G1/G0 cell cycle phase. In contrast, cells that are represented between the 0.5π and 1π space on the embedding are present within the S phase, and those within the 1π and 1.5π space are present within the G2M phase. (c) Cells within the P21 MENs cluster were projected into Tricycle software. 213 of the 504 P21 MENs were present between the 0.5π and 1.5π space on the embedding and hence were inferred to be undergoing cell cycling. (d, e) Expression of cell-cycle correlated genes Top2a and Ect2 in MENs shows significant expression of these two genes in cells of the P21 MENs cluster that are present between the values of 0.5π and 1.5π in the Tricycle embedding. Loess curve fittings (black) represent the dynamics of gene expression over the cell cycle (theta). Orthogonal views of small intestinal myenteric ganglia from a P21 wildtype mouse when immunostained with antibodies against ECT (green) and against MENs markers (f) DECORIN (red) and (g) MHCst (red), shows that ECT2 is expressed in a subset of MENs at this age. Nuclei are labeled with DAPI (blue). Scale bar denotes 10 µm.
Figure 11—figure supplement 1

Identification of the MENs cluster in the P21 scRNAseq data and expression of Ret in NENs and in the Ret heterozygous mice.
(a) UMAP representation of all the cell clusters generated from scRNAseq performed on all cells from the P21 murine LM-MP. (b) Projection of scRNAseq from the P21 murine LM-MP cells into the four MEN-specific NMF patterns generated using scRNAseq on 6-month-old murine LM-MP cells shows higher usage of the four NMF patterns in the putative MENs cluster in the P21 dataset (black arrow). (c) Expression of the genes Ret and Met in the MENs and NENs clusters in the scRNAseq of P21 LM-MP cells shows that while Met-expression is detected in both MENs and a subset of NENs, the MET-expressing NENs subset shows significant expression of Ret, while the MENs do not express Ret. (d) Sparklines plot of gene expression of various neuronally significant genes in the scRNAseq data from Zeisel et al., which was generated using flow sorted tdTomato+ cells from a P21 Wnt1-Cre:Rosa26 lsl-tdTomato mouse, shows that Met expression is observed in the clusters ENT6, 8, and 9 which also show expression of CGRP-expressing gene Calcb, the neural crest-specific gene Ret, Choline acetyltransferase-expressing gene Chat and the pan-neuronal marker PGP9.5-expressing gene Uchl1. (e) Fold change in transcript abundance of the gene Ret in the small intestinal LM-MP tissue from Ret wildtype (Ret WT) and Ret heterozygous (Ret Het) littermate adult mice shows that Ret transcripts are significantly less abundant in the tissue of Ret Het mice, when compared to those from Ret WT mice. Ret transcript expression in every sample was normalized to the expression of the house keeping gene Hprt. Student’s t-test; p-value <0.05.
Figure 12
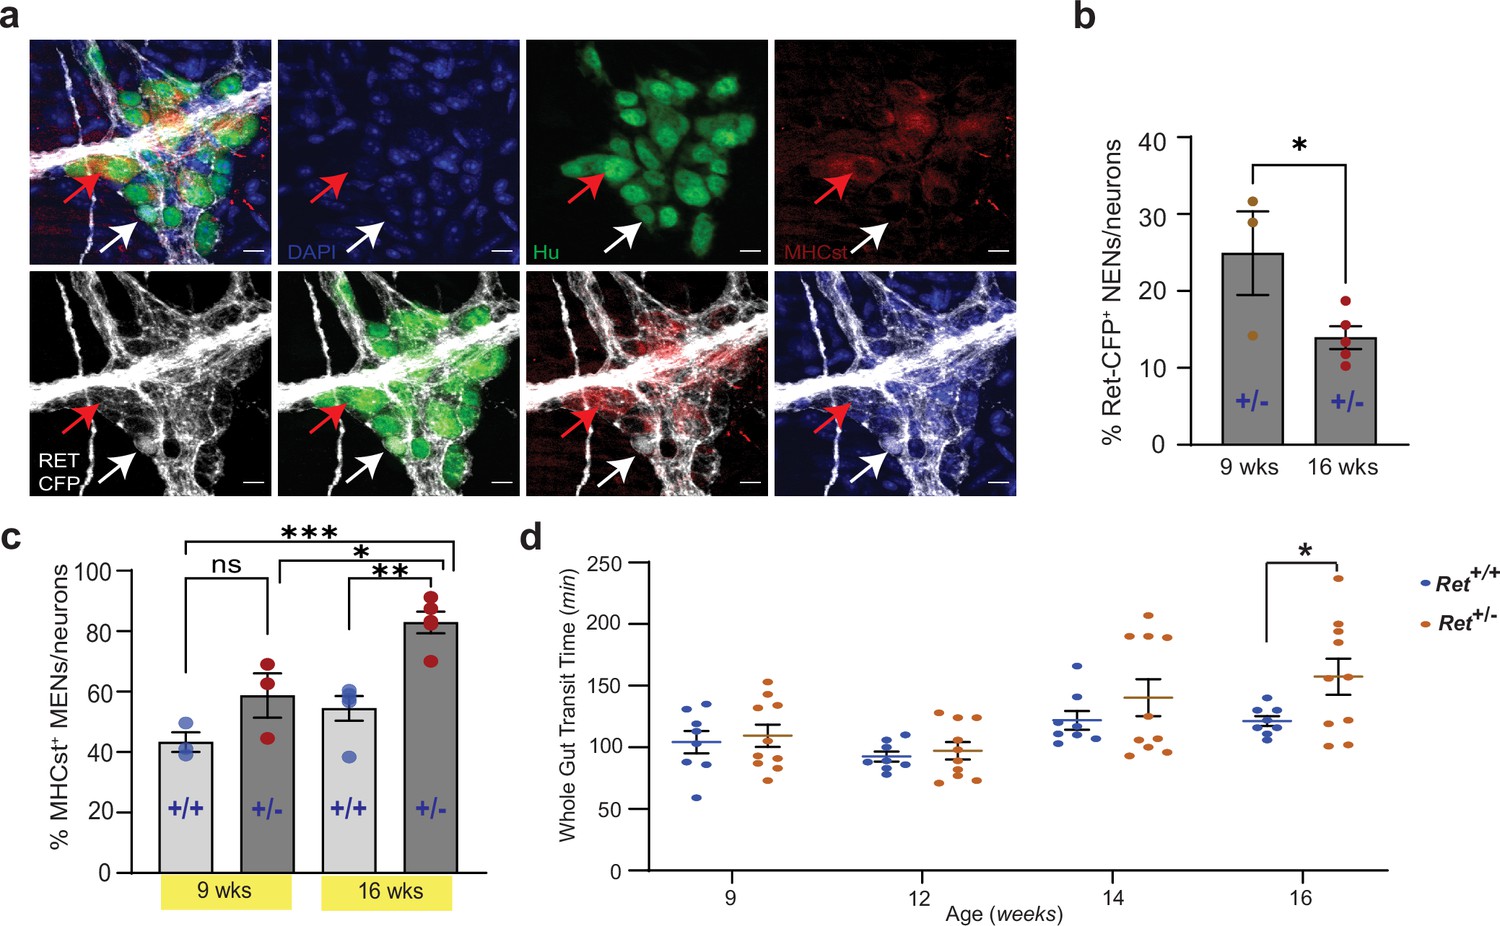
Reduced RET signaling accelerates ENS aging to cause pathology.
(a) Hu immunostaining (green) LM-MP tissues from 16-week-old Ret+/CFP (Ret+/-) mouse shows mutually exclusive expression of Ret-CFP (cyan, white arrow) and MHCst (red, red arrow) MENs. Nuclei are stained with DAPI (blue). Scale bar = 10 µm. (b) Quantification of Ret-CFP+ neurons from 9- and 16-week-old Ret+/- +/- show age-associated loss of Ret-CFP+ neurons. Data represent mean ± S.E.M. Student’s t-test * p<0.05. (c) Quantification of MHCst+ MENs shows significant increase in their proportions in Ret +/-mice but not in Ret+/+ mice with age. Data represent mean ± S.E.M. One-way (ANOVA * p<0.05, ** p<0.01, *** p<0.001). (d) Measures of whole gut transit time (WGTT) in cohorts of Ret+/- and Ret+/+ mice MENs show significant slowing of whole gut transit of Ret+/- +/- not Ret+/+ mice with age. Data represent mean ± S.E.M. One-way ANOVA *=p < 0.05.
Figure 13 with 1 supplement
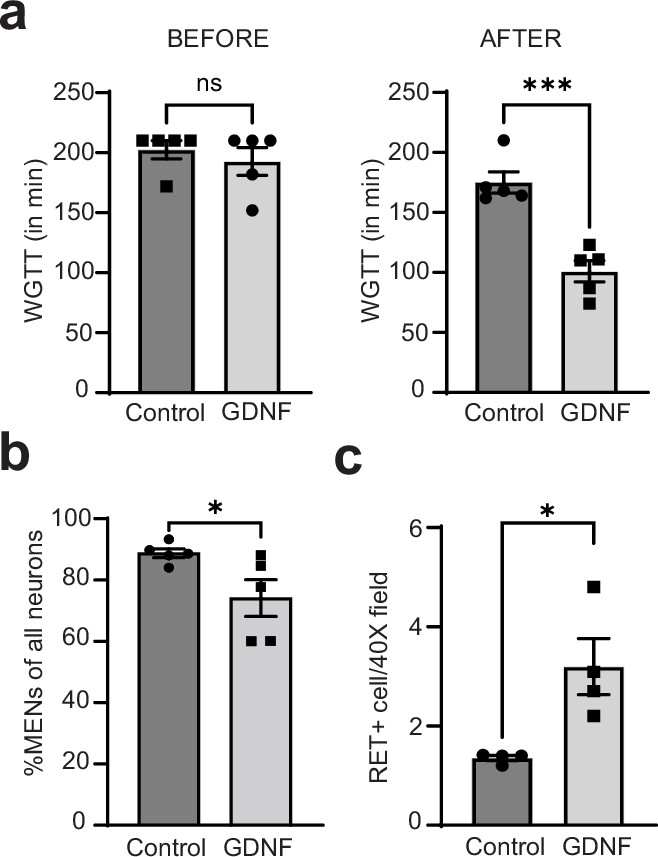
GDNF normalizes altered intestinal motility by increasing NENs proportions in the aging gut.
(a) Measures of whole gut transit time (WGTT) in GDNF (treated with GDNF) and Control (treated with Saline) cohorts of 17-month-old mice taken before the start of treatments and after the end of 10 consecutive days of treatment shows that the two groups are matched in their transit times before treatment, but GDNF treatment significant decreases average transit times when compared to the control cohort. Data represent mean ± S.E.M. Student’s t-test ***=p < 0.001. (b) Quantification of percent MHCst+ MENs per Hu-labeled neurons in myenteric ganglia in the GDNF and Control cohorts shows significant decrease in their proportions in GDNF-treated cohort but not in saline-treated control cohort. Data represent mean ± S.E.M. Student’s t-test ** p<0.01. (c) Quantification of numbers of RET+ NENs per 40 X field views of myenteric ganglia shows significant increase in their numbers in GDNF cohort mice when compared with Control cohort mice. Data represent mean ± S.E.M. Student’s t-test * p<0.05.
Figure 13—figure supplement 1
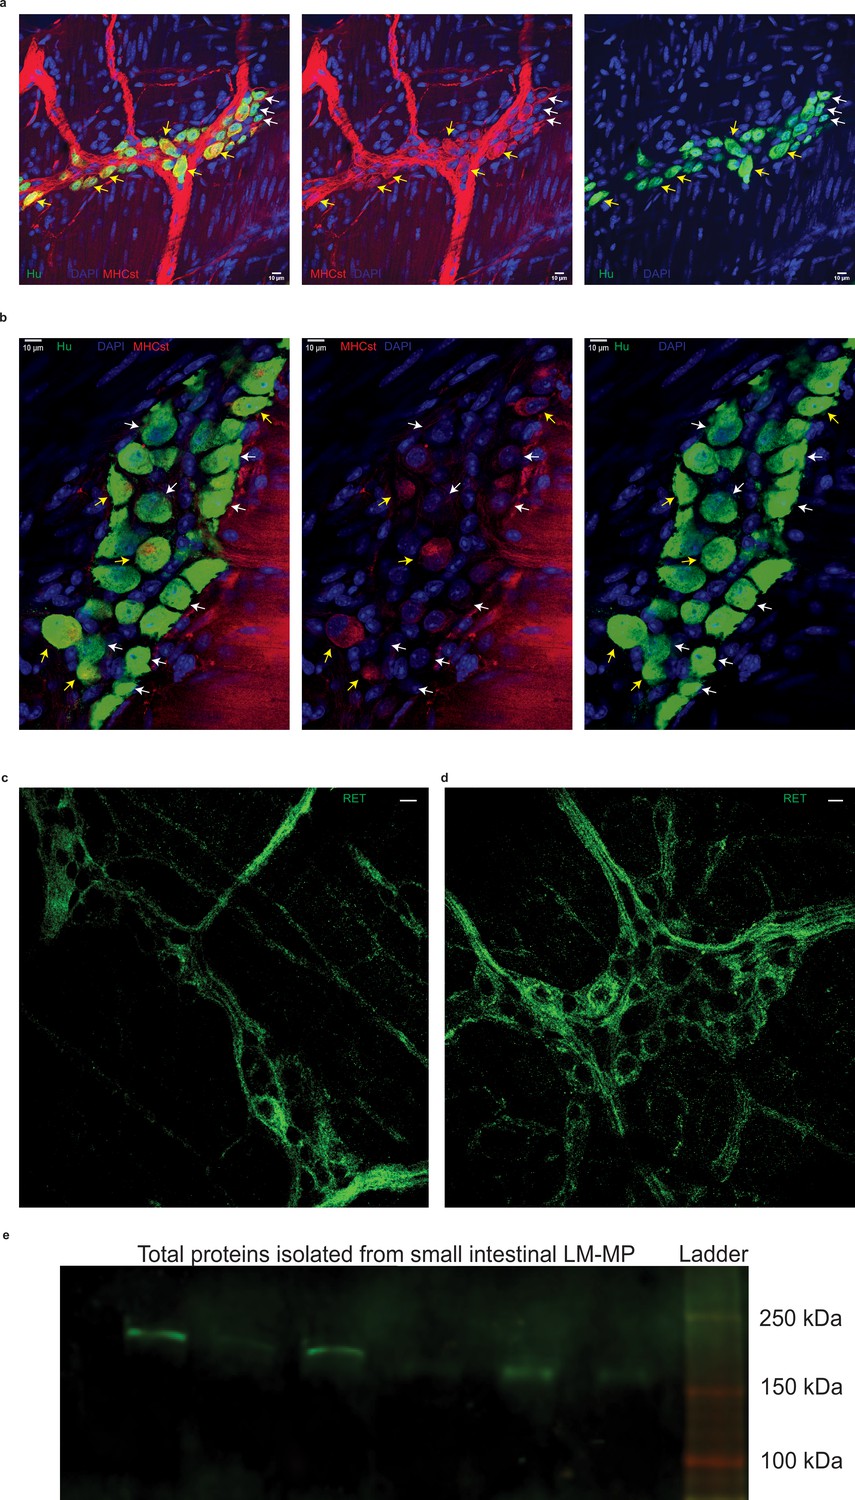
Effect of GDNF treatment on MHCst-expressing MENs and RET-expressing NENs in aging mice.
Representative image of MHCst (red) and Hu (green)-immunostained myenteric ganglia of (a) saline-treated control and (b). GDNF-treated 17-month-old mice show MHCst+ (yellow arrows) and MHCst- neurons. Note the reduction in MHCst-immunostaining on inter-ganglionic fibers in the 17-month-old mice when treated with GDNF, compared to control mice. Nuclei are stained with DAPI (blue). Scale bar indicates 10 µm. Representative image of RET-immunostained (green) myenteric ganglia of (c). saline-treated control and (d). GDNF-treated 17-month-old mice. Nuclei are stained with DAPI (blue). Scale bar indicates 10 µm. (e) Western blot image of a 4–20% gel performed using the RET antibody on total protein lysate from small intestinal LM-MP layer from post-natal mice shows the expected band between150 and 250 kDa of RET protein (source data available at Figure 10—source data 1).
Figure 14 with 1 supplement
Patients with chronic gut dysmotility show significant shifts in their normal proportions of the two neuronal lineages.
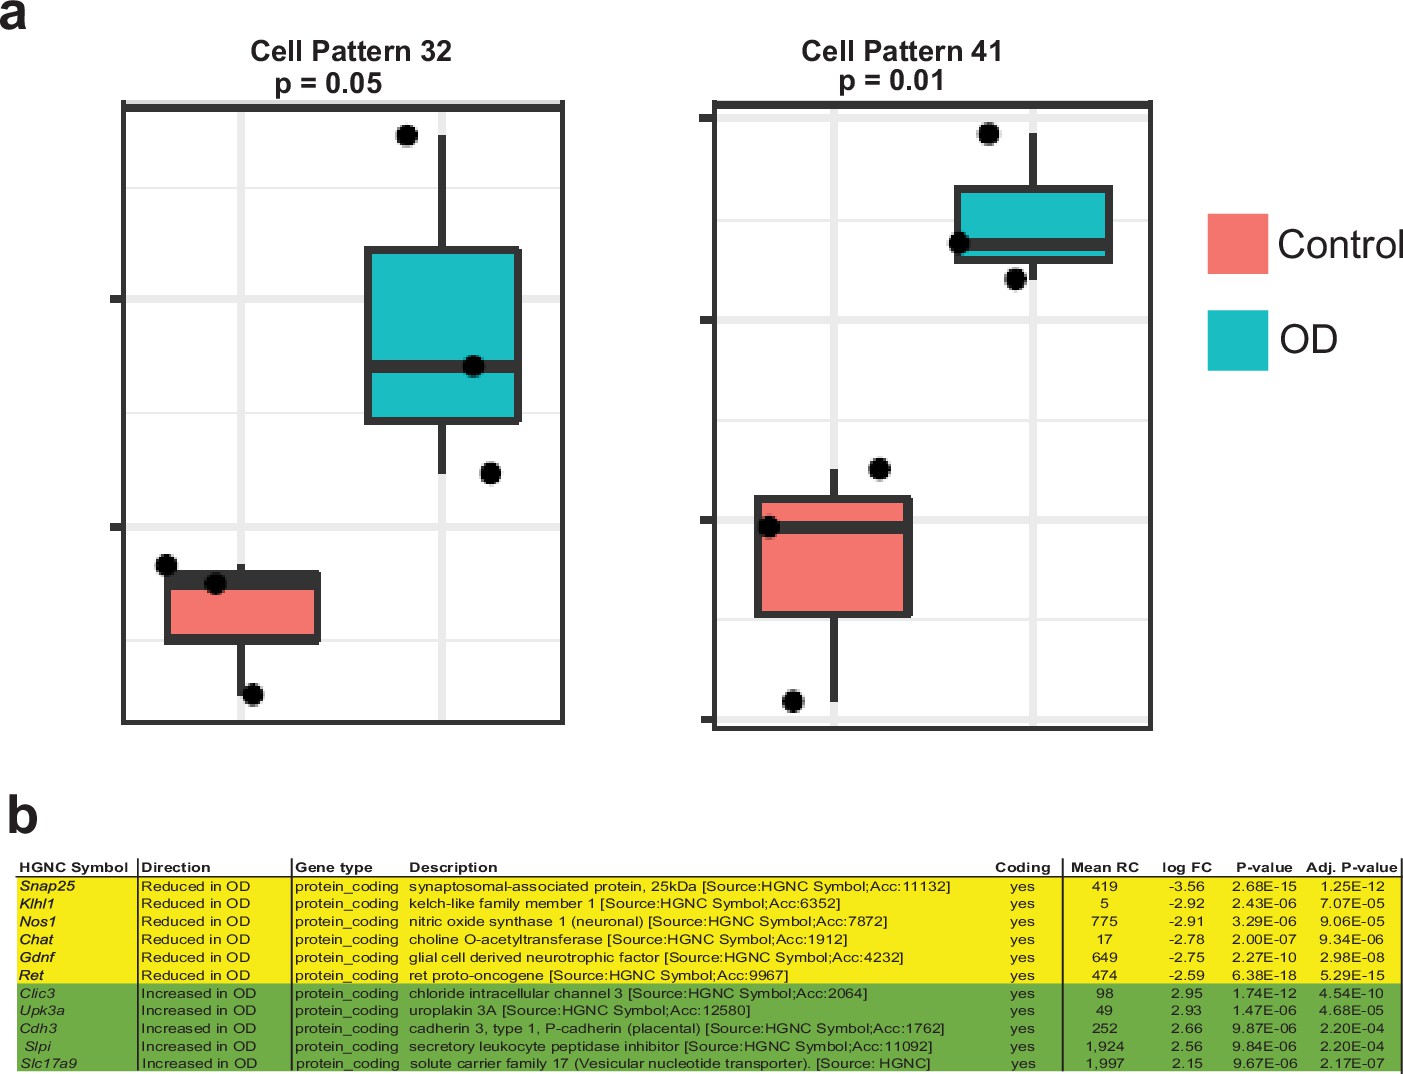
(a) ProjectR-based projection of bulkRNAseq data from intestinal specimens of patients with normal motility and patients with obstructive defecation (OD), a chronic condition of intestinal dysmotility, into the 50 different NMF patterns learnt earlier, shows that the MEN-specific NMF patterns 32 and 41 were significantly upregulated in bulk-RNAseq of OD patients compared to controls. Data represent mean ± S.E.M. One-way ANOVA. Data mined from raw data generated by Kim et al., 2019 (b) OD patients show a significant decrease in the expression of important NENs-associated genes such as Ret, Gdnf, Snap-25, Nos1, Klhl1, and Chat, while showing a significant increase in the expression of important MENs-specific genes such as Clic3, Upk3a, Cdh3, Slpi, and Slc17a9. Data taken from Kim et al., 2019.
Figure 14—figure supplement 1
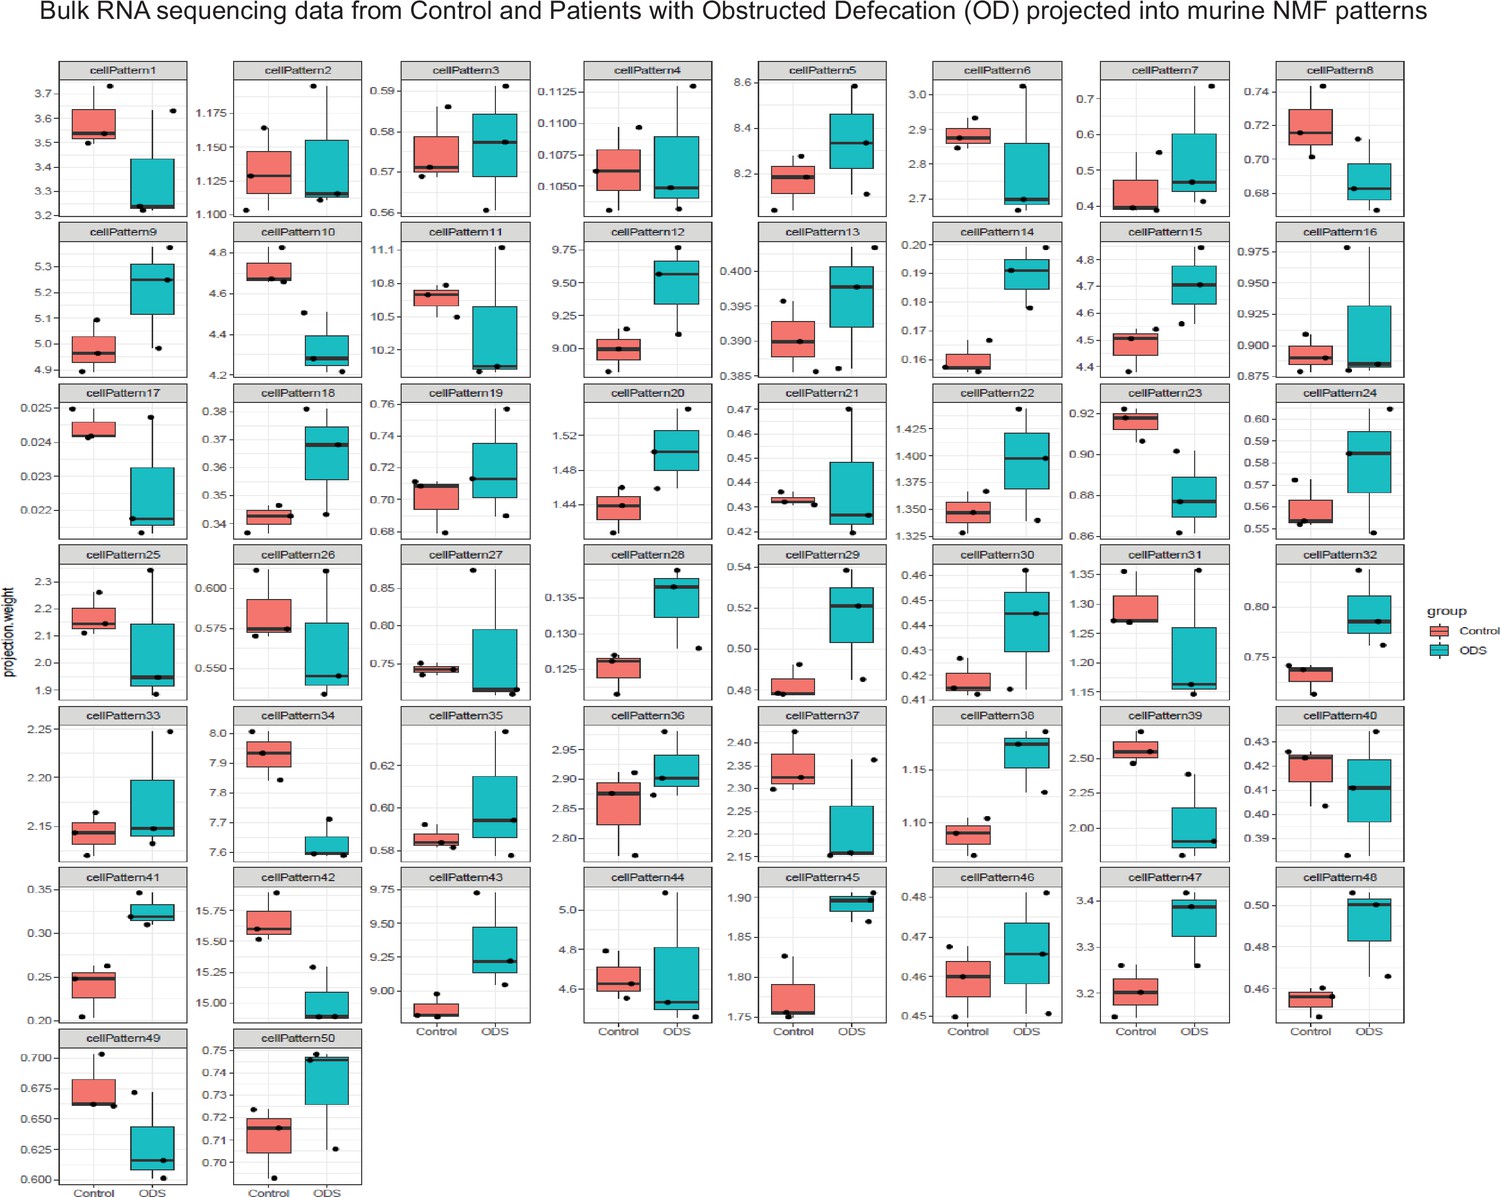
Projection of the bulk RNA sequencing data of intestinal tissue from Control and Patients with Obstructed Defecation into our murine scRNAseq-derived NMF patterns using projectR.
Transcriptomic data from intestinal tissues of patients with normal intestinal motility and those with obstructed defecation (OD) was procured from GEO (GSE101968). Non-negative matrix factorization (NMF), as implemented in the R package NNLM (https://github.com/linxihui/NNLM; Lin and Boutros, 2020), was performed on the murine scRNAseq data using k=50 and default parameters; and cell weights for each pattern were grouped. Using projectR, the log2 expression (log2(rpkm +1)) from the human bulk RNA sequencing data from control and OD patients were projected into the murine scRNAseq-derived NMF patterns. The mean projection weights from Control and OD groups were tested for statistically significant differences using Students’ t tests.
Additional files
-
Supplementary file 1
List of all the primary and secondary antibodies and TaqMan probes used in this study.
- https://cdn.elifesciences.org/articles/88051/elife-88051-supp1-v1.pdf
-
Supplementary file 2
Cluster-specific transcripts for the various clusters identified in the scRNAseq analyses of the P21 and the 6 month LMMP datasets.
- https://cdn.elifesciences.org/articles/88051/elife-88051-supp2-v1.xlsx
-
Supplementary file 3
Raw data of all experiments conducted and presented in this report.
- https://cdn.elifesciences.org/articles/88051/elife-88051-supp3-v1.pdf
-
Supplementary file 4
scRNAseq data metrics for various detected cell populations present in the various clusters in the two single cell RNA sequencing experiments presented in this study.
- https://cdn.elifesciences.org/articles/88051/elife-88051-supp4-v1.pdf
Download links
A two-part list of links to download the article, or parts of the article, in various formats.
Downloads (link to download the article as PDF)
Open citations (links to open the citations from this article in various online reference manager services)
Cite this article (links to download the citations from this article in formats compatible with various reference manager tools)
Age-associated changes in lineage composition of the enteric nervous system regulate gut health and disease
eLife 12:RP88051.
https://doi.org/10.7554/eLife.88051.2


