Correlated signatures of social behavior in cerebellum and anterior cingulate cortex
- Department of Neurology, DGSOM, University of California Los Angeles, United States
- The Lundquist Institute for Biomedical Innovation, Harbor-UCLA Medical Center, United States
- Department of Neurobiology, University of California Los Angeles, United States
- Department of Psychology, University of California Los Angeles, United States
- Department of Neurology, Harbor-UCLA Medical Center, United States
Figures
Figure 1 with 1 supplement
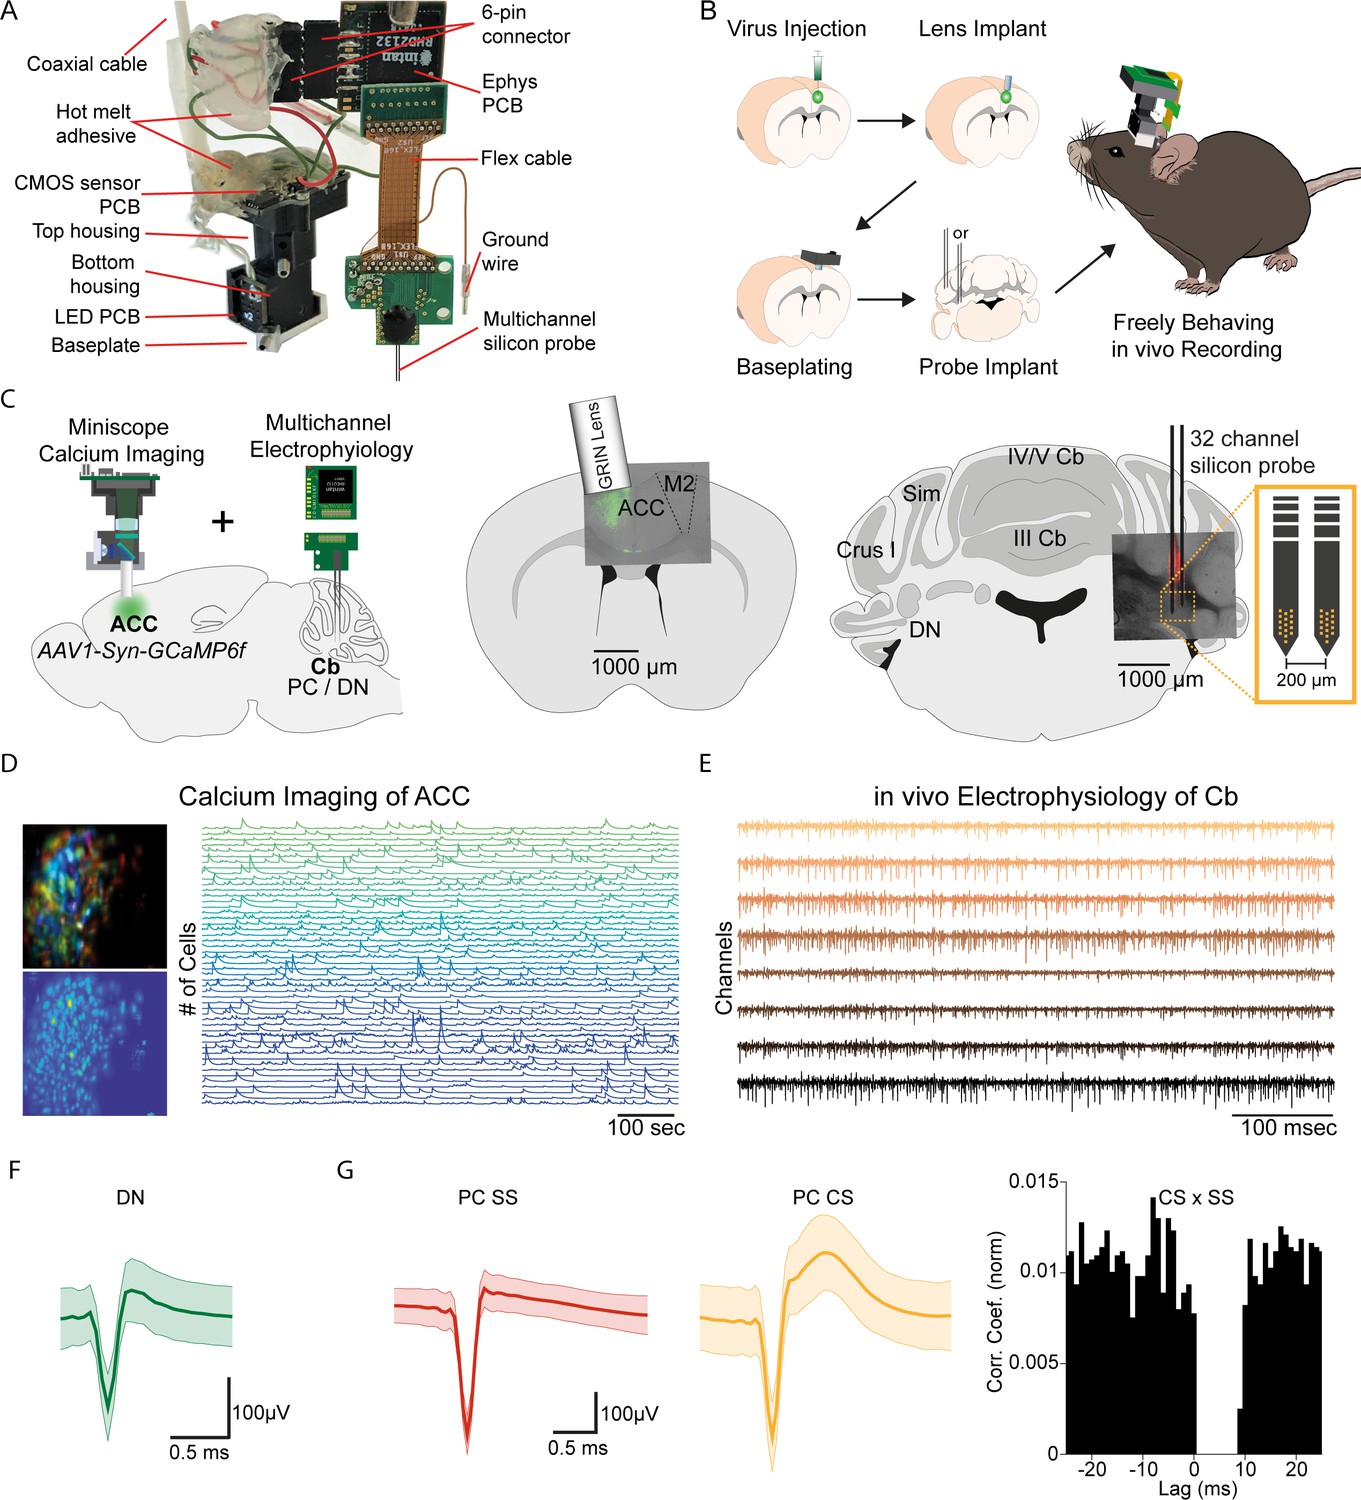
E-Scope: An integrated device allowing synchronous calcium imaging of anterior cingulate cortex and electrophysiological recordings in cerebellum.
(A) Photograph of E-Scope hardware. The multichannel silicon probe (32 channels) connects to the custom Ephys PCB. The Ephys PCB is connected to the CMOS sensor printed circuit board (PCB) of the Miniscope via a 6-pin connector. The electrophysiology and image data streams are both conveyed through the coaxial cable. (B) Illustration of the process for implanting the E-Scope. (C) Illustrations and photomicrographs showing the location of AAV1-Syn-GCaMP6f virus injection in anterior cingulate cortex (ACC) (left, mid) and multichannel probe implant in the dentate nucleus of the cerebellum (left, right). (D) Pseudo-color (top left) and averaged activity heatmap from calcium imaging ACC neurons segmented using CNMF-E (bottom left). Calcium signals from neurons are shown on the left (right). (E) in vivo extracellular electrophysiology recording of Purkinje cells (PCs) in the cerebellum (Cb). (F) Average spike waveform of a dentate nucleus (DN) neuron. (G) Average simple spike (SS) waveform (left) and average complex spike (CS) waveform (mid) of a PC. Cross-correlogram of simple spikes and complex spikes shows the pause in simple spike activity after a complex spike (right).
Figure 1—figure supplement 1

E-Scope’s hardware multiplexed data flow and Purkinje cell recording probe location.
(A) 2-shank 32-channel silicon probe wire bonded to a printed circuit board (PCB) that is joined to another slimstack connector mounted PCB via two layers of flex cable. (B) Custom electrophysiology amplifier PCB incorporating the Intan amplifier chip (front) and microcontroller unit (MCU) (back). Analog neuronal data is amplified and digitized (TD) and transferred along with SSC pixel clock data (PCLK), synchronous serial controller (SSC) frame. (C) Open-sourced UCLA V3 Miniscope Interface PCB. Conveys acquired electrophysiology and image data via single coaxial cable. (D) UCLA Miniscope data acquisition system receives multiplexed data where the electrophysiology data is split to the (E) SSC-2-Intan-LVDS PCB. The converted electrophysiology data is passed through the (G) Intan DAQ (RHD 2000 evaluation board). Image data from (D) and electrophysiology data from (G) is then acquired and saved in the (F) host computer. (H) Right Crus I Purkinje cell recording probe location (DiI).
Figure 2 with 4 supplements
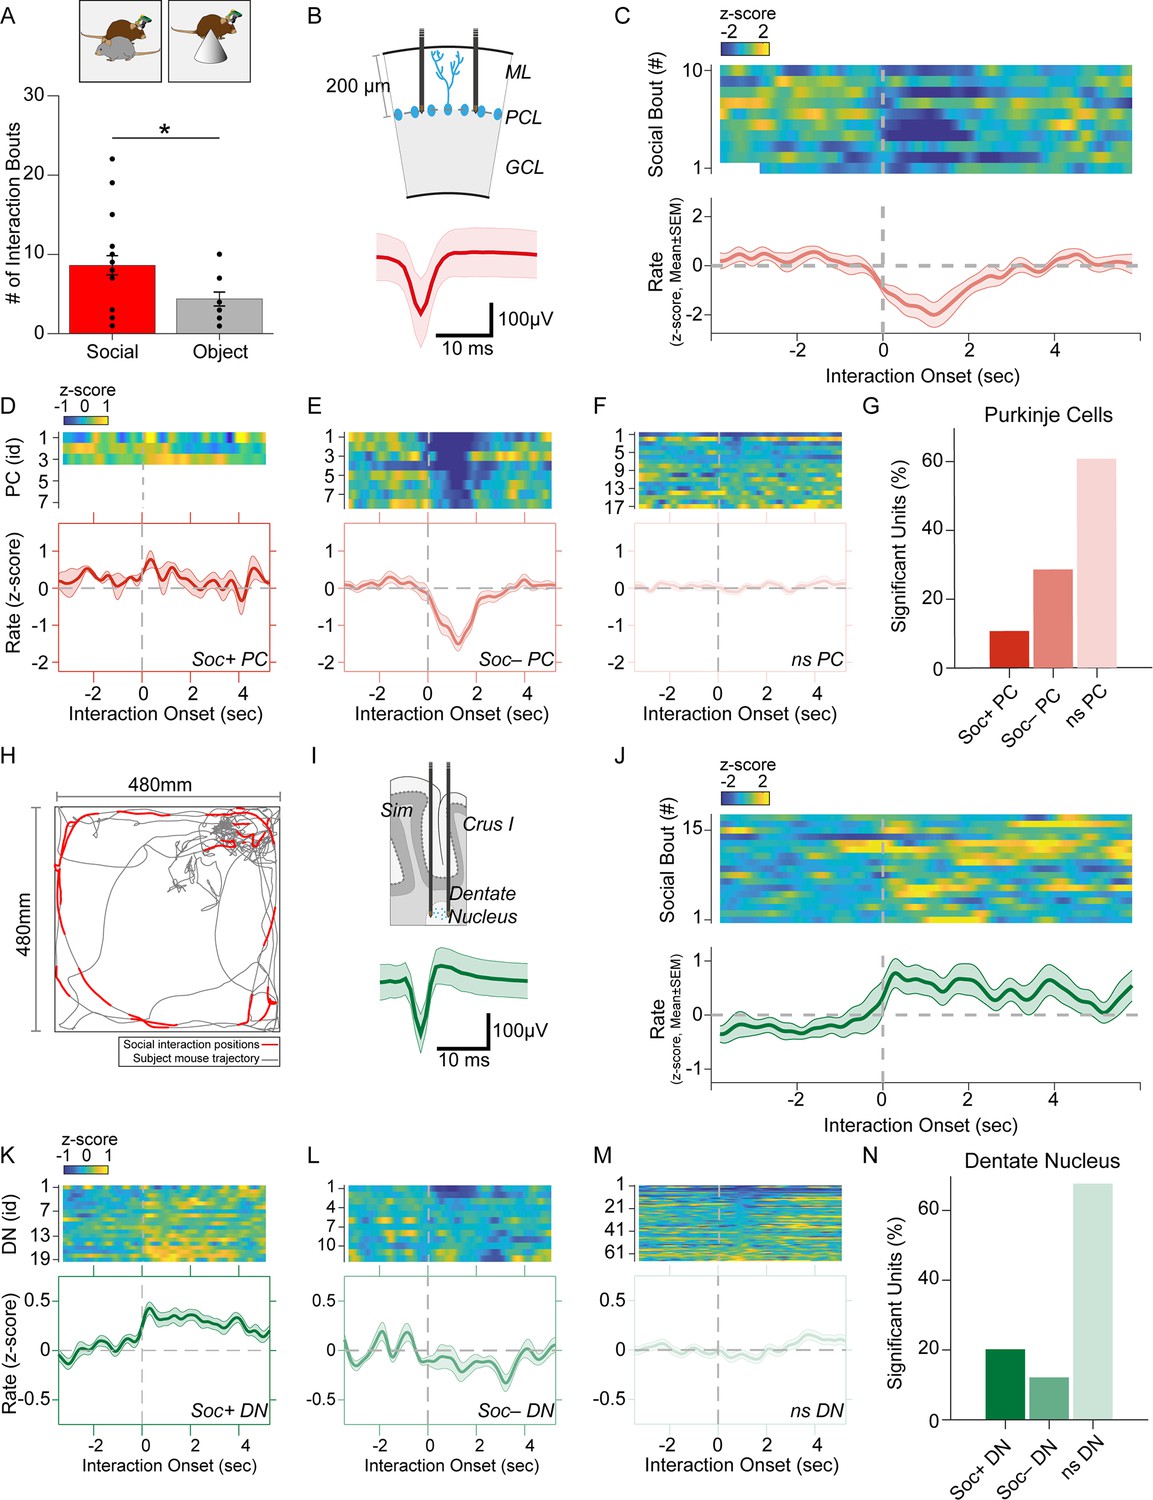
Purkinje cell and dentate nucleus neuron activity patterns during social behavior.
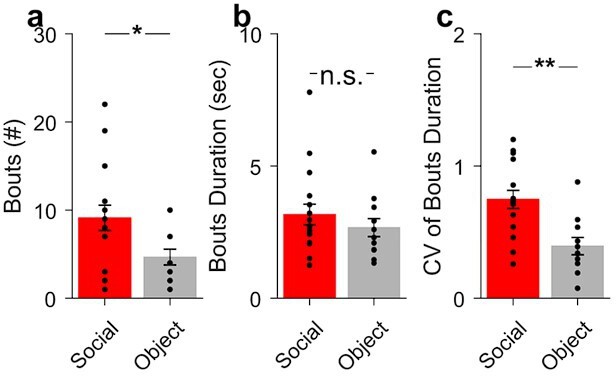
(A) Graph of the number of interaction bouts between the recorded subject mouse and a novel target mouse or object (two-sided Wilcoxon rank sum test; p=0.0245, Z=2.2485) (B) Illustration of probe location in the Purkinje cells (PC) layer (top). Average simple spike waveform of a PC (bottom). (C) Heatmap of normalized (Z-score) firing rates of a Soc– PC neuron aligned to the onset of social interaction shown for 10 interaction epochs (top). The mean normalized firing rate across all interaction sessions shown above (bottom). (D, E, F) Average activity of three Soc+ PCs (D), 10 Soc– PCs (E), and 17 ns PCs (F). The mean activity of each group is shown below each heat map. (G) Proportion of Soc+, Soc–, and ns PCs in the recorded population. (H) Trajectory of subject mouse (gray) with social interaction locations indicated in red within the social interaction arena (480 × 480 mm). (I) Illustration of probe location for dentate nucleus (DN) recordings (top). Average spike waveform of a DN neuron (bottom). (J) Normalized firing rates of a Soc+ DN neuron aligned to the onset of social interaction shown for 18 interaction epochs (top). The mean normalized firing rate across all interaction sessions shown above. (K, L, M) Average activity of 19 Soc+ DN neurons (K), 10 Soc– DN neurons (E), and 63 ns DN neurons (F). The mean activity of each group is shown below each heat map. (N) Proportion of Soc+, Soc–, and ns DNs in the recorded population.
Figure 2—figure supplement 1
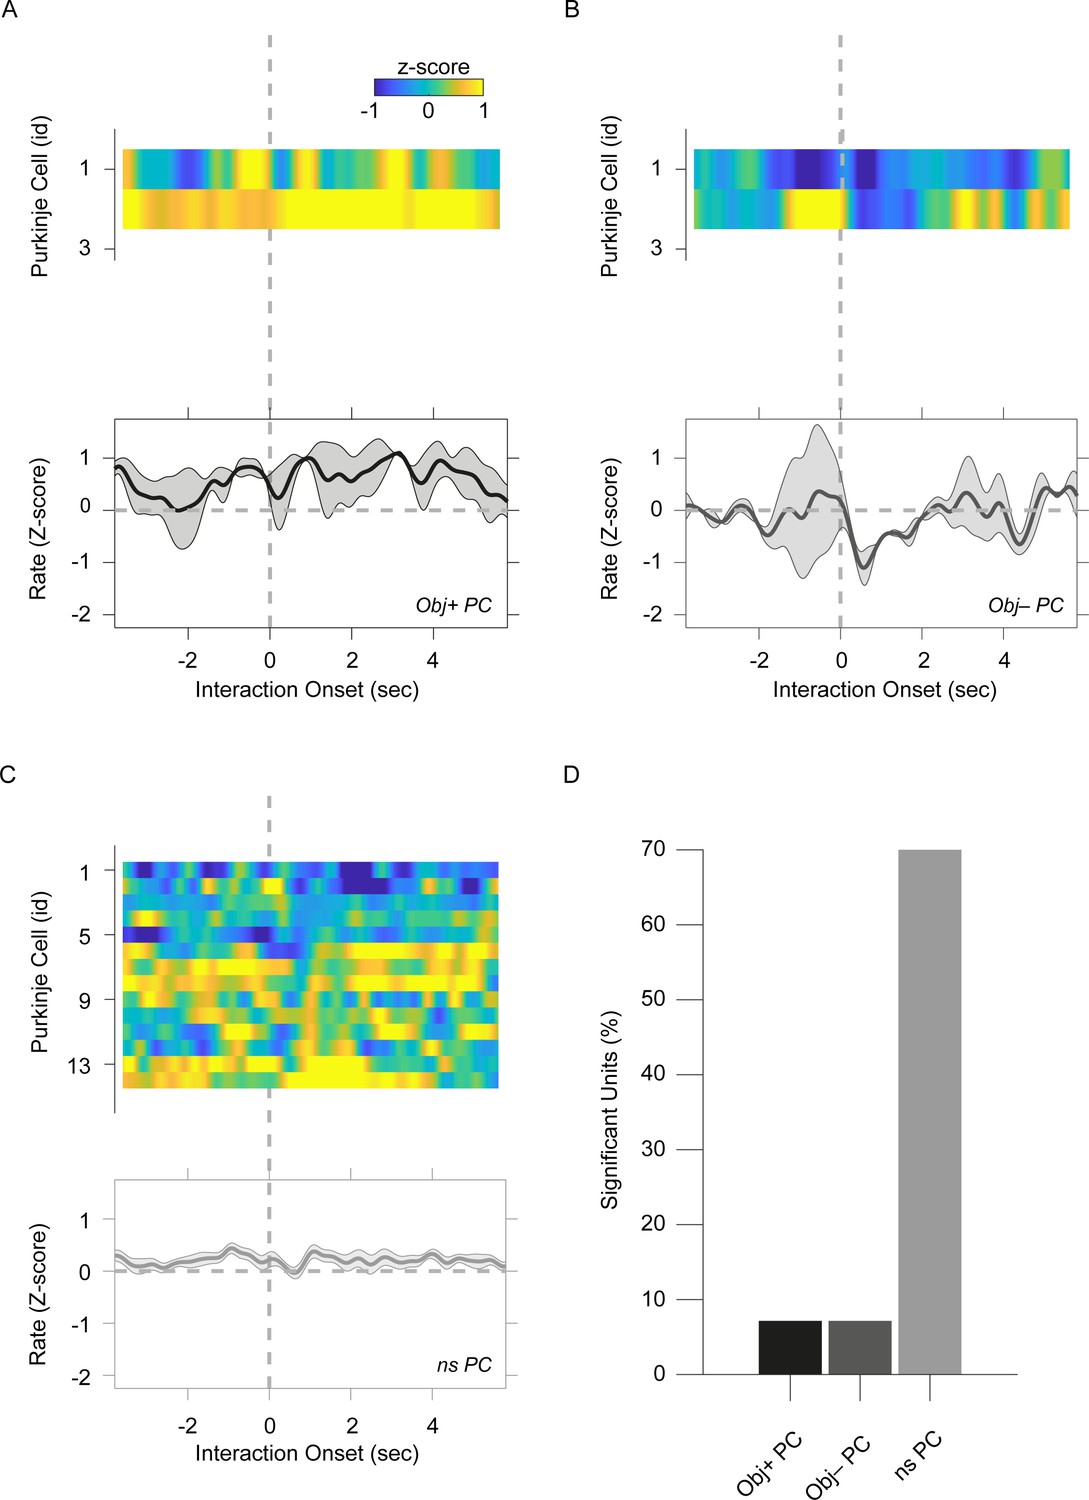
Object-evoked Purkinje cell responses differ from social-evoked responses.
(A, B, C) Heatmaps of the average histogram for the individual Purkinje cells aligned to the onset of object interaction. Averaged traces of all cells for (A) Obj+ Purkinje cells (PCs), (B) Obj– PCs, and (C) ns PCs are shown below each of the corresponding heatmaps. (D) Bar graph of Obj+, Obj–, and ns PC proportion in the recorded population.
Figure 2—figure supplement 2

Object-evoked dentate nucleus neuron responses differ from social-evoked responses.
(A, B, C) Heatmaps of the average peristimulus histogram for the individual dentate nucleus neurons aligned to the onset of object interaction. Averaged traces of all cells for (A) Obj+ dentate nucleus (DNs), (B) Obj– DNs, and (C) ns DNs are shown below each of the corresponding heatmaps. (D) Bar graph of Obj+, Obj–, and ns DN neuron proportion in the recorded population.
Figure 2—figure supplement 3
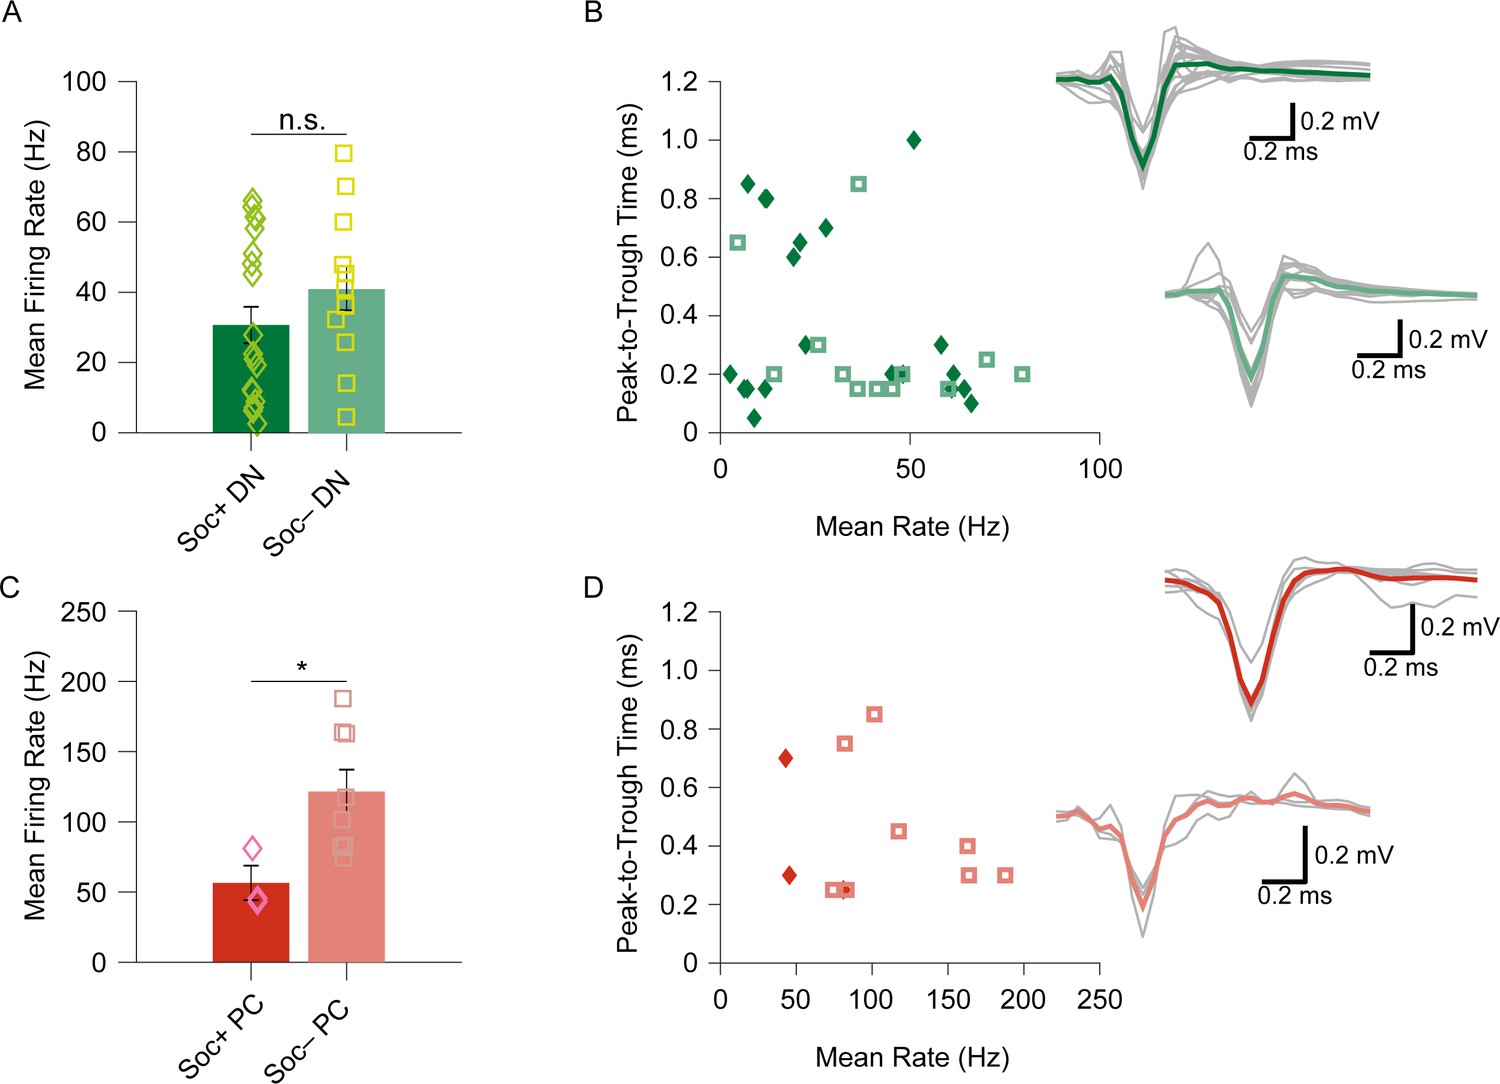
Bimodality of socially excited and inhibited Purkinje cell simple spike but not dentate nucleus neurons.
(A) No significant difference in the mean baseline firing rate between Soc+ and Soc– dentate nucleus (DN) neurons (F=1.589, p=0.2172). (B) Soc+ and Soc– DN neurons’ mean firing rate in relation to the spike peak-to-trough kinetics. Waveforms of Soc+ and Soc– DN neurons (right). (C) Bimodality of the Soc+ and Soc– Purkinje cell (PC) simple spikes (SS) mean firing rate (F=5.742, p=0.04). (D) Soc+ and Soc– PCs’ mean firing rate in relation to spike peak-to-trough kinetics. Waveforms of Soc+ and Soc– PCs (right).
Figure 2—figure supplement 4
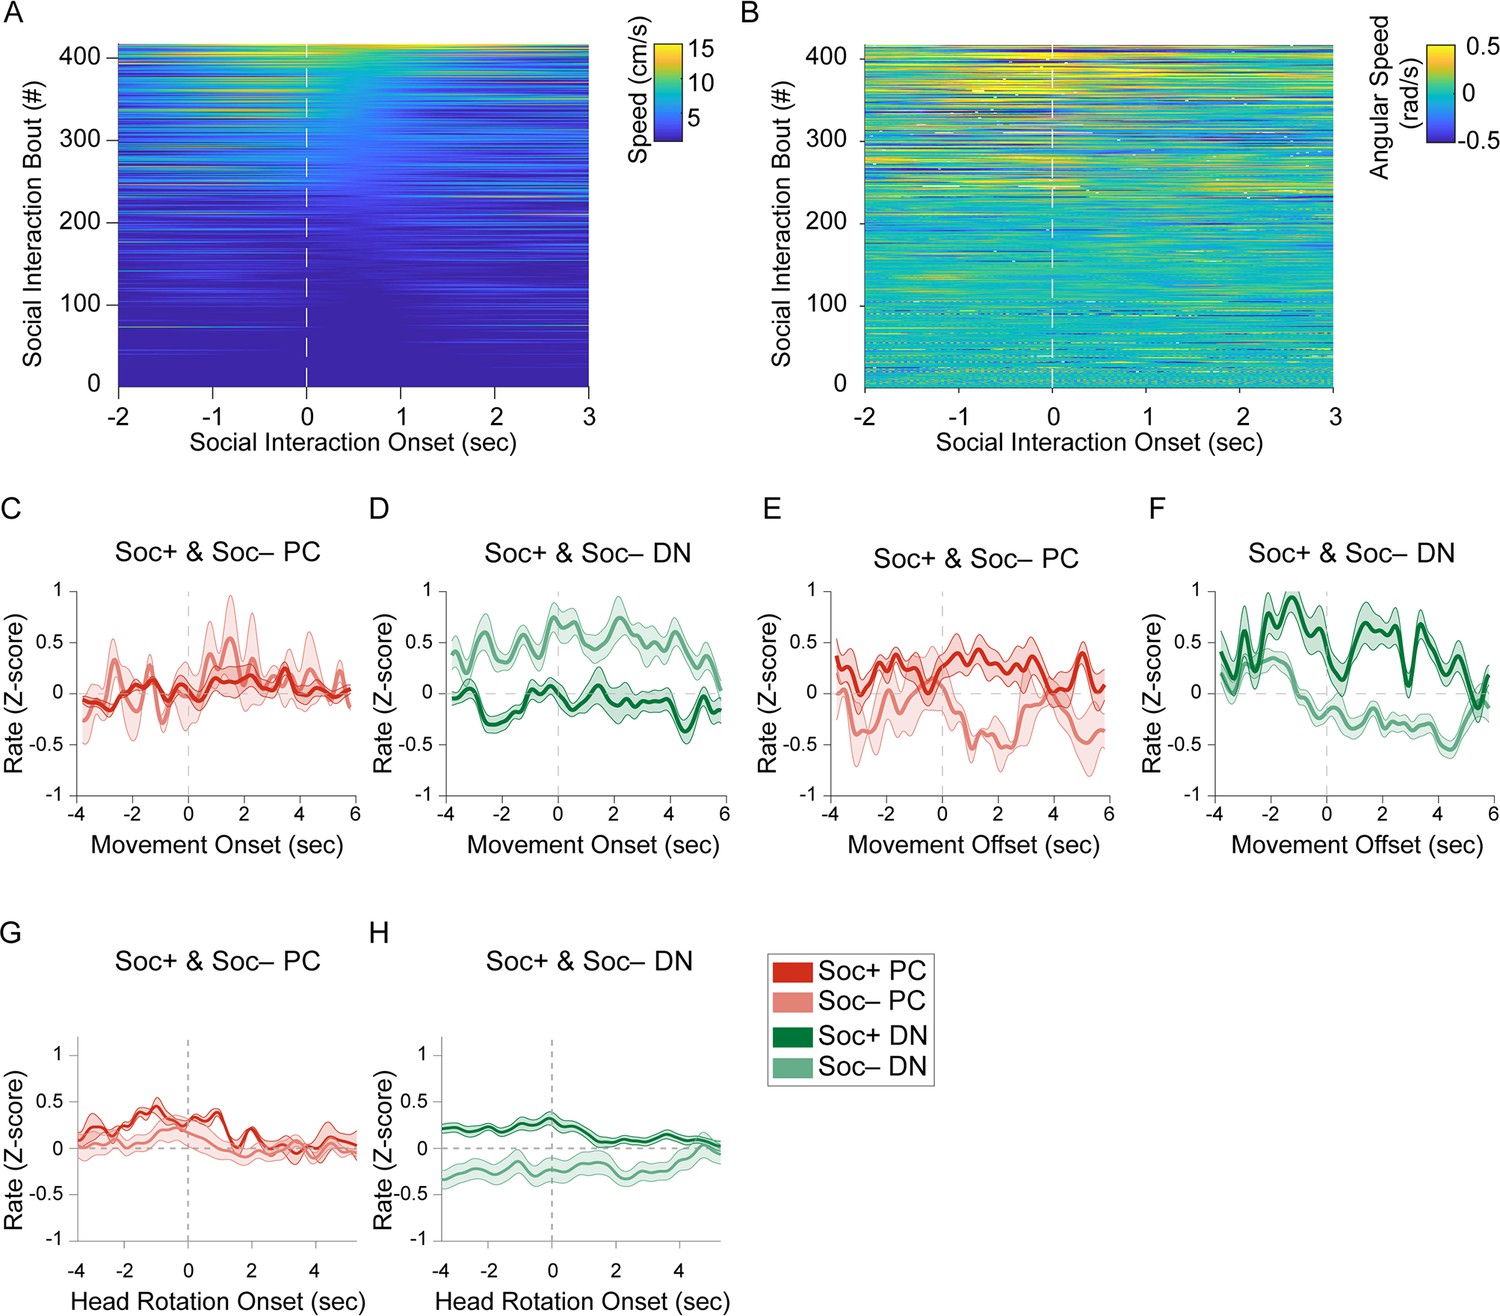
Socially excited and socially inhibited Purkinje cell and dentate nucleus activity are not related to locomotion speed.
(A) Heatmap of locomotion speed in relation to social interaction onset aligned for all social interaction events. (B) Heatmap of angular speed (head rotation) in relation to social interaction onset aligned for all social interaction events. Normalized (Z-score) firing rate of Soc+ and Soc– (C) Purkinje cells (PCs) upon locomotion onset, (D) Dentate nucleus (DN) neurons upon locomotion onset, (E) PCs upon locomotion offset, (F) DN neurons upon locomotion offset, (G) PCs upon head rotation onset, (H) DN neurons upon head rotation onset.
Figure 3 with 2 supplements
Anterior cingulate cortex (ACC) neuron activity patterns during social behavior.
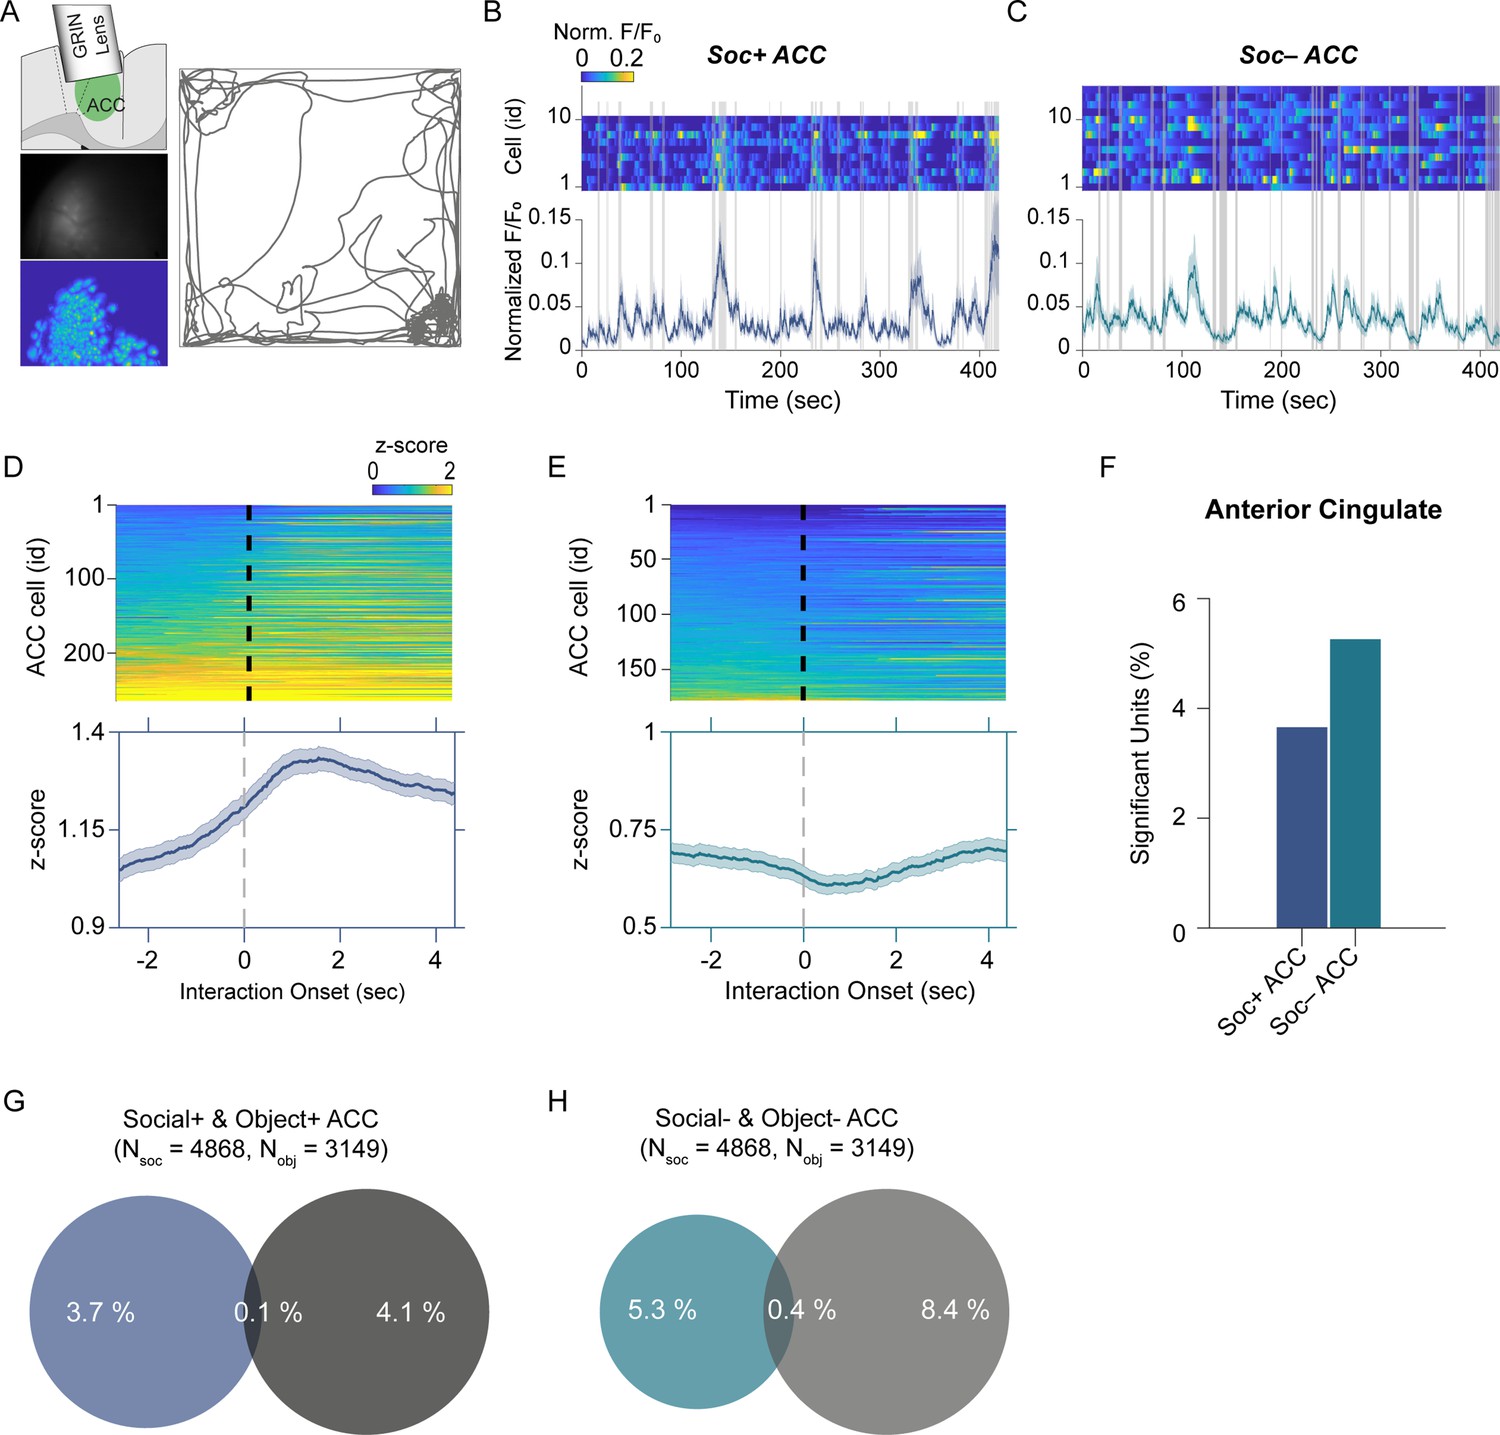
(A) Illustration of GRIN lens implant location (top left). Raw image from ACC calcium imaging recording (mid left). Segmented and averaged activity heatmap from the recording shown above (bottom left). Example of raw behavioral trajectory of subject mouse (right). (B, C) Heatmap depicting the calcium activity of 10 Soc+ ACC neurons (B) and 15 Soc– ACC neurons (C) during a single social interaction session. Social interaction bouts are shown as gray bars. The average calcium activity is shown below each heatmap. (D, E) Top: Z-scored Soc+ (D) and Soc– (E) ACC neurons calcium activity for all neurons during all social interaction sessions. The onset of social interaction is marked as a dashed black line. Bottom: Mean of Z-scored activity shown for the heatmaps above for Soc+ (D) and Soc– (E) neurons. (F) Percentage of units showing significant modulation by social interaction. (G) Overlap of Soc+ and Obj + ACC neuronal populations. (H) Overlap of Soc– and Obj– ACC neuronal populations.
Figure 3—figure supplement 1
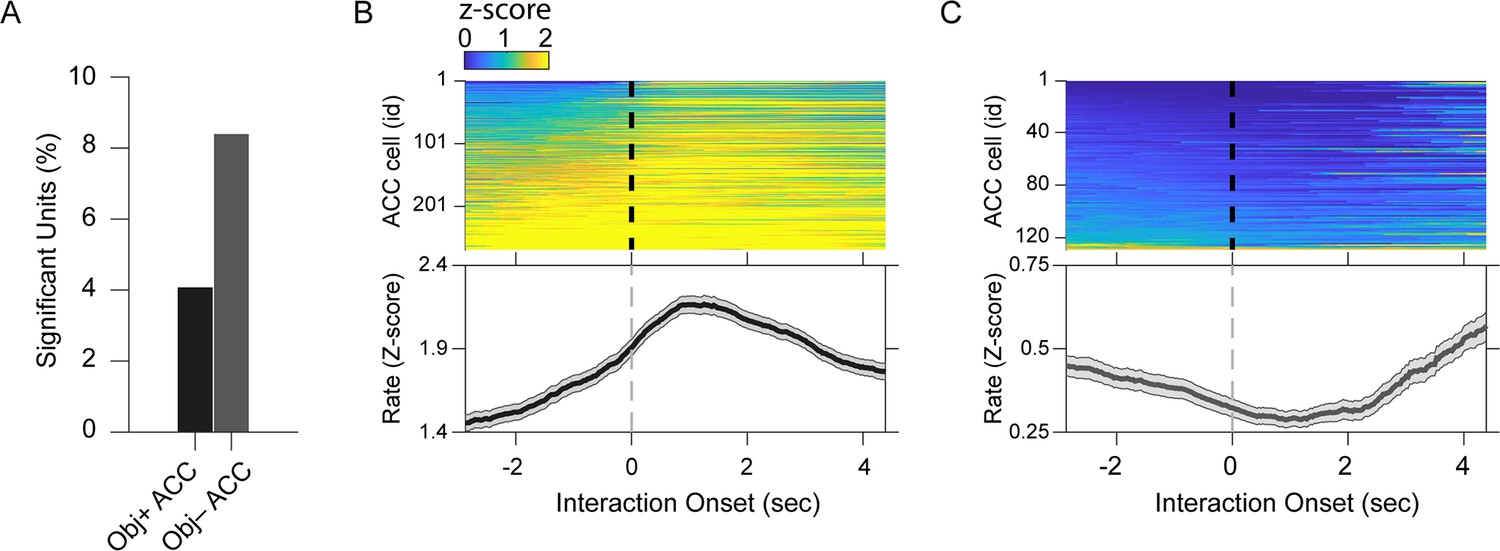
Anterior cingulate cortex (ACC) neuron activity patterns during object interaction.
(A) Percentage of significant Obj + and Obj– ACC neurons. (B, C) (top) Heatmap of Z-scored ACC activity aligned to object interaction onset (dashed line) and (bottom) averaged activity traces for (B) Obj + and (C) Obj– ACC neurons.
Figure 3—figure supplement 2

Socially excited and inhibited anterior cingulate cortex (ACC) neurons are not related to the onset or offset of locomotion bouts or onset angular head rotation.
(A, B) PSTH of averaged normalized (Z-score) activity for movement (A) onset and (B) offset for Soc+ and Soc– ACC neurons. (C) PSTH of Z-scored ACC activity upon head rotation onset.
Figure 4 with 2 supplements
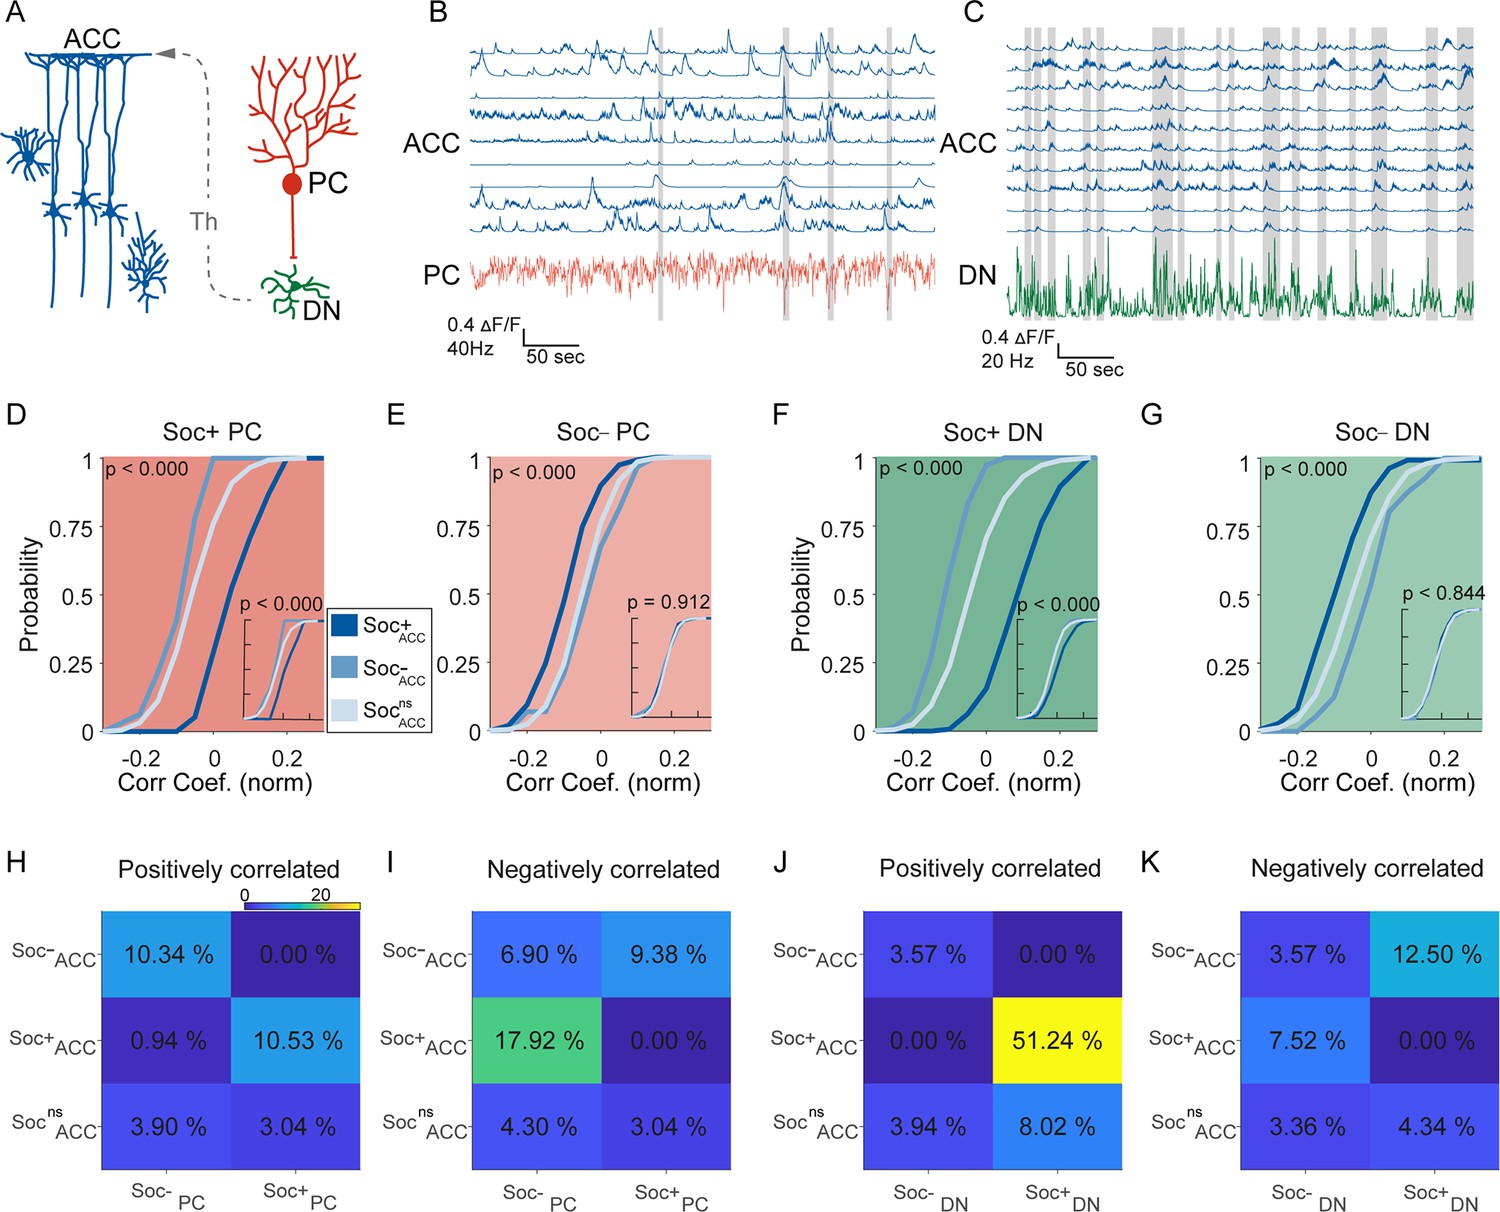
Correlated activity in the cerebellar-cortical circuit during social behavior.
(A) Illustration of the cerebellar-cortical circuit. Purkinje cells (PCs) provide converging inhibition to dentate nucleus (DNs) that excite thalamic neurons. Thalamic neurons excite anterior cingulate cortex (ACC) neurons. (B) Simultaneously recorded calcium traces from nine ACC neurons and the electrophysiologically recorded firing rate of a single PC (red) during a social interaction epoch. Social interaction bouts are shown as gray bars. (C) Simultaneously recorded calcium traces from 10 ACC neurons (blue) and the electrophysiologically recorded firing rate of a single DN neuron during a social interaction epoch. Social interaction bouts are shown as gray bars. (D–G) Cumulative histogram of the distribution of the correlation coefficients for the activity of (D) Soc+ PCs, (E) Soc– PCs, (F) Soc+ DNs, or (G) Soc– DNs with Soc+ (dark blue), Soc– (light blue), and Socns (blue gray) ACCs. Insets: cumulative histogram of the activity of each set of neurons calculated during periods when the mouse was not engaged in social interaction. (H, I, J, K) Correlation matrix showing the percentage of cell pairs showing significant positive (H, J) or negative (I, K) correlations in activity between Soc+ and Soc– PCs (H, I) or Soc+ and Soc– DNs (J, K) with Soc+, Soc–, and Socns ACC neurons. The color of the squares represents the proportion of neurons correlated.
Figure 4—figure supplement 1
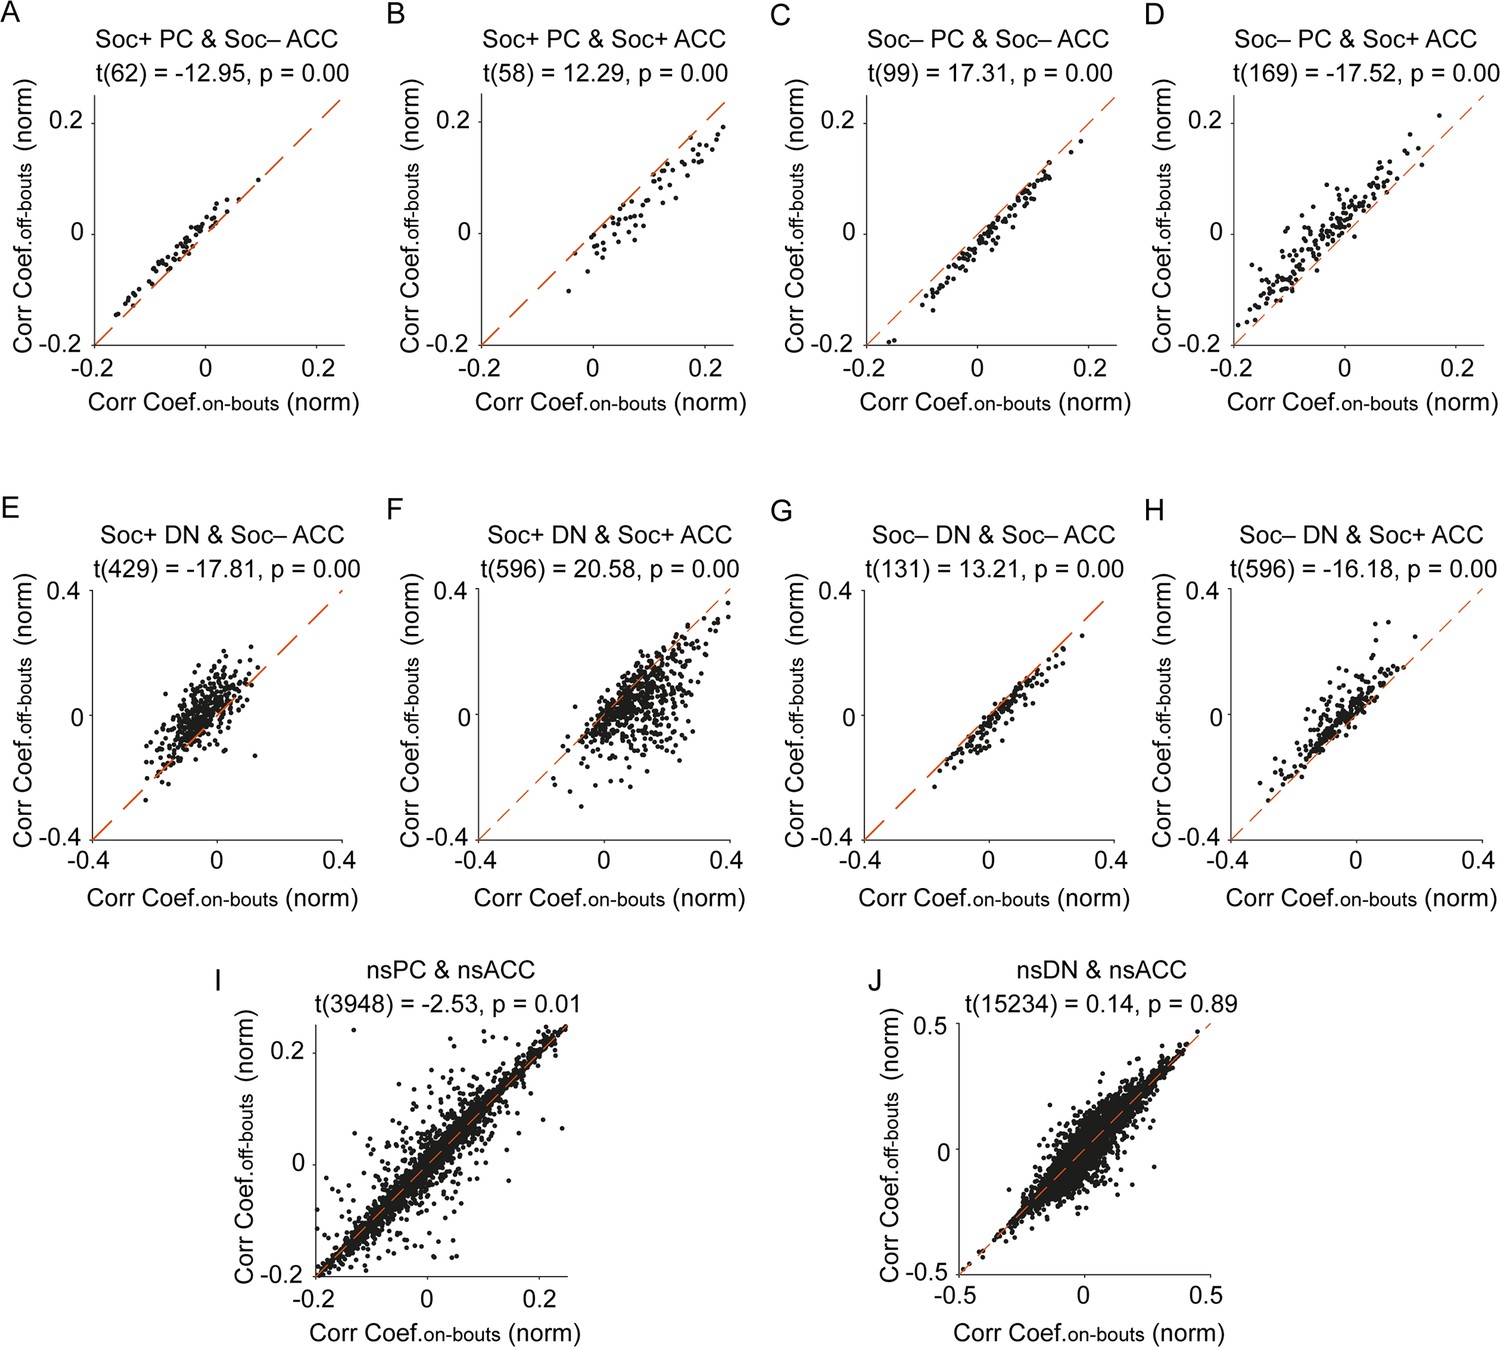
Relationship of significant social cell pair correlation coefficients during social on- and off-bouts.
Scatter plots of significant social (A, B, C, D) Purkinje cell (PC) or (E, F, G, H) dentate nucleus (DN) and social anterior cingulate cortex (ACC) pair correlation coefficients during social on- and off-bouts. The scatter plot of the (I) nsPC or (J) nsDN and nsACC pairs show no increase in correlations for social on- vs social off-bouts.
Figure 4—figure supplement 2
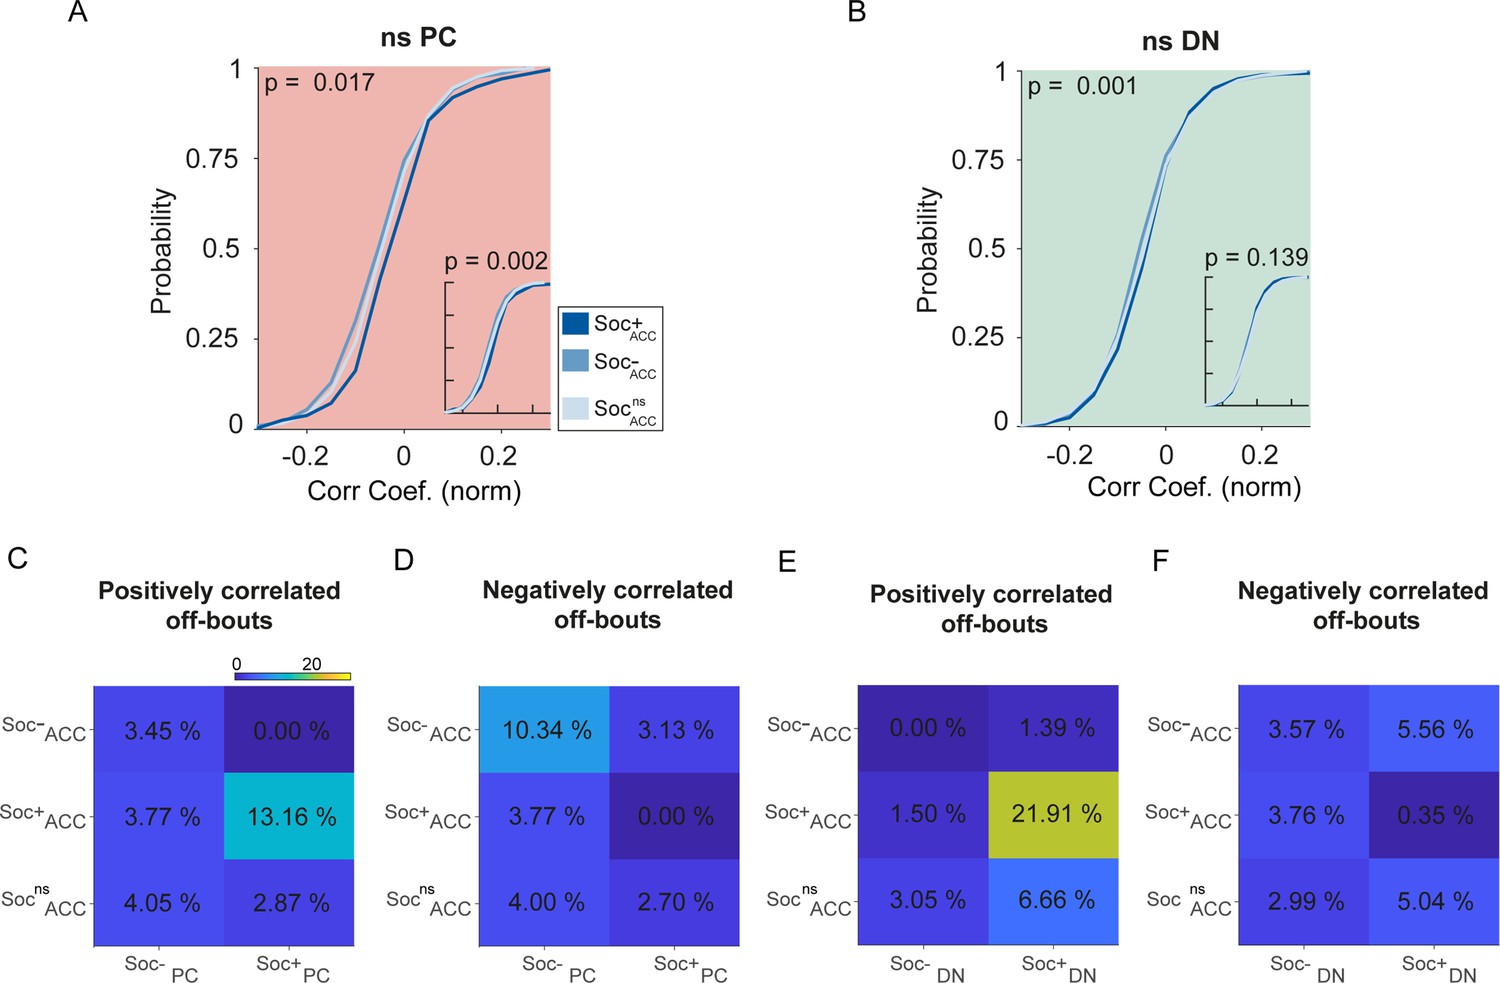
Purkinje cells and dentate nucleus neurons are not correlated to anterior cingulate cortex (ACC) neuron activity in socially neutral neurons and during off-bout periods.
Cumulative distribution histogram of the correlation coefficients for the activity of (A) nsPC with Soc+ (dark blue), Soc– (light blue) and Socns ACC, and (B) nsDN with Soc+ (dark blue), Soc– (light blue), and Socns ACC. Insets; cumulative histogram of the activity of each set of neurons calculated during periods when the mouse was not engaged in social interaction. (C, D, E, F) Correlation matrix showing percentage of cell pairs showing significant positive (C, E) or negative (D, F) correlations in activity between Soc+ and Soc– PCs (C, D) or Soc+ and Soc– DN neurons (E, F) with Soc+, Soc–, and Socns ACC neurons. The color of the squares represents the proportion of neurons correlated.
Author response image 1
Tables
Table 1
List of components for E-Scope Assembly.
| Component | Quantity | Vendor | Part # | Weblink |
|---|---|---|---|---|
| Miniscope V3 Parts | https://miniscope.org | |||
| Body | ||||
| Main body of scope. Black Delrin | 1 | N/A | MS_MainBody v3.2 | https://github.com/daharoni/Miniscope_Machined_Parts |
| Filter cover of scope. Black Delrin | 1 | N/A | MS_FilterCover v3 | |
| CMOS imaging sensor mount. Black Delrin | 1 | N/A | MS_FocusSlider v3.2 | |
| Baseplate. Aluminum. | 1 | N/A | MS_Baseplate v3 | |
| Cap to protect implanted GRIN lens. Black Delrin | 1 | N/A | MS_Cap v3 | |
| Optics | ||||
| 5 mm Dia. × 20 mm FL, MgF2 Coated, Achromatic Doublet Lens | 1 | Edmund Optics | 45–408 | http://www.edmundoptics.com/optics/optical-lenses/achromatic-lenses/mgf2-coated-achromatic-lenses/45408/ |
| 5 mm Dia. × 15 mm FL, MgF2 Coated, Achromatic Doublet Lens | 1 | Edmund Optics | 45–207 | http://www.edmundoptics.com/optics/optical-lenses/achromatic-lenses/mgf2-coated-achromatic-lenses/45207/ |
| 5 mm Dia. × 12.5 mm FL, MgF2 Coated, Achromatic Doublet Lens | 1 | Edmund Optics | 49–923 | http://www.edmundoptics.com/optics/optical-lenses/achromatic-lenses/mgf2-coated-achromatic-lenses/49923/ |
| 5 mm Dia. × 10 mm FL, MgF2 Coated, Achromatic Doublet Lens | 1 | Edmund Optics | 45–206 | http://www.edmundoptics.com/optics/optical-lenses/achromatic-lenses/mgf2-coated-achromatic-lenses/45206/ |
| 5 mm Dia. × 7.5 mm FL, MgF2 Coated, Achromatic Doublet Lens | 1 | Edmund Optics | 45–407 | http://www.edmundoptics.com/optics/optical-lenses/achromatic-lenses/mgf2-coated-achromatic-lenses/45407/ |
| 3.0 mm Diameter, N-BK7 Half-Ball Lens | 1 | Edmund Optics | 47–269 | http://www.edmundoptics.com/optics/optical-lenses/ball-condenser-lenses/n-bk7-half-ball-lenses/47269/ |
| Diced excitation filter, 3.5mm × 4 mm × 1 mm | 1 | Chroma | ET470/40 x | https://www.chroma.com/products/parts/et470-40x |
| Diced dichroic mirror, 6mm × 4mm × 1 mm | 1 | Chroma | T495lpxr | https://www.chroma.com/products/parts/t495lpxr |
| Diced emission filter, 4mm × 4mm × 1 mm | 1 | Chroma | ET525/50 m | https://www.chroma.com/products/parts/et525-50m |
| Electrical | ||||
| Excitation LED, LED LUXEON REBEL BLUE SMD | Digikey | LXML-PB01-0030 | http://www.digikey.com/product-detail/en/LXML-PB01-0030/1416-1028-1-ND/3961133 | |
| Coaxial Cable | ||||
| 50 ohm coax silicone rubber jacketed cable | Cooner Wire | CW2040-3650SR | https://www.coonerwire.com/mini-coax/ | |
| Printed Circuit Boards (PCB) | ||||
| 4 layer, 0.031" CMOS imaging sensor PCB | 1 | N/A | N/A | https://github.com/daharoni/Miniscope_CMOS_Imaging_Sensor_PCB |
| 2 layer, 0.031" Excitation LED PCB | 1 | N/A | N/A | https://github.com/daharoni/Miniscope_Machined_Parts/tree/master/Extra%20Components |
| 2 layer, 0.062" Coax to SMA PCB | 1 | OSH Park | N/A | |
| Electrophysiology Parts | ||||
| Probe | ||||
| 64 channel silicon probe (with 32 channels wirebonded) | 1 | Sotiris Lab | 64 H | https://github.com/sotmasman/Silicon-microprobes |
| https://masmanidislab.neurobio.ucla.edu/technology.html | ||||
| Printed Circuit Boards (PCB) | ||||
| Ephys PBC | 1 | N/A | N/A | https://github.com/Aharoni-Lab/Ephys-Miniscope |
| Miscellaneous Hardware | ||||
| M1 thread-forming screws | 4 | McMaster-Carr | 96817a704 | https://www.mcmaster.com/tappingscrews/screw-size~m1/ |
| Set Screw 18–8 Stainless Steel Cup Point Set Screw, 0–80 Thread, 3/16" Long | 2 | McMaster-Carr | 92311 A054 | https://www.mcmaster.com/92311A054/ |
| (Black) 36 Gauge Ultra-Flexible Miniature High-Temperature Wire | 1 | McMaster-Carr | 9564T1 | https://www.mcmaster.com/wire/wire-gauge~36/ |
| (Green) 36 Gauge Ultra-Flexible Miniature High-Temperature Wire | 1 | McMaster-Carr | 9564T1 | |
| (Red) 36 Gauge Ultra-Flexible Miniature High-Temperature Wire | 1 | McMaster-Carr | 9564T1 | |
| (White) 36 Gauge Ultra-Flexible Miniature High-Temperature Wire | 1 | McMaster-Carr | 9564T1 | |
| 1/16" diameter × 1/32" thick. Axially Magnetized | 6 | K&J Magnetics, Inc. | D101-N52 | https://www.kjmagnetics.com/proddetail.asp?prod=D101-N52 |
| Data Acquisition Devices (DAQs) | ||||
| UCLA Miniscope DAQ | 1 | Labmaker | DAQ-Imaging | https://www.labmaker.org/collections/miniscope-v3-2/products/data-aquistion-system-daq |
| SSC-2-Intan-LVDS PCB | 1 | N/A | N/A | https://github.com/Aharoni-Lab/Ephys-Miniscope |
| Intan DAQ | 1 | Intan Technologies | RHD 2000 evaluation board | https://intantech.com/RHD_USB_interface_board.html |
| Software | ||||
| Aharoni-Lab Miniscope-DAQ-QTSoftware | 1 | N/A | N/A | https://github.com/Aharoni-Lab/Miniscope-DAQ-Cypress-firmware (Aharoni and Klumpp, 2023) |
| https://github.com/daharoni/Miniscope_DAQ_Software (Aharoni et al., 2019b) | ||||
| Intan RHX software | 1 | Intan Technologies | RHX | https://intantech.com/RHX_software.html (Intan Technologies, 2024) |
Additional files
Download links
A two-part list of links to download the article, or parts of the article, in various formats.
Downloads (link to download the article as PDF)
Open citations (links to open the citations from this article in various online reference manager services)
Cite this article (links to download the citations from this article in formats compatible with various reference manager tools)
Correlated signatures of social behavior in cerebellum and anterior cingulate cortex
eLife 12:RP88439.
https://doi.org/10.7554/eLife.88439.3


