Integrin β4 promotes DNA damage-related drug resistance in triple-negative breast cancer via TNFAIP2/IQGAP1/RAC1
- Kunming Institute of Zoology, Chinese Academy of Sciences, China
- Kunming College of Life Sciences, University of Chinese Academy of Sciences, China
- School of Life Science, University of Science & Technology of China, China
- Affiliated Hospital of Guangdong Medical University, China
- Department of Breast Surgical Oncology, National Cancer Center/National Clinical Research Center for Cancer/Cancer Hospital & Shenzhen Hospital, Chinese Academy of Medical Sciences and Peking Union Medical College, China
- Shanghai University of Medicine & Health Sciences Affiliated Sixth People’s Hospital South Campus, China
- Department of Pathology, Henan Provincial People's Hospital, Zhengzhou University, China
- The Second Affiliated Hospital of the Chinese University of Hong Kong (Shenzhen), China
- School of Laboratory Medicine and Biotechnology, Southern Medical University, Guangdong Province, China
- Academy of Biomedical Engineering, Kunming Medical University, China
- The Third Affiliated Hospital, Kunming Medical University, China
Figures
Figure 1 with 1 supplement
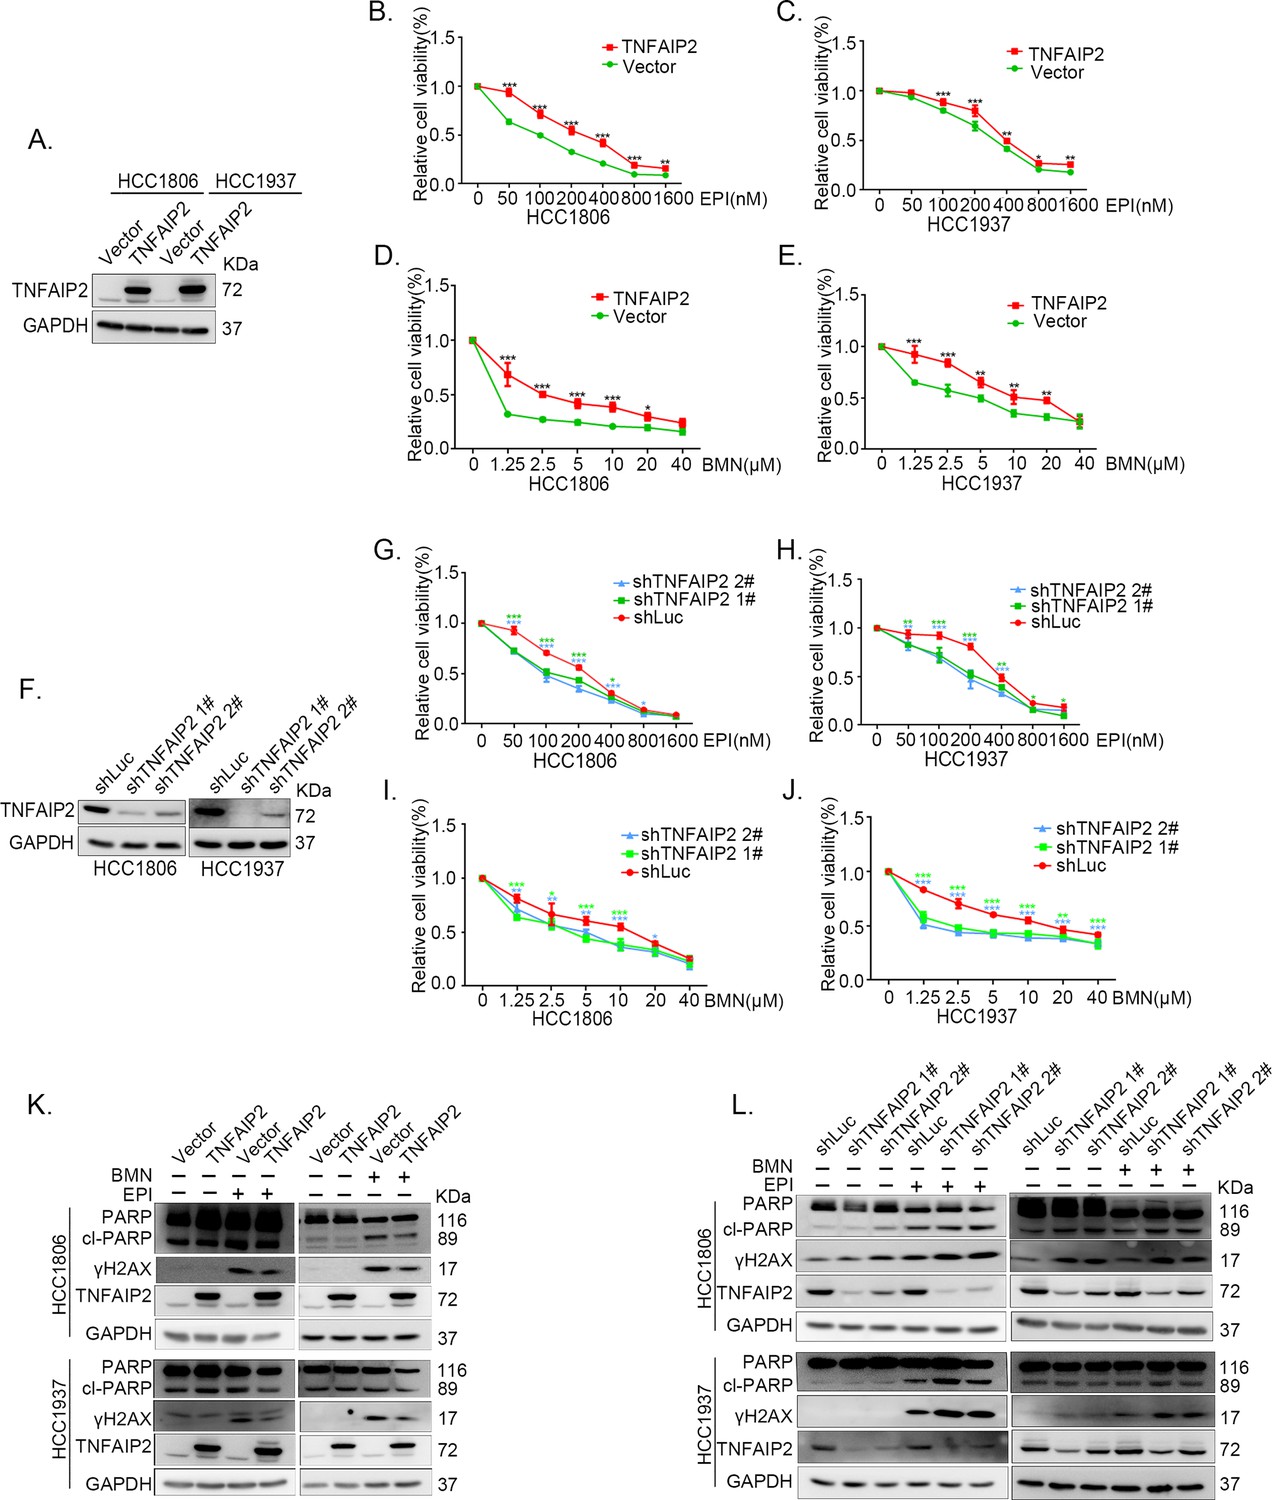
TNFAIP2 promotes triple-negative breast cancer (TNBC) DNA damage-related drug resistance.
(A–E) Stable TNFAIP2 overexpression in HCC1806 and HCC1937 cells significantly increased cell viability in the presence of EPI (0–1.6 μM) or BMN (0–40 μM) treatment for 48 hr, as measured by the SRB assay. Statistical analysis was performed using one-way analysis of variance (ANOVA), n = 3, *p < 0.05, **p < 0.01, ***p < 0.001. TNFAIP2 protein expression was detected by western blotting (WB). (F–J) Stable TNFAIP2 knockdown in HCC1806 and HCC1937 cells significantly decreased cell viability in the presence of EPI (0–1.6 μM) or BMN (0–40 μM) treatment for 48 hr, as measured by the SRB assay. Statistical analysis was performed using one-way ANOVA, n = 3, *p < 0.05, **p < 0.01, ***p < 0.001. TNFAIP2 protein expression was detected by WB. (K) TNFAIP2 promoted DNA damage repair in the presence of EPI and BMN. HCC1806 and HCC1937 cells stably overexpressing TNFAIP2 were treated with 400 or 800 nM EPI for 48 hr and 10 μM BMN for 24 hr, respectively. TNFAIP2, γH2AX, and PARP protein expression was detected by WB. (L) TNFAIP2 knockdown increased DNA damage in the presence of EPI and BMN. Stable TNFAIP2 knockdown cells were treated with 400 or 800 nM EPI for 24 or 48 hr and 2.5 μM BMN for 24 hr. TNFAIP2, γH2AX, and PARP protein expression was detected by WB.
-
Figure 1—source data 1
Uncropped western blot images for Figure 1.
- https://cdn.elifesciences.org/articles/88483/elife-88483-fig1-data1-v1.pptx
Figure 1—figure supplement 1
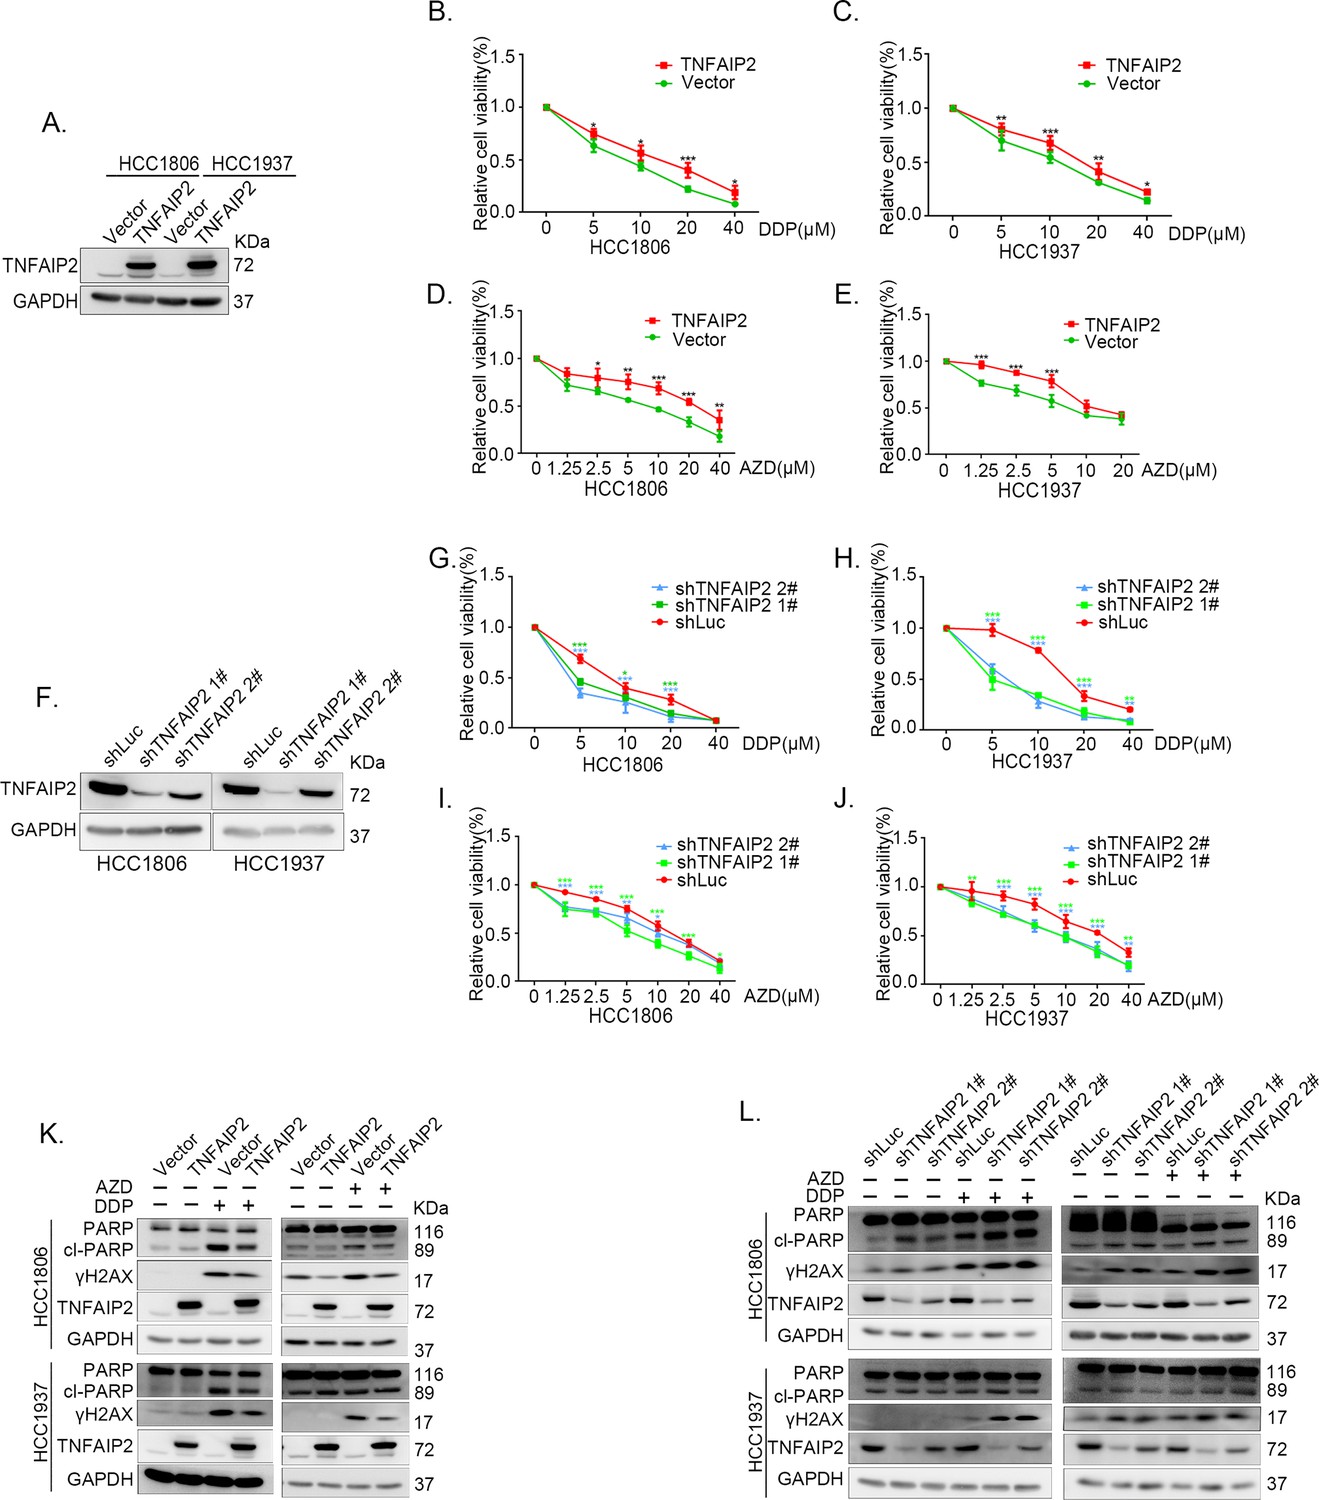
TNFAIP2 promotes triple-negative breast cancer (TNBC) DNA damage-related drug resistance.
(A–E) Stable TNFAIP2 overexpression in HCC1806 and HCC1937 cells significantly increased cell viability in the presence of Cisplatin (DDP) (0–40 μM) or Oolaparib (AZD) (0–40 μM) treatment for 48 hr, as measured by the SRB assay. Statistical analysis was performed using one-way analysis of variance (ANOVA), n = 3–6, *p < 0.05, **p < 0.01, ***p < 0.001. TNFAIP2 protein expression was detected by western blotting (WB). (F–J) Stable TNFAIP2 knockdown in HCC1806 and HCC1937 cells significantly decreased cell viability in the presence of DDP (0–40 μM) or AZD (0–40 μM) treatment for 48 hr, as measured by the SRB assay. Statistical analysis was performed using one-way ANOVA, n = 3, *p < 0.05, **p < 0.01, ***p < 0.001. TNFAIP2 protein expression was detected by WB. (K) TNFAIP2 promoted DNA damage repair in the presence of DDP and AZD. HCC1806 and HCC1937 cells stably overexpressing TNFAIP2 were treated with 20 μM DDP for 24 or 48 hr and 10 μM AZD for 24 hr, respectively. TNFAIP2, γH2AX, and PARP protein expression was detected by WB. (L) TNFAIP2 knockdown increased DNA damage in the presence of DDP and AZD. Stable TNFAIP2 knockdown cells were treated with 2.5 or 20 μM DDP for 24 hr and 2.5 μM AZD for 24 hr. TNFAIP2, γH2AX, and PARP protein expression was detected by WB.
-
Figure 1—figure supplement 1—source data 1
Uncropped western blot images for Figure 1—figure supplement 1.
- https://cdn.elifesciences.org/articles/88483/elife-88483-fig1-figsupp1-data1-v1.pptx
Figure 2 with 2 supplements
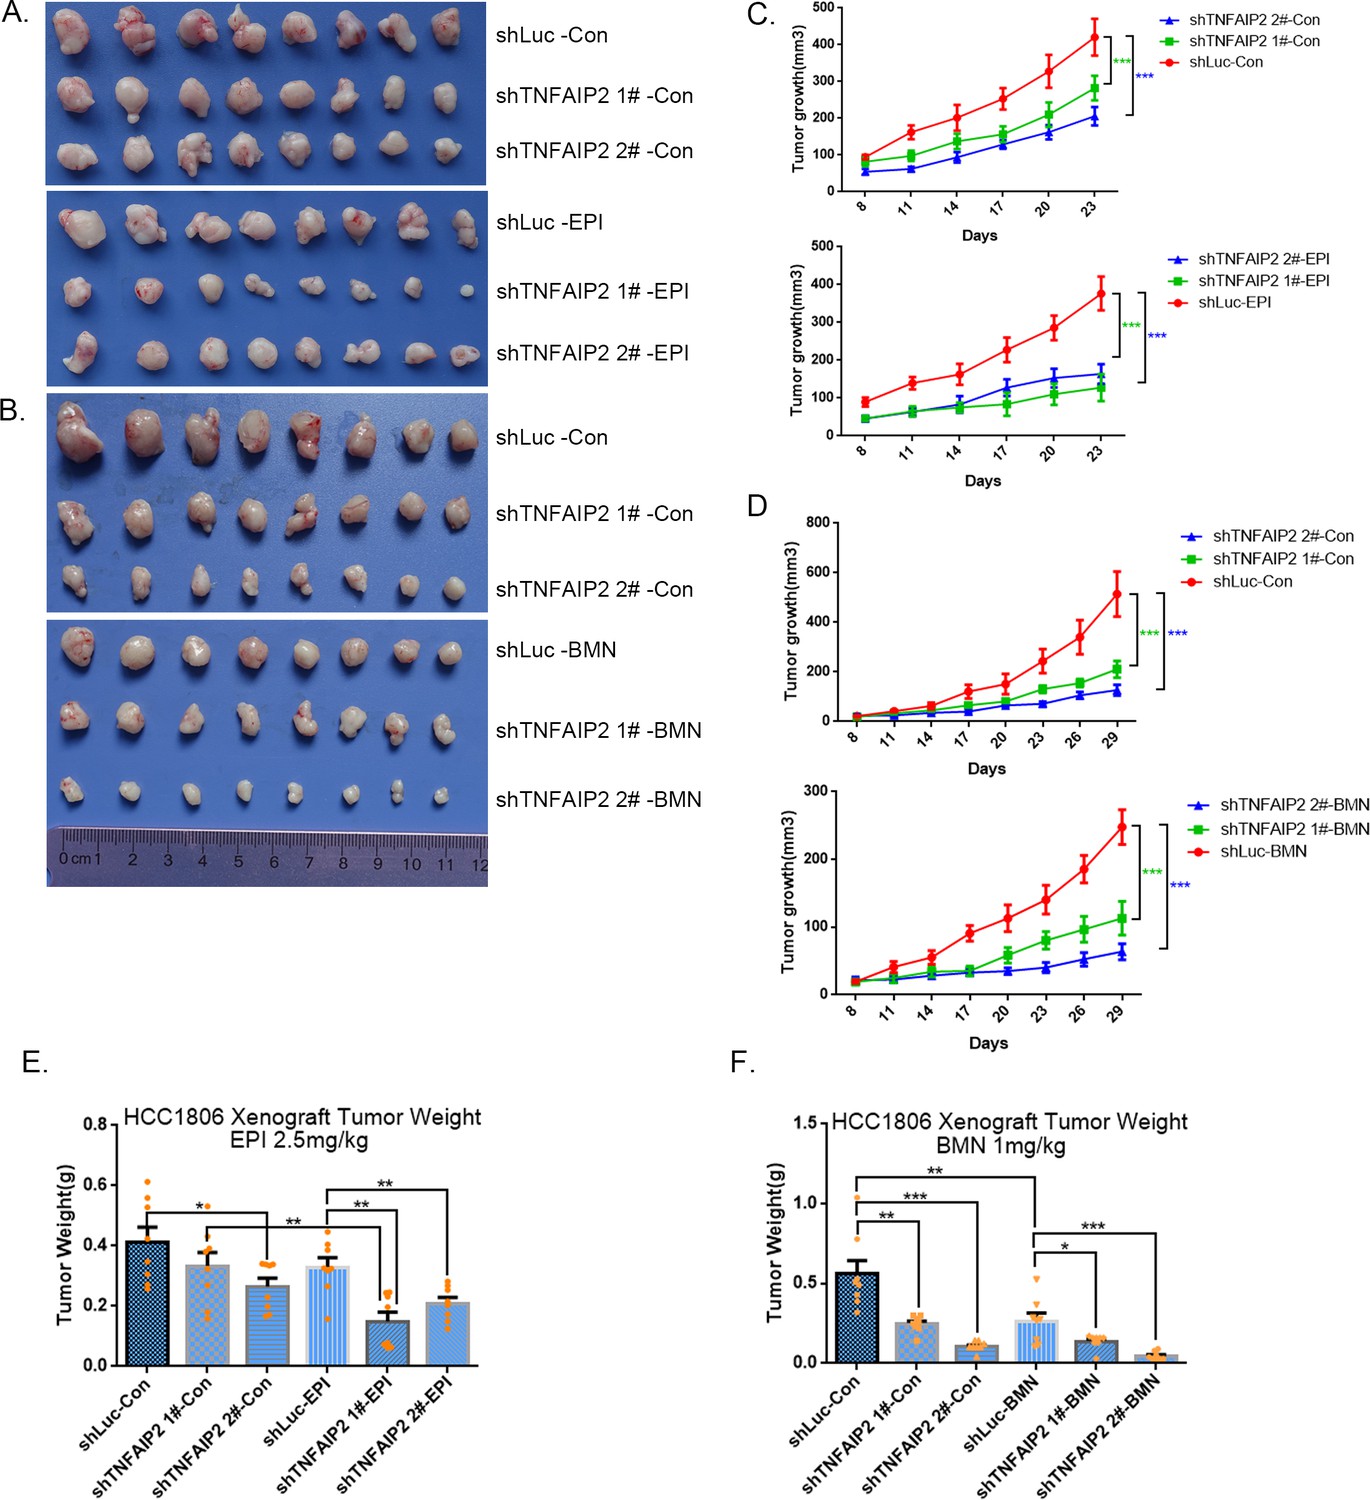
TNFAIP2 confers triple-negative breast cancer (TNBC) drug resistance in vivo.
(A–F) TNFAIP2 knockdown increased the sensitivity ofHCC1806 breast cancer cells to EPI and BMN in vivo. HCC1806 cells with stable TNFAIP2 knockdown were transplanted into the fat pad of 7-week-old female nude mice. When the average tumor size reached approximately 50 mm3 after inoculation, mice in each group were randomly divided into two subgroups (n = 4/group) to receive EPI (2.5 mg/kg), BMN (1 mg/kg), or vehicle control for 23 or 29 days (A, B). Tumor size was measured twice a week (C, D), and tumor masses were collected and weighed at the end of the experiments (E, F). *p < 0.05, **p < 0.01, ***p < 0.001, t-test.
Figure 2—figure supplement 1
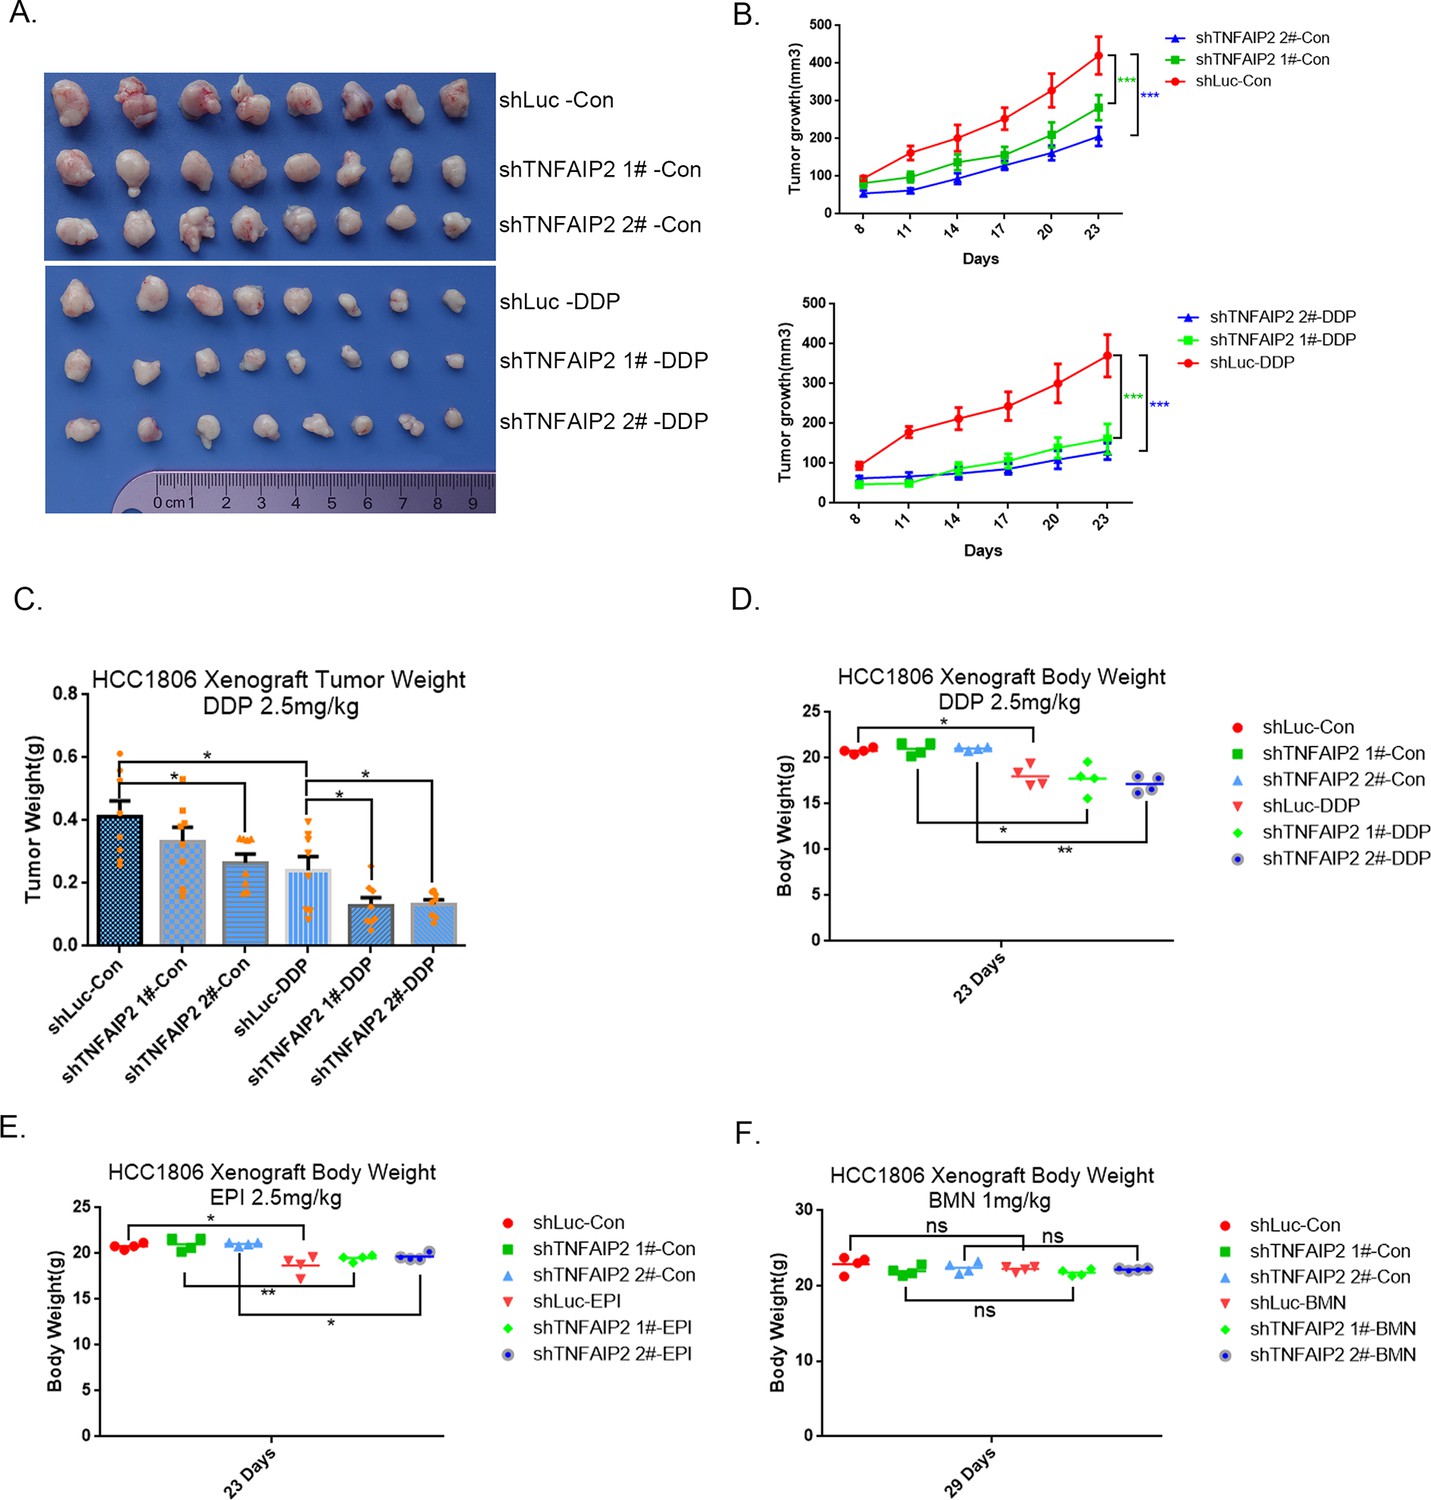
TNFAIP2 confers triple-negative breast cancer (TNBC) drug resistance in vivo.
(A–F) TNFAIP2 knockdown increased the sensitivity of HCC1806 breast cancer cells to DDP in vivo. HCC1806 cells with stable TNFAIP2 knockdown were transplanted into the fat pad of 7-week-old female nude mice. When the average tumor size reached approximately 50 mm3 after inoculation, mice in each group were randomly divided into two subgroups (n = 4/group) to receive DDP (2.5 mg/kg) or vehicle control for 23 days (A). Tumor size was measured twice a week (B), tumor masses were collected and weighed at the end of the experiments (C), and mouse masses were collected and weighed at the beginning or end of the experiments (D–F). *p < 0.05, **p < 0.01, ***p < 0.001, t-test.
Figure 2—figure supplement 2
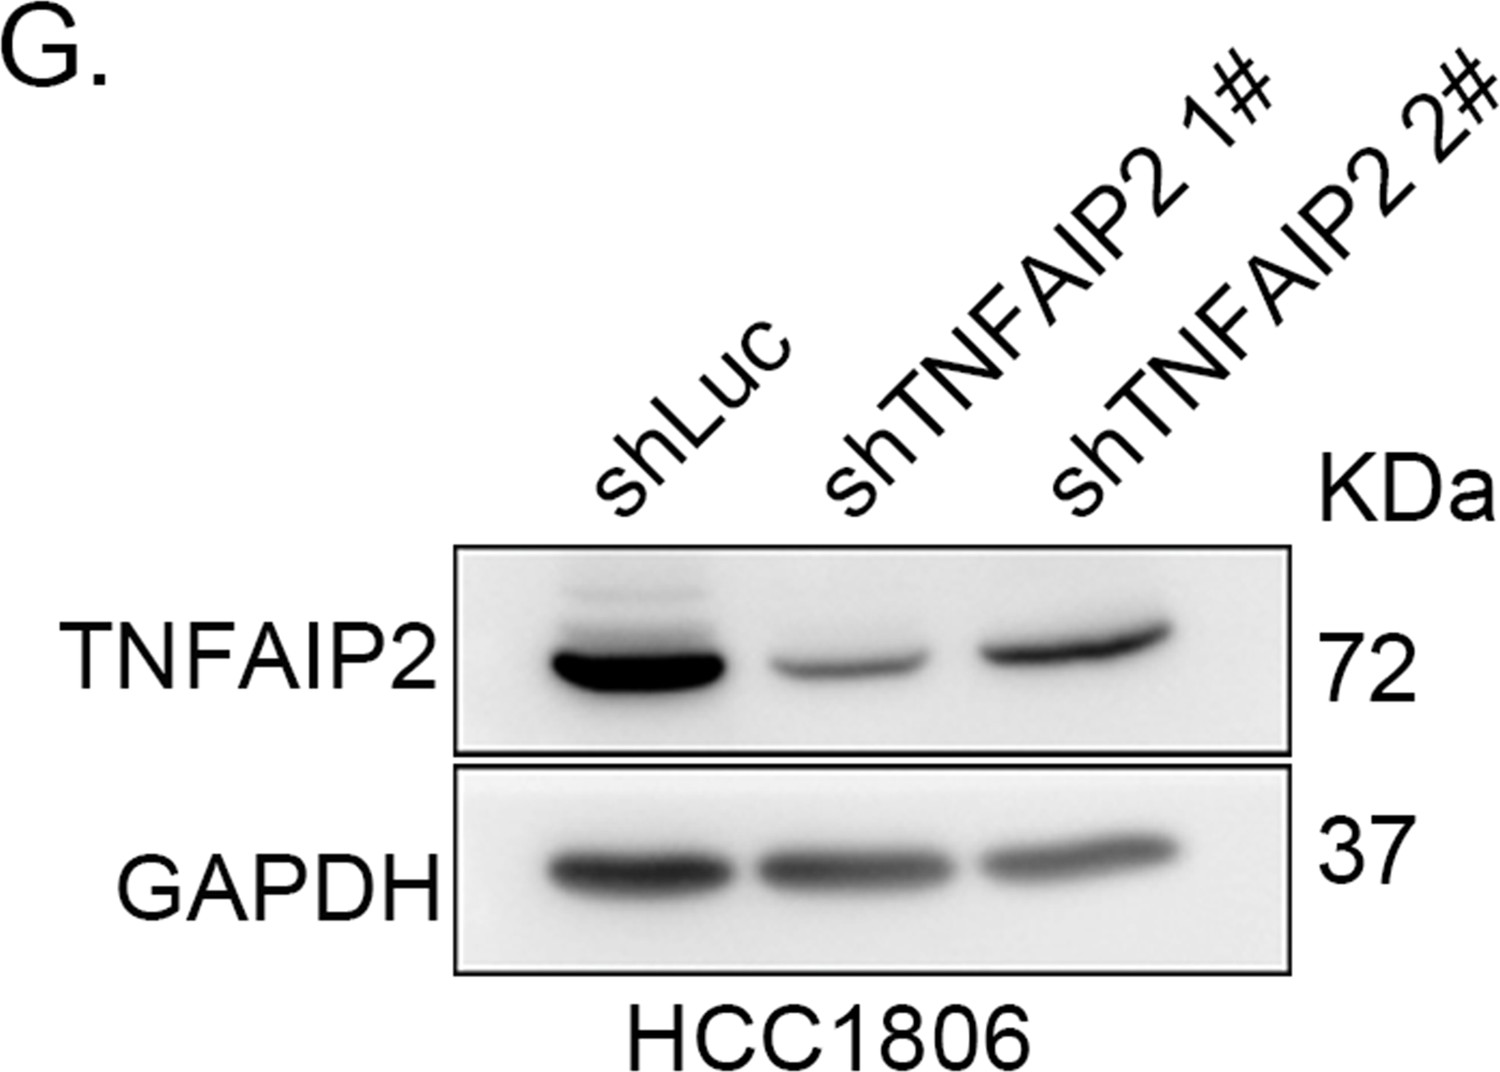
TNFAIP2 confers triple-negative breast cancer (TNBC) drug resistance in vivo.
(G) TNFAIP2 was stably knocked down in HCC1806, as determined by western blotting.
-
Figure 2—figure supplement 2—source data 1
Uncropped western blot images for Figure 2—figure supplement 2.
- https://cdn.elifesciences.org/articles/88483/elife-88483-fig2-figsupp2-data1-v1.pptx
Figure 3 with 1 supplement
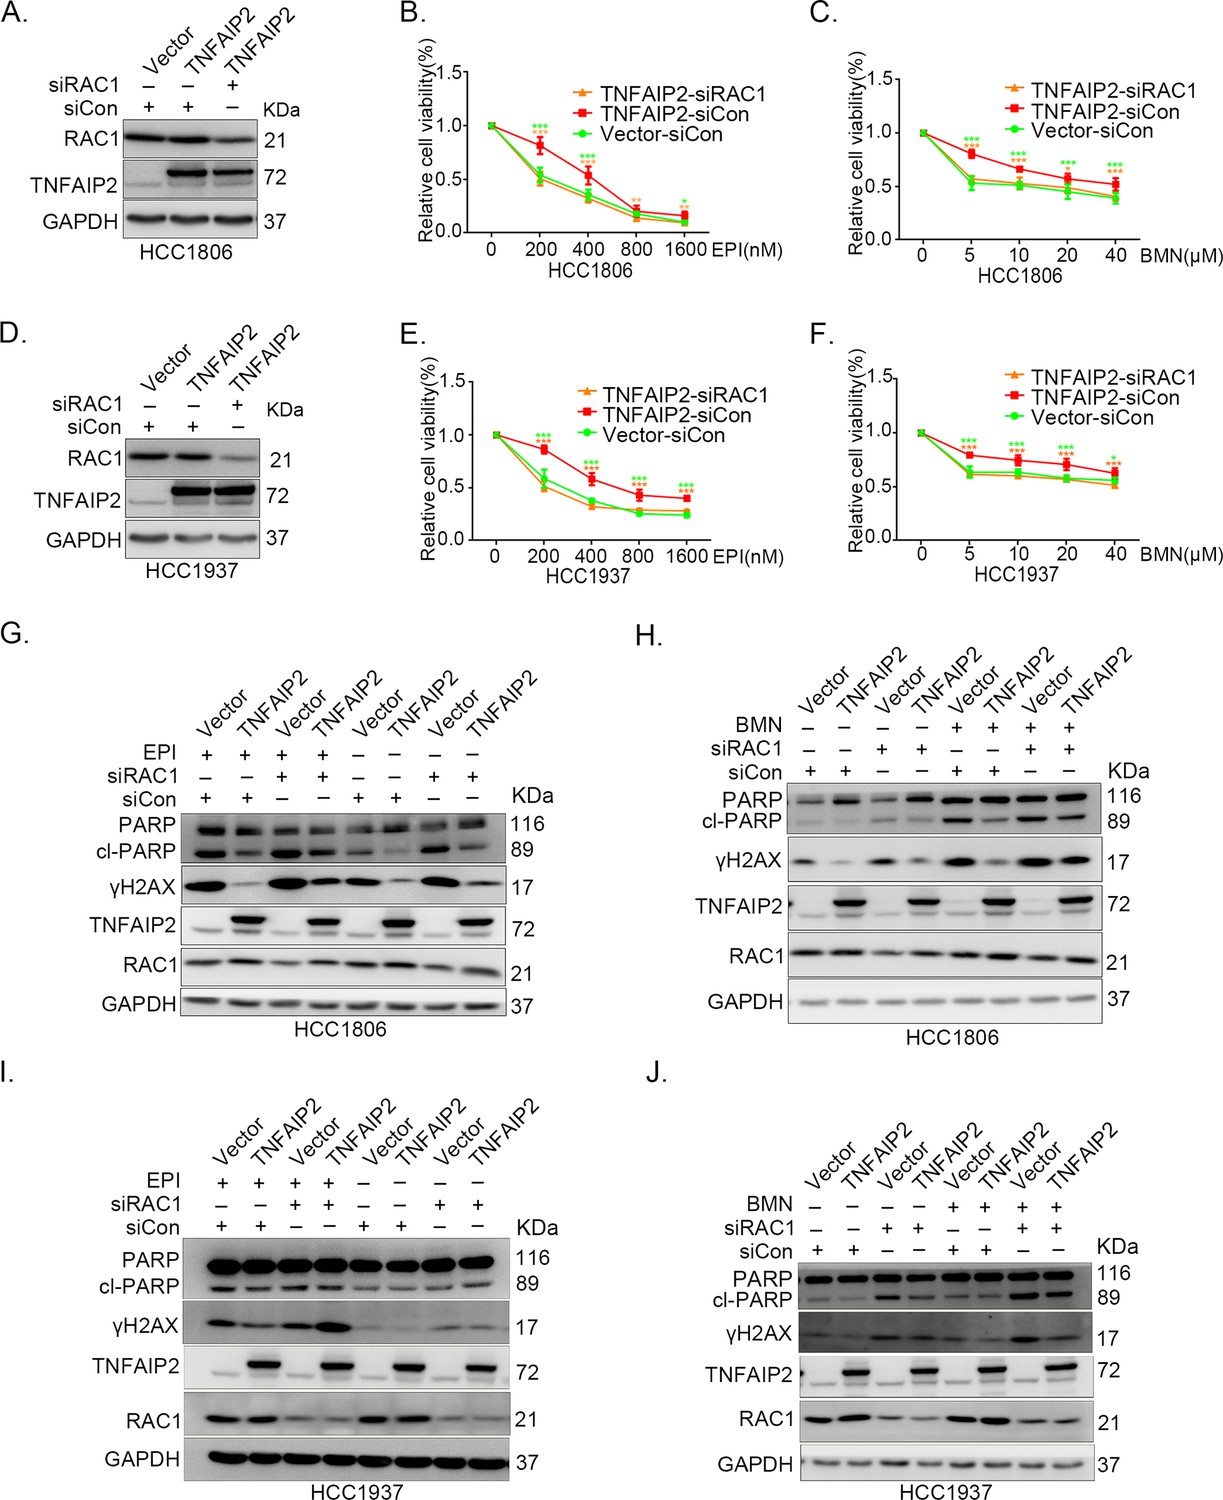
TNFAIP2 promotes triple-negative breast cancer (TNBC) drug resistance and DNA damage repair via RAC1.
RAC1 knockdown abolished TNFAIP2-induced TNBC resistance to EPI and BMN. HCC1806 (A–C) and HCC1937 (D–F) cells with stable TNFAIP2 overexpression were transfected with RAC1 or control siRNA, followed by treatment with EPI (0–1600 nM) and BMN (0–40 μM) for 48 or 72 hr, respectively. Cell viability was measured by the SRB assay. Statistical analysis was performed using one-way analysis of variance (ANOVA), n = 3–9, *p < 0.05, **p < 0.01, ***p < 0.001. Protein expression levels were analyzed by western blotting (WB). RAC1 depletion abolished TNFAIP2-induced DNA damage decrease in response to EPI and BMN. HCC1806 (G–H) and HCC1937 (I–J) cells with stable TNFAIP2 overexpression were transfected with RAC1 or control siRNA, followed by treatment with EPI (400 or 800 nM) and BMN (10 μM) for 24 hr, respectively. Protein expression levels were analyzed by WB.
-
Figure 3—source data 1
Uncropped western blot images for Figure 3.
- https://cdn.elifesciences.org/articles/88483/elife-88483-fig3-data1-v1.pptx
Figure 3—figure supplement 1
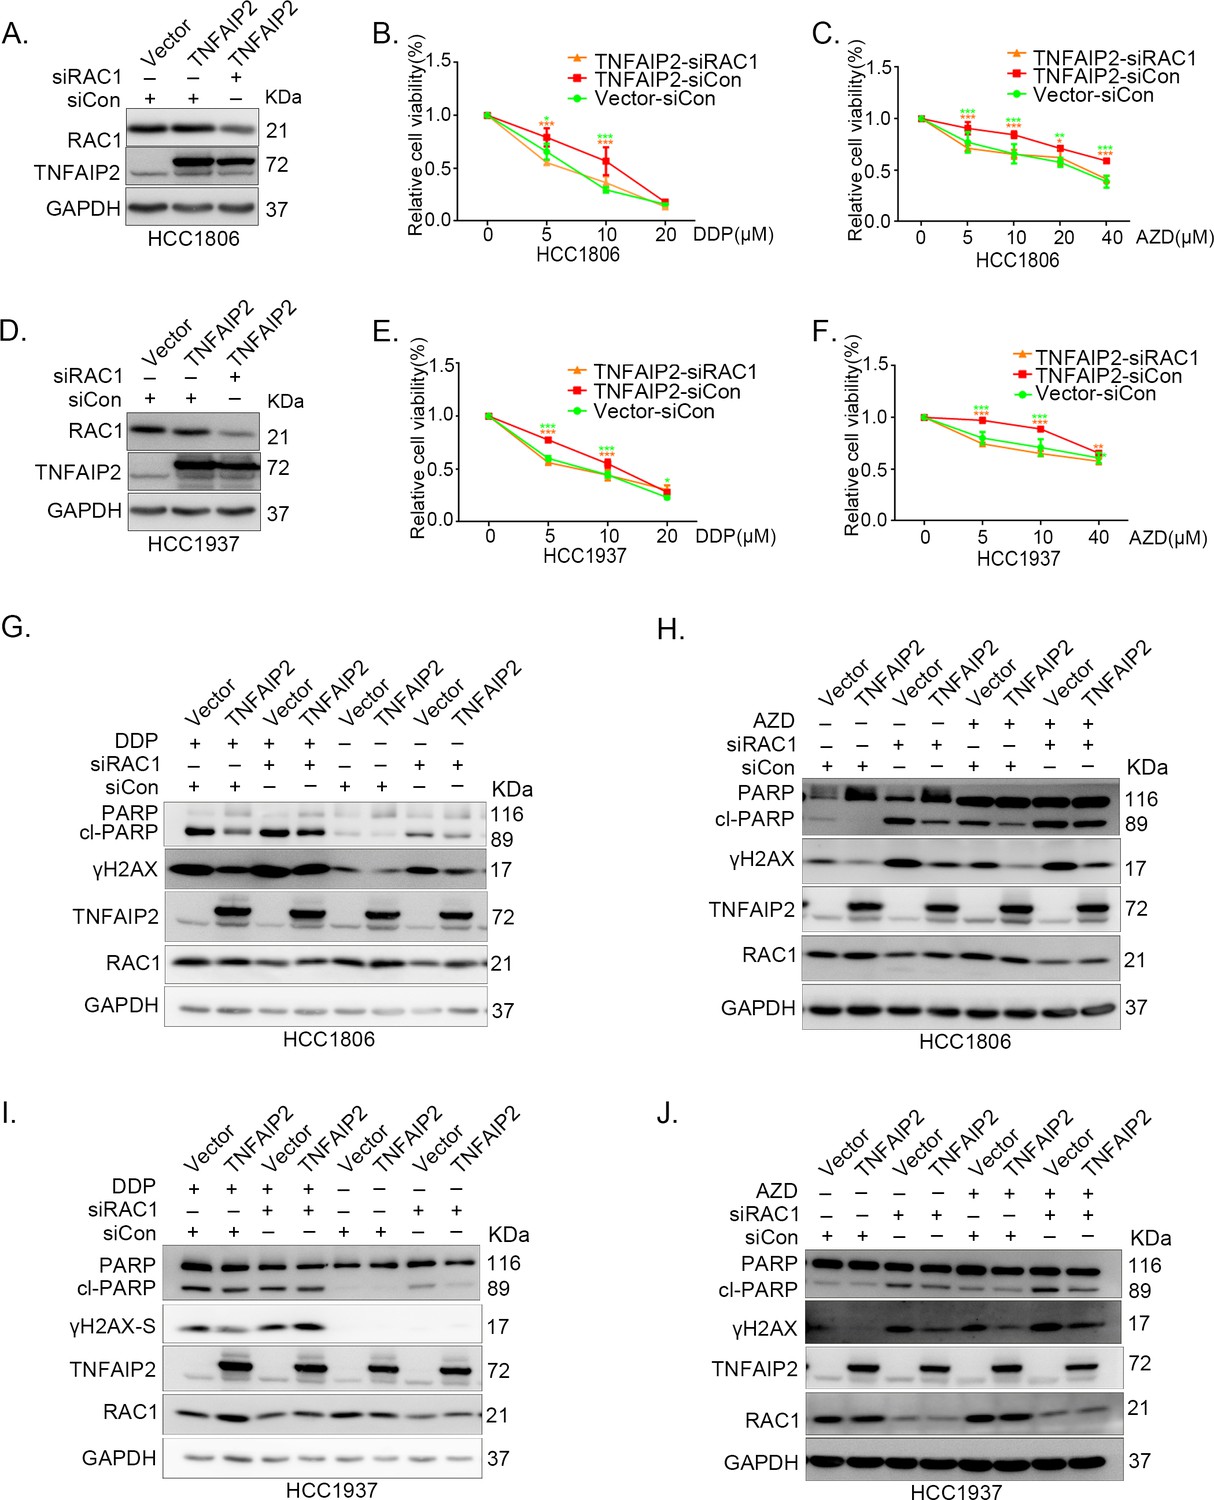
TNFAIP2 promotes triple-negative breast cancer (TNBC) drug resistance and DNA damage repair via RAC1.
RAC1 knockdown abolished TNFAIP2-induced TNBC resistance to DDP and AZD. HCC1806 (A–C) and HCC1937 (D–F) cells with stable TNFAIP2 overexpression were transfected with RAC1 or control siRNA, followed by treatment with DDP (0–40 μM) and AZD (0–40 μM) for 48 or 72 hr, respectively. Cell viability was measured by the SRB assay. Statistical analysis was performed using one-way analysis of variance (ANOVA), n = 3–4, *p < 0.05, **p < 0.01, ***p < 0.001. Protein expression levels were analyzed by western blotting (WB). (G–J) RAC1 depletion abolished TNFAIP2-induced DNA damage decrease in response to DDP and AZD. HCC1806 (G, H) and HCC1937 (I, J) cells with stable TNFAIP2 overexpression were transfected with RAC1 or control siRNA, followed by treatment with DDP (20 μM) and AZD (10 μM) for 24 hr, respectively. Protein expression levels were analyzed by WB.
-
Figure 3—figure supplement 1—source data 1
Uncropped western blot images for Figure 3—figure supplement 1.
- https://cdn.elifesciences.org/articles/88483/elife-88483-fig3-figsupp1-data1-v1.pptx
Figure 4 with 1 supplement
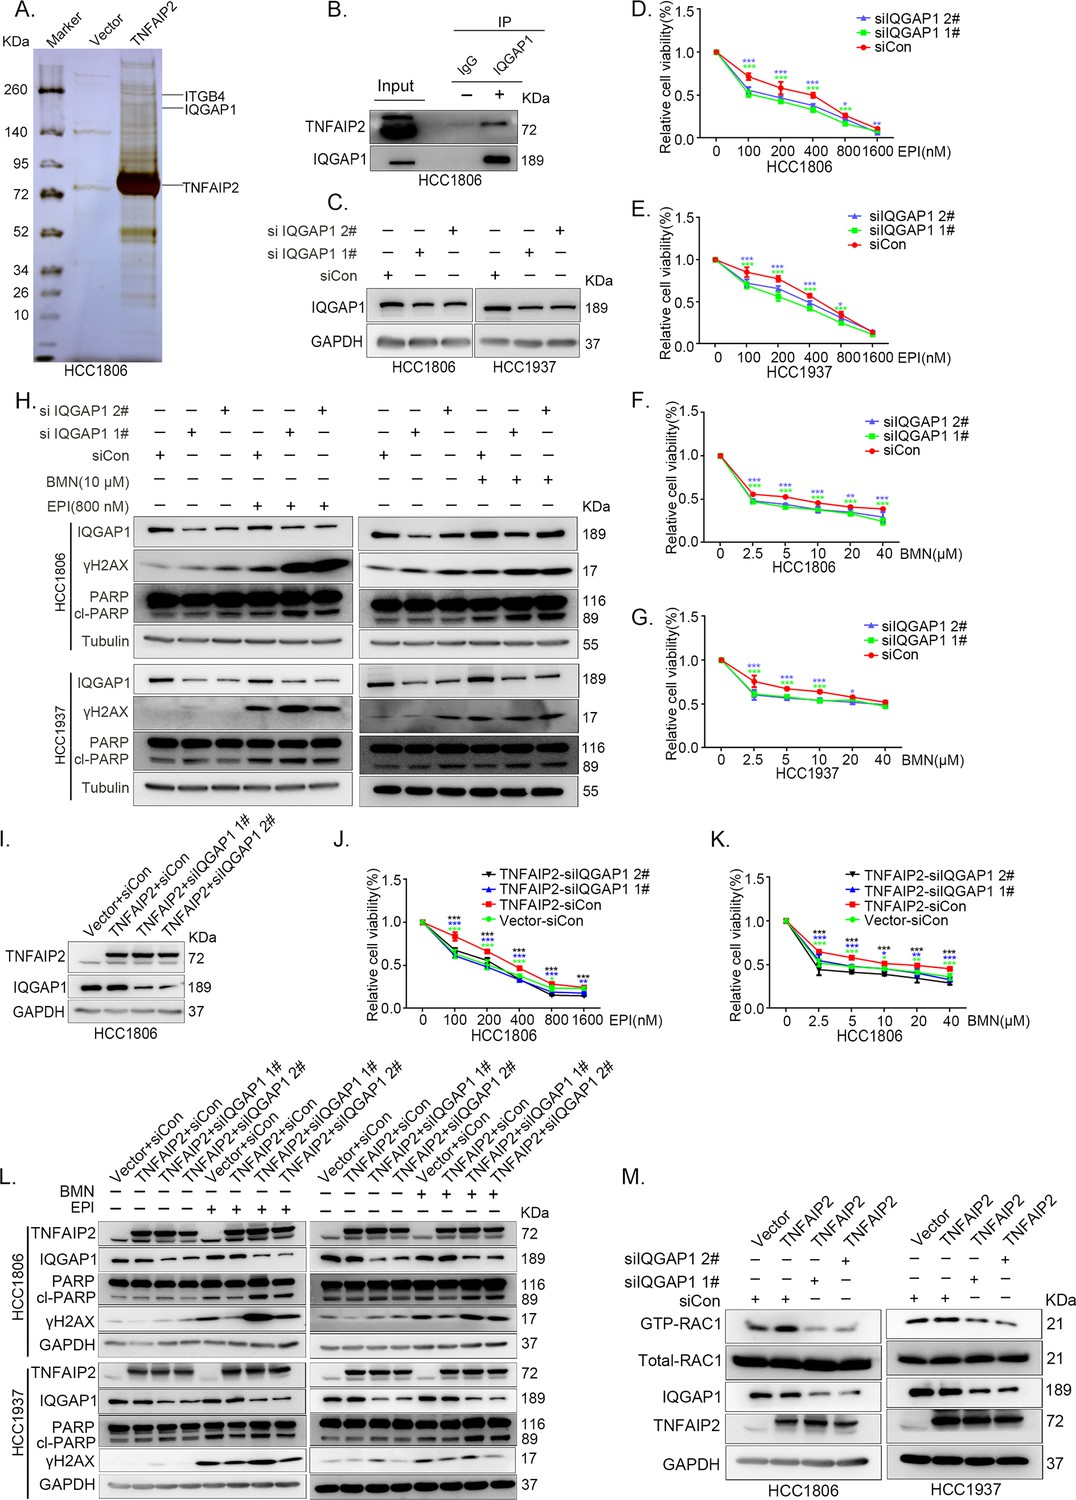
IQGAP1 mediates RAC1 activation by TNFAIP2 and promotes triple-negative breast cancer (TNBC) drug resistance.
(A) The IP-MS result of TNFAIP2 in HCC1806 cells. (B) Endogenous TNFAIP2 interacts with IQGAP1 in HCC1806 cells. Endogenous TNFAIP2 protein was immunoprecipitated using ananti-IQGAP1 antibody. Immunoglobulin (Ig)G served as the negative control. Endogenous TNFAIP2 was detected by western blotting (WB). (C–G) IQGAP1 knockdown in HCC1806 and HCC1937 cells significantly decreased cell viability in the presence of EPI (0–1600 nM) and BMN (0–40 μM), as measured by the SRB assay. Statistical analysis was performed using one-way analysis of variance (ANOVA), n = 3–6, *p < 0.05, **p < 0.01, ***p < 0.001. IQGAP1 protein expression was detected by WB. (H) IQGAP1 knockdown in HCC1806 and HCC1937 cells increased DNA damage of EPI and BMN. HCC1806 and HCC1937 cells with IQGAP1 knockdown were treated with 800 nM EPI for 24 hr and 10 μM BMN for 24 hr, respectively. ITGB4, γH2AX, and PARP protein expression was detected by WB. (I–K) IQGAP1 knockdown abolished TNFAIP2-confered resistance to EPI and BMN. HCC1806 cells with stable TNFAIP2 overexpression were transfected with IQGAP1 or control siRNA, followed by treatment with EPI (0–1600 nM) and BMN (0–40 μM) for 48 or 72 hr, respectively. Cell viability was measured by the SRB assay. Statistical analysis was performed using one-way ANOVA, n = 3, *p < 0.05, **p < 0.01, ***p < 0.001. IQGAP1 protein expression was detected by WB. (L) IQGAP1 knockdown abolished TNFAIP2-confered resistance to EPI and BMN. HCC1806 and HCC1937 cells with stable TNFAIP2 overexpression were transfected with IQGAP1 or control siRNA, followed by treatment with EPI (800 nM) and BMN (10 μM) for 24 hr, respectively. Protein expression levels were analyzed by WB. (M) IQGAP1 knockdown abolished TNFAIP2-confered RAC1 activation. HCC1806 and HCC1937 cells with stable TNFAIP2 overexpression were transfected with IQGAP1 or control siRNA. GTP-RAC1 levels were assessed using PAK-PBD beads.
-
Figure 4—source data 1
Uncropped western blot images for Figure 4.
- https://cdn.elifesciences.org/articles/88483/elife-88483-fig4-data1-v1.pptx
Figure 4—figure supplement 1
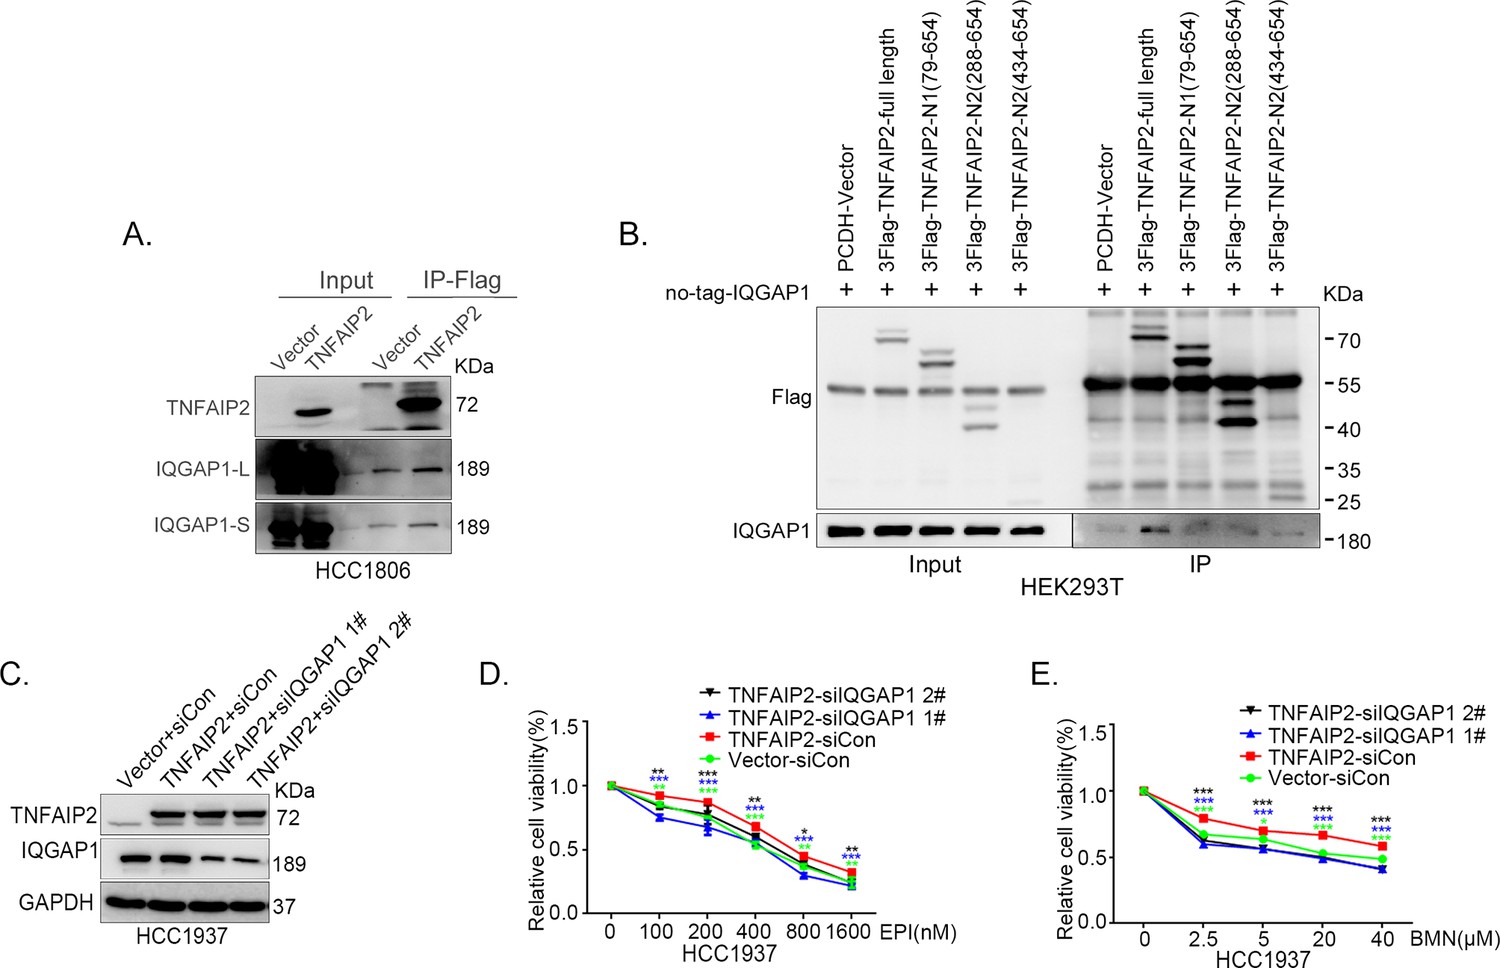
IQGAP1 mediates RAC1 activation by TNFAIP2 and promotes triple-negative breast cancer (TNBC) drug resistance.
(A) TNFAIP2 interacts with IQGAP1.HCC1806 cells with stable TNFAIP2 overexpression were collected from flag-tagged TNFAIP2 cell lysates for immunoprecipitation assays using Flag-M2 beads, and IQGAP1 was detected by western blotting (WB). (B) Mapping the domains of TNFAIP2 that interact with IQGAP1. Flag-tagged full-length or truncated TNFAIP2 was transfected into HEK293T cells with no-tagged full-length IQGAP1. Cell lysates were collected for immunoprecipitation using Flag-M2 beads, and IQGAP1 was detected by WB. (C–E) IQGAP1 knockdown abolished TNFAIP2-confered resistance to EPI and BMN. HCC1937 cells with stable TNFAIP2 overexpression were transfected with IQGAP1 or control siRNA, followed by treatment with EPI (0–1600 nM) and BMN (0–40 μM) for 48 or 72 hr, respectively. Cell viability was measured by the SRB assay. Statistical analysis was performed using one-way analysis of variance (ANOVA), n = 3, *p < 0.05, **p < 0.01, ***p < 0.001. Protein expression levels were analyzed by WB.
-
Figure 4—figure supplement 1—source data 1
Uncropped western blot images for Figure 4—figure supplement 1.
- https://cdn.elifesciences.org/articles/88483/elife-88483-fig4-figsupp1-data1-v1.pptx
Figure 5 with 2 supplements
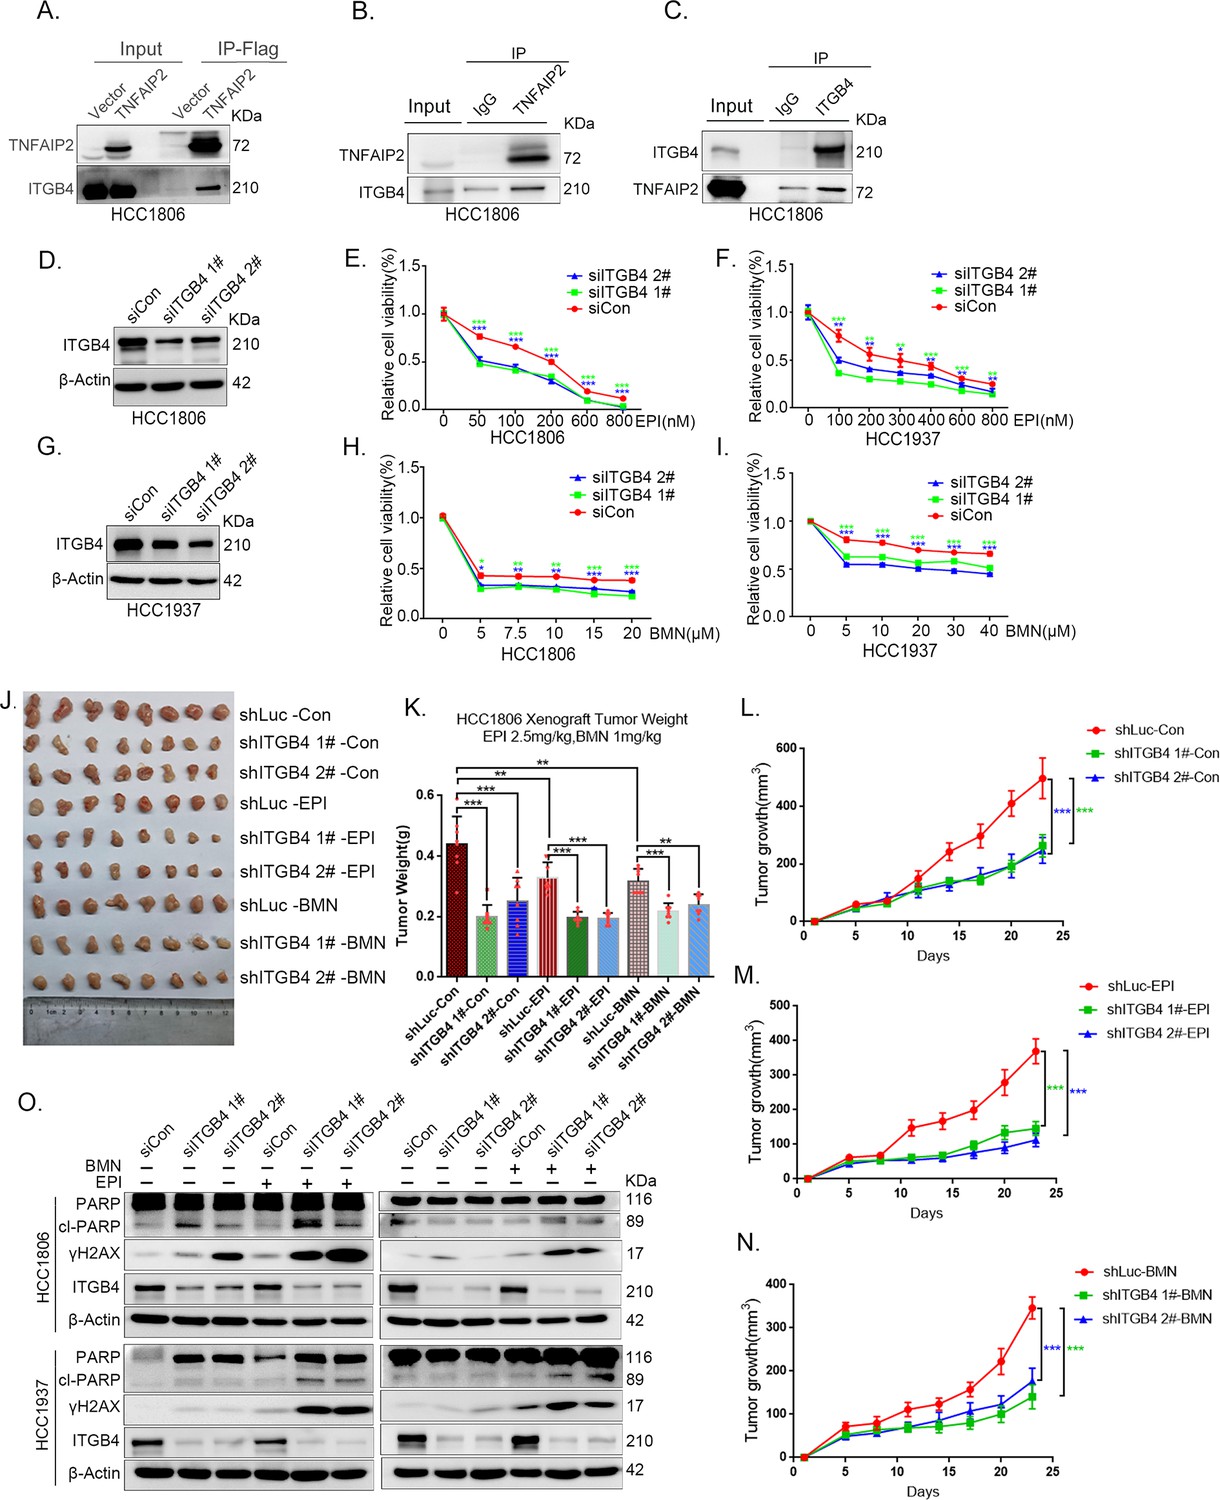
ITGB4 interacts with TNFAIP2 and promotes triple-negative breast cancer (TNBC) drug resistance and DNA damage repair.
(A) TNFAIP2 interacts with ITGB4.HCC1806 cells with stable TNFAIP2 overexpression were collected from flag-tagged TNFAIP2 cell lysates for immunoprecipitation assays using Flag-M2 beads, and ITGB4 was detected by western blotting (WB). (B) Endogenous TNFAIP2 interacts with ITGB4 in HCC1806 cells. Endogenous TNFAIP2 protein was immunoprecipitated using an anti-TNFAIP2 antibody. IgG served as the negative control. Endogenous ITGB4 was detected by WB. (C) Endogenous ITGB4 interacts with TNFAIP2 in HCC1806 cells. Endogenous ITGB4 protein was immunoprecipitated using an anti-ITGB4 antibody. IgG served as the negative control. Endogenous TNFAIP2 was detected by WB. (D–I) ITGB4 knockdown in HCC1806 and HCC1937 cells significantly decreased cell viability in the presence of EPI (0–800 nM) and BMN (0–40 μM), as measured by the SRB assay. Statistical analysis was performed using one-way analysis of variance (ANOVA), n = 3, *p < 0.05, **p < 0.01, ***p < 0.001. ITGB4 protein expression was detected by WB. (J–N) ITGB4 depletion promotes HCC1806 breast cancer cell sensitivity to EPI and BMN treatment in vivo. HCC1806 cells with stable ITGB4 knockdown were transplanted into the fat pad of 7-week-old female nude mice. When the average tumor size reached approximately 50 mm3 after inoculation, the mice in each group were randomly divided into two subgroups (n = 4/group) to receive EPI (2.5 mg/kg), BMN (1 mg/kg), or vehicle control for 22 days (J). Tumor masses were collected and weighed at the end of the experiments (K), and tumor size was measured twice a week (L–N). *p < 0.05, **p < 0.01, ***p < 0.001, t-test. (O) ITGB4 knockdown increased DNA damage of EPI and BMN. HCC1806 and HCC1937 cells with ITGB4 knockdown were treated with 400 nM EPI for 24 hr and 5 μM BMN for 24 hr, respectively. ITGB4, γH2AX, and PARP protein expression was detected by WB.
-
Figure 5—source data 1
Uncropped western blot images for Figure 5.
- https://cdn.elifesciences.org/articles/88483/elife-88483-fig5-data1-v1.pptx
Figure 5—figure supplement 1
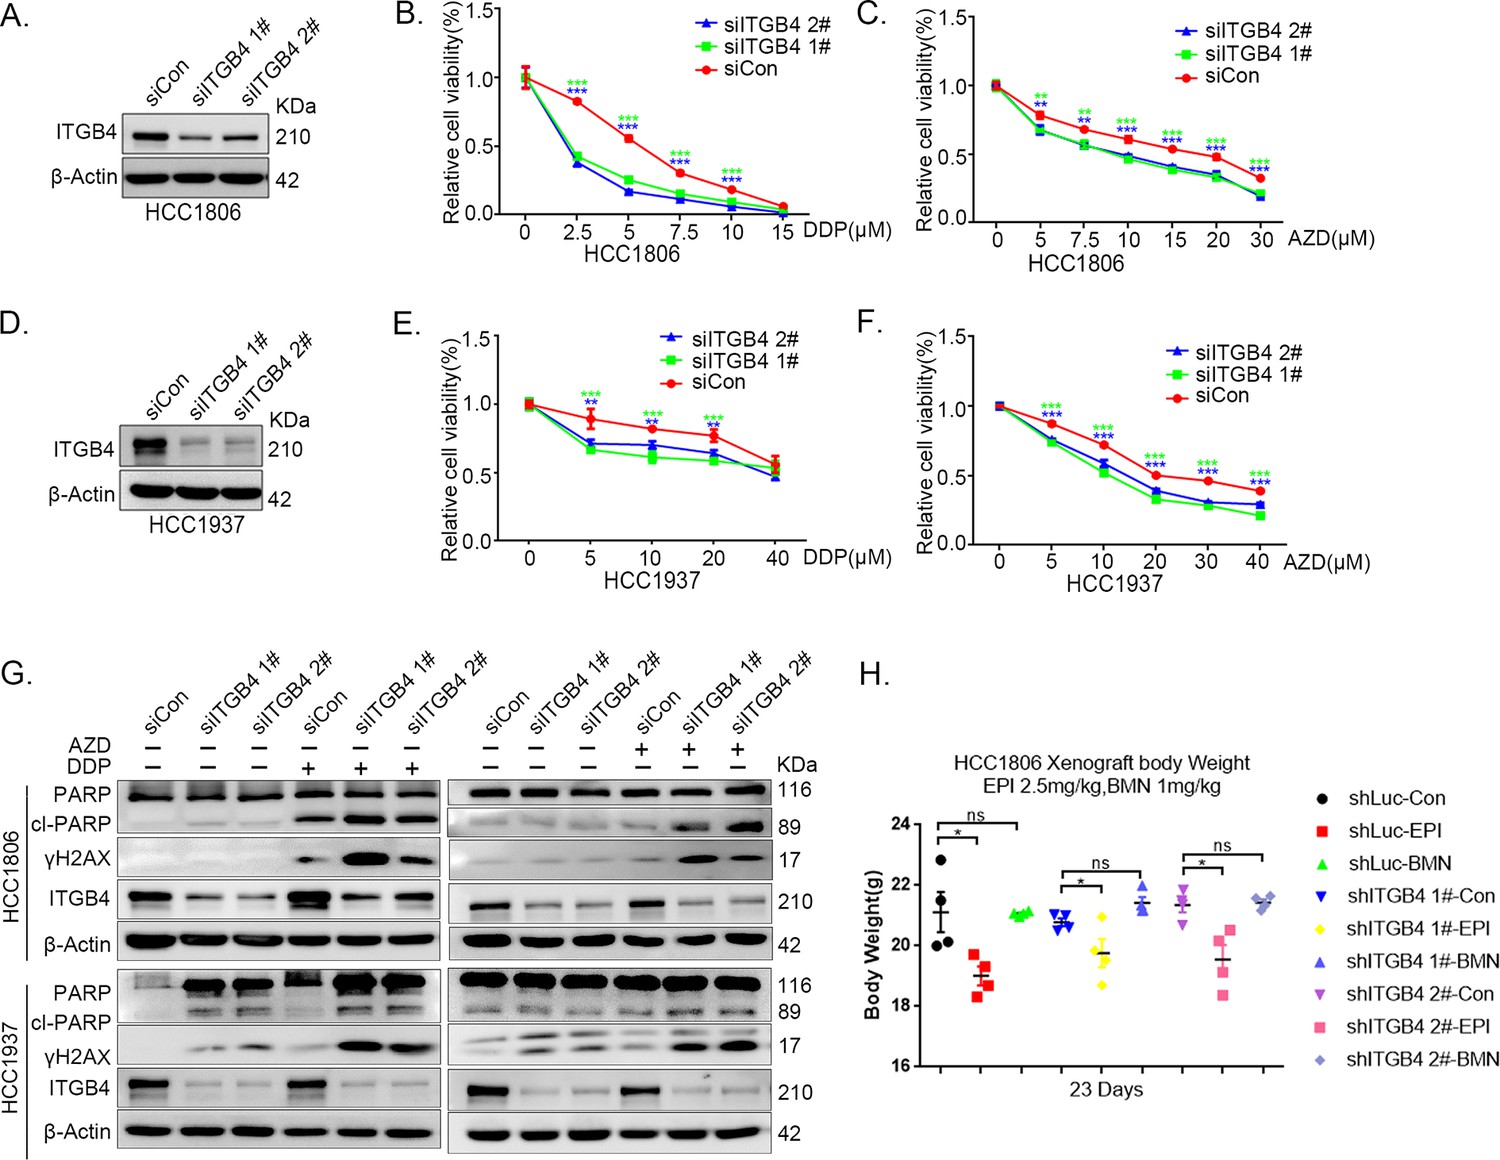
ITGB4 interacts with TNFAIP2 and promotes triple-negative breast cancer (TNBC) drug resistance and DNA damage repair.
(A–F) ITGB4 knockdown in HCC1806 and HCC1937 cells significantly decreased cell viability in the presence of DDP (0–40 μM) and AZD (0–40 μM), as measured by the SRB assay. Statistical analysis was performed using one-way analysis of variance (ANOVA), n = 3, *p < 0.05, **p < 0.01, ***p < 0.001. ITGB4 protein expression was detected by western blotting (WB). (G) ITGB4 knockdown increased DNA damage of DDP and AZD. HCC1806 and HCC1937 cells with ITGB4 knockdown were treated with 5 or 7.5 μM DDP for 24 hr and 15 or 20 μM AZD for 24 hr, respectively. ITGB4, γH2AX, and PARP protein expression was detected by WB. (H) Mouse masses were collected and weighed at the end of the experiments.
-
Figure 5—figure supplement 1—source data 1
Uncropped western blot images for Figure 5—figure supplement 1.
- https://cdn.elifesciences.org/articles/88483/elife-88483-fig5-figsupp1-data1-v1.pptx
Figure 5—figure supplement 2
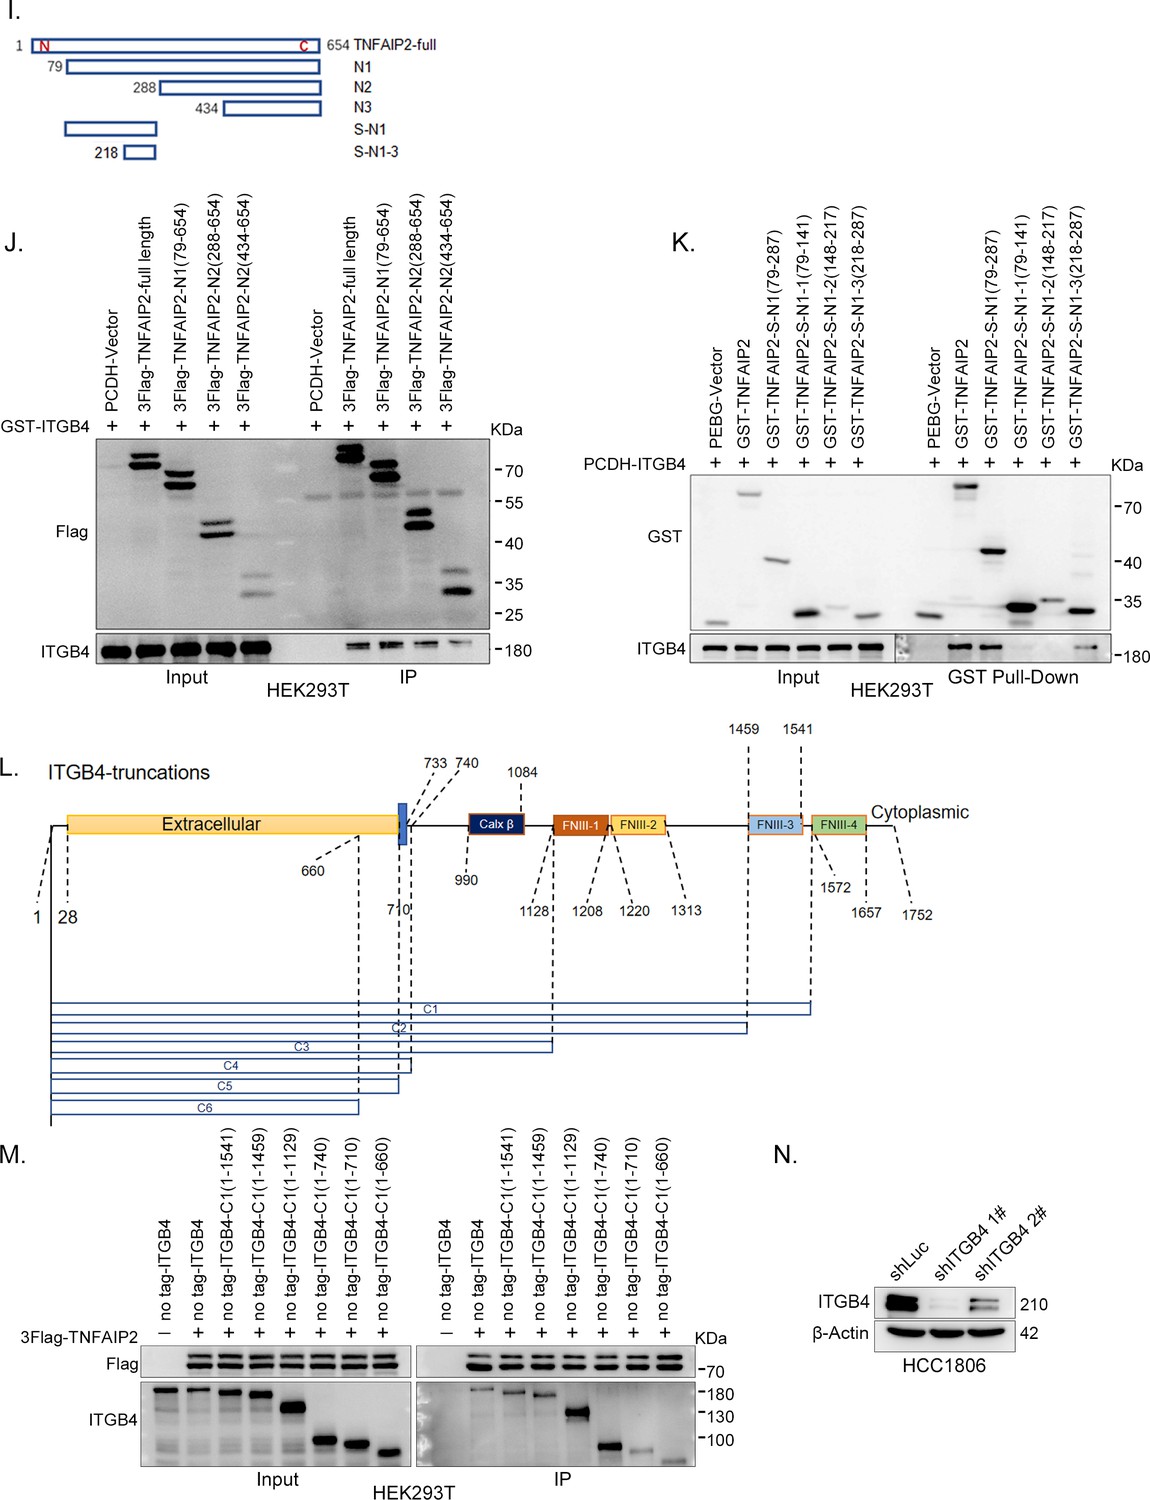
ITGB4 interacts with TNFAIP2 and promotes triple-negative breast cancer (TNBC) drug resistance and DNA damage repair.
(I) The model of full-length or truncated TNFAIP2. (J) Mapping the domains of TNFAIP2 that interact with ITGB4. GST-tagged full-length ITGB4 was transfected into HEK293T cells with flag-tagged full-length or truncated TNFAIP2. TNFAIP2 protein was immunoprecipitated using Flag-M2 beads, and ITGB4 was detected by western blotting (WB). (K) Mapping the domains of TNFAIP2 that interact with ITGB4. No-tagged full-length ITGB4 was transfected into HEK293T cells with GST-tagged full-length or truncated TNFAIP2. Cell lysates were collected for the GST pull-down assay, and ITGB4 was detected by WB. (L) The model of full-length or truncated ITGB4. (M) Mapping the domains of ITGB4 that interact with TNFAIP2. Flag-tagged full-length TNFAIP2 was transfected into HEK293T cells with no-tagged full-length or truncated ITGB4. Cell lysates were collected for immunoprecipitation using Flag-M2 beads, and ITGB4 was detected by WB. (N) ITGB4 was stably knocked down in HCC1806, as determined by WB.
-
Figure 5—figure supplement 2—source data 1
Uncropped western blot images for Figure 5—figure supplement 2.
- https://cdn.elifesciences.org/articles/88483/elife-88483-fig5-figsupp2-data1-v1.pptx
Figure 6
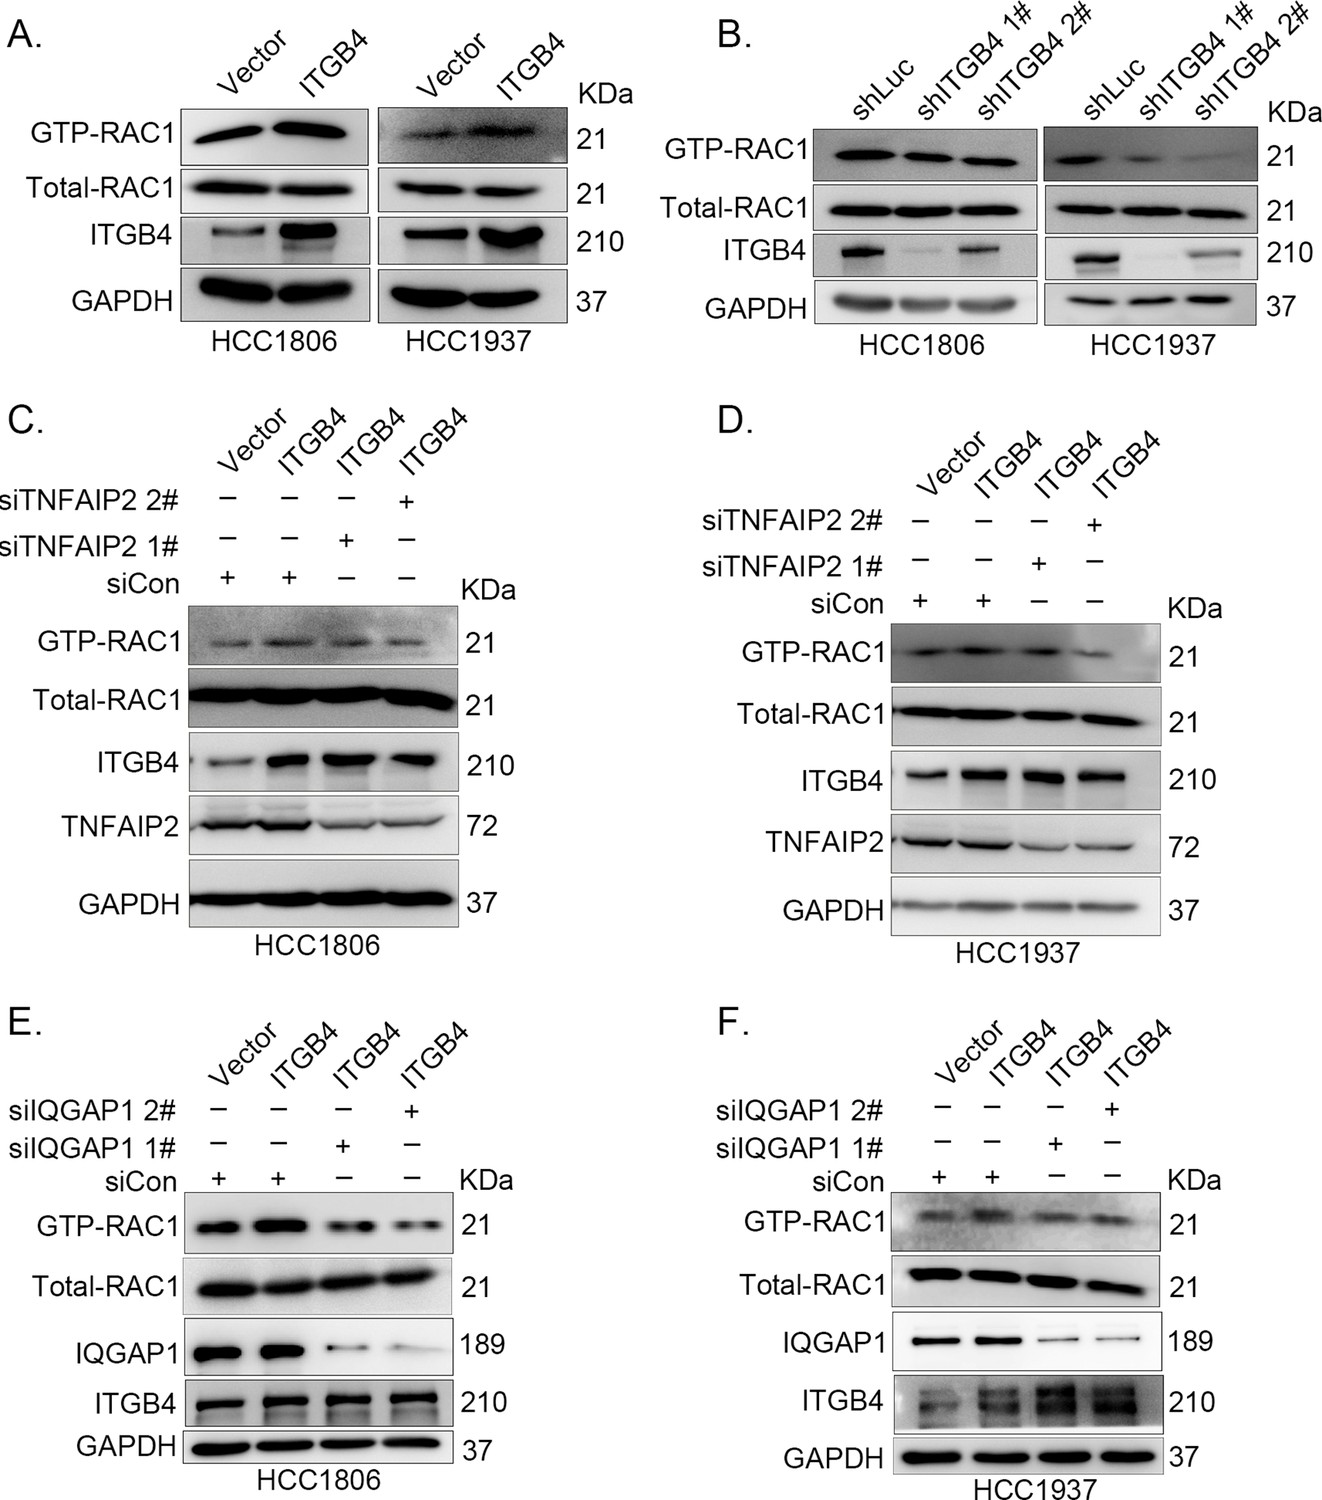
ITGB4 activates RAC1 through TNFAIP2 and IQGAP1.
(A) Overexpression of ITGB4-increased GTP-RAC1 levels in HCC1806 and HCC1937 cells. GTP-RAC1 were assessed using PAK-PBD beads. (B) Knockdown of ITGB4 by shRNA decreased GTP-RAC1 levels in HCC1806 and HCC1937 cells. ITGB4 activates RAC1 through TNFAIP2. HCC1806 (C) and HCC1937 (D) cells with stable ITGB4 overexpression were transfected with TNFAIP2 or control siRNA. ITGB4 activates RAC1 through IQGAP1. HCC1806 (E) and HCC1937 (F) cells with stable ITGB4 overexpression were transfected with IQGAP1 or control siRNA.
-
Figure 6—source data 1
Uncropped western blot images for Figure 6.
- https://cdn.elifesciences.org/articles/88483/elife-88483-fig6-data1-v1.pptx
Figure 7 with 2 supplements
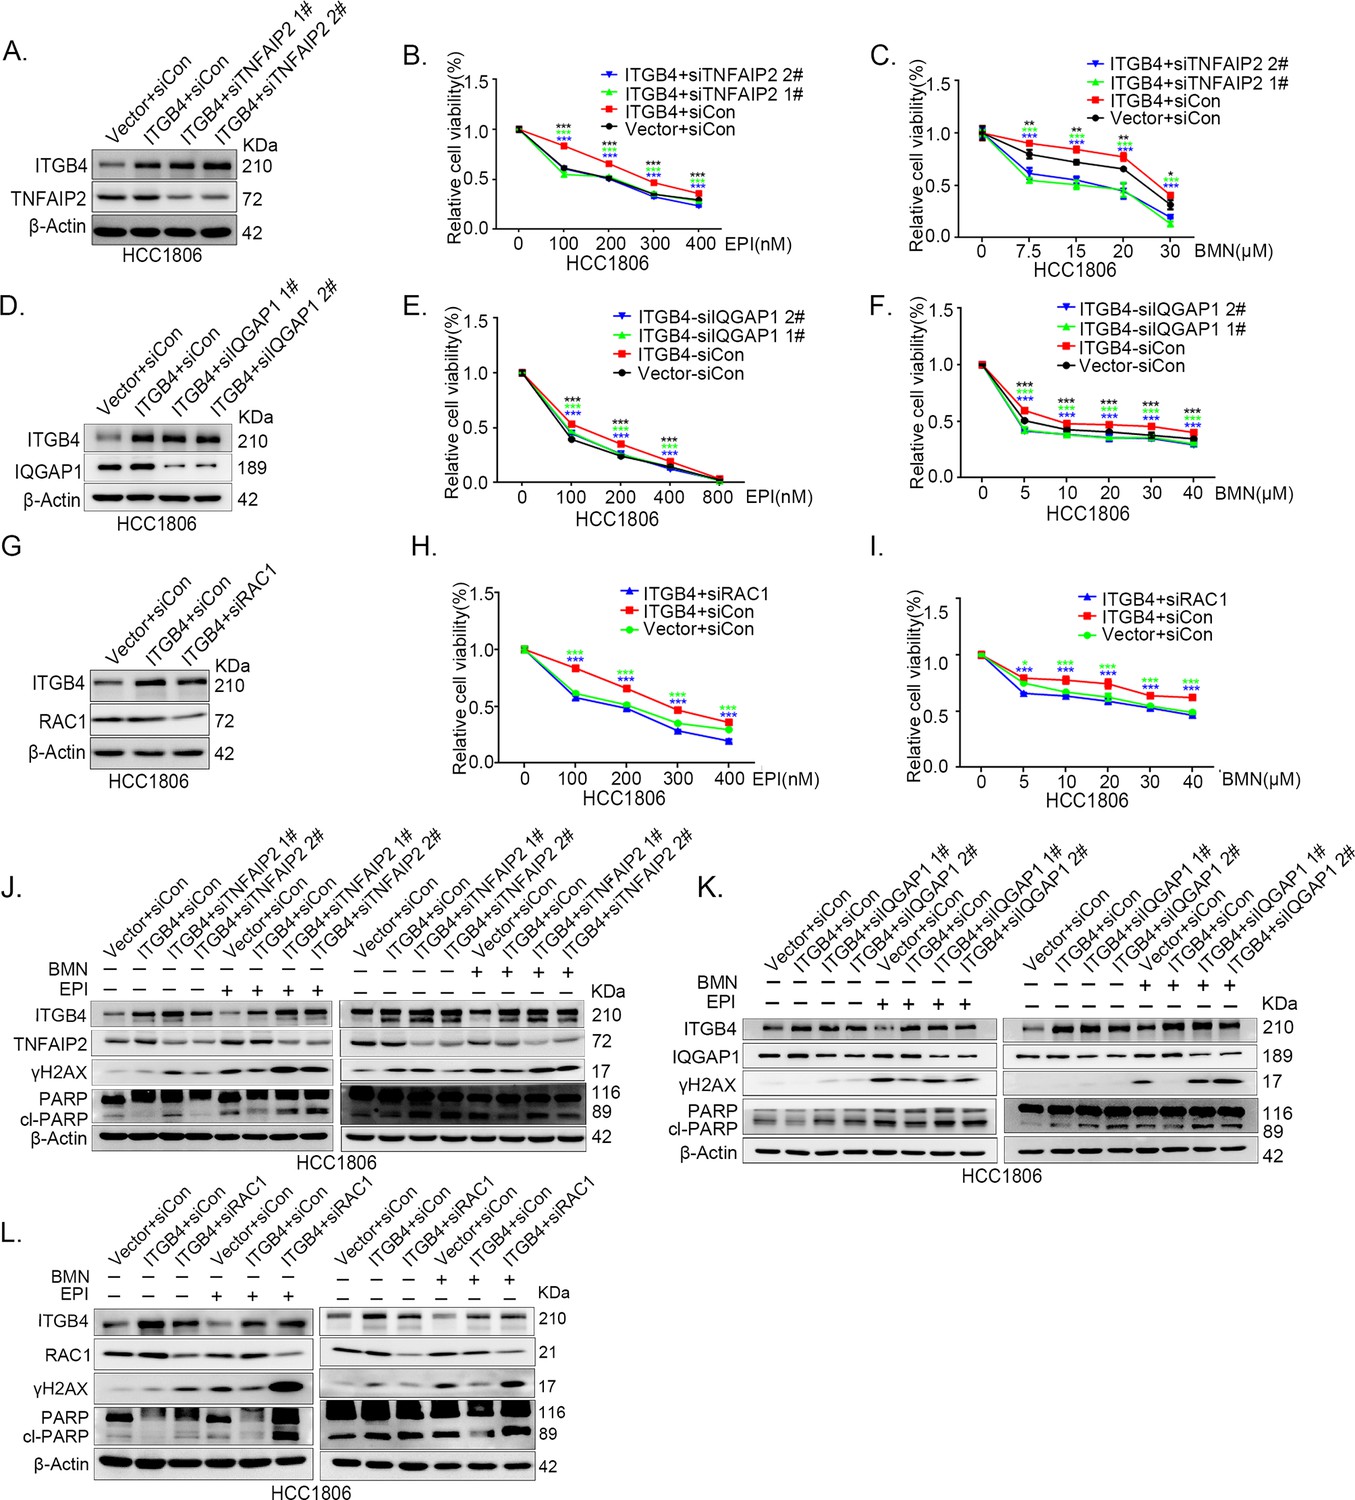
ITGB4 promotes triple-negative breast cancer (TNBC) drug resistance via TNFAIP2/IQGAP1/RAC1.
(A–C) ITGB4 promotes TNBC drug resistance through TNFAIP2. TNFAIP2 knockdown abolished ITGB4-induced resistance to EPI and BMN. HCC1806 cells with stable ITGB4 overexpression were transfected with TNFAIP2 or control siRNA, followed by treatment with EPI (0–400 nM) and BMN (0–30 μM) for 48 or 72 hr, respectively. Cell viability was measured by the SRB assay. Statistical analysis was performed using one-way analysis of variance (ANOVA), n = 3, *p < 0.05, **p < 0.01, ***p < 0.001. Protein expression levels were analyzed by western blotting (WB). (D–F) ITGB4 promotes TNBC drug resistance through IQGAP1. HCC1806 cells with stable ITGB4 overexpression were transfected with IQGAP1 or control siRNA, followed by treatment with EPI (0–800 nM) and BMN (0–40 μM) for 48 or 72 hr, respectively. Cell viability was measured by the SRB assay. Statistical analysis was performed using one-way ANOVA, n = 3, *p < 0.05, **p < 0.01, ***p < 0.001. Protein expression levels were analyzed by WB. (G–I) ITGB4 promotes TNBC drug resistance through RAC1. HCC1806 cells with stable ITGB4 overexpression were transfected with RAC1 or control siRNA, followed by treatment with EPI (0–400 nM) and BMN (0–40 μM) for 48 or 72 hr, respectively. Cell viability was measured by the SRB assay. Statistical analysis was performed using one-way ANOVA, n = 3, *p < 0.05, **p < 0.01, ***p < 0.001. Protein expression levels were analyzed by WB. (J) ITGB4 promotes DNA damage repair through TNFAIP2. HCC1806 cells with stable ITGB4 overexpression were transfected with TNFAIP2 or control siRNA, followed by treatment with EPI (400 nM) and BMN (5 μM) for 24 hr. Protein expression levels were analyzed by WB. (K) ITGB4 promotes DNA damage repair through IQGAP1. HCC1806 cells with stable ITGB4 overexpression were transfected with IQGAP1 or control siRNA, followed by treatment with EPI (400 nM) and BMN (5 μM) for 24 hr. Protein expression levels were analyzed by WB. (L) ITGB4 promotes DNA damage repair through RAC1. HCC1806 cells with stable ITGB4 overexpression were transfected with RAC1 or control siRNA, followed by treatment with EPI (400 nM) and BMN (5 μM) for 24 hr. Protein expression levels were analyzed by WB.
-
Figure 7—source data 1
Uncropped western blot images for Figure 7.
- https://cdn.elifesciences.org/articles/88483/elife-88483-fig7-data1-v1.pptx
Figure 7—figure supplement 1
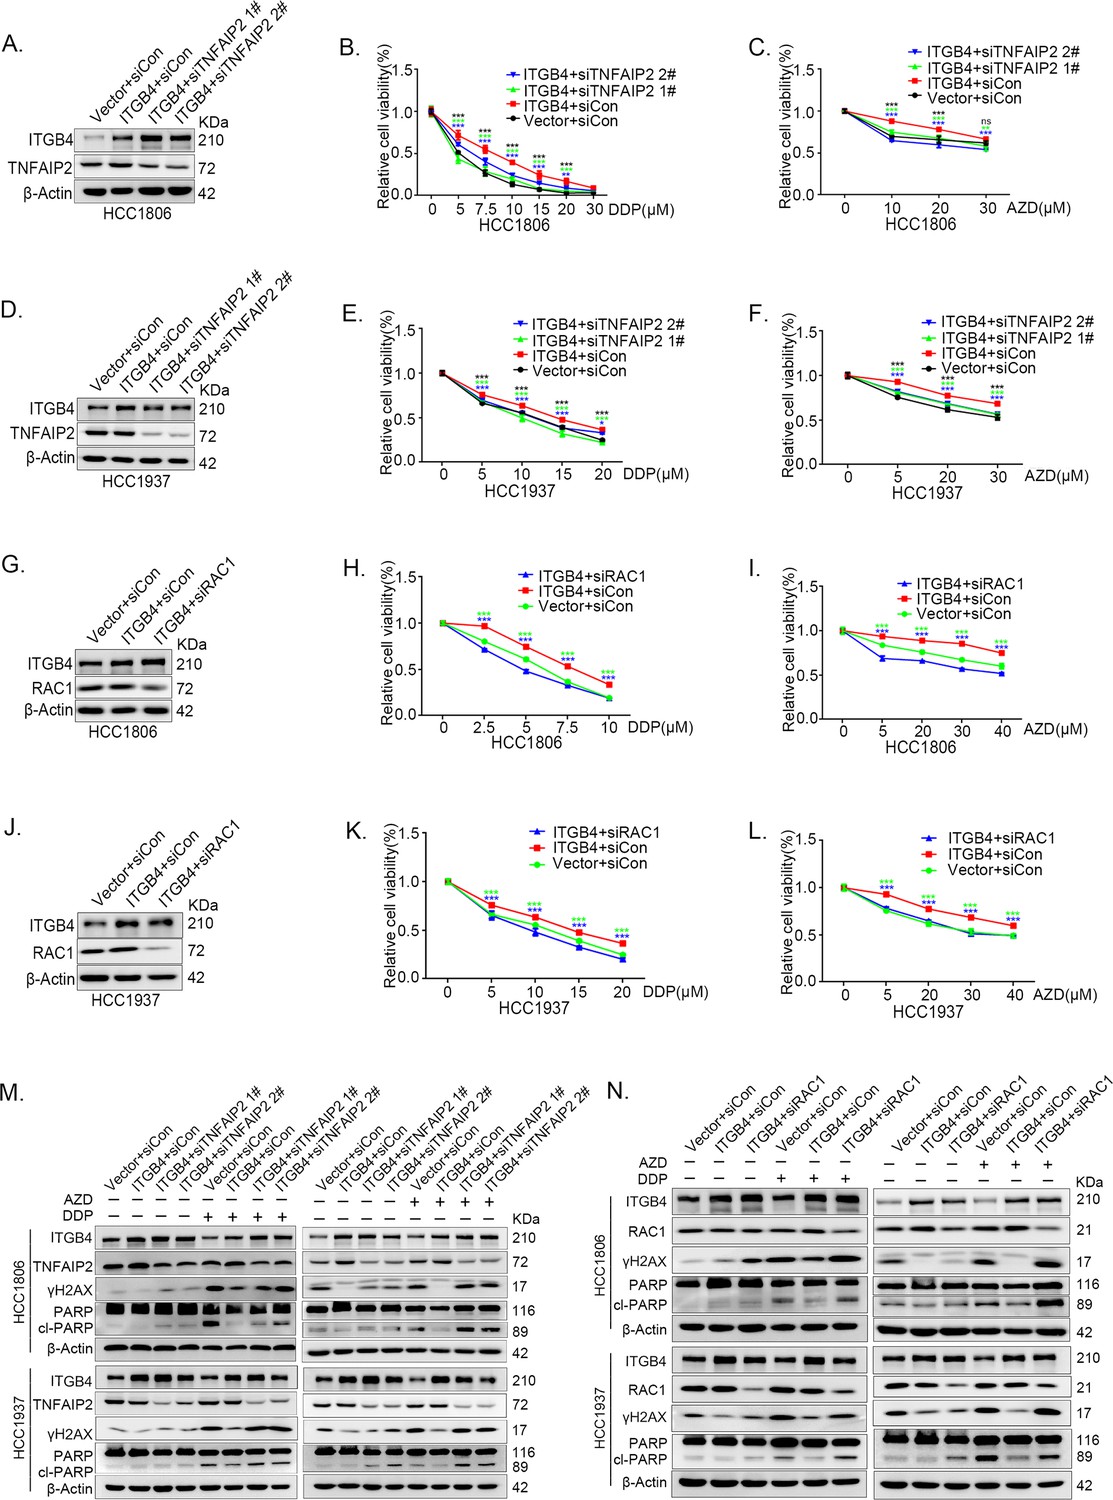
ITGB4 promotes triple-negative breast cancer (TNBC) drug resistance via TNFAIP2/IQGAP1/RAC1.
(A–F) ITGB4 promotes TNBC drug resistance through TNFAIP2. TNFAIP2 knockdown abolished ITGB4-induced resistance to DDP and AZD. HCC1806 (A–C) and HCC1937 (D–F) cells with stable ITGB4 overexpression were transfected with TNFAIP2 or control siRNA, followed by treatment with DDP (0–30 μM) and AZD (0–30 μM) for 48 or 72 hr, respectively. Cell viability was measured by the SRB assay. Protein expression levels were analyzed by western blotting (WB). (G–L) ITGB4 promotes TNBC drug resistance through RAC1. RAC1 knockdown abolished ITGB4-induced resistance to DDP and AZD. HCC1806 (G–I) and HCC1937 (J–L) cells with stable ITGB4 overexpression were transfected with RAC1 or control siRNA, followed by treatment with DDP (0–20 μM) and AZD (0–40 μM) for 48 or 72 hr, respectively. Cell viability was measured by the SRB assay. Statistical analysis was performed using one-way analysis of variance (ANOVA), n = 3, *p < 0.05, **p < 0.01, ***p < 0.001. Protein expression levels were analyzed by WB. (M) ITGB4 promotes DNA damage repair through TNFAIP2. HCC1806 and HCC1937 cells with stable ITGB4 overexpression were transfected with TNFAIP2 or control siRNA, followed by treatment with DDP (7.5 or 10 μM) and AZD (20 or 30 μM) for 24 hr. Protein expression levels were analyzed by WB. (N) ITGB4 promotes DNA damage repair through RAC1. HCC1806 and HCC1937 cells with stable ITGB4 overexpression were transfected with RAC1 or control siRNA, followed by treatment with DDP (7.5 μM) and AZD (20 μM or 30 μM) for 24 hr. Protein expression levels were analyzed by WB.
-
Figure 7—figure supplement 1—source data 1
Uncropped western blot images for Figure 7—figure supplement 1.
- https://cdn.elifesciences.org/articles/88483/elife-88483-fig7-figsupp1-data1-v1.pptx
Figure 7—figure supplement 2
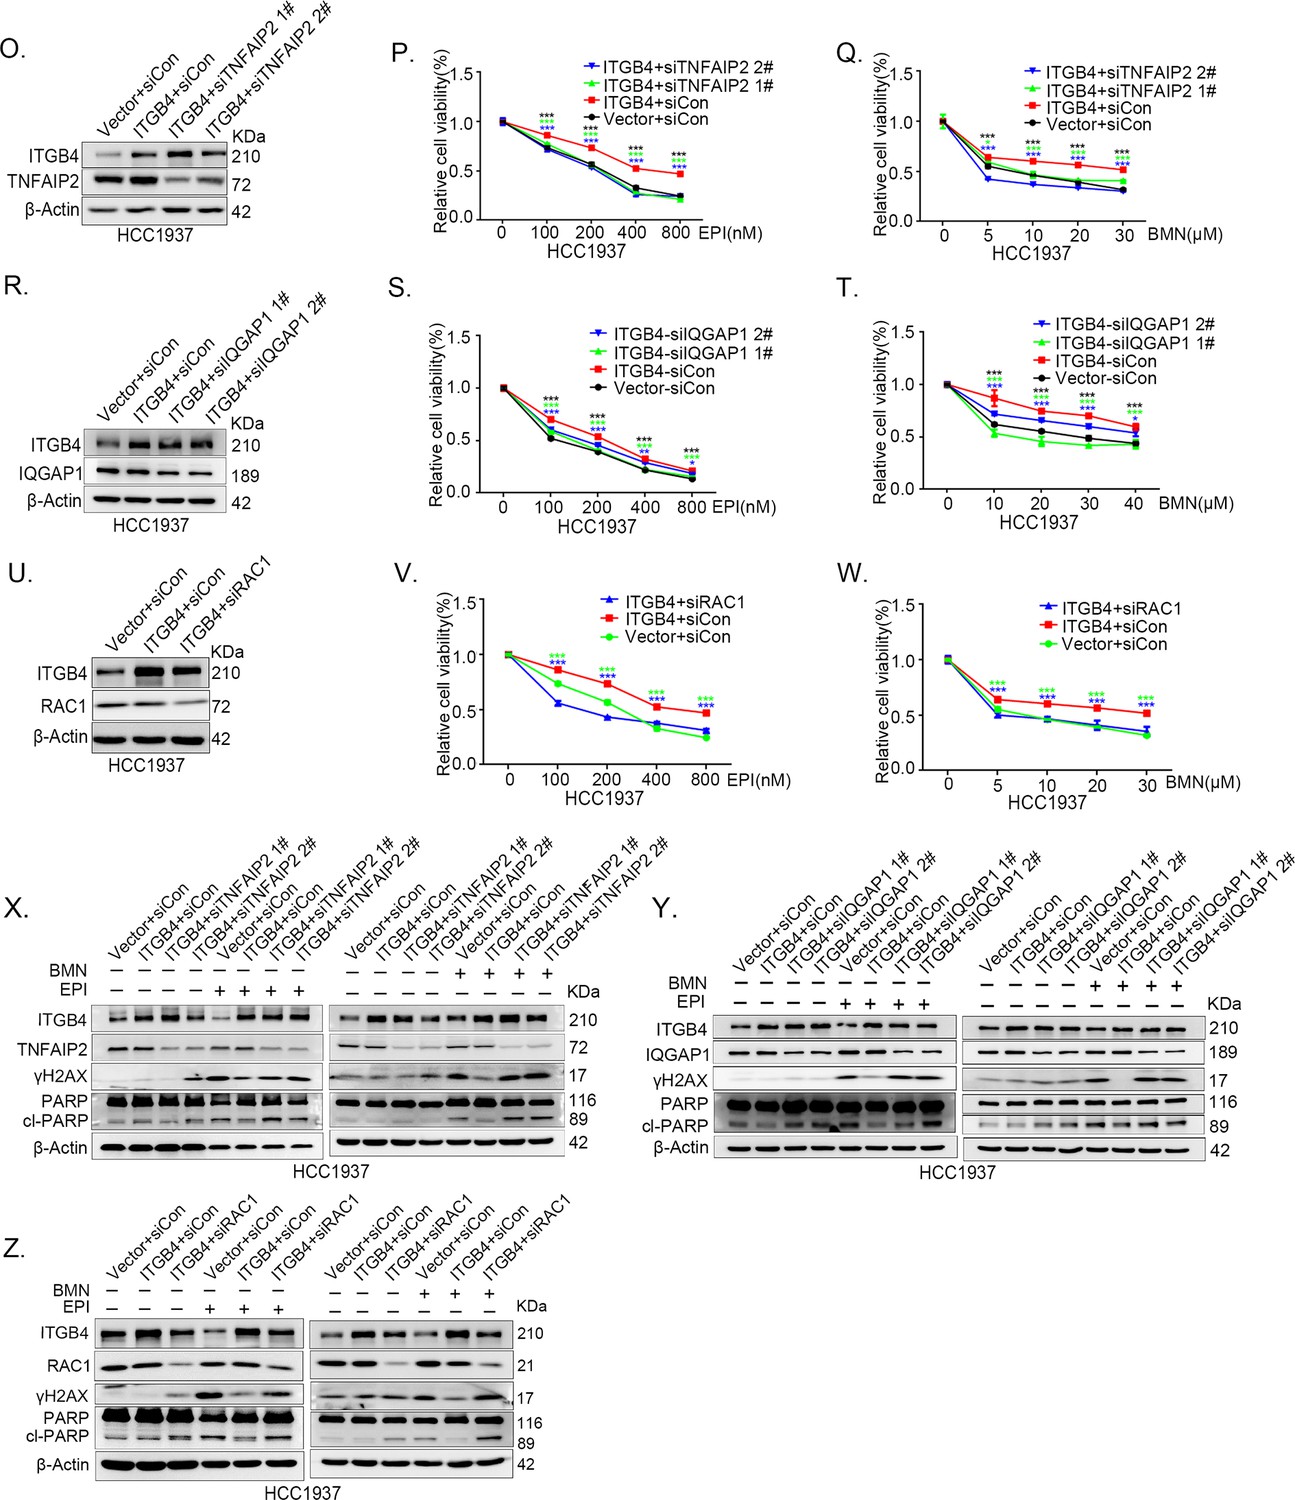
ITGB4 promotes triple-negative breast cancer (TNBC) drug resistance via TNFAIP2/IQGAP1/RAC1.
(O–Q) ITGB4 promotes TNBC drug resistance through TNFAIP2. TNFAIP2 knockdown abolished ITGB4-induced resistance to EPI and BMN. HCC1937 cells with stable ITGB4 overexpression were transfected with TNFAIP2 or control siRNA, followed by treatment with EPI (0–800 nM) and BMN (0–30 μM) for 48 or 72 hr, respectively. Cell viability was measured by the SRB assay. Statistical analysis was performed using one-way analysis of variance (ANOVA), n = 3, *p < 0.05, **p < 0.01, ***p < 0.001. Protein expression levels were analyzed by western blotting (WB). (R–T) ITGB4 promotes TNBC drug resistance through IQGAP1. HCC1937 cells with stable ITGB4 overexpression were transfected with IQGAP1 or control siRNA, followed by treatment with EPI (0–800 nM) and BMN (0–40 μM) for 48 or 72 hr, respectively. Cell viability was measured by the SRB assay. Statistical analysis was performed using one-way ANOVA, n = 3, *p < 0.05, **p < 0.01, ***p < 0.001. Protein expression levels were analyzed by WB. (U–W) ITGB4 promotes TNBC drug resistance through RAC1. HCC1937 cells with stable ITGB4 overexpression were transfected with RAC1 or control siRNA, followed by treatment with EPI (0–800 nM) and BMN (0–30 μM) for 48 or 72 hr, respectively. Cell viability was measured by the SRB assay. Statistical analysis was performed using one-way ANOVA, n = 3, *p < 0.05, **p < 0.01, ***p < 0.001. Protein expression levels were analyzed by WB. (X) ITGB4 promotes DNA damage repair through TNFAIP2. HCC1937 cells with stable ITGB4 overexpression were transfected with TNFAIP2 or control siRNA, followed by treatment with EPI (800 nM) and BMN (10 μM) for 24 hr. Protein expression levels were analyzed by WB. (Y) ITGB4 promotes DNA damage repair through IQGAP1. HCC1937 cells with stable ITGB4 overexpression were transfected with IQGAP1 or control siRNA, followed by treatment with EPI (800 nM) and BMN (10 μM) for 24 hr. Protein expression levels were analyzed by WB. (Z) ITGB4 promotes DNA damage repair through RAC1. HCC1937 cells with stable ITGB4 overexpression were transfected with RAC1 or control siRNA, followed by treatment with EPI (800 nM) and BMN (10 μM) for 24 hr. Protein expression levels were analyzed by WB.
-
Figure 7—figure supplement 2—source data 1
Uncropped western blot images for Figure 7—figure supplement 2.
- https://cdn.elifesciences.org/articles/88483/elife-88483-fig7-figsupp2-data1-v1.pptx
Figure 8
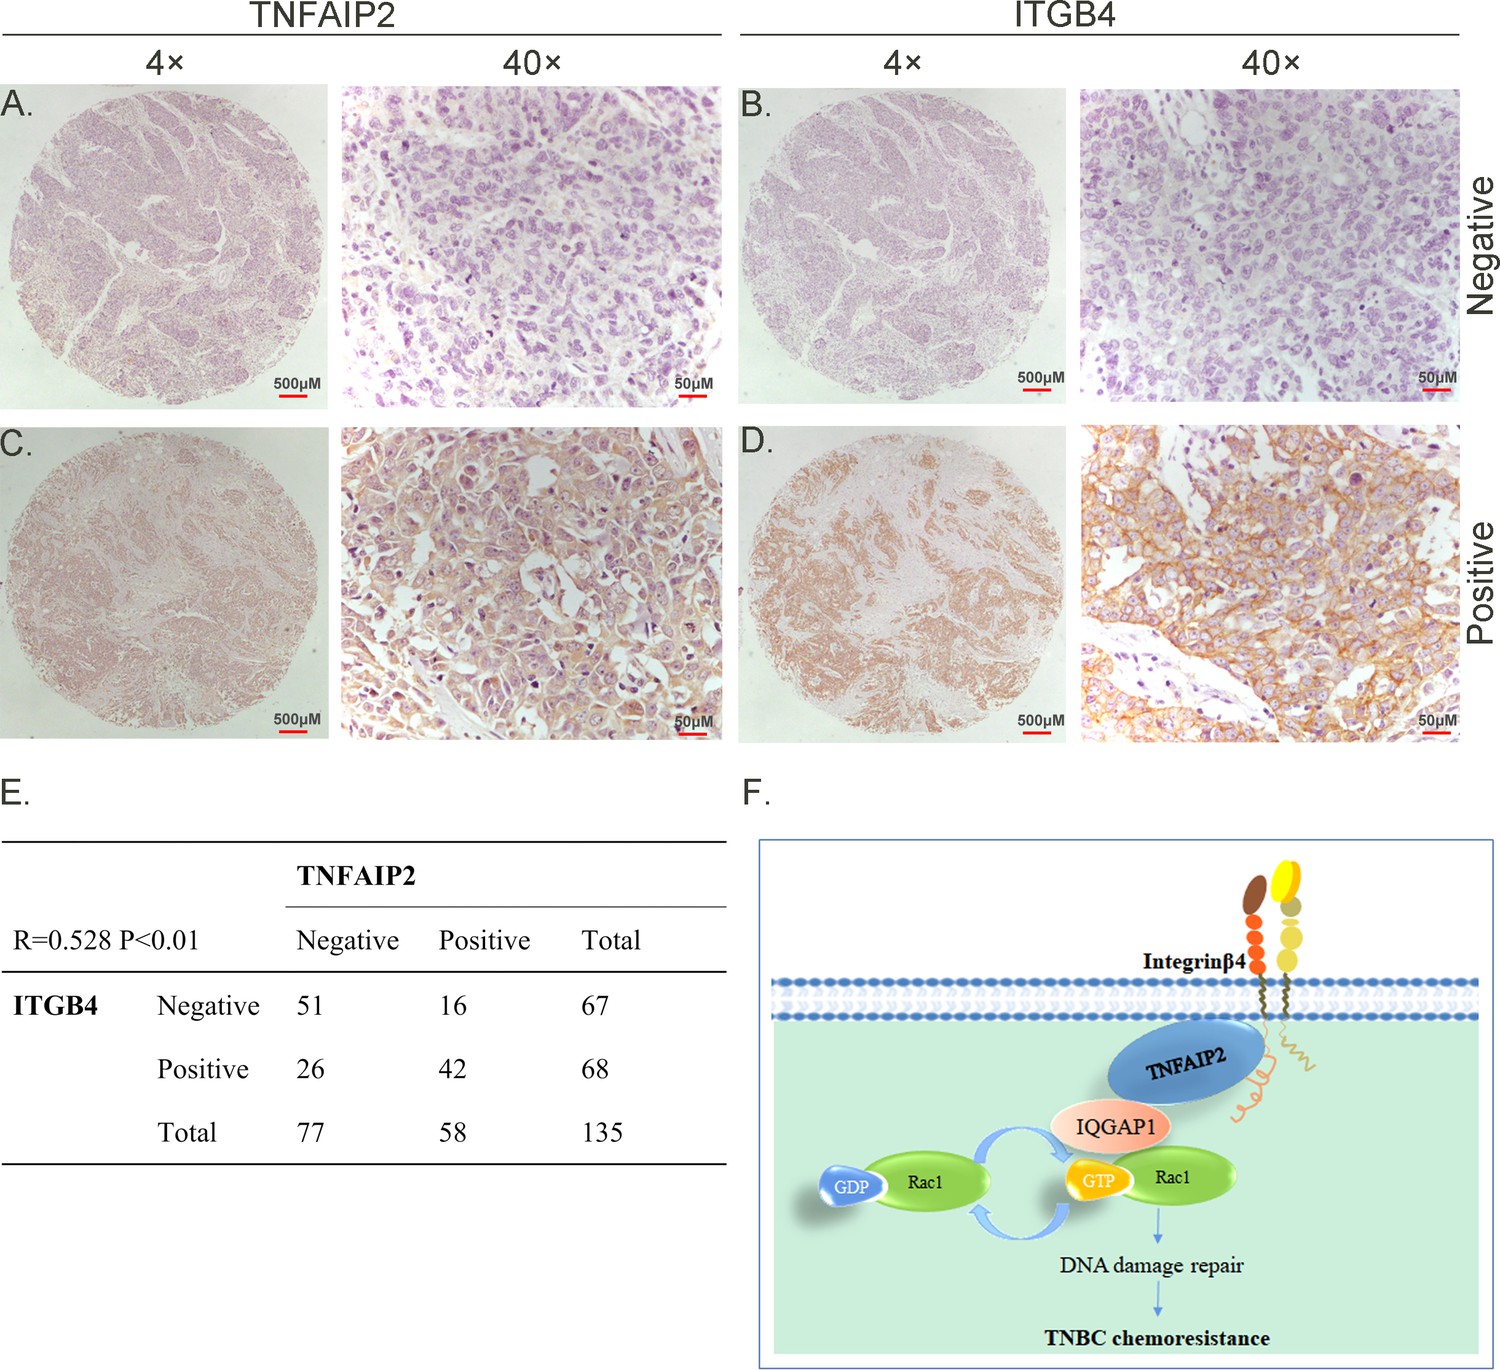
TNFAIP2 expression levels positively correlated with ITGB4 in triple-negative breast cancer (TNBC) tissues. Representative immunohistochemistry (IHC) images of TNFAIP2 and ITGB4 protein expression in breast cancer tissues are shown.
The final expression assessment was performed by combining the two scores (0–2 = low, 6–7 = high). A and B indicate low scores, C and D indicate high scores, and E indicates that the TNFAIP2 and ITGB4 protein expression levels are positively correlated in human TNBC specimens. Figure F is the work model of this study.
Author response image 1

Comparing fitting the experimental molecular displacements with a simple Brownian diffusion model (Figure 3—figure supplement 1C1) against fitting with the optimized HMM two-state diffusion model.
Best fit of the same experimental displacement distribution in condensed phase with a two-state HMM model. Red Curve is the HMM model fit obtained by non-linear least squares method using MATLAB. R2 = 0.98, RMSE = 184.9..
Additional files
Download links
A two-part list of links to download the article, or parts of the article, in various formats.
Downloads (link to download the article as PDF)
Open citations (links to open the citations from this article in various online reference manager services)
Cite this article (links to download the citations from this article in formats compatible with various reference manager tools)
Integrin β4 promotes DNA damage-related drug resistance in triple-negative breast cancer via TNFAIP2/IQGAP1/RAC1
eLife 12:RP88483.
https://doi.org/10.7554/eLife.88483.3


