Noradrenaline release from the locus coeruleus shapes stress-induced hippocampal gene expression
- Laboratory of Molecular and Behavioral Neuroscience, Institute for Neuroscience, Department of Health Sciences and Technology, ETH Zurich, Switzerland
- Neuroscience Center Zurich, ETH Zurich and University of Zurich, Switzerland, Switzerland
- Laboratory of Neurochemistry and Behavior, Experimental Neurobiology Unit, Department of Biomedical Sciences, University of Antwerp, Belgium
- Division of Human Nutrition and Health, Chair Group of Nutritional Biology, Wageningen University & Research (WUR), Netherlands
- Department of Neurology and Alzheimer Center, University of Groningen and University Medical Center Groningen (UMCG), Netherlands
- Department of Neurology, Memory Clinic of Hospital Network Antwerp (ZNA) Middelheim and Hoge Beuken, Belgium
- Computational Neurogenomics, Institute for Neuroscience, Department of Health Sciences and Technology, ETH Zürich, Switzerland
- Laboratory of Statistical Bioinformatics, University of Zürich, Switzerland
Figures
Figure 1 with 1 supplement
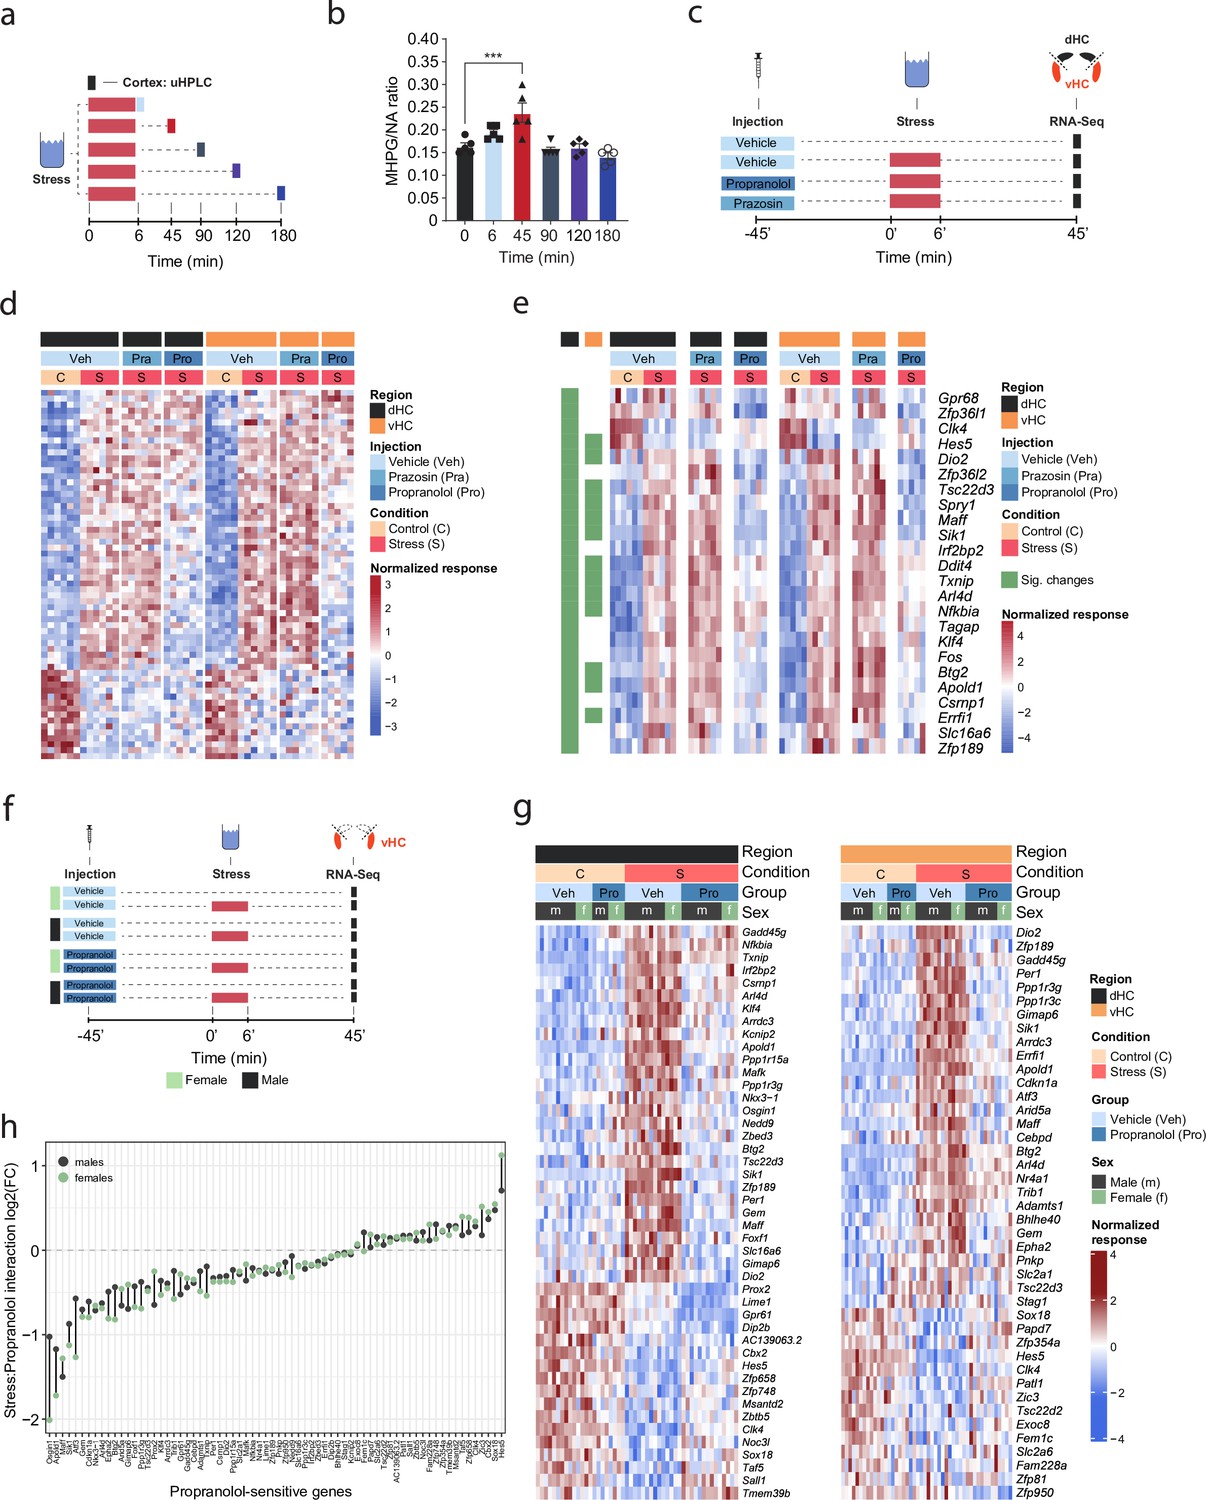
β-Adrenergic receptors mediate stress-induced transcriptomic changes in the hippocampus and are independent of subregion and sex.
(a) Experimental design for assessing stress-induced cortical noradrenaline (NA) turnover at various time points following stress exposure. (b) Stress-dependent changes in cortical NA turnover, as measured by the ratio of 3-methoxy-4-hydroxyphenylglycol (MHPG) and NA levels. NA turnover significantly increased within 45 min and returned to baseline within 90 min of stress onset (one-way ANOVA with Tukey’s post hoc tests; F(5, 24)=10.55, p<0.0001). n = 5 per group and individual data points are shown with bars representing mean ± s.e.m. (c) Experimental design for assessing the effect of prazosin (Pra, 1 mg/kg, i.p.) and propranolol (Pro, 10 mg/kg, i.p.) on stress-dependent transcriptomic changes in the dorsal (dHC) and ventral (vHC) hippocampus 45 min after stress exposure. (d) Heatmap showing all differentially expressed genes across dHC and vHC and pharmacological treatments 45 min after acute swim stress exposure. n = 6 per group. (e) Heatmap selectively showing those stress-responsive genes that are affected by the β-adrenergic receptor antagonist propranolol 45 min after acute swim stress exposure in the dHC and vHC (false discovery rate [FDR]-adjusted p<0.05). (f) Experimental design for assessing propranolol-dependent changes in the vHC of female and male mice. n = 5 per group. (g) Heatmap showing - across the two experiments - the expression of all stress-dependent genes that are affected by propranolol treatment in either region (dHC and vHC; FDR-adjusted p<0.05). (h) Comparison of the modulating effect of propranolol on the stress response (log2-fold-changes of the stress:propranolol interaction term) in males and females, across both experiments and regions.
Figure 1—figure supplement 1
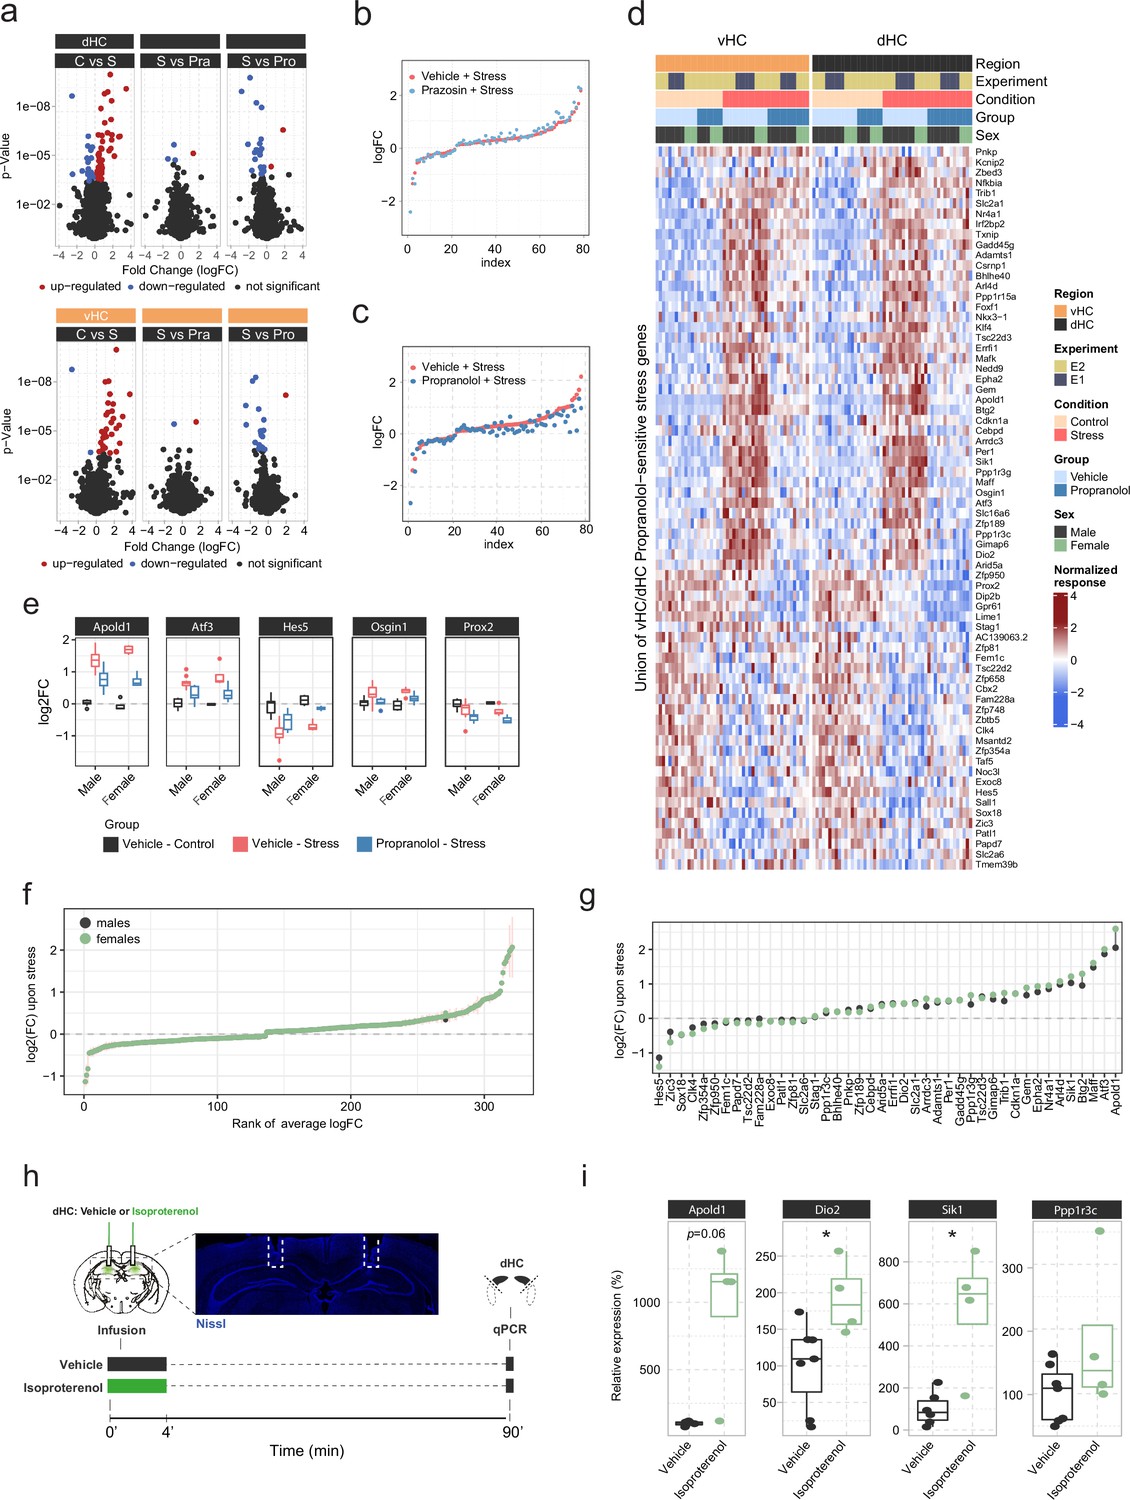
In-depth analysis of noradrenergic contribution to stress-induced transcriptomic changes in the hippocampus.
(a) Volcano plots showing differentially expressed RNA transcripts between vehicle (Veh, i.p.), prazosin (Pra, 1 mg/kg, i.p.), and propranolol (Pro, 10 mg/kg, i.p.) injected animals 45 min after onset of acute swim stress exposure. Red and blue values represent changes with false discovery rate (FDR)-adjusted p<0.05 (n = 6 per group). (b) Strength of the prazosin effect on the transcriptomic stress response. Data are sorted by interaction strength in the stress group (orange) and the corresponding interaction strength of the stress+prazosin group are shown in light blue for the same gene. (c) Strength of the propranolol effect on the transcriptomic stress response. Data are sorted by interaction strength in the stress group (orange) and the corresponding interaction strength of the stress+prazosin group are shown in dark blue for the same gene. (d) Heatmap showing expression, across both experiments and regions, of all stress genes with a significant stress:propranolol interaction. (e) Expression (in the ventral hippocampus [vHC]) of the genes from Figure 1h showing the largest differences (none statistically significant) in the stress:propranolol interaction term between males and females. (f) Comparison of the transcriptomic changes 45 min after stress between males and females, in a meta-analysis of 71 vHC samples. The fold-change estimates were obtained using DESeq2 with apeglm shrinkage (Zhu et al., 2019). Vertical bars show the standard error of the fold-change estimates. (g) (Unshrunk) fold-change estimates of propranolol-sensitive genes upon stress in males and females, based on the meta-analysis. (h) Experimental design for assessing the effect of intra-hippocampal infusion of isoproterenol (3 μg/hemisphere) on expression of selected genes in the dorsal hippocampus (dHC) 90 min after infusion in the absence of stress. Representative image shows the cannula placement (dashed line) in the dHC stained by Nissl (blue). (i) Boxplots showing the expression of selected stress- and propranolol-responsive genes (Apold1, Dio2, and Sik1) 90 min after infusion of isoproterenol (3 μg/hemisphere) into the dHC, as measured by quantitative real-time PCR. Isoproterenol increased the expression of Dio2 (unpaired t-test; t(9) = 2.637, p=0.02706) and Sik1 (Welch unpaired t-test; t(3.3)=3.176, p=0.04428). Vehicle, n=7; isoproterenol, n=4. *p < 0.05. For all boxplots, the bottom and top hinges represent the 1st and 3rd quartiles, while the whiskers extends from the box hinge to the farthest value no further than +/-1.5*IQR from the hinge.
Figure 2 with 3 supplements
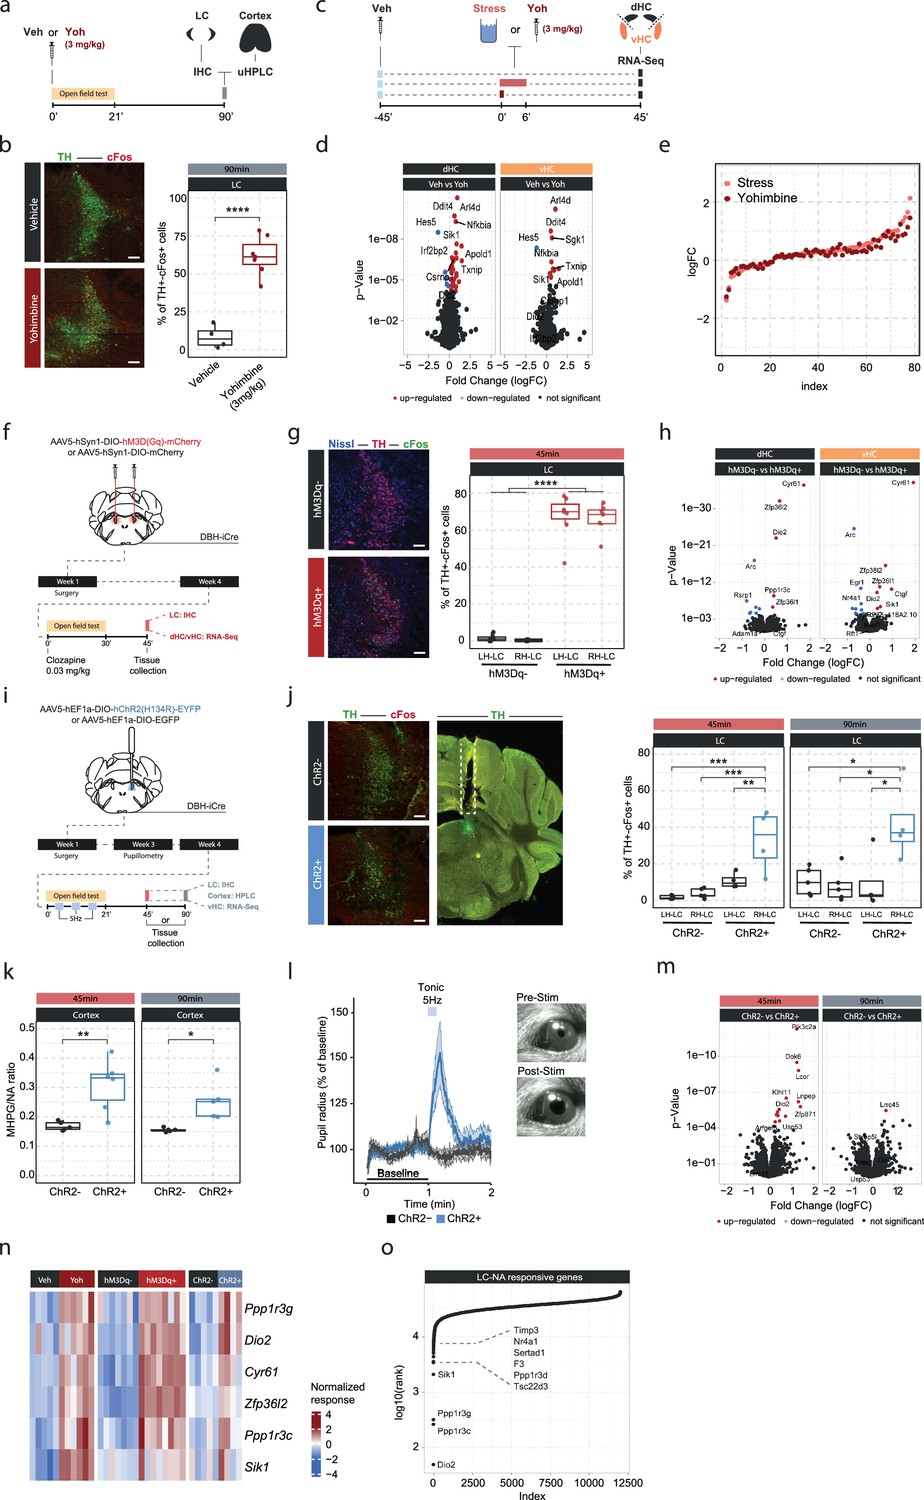
Locus coeruleus (LC)-mediated transcriptomic changes in the hippocampus.
(a) Experimental design for assessing LC activation and cortical noradrenaline (NA) release induced by injection of yohimbine (3 mg/kg, i.p.). (b) Representative images and quantification of LC activation in mice 90 min after injection of vehicle or yohimbine as measured by cFos (red) and tyrosine hydroxylase (TH, green) coexpression within LC neurons. Yohimbine injection increased cFos expression within LC neurons compared to vehicle-injected animals (unpaired t-test; t(8.9)=–8.814, p=1.083e-05). Vehicle, n=4; yohimbine n=7. Scale bar: 100 μm. (c) Experimental design for comparing molecular changes in the hippocampus after acute swim stress exposure or yohimbine administration. (d) Volcano plots showing differentially expressed RNA transcripts in the dorsal (dHC) and ventral (vHC) hippocampus between control (Veh) and yohimbine (Yoh) injected animals 45 min after injection. Red and blue values represent changes with false discovery rate [FDR]-adjusted p<0.05 (Veh n = 6, Yoh n = 6). (e) Strength of the yohimbine effect in comparison to the transcriptomic stress response. Data are sorted by interaction strength in the stress group (orange) and the corresponding interaction strength of the yohimbine group are shown in dark red for the same gene. (f) Experimental design for assessing LC activation and hippocampal transcriptomic changes induced by chemogenetic LC activation. (g) Representative images and quantification of LC activation in mice 45 min after injection of clozapine (0.03 mg/kg) in hM3Dq- and hM3Dq+ animals as measured by cFos (green) and TH (red) coexpression within LC neurons. Neurons are stained with Nissl (blue). Clozapine injection increased cFos expression within LC neurons in hM3Dq+ animals compared to hM3Dq- animals (one-way ANOVA; F(3, 23)=135.4, p=9.34e-15). hM3Dq- n = 6, hM3Dq+ n = 7. Scale bar: 100 μm. (h) Volcano plots showing differentially expressed RNA transcripts between hM3Dq- and hM3Dq+ animals 45 min after injection of clozapine (0.03 mg/kg) in the dHC and vHC. Red and blue values represent changes with FDR-adjusted p<0.05 (hM3Dq- n = 6, hM3Dq+ n = 7). (i) Experimental design for assessing LC activation, cortical NA release, pupillometry and hippocampal transcriptomic changes induced by optogenetic 5 Hz LC activation. (j) Representative images and quantification of LC activation in mice after 5 Hz optogenetic LC activation as measured by cFos (red) and TH (green) coexpression within LC neurons in stimulated and non-stimulated LC hemispheres of ChR2- and ChR2+ animals. 5 Hz stimulation increased cFos expression within LC neurons in stimulated LC hemispheres of ChR2+, but not in ChR2- animals 45 min (one-way ANOVA with Tukey’s post hoc tests; F(3, 14)=12.91, p=0.000256) and 90 min after stimulation onset (one-way ANOVA with Tukey’s post hoc tests; F(3, 14)=5.866, p=0.00824). ChR2- (45 min), n=5; ChR2- (90 min), n=5; ChR2+ (45 min), n=4; ChR2+ (90 min), n=4. Scale bar: 100 μm. (k) Quantification of cortical 3-methoxy-4-hydroxyphenylglycol (MHPG)/NA ratio, as measured by ultra-high performance liquid chromatography (uHPLC), after 5 Hz optogenetic LC activation in ChR2- and ChR2+ animals. 5 Hz stimulation increased cortical NA turnover in ChR2+ animals (unpaired t-test; 45 min: t(3.6)=8.444, p=0.001681; 90 min: t(4.0854)=3.4127, p=0.02608). ChR2- 45 min, n=5; ChR2- 90 min, n=5; ChR2+ 45 min, n=6; ChR2+ 90 min, n=5. (l) Average pupil size changes in response to 5 Hz optogenetic LC activation in ChR2- and ChR2+ animals. 5 Hz stimulation increased pupil size in ChR2+, but not ChR2- animals. (m) Volcano plots showing differentially expressed RNA transcripts between ChR2- and ChR2+ animals 45 and 90 min after 5 Hz optogenetic LC activation in the vHC. Red and blue values represent changes with FDR-adjusted p<0.05 (ChR2- n = 10, ChR2+ n = 11). (n) Heatmap showing genes that are commonly differentially expressed by yohimbine, chemogenetic, and optogenetic-induced LC activation. (o) Logarithmic cumulative rank of genes across all experiments from Figure 1 and Figure 2 in terms of their NA responsiveness. A lower cumulative rank indicates that a gene is among the more significant hits across all analyses (for full list of included analyses, see Methods). Labels indicate the 10 genes identified to be most responsive to LC-NA stimulation. *p < 0.05, **p < 0.01, ***p < 0.001, ****p<0.0001. For all boxplots in this manuscipt, the bottom and top hinges represent the 1st and 3rd quartiles, while the whiskers extends from the box hinge to the farthest value no further than +/-1.5*IQR from the hinge.
Figure 2—figure supplement 1
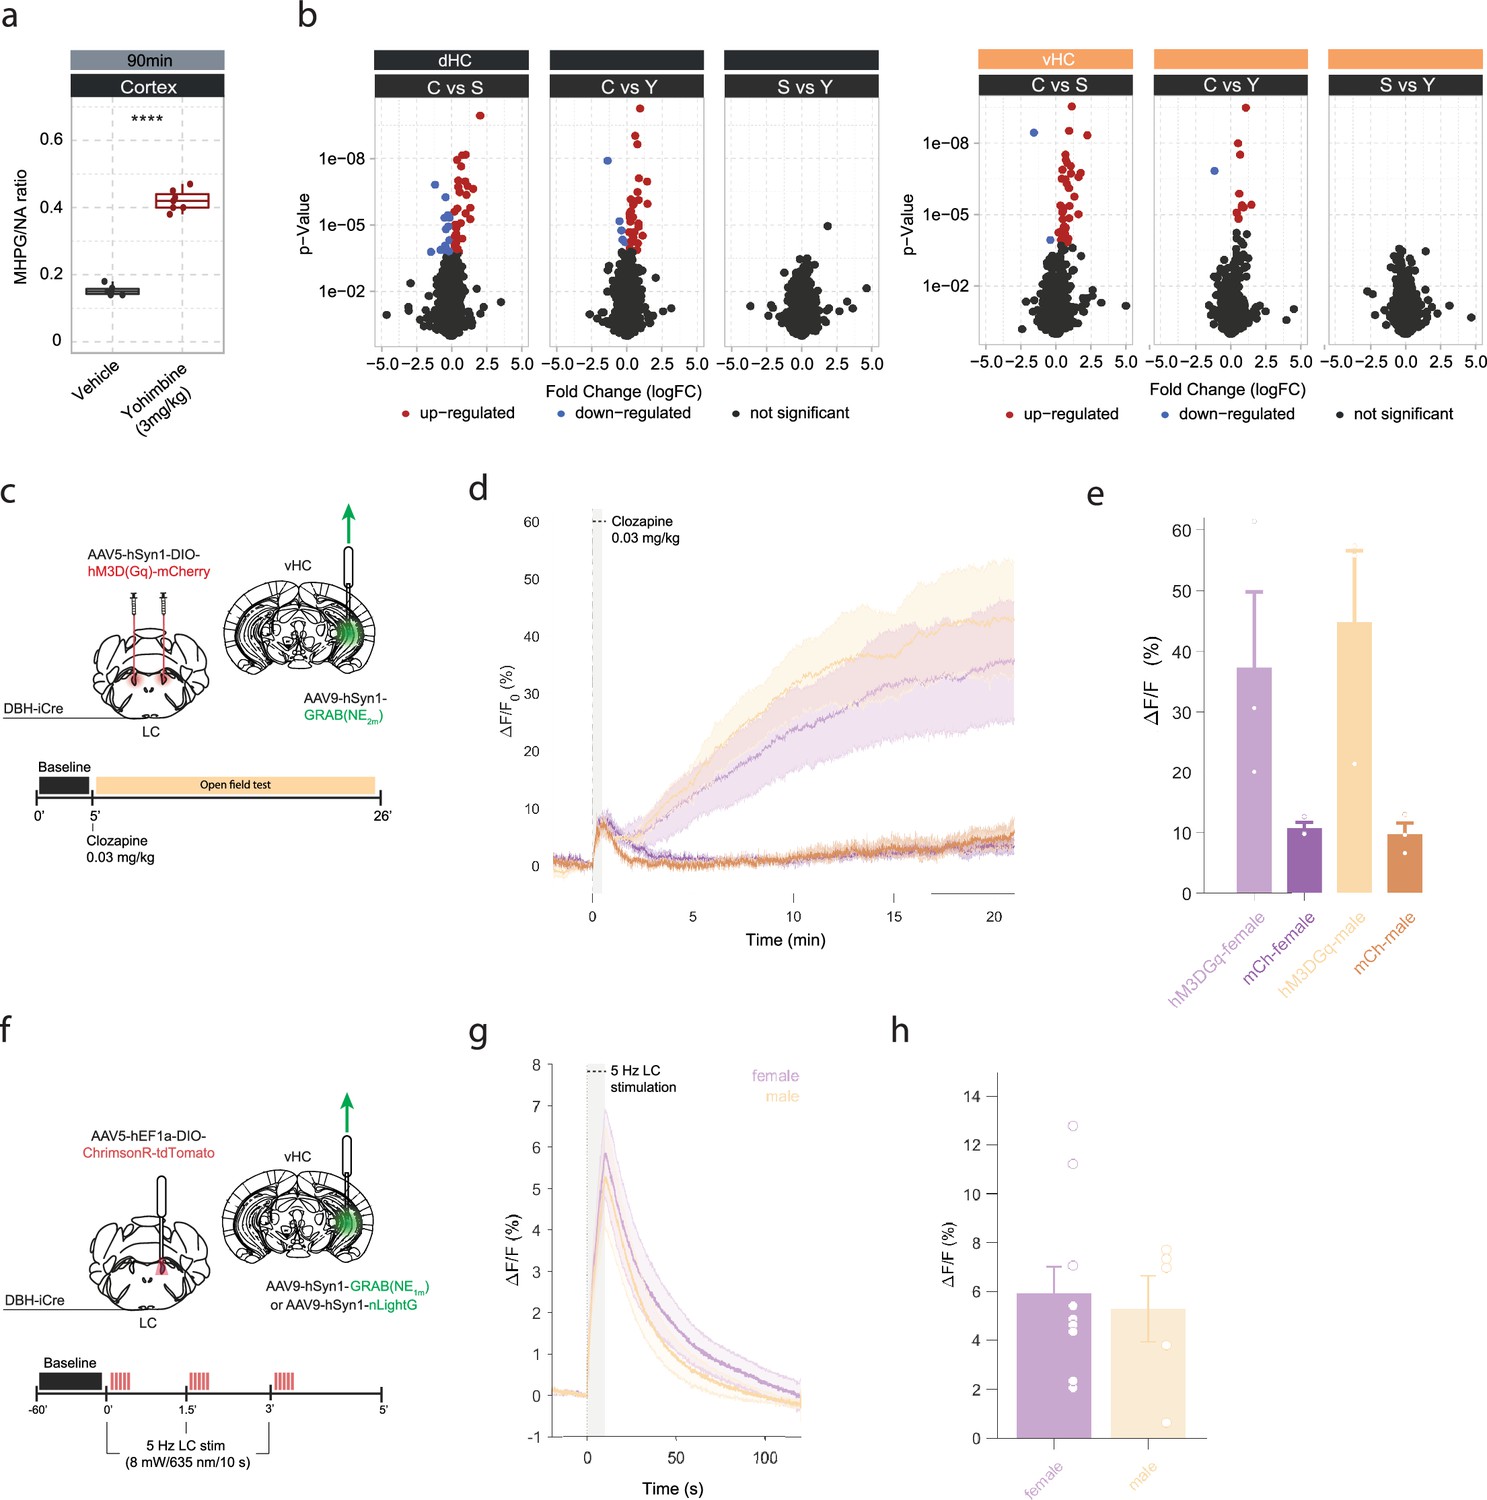
Yohimbine-induced changes in noradrenaline (NA) turnover and gene expression, and validation of opto- and chemogenetic NA release in the hippocampus.
(a) Quantification of cortical 3-methoxy-4-hydroxyphenylglycol (MHPG)/NA ratio, as measured by ultra-high performance liquid chromatography (uHPLC), 90 min after systemic injection of vehicle or yohimbine (3 mg/kg, i.p.). Yohimbine increases cortical NA turnover (unpaired t-test; t(8.9)=–20.099, p=1.015e-08). Vehicle, n=6; yohimbine, n=7. (b) Volcano plots showing differentially expressed RNA transcripts between control (C) and acute stress (S) or yohimbine (Yoh) injected animals 45 min after stress or yohimbine injection in the dorsal (dHC) and ventral (vHC) hippocampus, as well as a direct comparison between the two responses. Red and blue values represent changes with false discovery rate (FDR)-adjusted p<0.05 (Veh n = 5, Yoh n = 5). ****p<0.0001. (c) Schematic of fiber photometry recording of hippocampal NA during chemogenetic activation of the LC. After 5 min of baseline recording in the homecage animals were injected with clozapine (0.03 mg/kg, i.p.) and placed in the open field test (OFT) for 21 min. (d) Average ΔF/F traces of GRABNE2m photometry recordings in response to chemogenetic activation of the LC (mean ± SEM for hM3DGq+ and hM3DGq- split into females and males, n=3/group/sex). (e) Peak ΔF/F response of fiber photometry trace. (f) Schematic of fiber photometry recording of hippocampal NA during optogenetic activation of the LC. Animals were lightly anesthetized (1.5% isoflurane) and recorded in a stereotaxic frame. After 1 min baseline recording, animals were stimulated three times with 5 Hz for 10 s (10 ms pulse width, ~8 mW laser power) and recorded for 2 min post-stimulation. (g) Average ΔF/F traces of the NA sensors GRABNE1m and nLightG in response to optogenetic activation of the LC (mean ± SEM for females and males, n(females)=10, n(males)=5). (h) Peak ΔF/F response of fiber photometry traces.
Figure 2—figure supplement 2
Effects of acute stress and noradrenergic stimulation on anxiety-like behavior in the open field test.
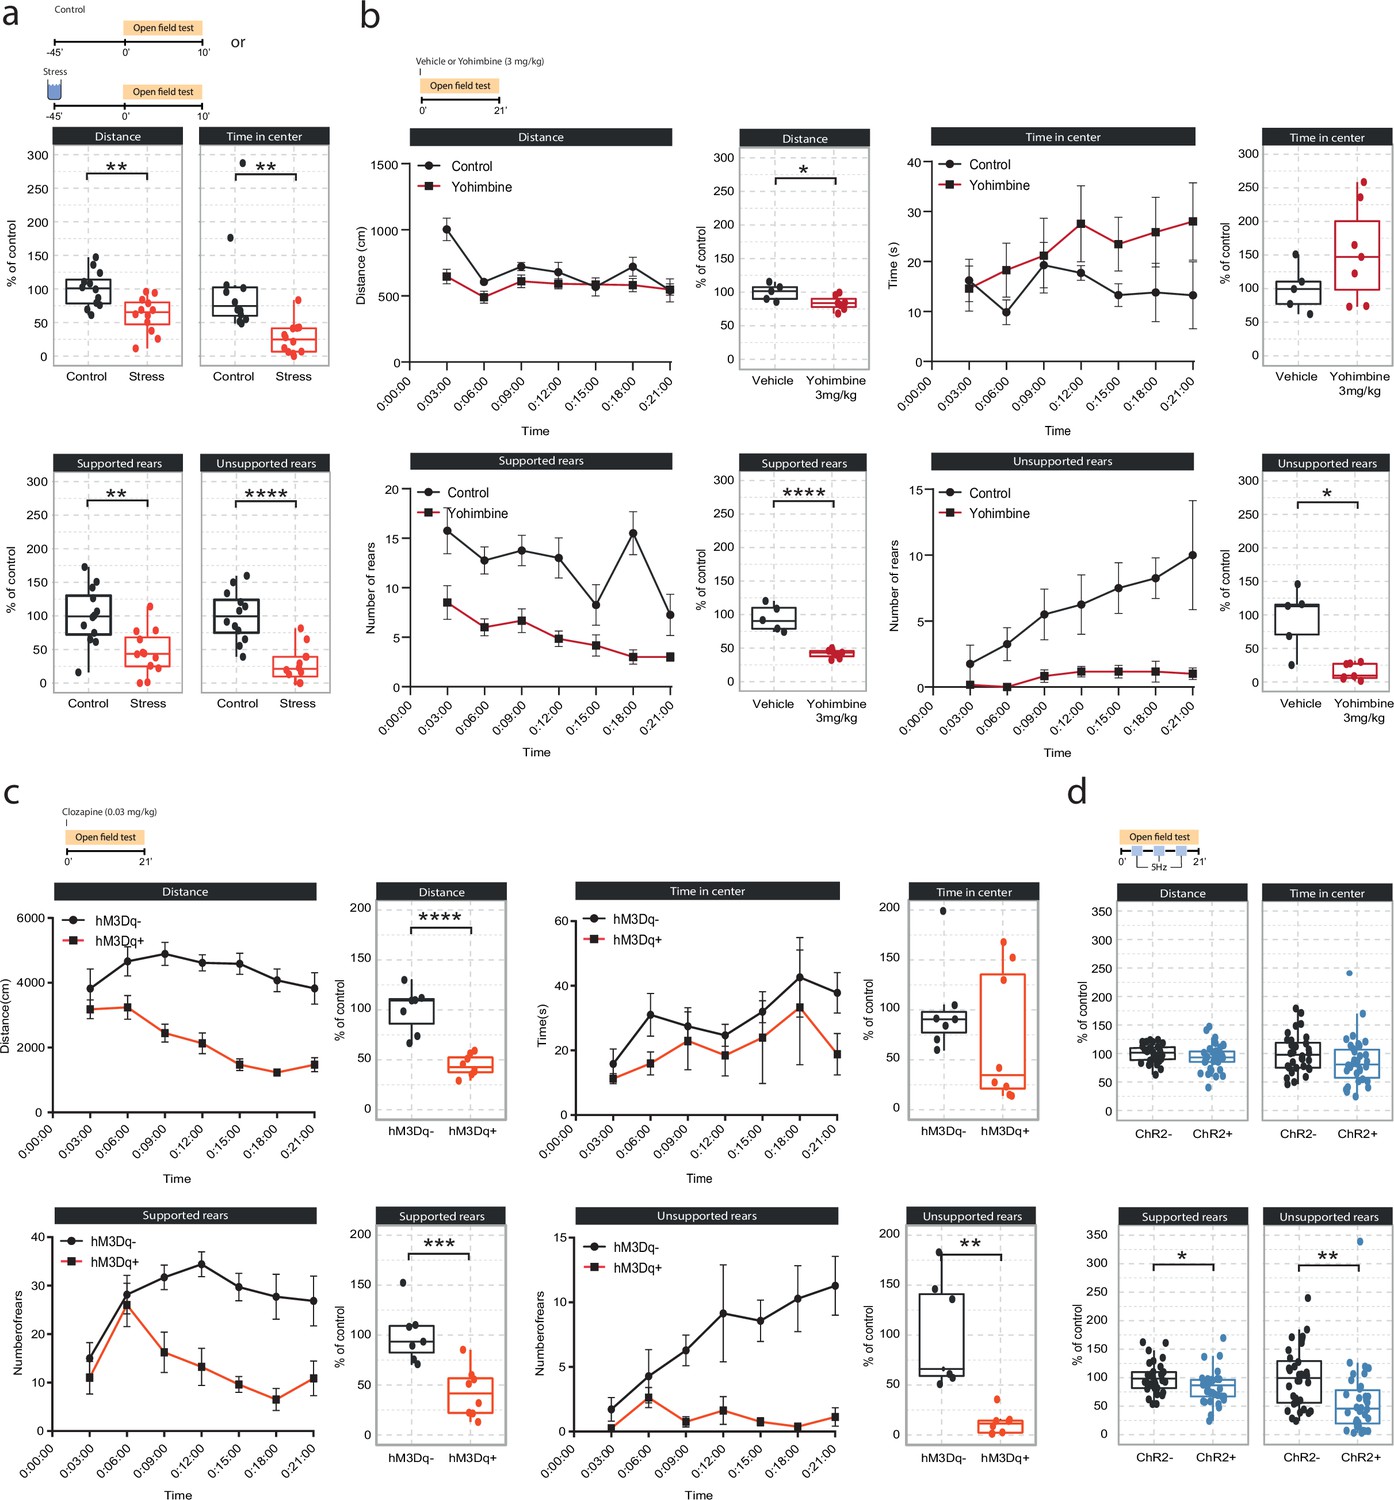
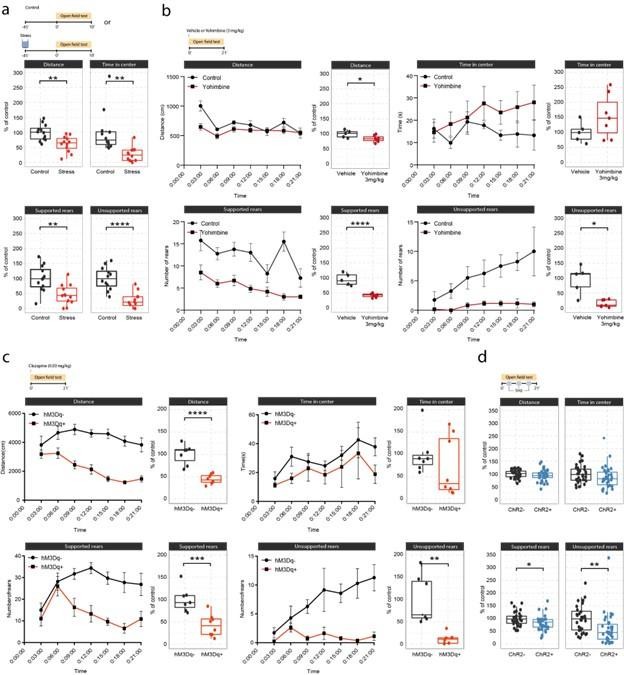
(a) Stress-induced changes in the open field test 45 min after stress onset. Stressed animals show overall reductions in distance traveled (unpaired t-test; t=3.55, df = 22, p=0.0018), time in center (Welch unpaired t-test; t=3.50, df = 13.61, p=0.0036), supported rears (unpaired t-test; t=3.39, df = 22, p=0.0026) and unsupported rears (unpaired t-test; t=5.53, df = 22, p=1.47e-05) compared to controls (control n=12; stress n=12). This data have been previously published (von Ziegler et al., 2022). (b) Yohimbine (3 mg/kg, i.p.) injected animals show reduced distance traveled (unpaired t-test; t=2.39, df = 10, p=0.03772), reduced supported rears (unpaired t-test; t=6.56, df = 10, p=0.00006) and reduced unsupported rears (Welch unpaired t-test; t=3.69, df = 4.4, p=0.01785) compared to vehicle-injected animals (vehicle n=6; yohimbine n=7). (c) Chemogenetic LC activation-induced changes in the open field test immediately after clozapine (0.03 mg/kg, i.p.) injection. hM3Dq+ animals show reduced distance traveled (unpaired t-test; t=6.28, df = 13, p=0.00003), reduced supported rears (unpaired t-test; t=4.28, df = 13, p=0.0009), as well as reduced unsupported rears (Welch unpaired t-test; t=4.28, df = 13, p=0.00437) compared to hM3D- animals (hM3Dq- n=7; hM3Dq+ n = 8). (d) Optogenetic 5 Hz LC activation-induced changes during the open field test. ChR2+ animals show reduced supported rears (unpaired t-test; t=2.42, df = 64, p=0.0185) and reduced unsupported rears (unpaired t-test; t=2.91, df = 64, p=0.00499) compared to ChR2- animals (ChR2- n=32; ChR2+ n = 36). Data expressed as mean ± SEM. *p<0.05, **p<0.01, ***p<0.001, ****p<0.0001.
Figure 2—figure supplement 3
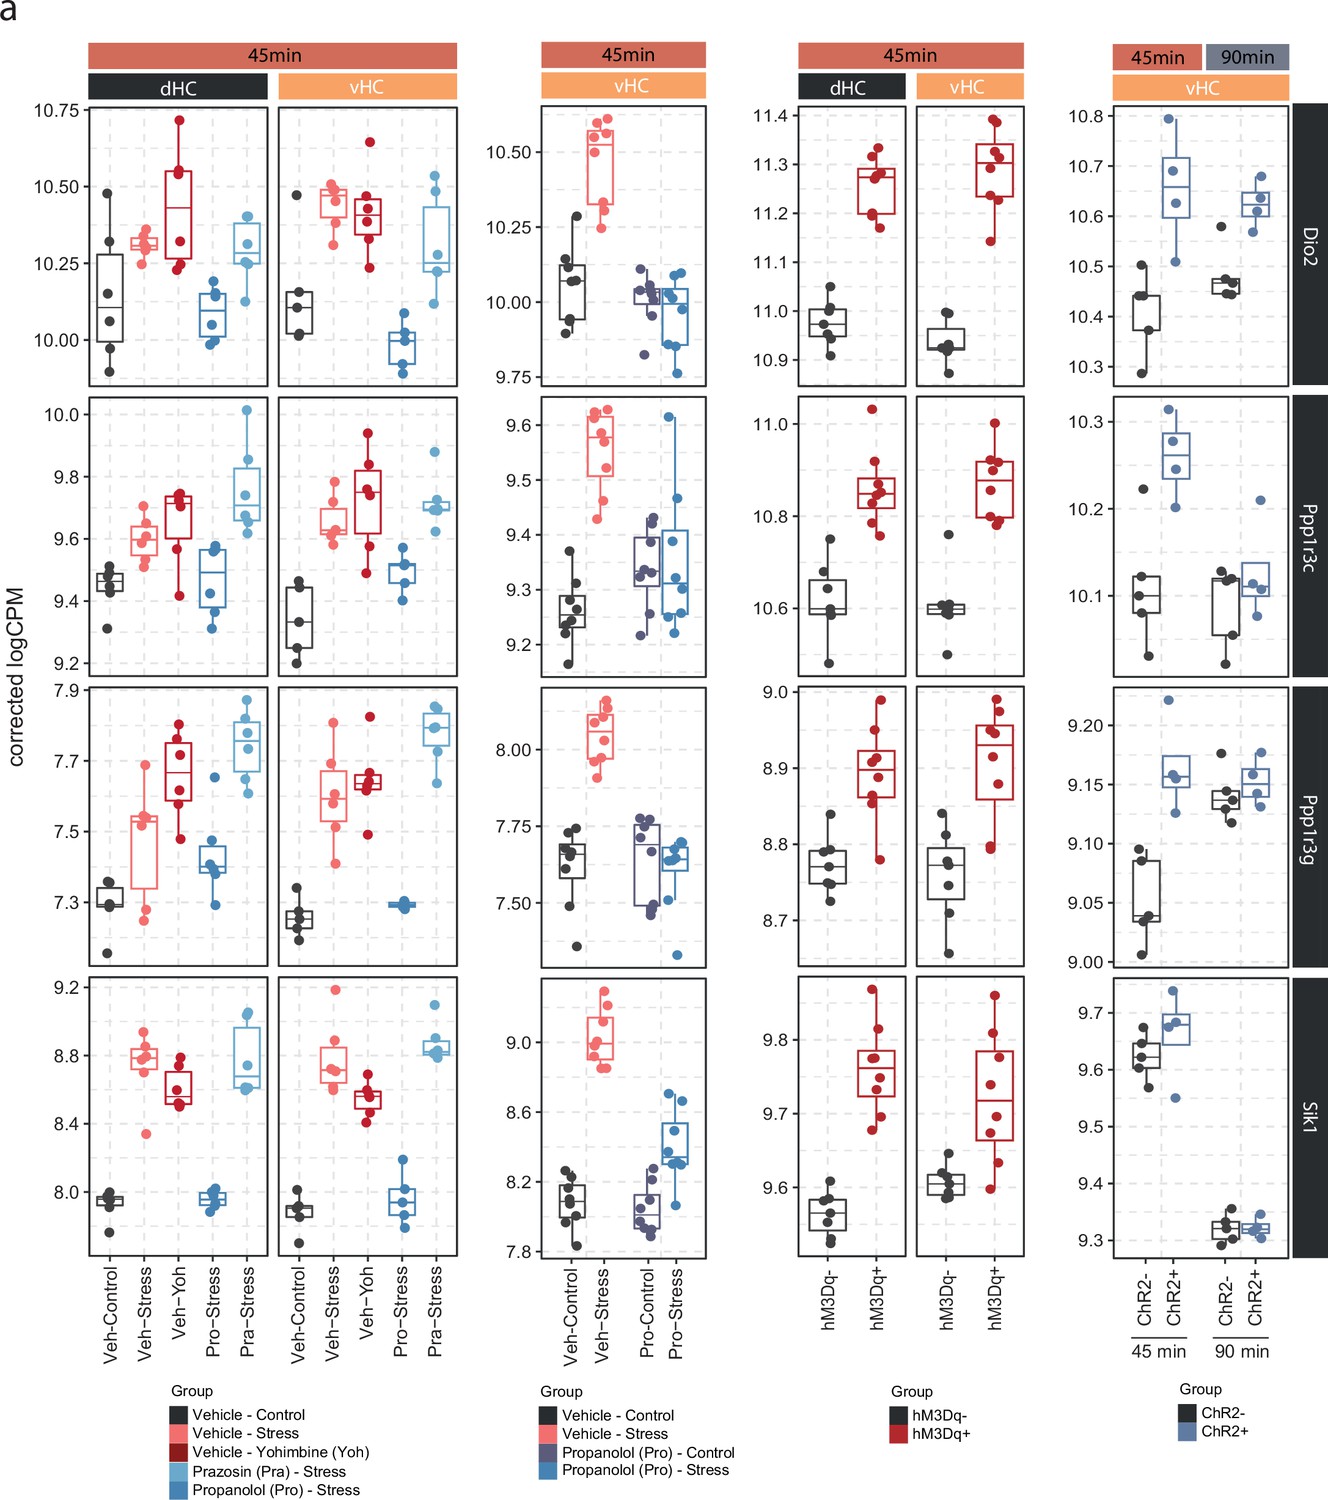
Expression of Dio2, Ppp1r3c, Ppp1r3g, and Sik1 is consistent across pharmacological, chemogenetic, and optogenetic manipulations of the noradrenergic system.
(a) Selective boxplots showing the expression changes of top 4 most responsive genes across all locus coeruleus-noradrenaline (LC-NA) manipulations. Dio2, Ppp1r3c, Ppp1r3g, and Sik1 are plotted across experiments in response to acute swim stress exposure, yohimbine (3 mg/kg, i.p.), swim stress and propranolol (10 mg/kg, i.p.), swim stress and prazosin (1 mg/kg, i.p.), as well as chemogenetic and optogenetic LC activation.
Figure 3
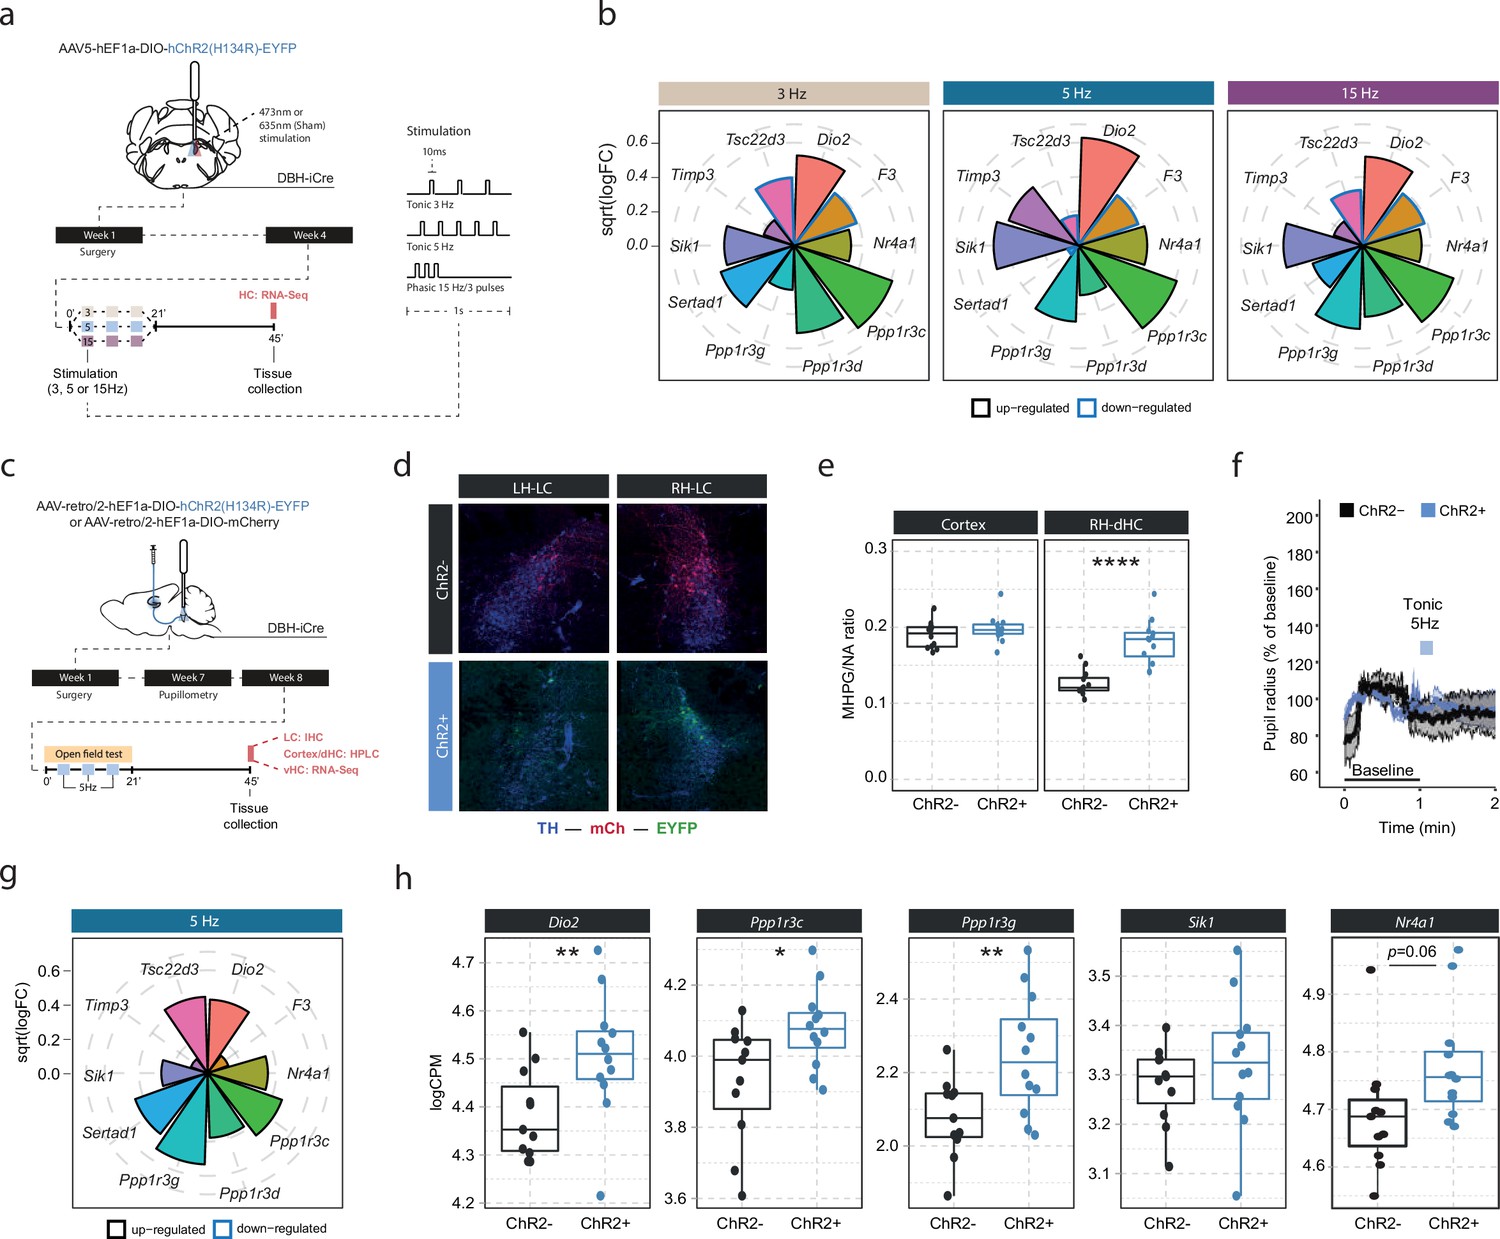
Locus coeruleus-noradrenaline (LC-NA)-mediated molecular responses in the hippocampus are independent of LC firing pattern and frequency and are directly stimulated via hippocampus-projecting LC neurons.
(a) Experimental design for assessing molecular changes in the hippocampus induced by optogenetic LC activation with tonic (3 and 5 Hz) and phasic (15 Hz) firing patterns. (b) Radial plots showing expression changes (based on the logFC) of the most LC-NA-responsive genes after optogenetic LC activation in ChR2+ animals compared to controls (sham n = 6, 3 Hz n = 6, 5 Hz n = 7, 15 Hz n = 6). Black borders indicate that the gene is upregulated, blue border downregulated. (c) Experimental design for assessing molecular changes in the hippocampus induced by retrograde optogenetic 5 Hz activation of hippocampus-projecting LC neurons (LCHC). (d) Representative images of retrograde mCherry (mCh, red) and ChR2-EYFP (EYFP, green) expression in tyrosine hydroxylase (TH, blue) positive LC neurons across hemispheres. (e) Cortical and right dorsal hippocampal (RH-dHC) NA turnover as measured by ultra-high performance liquid chromatography 45 min after 5 Hz optogenetic activation of LCHC neurons in ChR2- and ChR2+ animals. 5 Hz stimulation of LCHC neurons increased dHC but not cortical NA turnover in ChR2+ animals (unpaired t-test; t(17.43)=–5.5997, p=2.911e-05). ChR2-, n=12; ChR2+, n=12. ****p<0.0001. (f) Average pupil size changes in response to 5 Hz optogenetic activation of LCHC-projecting neurons in ChR2- and ChR2+ animals. (g) Radial plots showing expression changes (based on the logFC) of the top 10 LC-NA-responsive genes in response to optogenetic LCHC activation with tonic 5 Hz stimulation in ChR2+ animals compared to ChR2- 45 min after stimulation onset (ChR2- n = 12, ChR2+ n = 12). (h) Selective boxplots of NA-responsive genes Dio2, Ppp1r3c, Ppp1r3g, Sik1, and Nr4a1 in response to 5 Hz optogenetic activation of LCHC-projecting neurons in ChR2- and ChR2+ animals 45 min after stimulation onset (ChR2- n = 12, ChR2+ n = 12). 5 Hz optogenetic activation of LCHC-projecting neurons increased hippocampal expression of Dio2, Ppp1r3c, Ppp1r3g, and Nr4a1. *p<0.05, **p<0.01, ***p<0.001, ****p<0.0001.
Figure 4 with 2 supplements
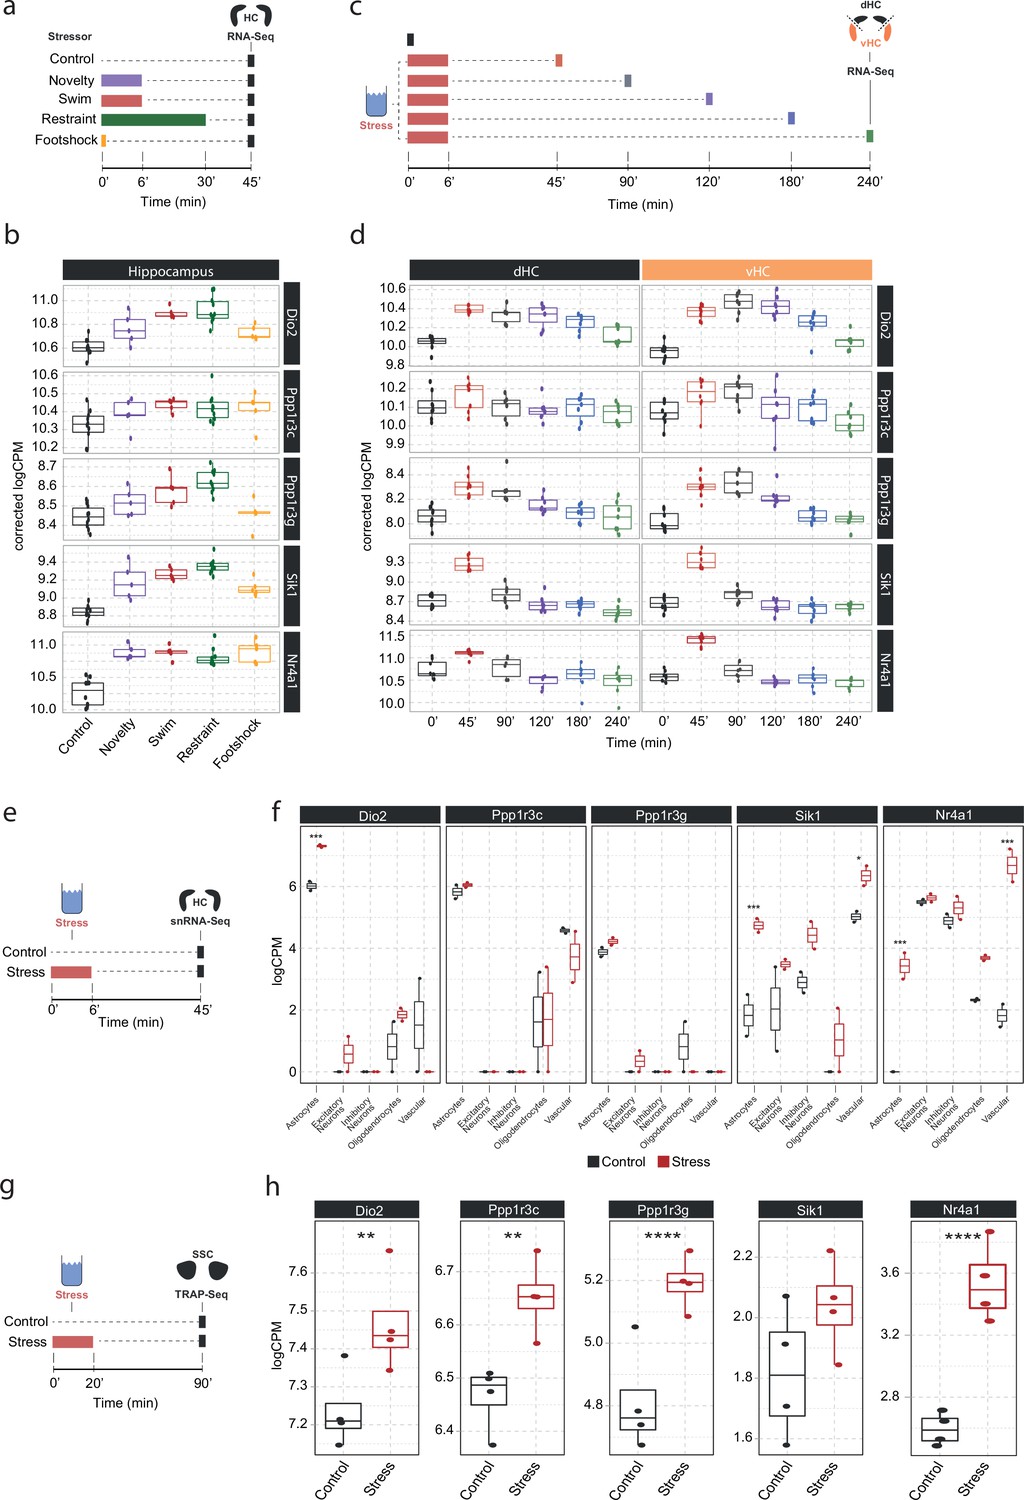
Screening of publicly available datasets shows that the noradrenaline-regulated genes Dio2, Ppp1r3c, Ppp1r3g, Sik1, and Nr4a1 are induced by various stressors predominantly in astrocytes.
(a) Experimental design for assessing transcriptomic changes in the hippocampus induced by different stressors as performed by Floriou-Servou et al., 2018. These stressors included a 10 min exposure to the open field test (novelty), a 6 min cold swim stress (swim), a 30 min immobilization stress (restraint), and exposure to a 1 mA footshock (footshock). (b) Selective boxplots of top NA-responsive genes Dio2, Ppp1r3c, Ppp1r3g, Sik1, and Nr4a1 in response to different stressors. Control n = 10, novelty n = 5, swim n = 5, restraint n = 10, footshock n = 5. (c) Experimental design for assessing transcriptomic changes in the dorsal and ventral hippocampus across 4 hr following acute swim stress exposure as performed by von Ziegler et al. (d) Selective boxplots showing expression changes of top NA-responsive genes Dio2, Ppp1r3c, Ppp1r3g, Sik1, and Nr4a1 across 4 hr following acute swim stress exposure. Control n = 8, 45 min n = 8, 90 min n = 7, 120 min n = 7, 180 min n = 7, 240 min n = 7. (e) Experimental design for assessing single-cell transcriptomic changes in the hippocampus 45 min following acute swim stress exposure by single-nucleus RNA sequencing as performed by von Ziegler et al., 2022. (f) Selective boxplots showing expression changes of top NA-responsive genes Dio2, Ppp1r3c, Ppp1r3g, Sik1, and Nr4a1 across cell types of the hippocampus 45 min following acute swim stress exposure. Control n = 2, stress n = 2. (g) Experimental design for assessing actively translated RNA in the somatosensory cortex 90 min following a 20 min acute swim stress exposure by TRAP sequencing as performed by Murphy-Royal et al., 2020. (h) Selective boxplots of top NA-responsive genes Dio2, Ppp1r3c, Ppp1r3g, Sik1, and Nr4a1 in the somatosensory cortex 90 min following a 20 min acute swim stress exposure. Acute stress increases the binding of Dio2, Ppp1r3c, Ppp1r3g, and Nr4a1 mRNA to the ribosome. Control n = 4, stress n = 4. *p<0.05, **p<0.01, ***p<0.001, ****p<0.0001.
Figure 4—figure supplement 1
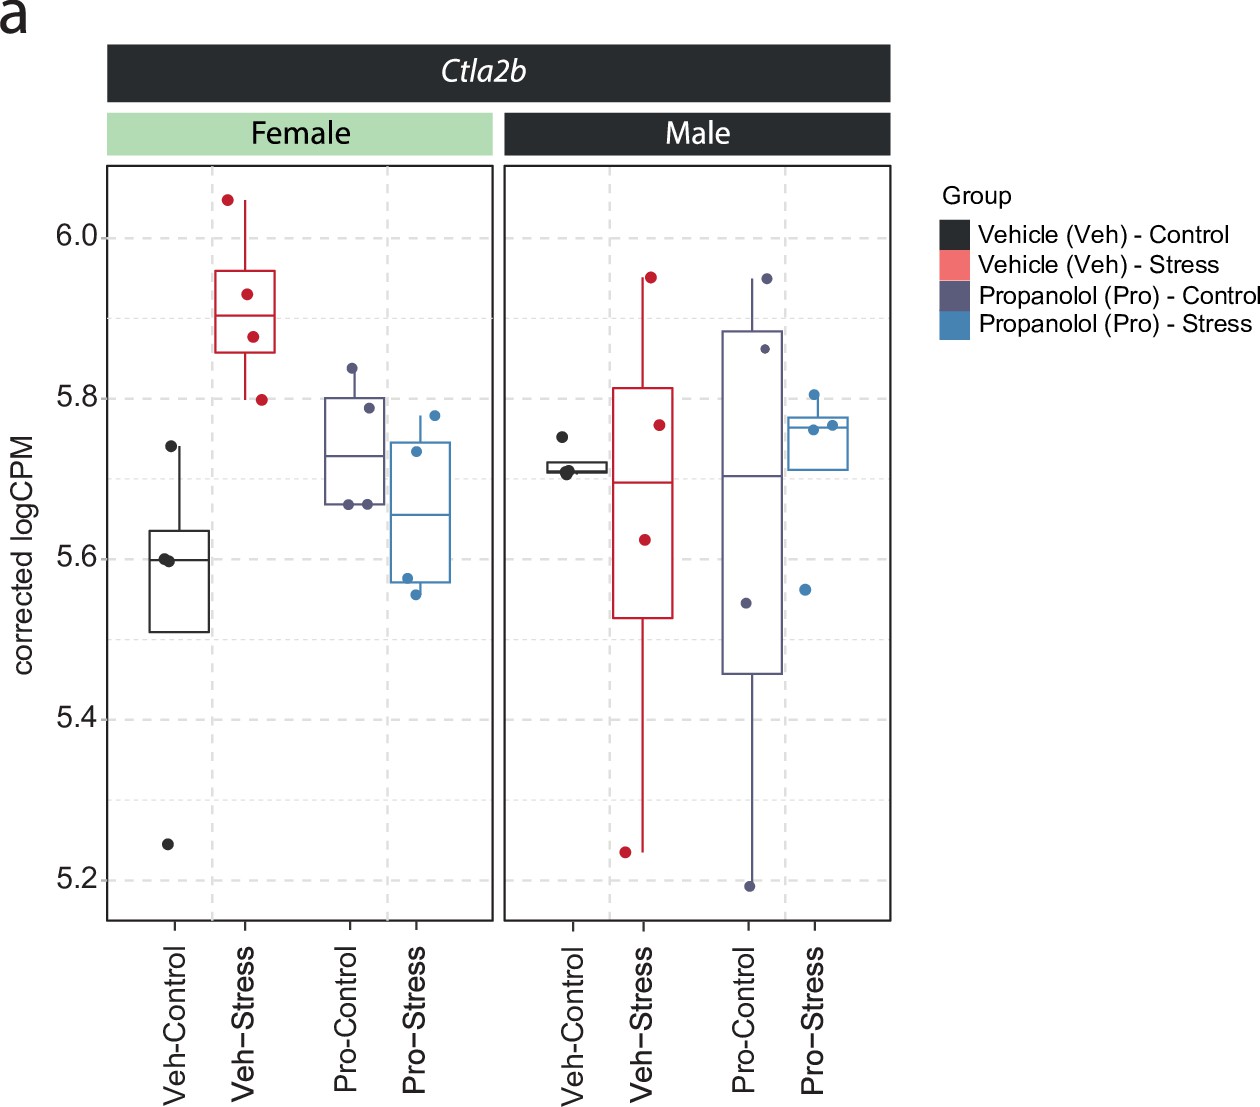
Sex-dependent expression of Ctla2b in the ventral hippocampus of female and male mice.
(a) Selective boxplot of Ctla2b expression - from data shown in Figure 1g–h - in response to acute swim stress and propranolol 45 min after stress onset in female and male mice. n = 4 per group.
Figure 4—figure supplement 2
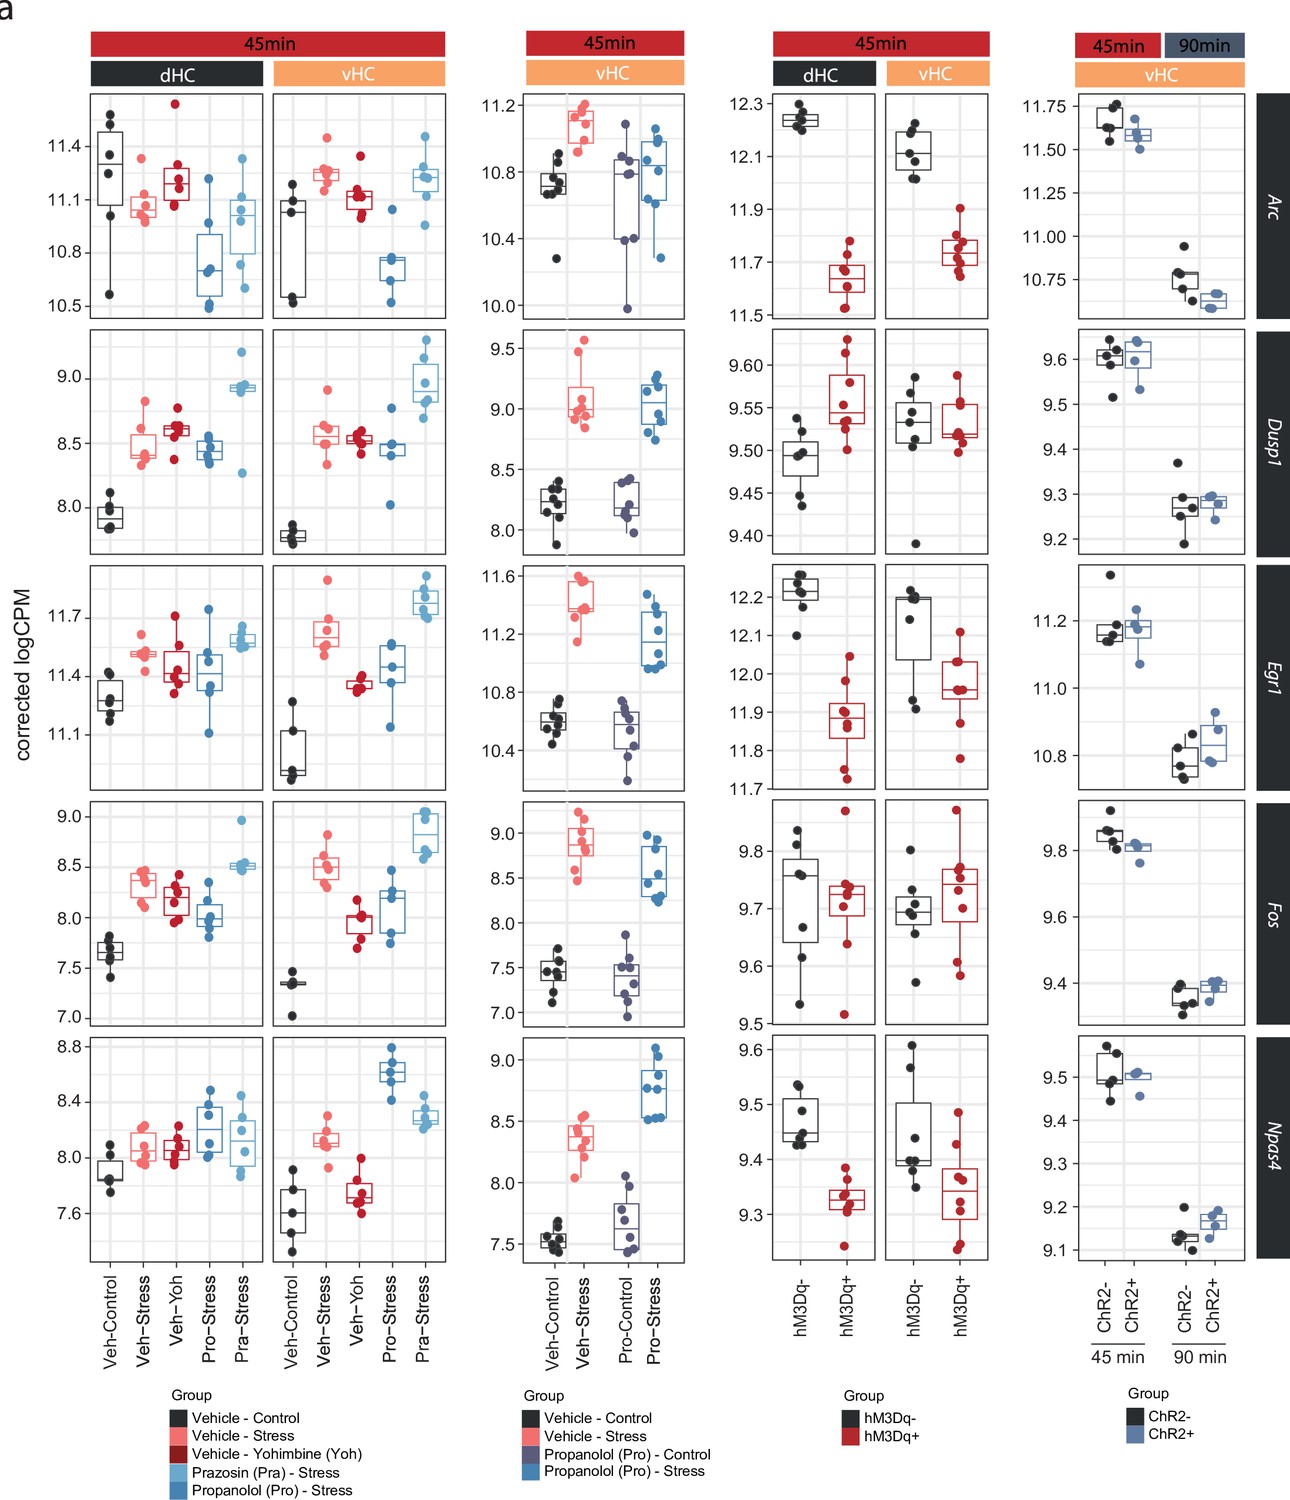
Neuronal immediate early genes in the hippocampus are not regulated by noradrenaline signaling.
(a) Selective boxplots showing the expression changes of genes associated with neuronal activation (Arc, Dusp1, Egr1, Fos, and Npas4) across experiments in response to acute stress and noradrenergic manipulation. Propranolol was not able to block the stress-induced expression of these genes, and locus coeruleus stimulation was not able to mimic their stress-induced upregulation.
Author response image 1
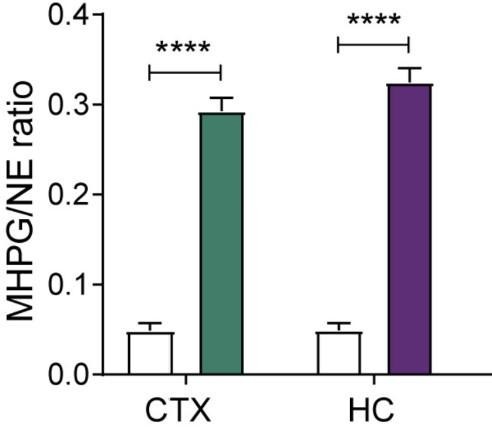
Levels of noradrenaline (NE) turnover (MHPG/NE ratio) in the cortex (CTX) and hippocampus (HC), measured in whole tissue with uHPLC 90min after hM3Dq-DREADD activation of the LC (copied and cropped from Zerbi et al, 2019, Neuron).
Author response image 2
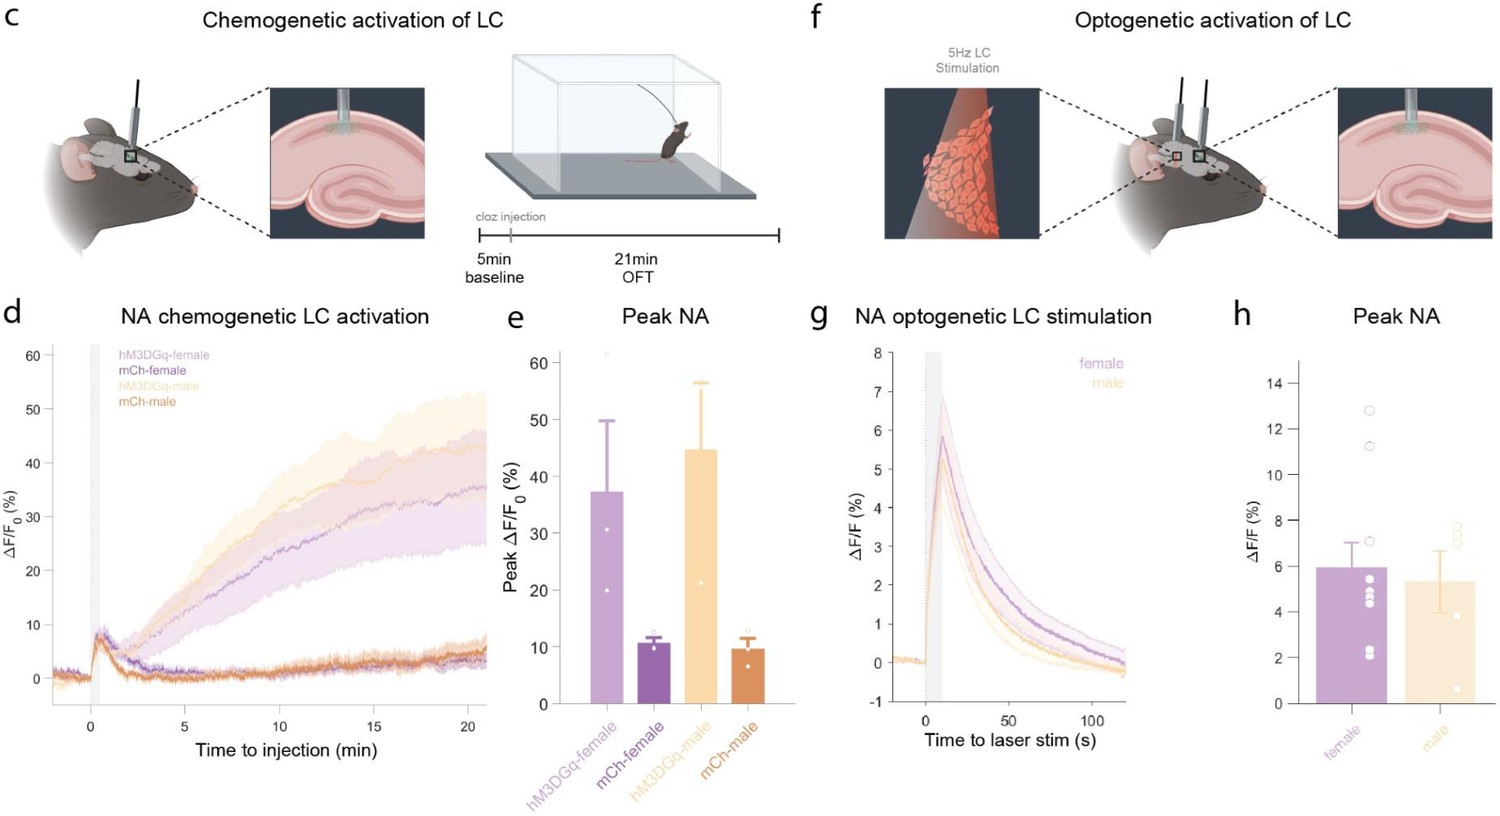
c, Schematic of fiber photometry recording of hippocampal NA during chemogenetic activation of the LC.
After 5 min baseline recording in the homecage animals were injected with clozapine (0.03mg/kg, i.p.) and placed in the OFT for 21min. d, Average ΔF/F traces of GRABNE2m photometry recordings in response to chemogenetic activation of the LC (mean ± SEM for hM3DGq+ and hM3DGq- split into females and males, n=3/group/sex). e, Peak ΔF/F response of fiber photometry trace. f, Schematic of fiber photometry recording of hippocampal NA during optogenetic activation of the LC. Animals were lightly anesthetized (1.5% isoflurane) and recorded in a stereotaxic frame. After 1 min baseline recording, animals were stimulated three times with 5Hz for 10s (10ms pulse width, ~8mW laser power) and recorded for 2 min post-stimulation. g, Average ΔF/F traces of the NA sensors GRABNE1m and nLightG in response to optogenetic activation of the LC mean ± SEM for females and males, n(females) = 10, n(males)=5. h, Peak ΔF/F response of fiber photometry trace.
Author response image 3
Effects of acute stress and noradrenergic stimulation on anxiety-like behaviour in the open field test.
a, Stress-induced changes in the open field test 45 min after stress onset. Stressed animals show overall reductions in distance traveled (unpaired t-test; t=3.55, df=22, p=0.0018), time in center (welch unpaired t-test; t=3.50, df=13.61, p=0.0036), supported rears (unpaired t-test; t=3.39, df=22, p=0.0026) and unsupported rears (unpaired t-test; t=5.53, df=22, p = 1.47e-05) compared to controls (Control n = 12; Stress n = 12). This data have been previously published (von Ziegler et al., 2022). b, Yohimbine (3 mg/kg, i.p.) injected animals show reduced distance traveled (unpaired t-test; t=2.39, df=10, p=0.03772), reduced supported rears (unpaired t-test; t=6.56, df=10, p=0.00006) and reduced unsupported rears (welch unpaired t-test; t=3.69, df=4.4, p = 0.01785) compared to vehicle injected animals (Vehicle n = 6; Yohimbine n = 7). c, Chemogenetic LC activation induced changes in the open field test immediately after clozapine (0.03 mg/kg, i.p.) injection. hM3Dq+ animals show reduced distance traveled (unpaired t-test; t=6.28, df=13, p=0.00003), reduced supported rears (unpaired t-test; t=4.28, df=13, p=0.0009), as well as reduced unsupported rears (welch unpaired t-test; t=4.28, df=13, p = 0.00437) compared to hM3D- animals (hM3Dq- n = 7; hM3Dq+ n = 8). d, Optogenetic 5 Hz LC activation induced changes during the open field test. ChR2+ animals show reduced supported rears (unpaired t-test; t=2.42, df=64, p=0.0185) and reduced unsupported rears (unpaired ttest; t=2.91, df=64, p = 0.00499) compared to ChR2- animals (ChR2- n = 32; ChR2+ n = 36). Data expressed as mean ± SEM. *p < 0.05, **p < 0.01, ***p < 0.001, ****p < 0.0001.
Additional files
-
Supplementary file 1
List of reproducible gene expression changes across various manipulations of the locus coeruleus-noradrenaline (LC-NA) system.
This table displays the logarithmic cumulative rank of genes across all experiments from Figure 1 and Figure 2 in terms of their responsiveness to manipulations of the LC-NA system. A lower cumulative rank indicates that a gene is among the more significant hits across all analyses (for full list of included analyses, see Methods). The top 10 genes from this list are shown in Figure 2o.
- https://cdn.elifesciences.org/articles/88559/elife-88559-supp1-v1.xlsx
-
Supplementary file 2
Sex-specific regulation of transcription in the ventral hippocampus after swim stress exposure.
Differential expression analysis results for a sex:stress interaction performed across the meta-analysis of vHC datasets 45 min after stress initiation (total of 50 males and 20 females). The table merges the results of both the edgeR and the DESeq2 analyses. Detailed information is provided in the sheet ‘ColumnDefinitions’.
- https://cdn.elifesciences.org/articles/88559/elife-88559-supp2-v1.xlsx
-
MDAR checklist
- https://cdn.elifesciences.org/articles/88559/elife-88559-mdarchecklist1-v1.pdf
Download links
A two-part list of links to download the article, or parts of the article, in various formats.
Downloads (link to download the article as PDF)
Open citations (links to open the citations from this article in various online reference manager services)
Cite this article (links to download the citations from this article in formats compatible with various reference manager tools)
Noradrenaline release from the locus coeruleus shapes stress-induced hippocampal gene expression
eLife 12:RP88559.
https://doi.org/10.7554/eLife.88559.3


