Orai-mediated calcium entry determines activity of central dopaminergic neurons by regulation of gene expression
- National Centre for Biological Sciences, Tata Institute of Fundamental Research, India
- Department of Biology, Brandeis University, United States
Figures
Figure 1 with 9 supplements
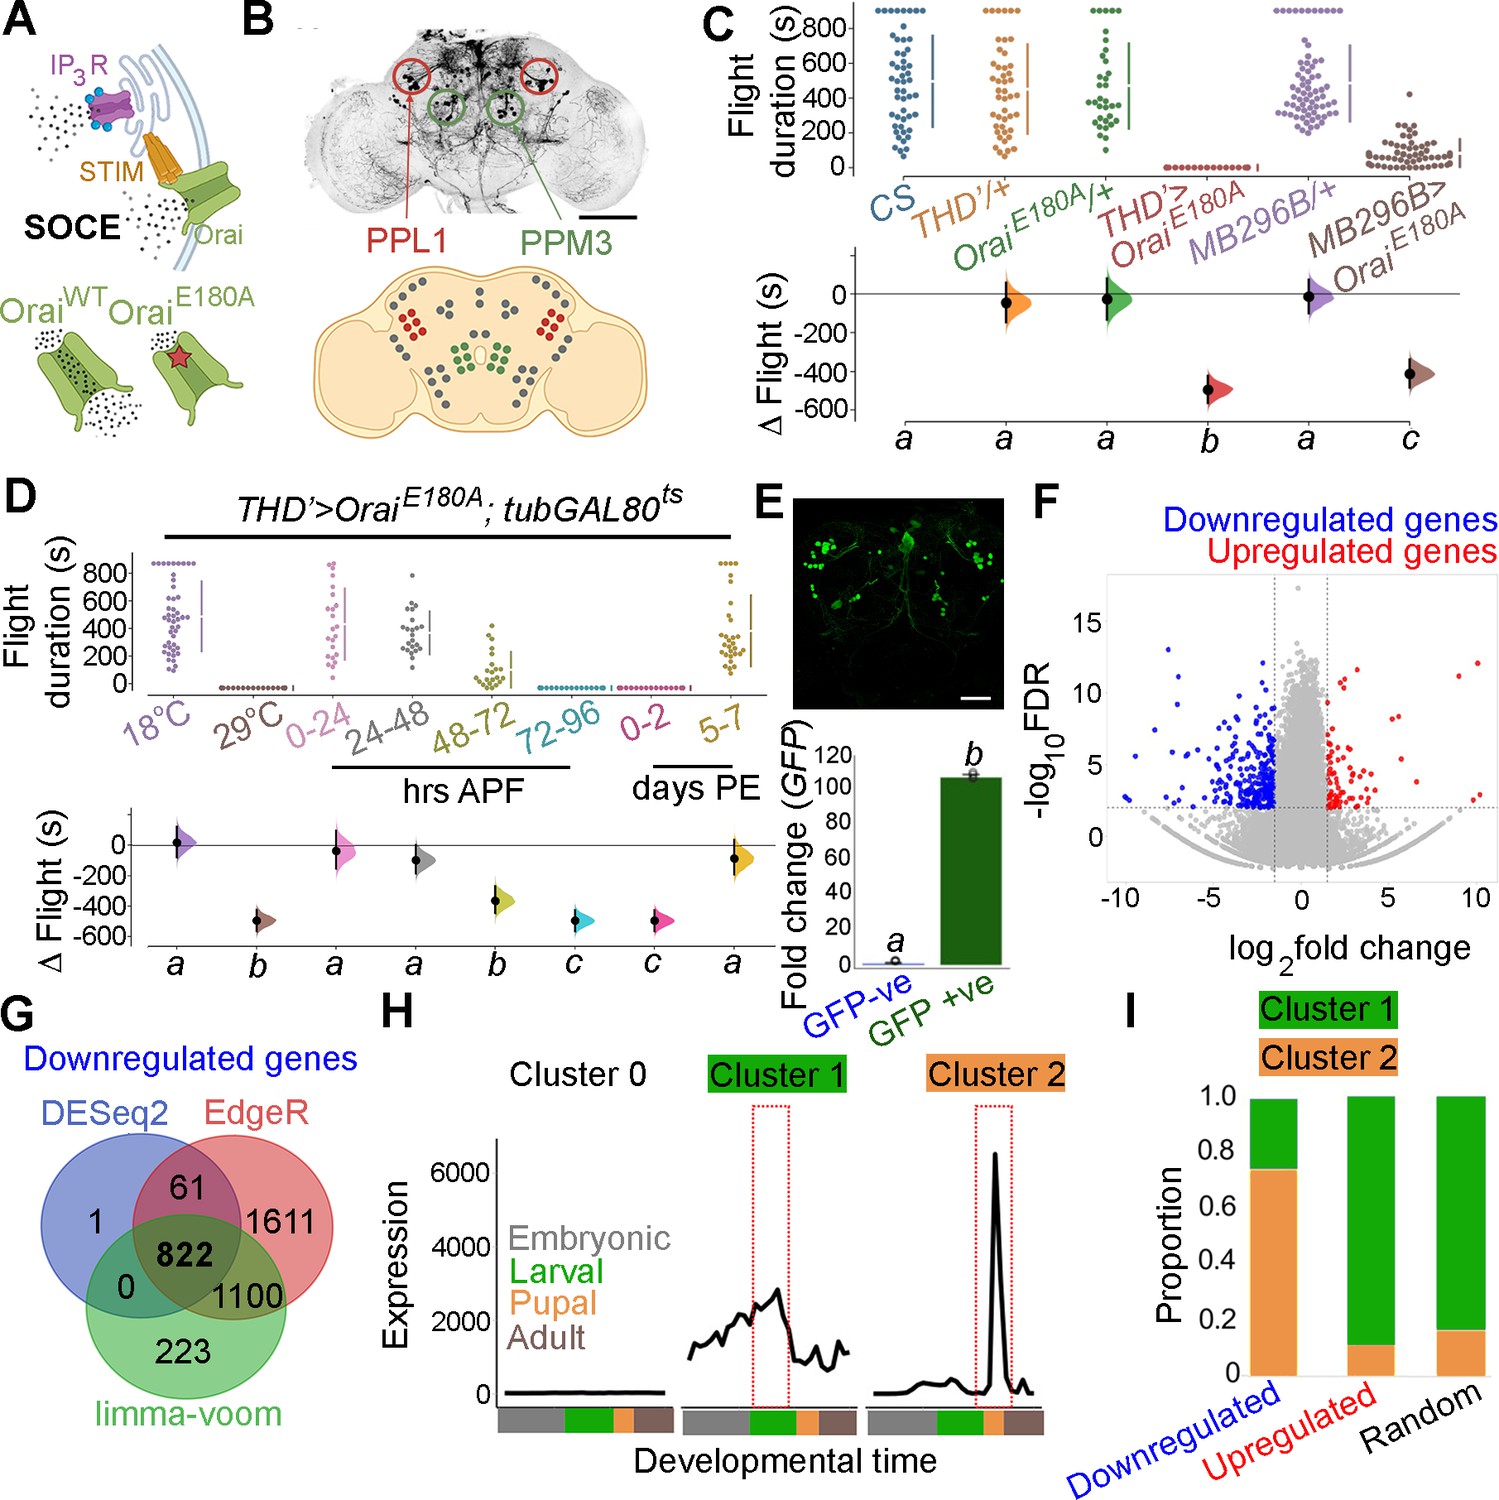
Orai-mediated Ca2+ entry sets the gene expression profile of flight-promoting dopaminergic neurons (DANs) in late development and early adulthood.
(A) A schematic of Ca2+ release through the inositol 1,4,5-trisphosphate receptor (IP3R) and store-operated Ca2+ entry (SOCE) through STIM/Orai (upper panel), followed by representation of the wildtype (Ca2+ permeable) and mutant (Ca2+ impermeable) Orai channels (lower panel). (B) Anatomical location of THD’ DANs in the fly central brain immunolabelled for mCD8GFP (upper panel), followed by a cartoon of central brain DAN clusters. Scale bar indicates 20 μm. PPL1 and PPM3 clusters are labelled in red and green, respectively. (C) Measurement of flight bout durations demonstrates a requirement for Orai-mediated Ca2+ entry in THD’ DANs and in two pairs of PPL1 DANs marked by the MB296B driver. (D) THD’ DANs require Ca2+ entry through Orai at 72–96 hr after puparium formation (APF) and 0–2 d post eclosion to promote flight. In (C) and (D), flight bout durations in seconds (s) are represented as a swarm plot where each genotype is represented by a different colour, and each fly as a single data point. The Δ Flight parameter shown below indicates the mean difference for comparisons against the shared Canton S control and is shown as a Cumming estimation plot. Mean differences are plotted as bootstrap sampling distributions. Each 95% confidence interval is indicated by the ends of the vertical error bars. The same letter beneath each distribution refers to statistically indistinguishable groups after performing a Kruskal–Wallis test followed by a post hoc Mann–Whitney U-test (p<0.005). At least 30 flies were tested for each genotype. (E) THD’ DANs were labelled with cytosolic eGFP (10 μm scale), isolated using fluorescence-activated and sorted (FACS), and validated for enrichment of GFP mRNA by qRT-pCR (lower panel). The qRT-pCR results are from four biological replicates, with different letters representing statistically distinguishable groups after performing a two-tailed t-test (p<0.05). (F) RNA-seq comparison of FAC-sorted populations of GFP-labelled THD’ DANs from THD’>GFP and THD’>GFP;OraiE180A pupal dissected central nervous systems (CNSs). The RNA-seq data is represented in the form of a volcano plot of fold change vs FDR. Individual dots represent genes, coloured in red (upregulated) or blue (downregulated) by greater than onefold. (G) Downregulated genes were identified by three different methods of differentially expressed gene (DEG) analysis, quantified, and compared as a Venn diagram. (H) Gene expression trajectories of SOCE-induced DEGs plotted as a function of developmental time (modENCODE Consortium et al., 2010) and clustered into three groups using k-means analysis. (I) The relative proportion of downregulated, upregulated genes, and a random set of genes found in the clusters described in (H) indicates that 75% of downregulated genes exhibit a pupal peak of expression.
-
Figure 1—source data 1
Raw data for flight assays (C, D), IHC quantification (E), and differential gene expression analysis (F, H, I).
- https://cdn.elifesciences.org/articles/88808/elife-88808-fig1-data1-v1.xlsx
Figure 1—figure supplement 1

Flight assays demonstrate that overexpression of Orai in THD’ dopaminergic neurons (DANs) does not cause severe flight deficits.
Flight bout durations in seconds (s) are represented as a swarm plot where each genotype is represented by a different colour, and each fly as a single data point. The Δ Flight parameter shown below indicates the mean difference for comparisons against the shared Canton S control and is shown as a Cumming estimation plot. Mean differences are plotted as bootstrap sampling distributions. Each 95% confidence interval is indicated by the ends of the vertical error bars. The same letter beneath each distribution refers to statistically indistinguishable groups after performing a Kruskal–Wallis test followed by a post hoc Mann–Whitney U-test (p<0.005). At least 30 flies were tested for each genotype.
-
Figure 1—figure supplement 1—source data 1
Raw data for flight assays.
- https://cdn.elifesciences.org/articles/88808/elife-88808-fig1-figsupp1-data1-v1.xlsx
Figure 1—figure supplement 2

A schematic representation (upper left) of the different lobes of the mushroom body, and a table denoting split GAL4 lines marking different dopaminergic neuron (DAN) subsets sending projections to them (bottom).
Projection patterns of the MB296B neurons relative to the mushroom body (red outline) are shown on the upper right.
Figure 1—figure supplement 3

Testing the requirement of Orai function in different dopaminergic neuron (DAN) subsets described in Figure 1—figure supplement 2.
Flight bout durations in seconds (s) are represented as a swarm plot where each genotype is represented by a different colour, and each fly as a single data point. The Δ Flight parameter shown below indicates the mean difference for comparisons against the shared Canton S control and is shown as a Cumming estimation plot. Mean differences are plotted as bootstrap sampling distributions. Each 95% confidence interval is indicated by the ends of the vertical error bars. The same letter beneath each distribution refers to statistically indistinguishable groups after performing a Kruskal–Wallis test followed by a post hoc Mann–Whitney U-test (p<0.005). At least 30 flies were tested for each genotype.
-
Figure 1—figure supplement 3—source data 1
Raw data for flight assays.
- https://cdn.elifesciences.org/articles/88808/elife-88808-fig1-figsupp3-data1-v1.xlsx
Figure 1—figure supplement 4
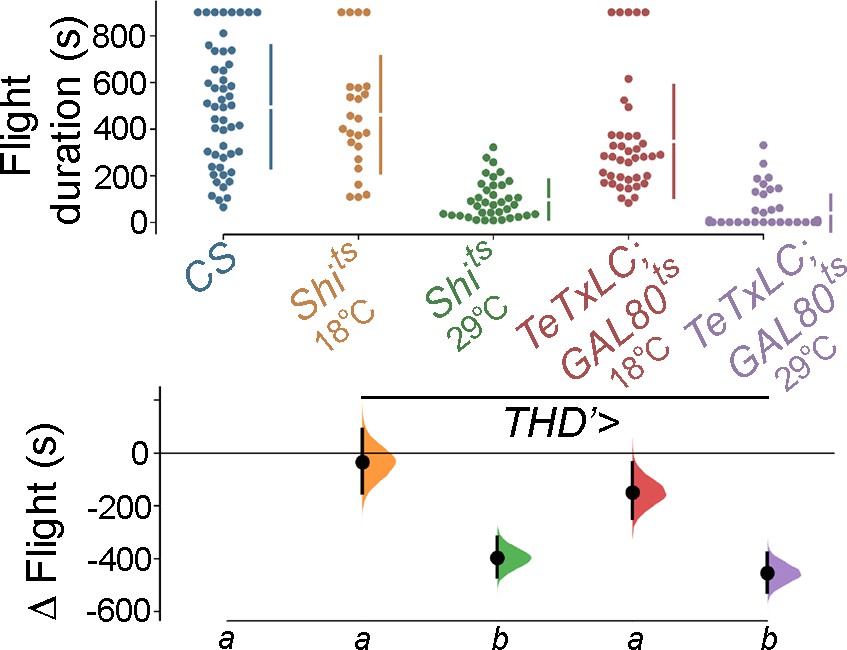
Selective inhibition of THD’ neuronal activity using Shibirets or pupal-specific Tetanus toxin (TeTxLC; GAL80ts) causes a significant loss in flight bout durations, indicating that these neurons are required for flight.
For flight assays, individual flight bout durations are represented as a swarm plot coloured according to the genotype represented. The Δ Flight parameter indicates the mean difference for comparisons against the shared Canton S control which is shown as a Cumming estimation plot. On the lower axes, mean differences are plotted as bootstrap sampling distributions. Each mean difference is depicted as a dot. Each 95% confidence interval is indicated by the ends of the vertical error bars. Letters beneath each distribution refer to statistically indistinguishable groups after performing a Kruskal–Wallis test followed by a post hoc Mann–Whitney U-test (p<0.005). At least 30 flies were used for each genotype.
-
Figure 1—figure supplement 4—source data 1
Raw data for flight assays.
- https://cdn.elifesciences.org/articles/88808/elife-88808-fig1-figsupp4-data1-v1.xlsx
Figure 1—figure supplement 5

Fluorescence-activated and sorted (FACS) plot for THD’>eGFP, where each dot represents isolated neurons from the brain, with relevant gates for purification of GFP-expressing cells.
Figure 1—figure supplement 6
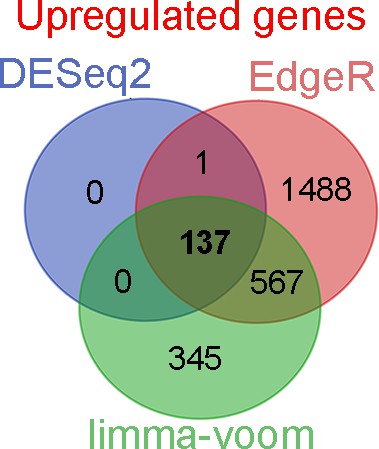
Venn diagram representing the intersections of genes upregulated upon loss of Orai function identified using three different methods of analysis.
Figure 1—figure supplement 7

Mean gene expression trajectories of upregulated, downregulated, or a random set of genes over developmental timescales (data from Kim et al., 2019).
Figure 1—figure supplement 8

Loss of Orai function results in genes being flipped in their expression state.
Lines indicate change in the baseline expression of individual genes and coloured blue or red depending upon increase or decrease of their expression upon loss of Orai function.
-
Figure 1—figure supplement 8—source data 1
Raw data for transcript quantification from RNA-Seq.
- https://cdn.elifesciences.org/articles/88808/elife-88808-fig1-figsupp8-data1-v1.xlsx
Figure 1—figure supplement 9

A kernel density estimation plot of baseline expression of up- or downregulated genes indicates that downregulated genes have higher baseline expression levels.
-
Figure 1—figure supplement 9—source data 1
Raw data for transcript quantification from RNA-Seq.
- https://cdn.elifesciences.org/articles/88808/elife-88808-fig1-figsupp9-data1-v1.xlsx
Figure 2 with 8 supplements

Ca2+ entry through Orai regulates gene expression by Set2-mediated histone modification.
(A) Scatter plot of Gene Ontology (GO) categories enriched in store-operated Ca2+ entry (SOCE)-responsive genes. Individual GO terms are represented as differently coloured circles, with radius size indicating number of genes enriched in that category. (B) Fold change of SET domain containing genes as indicated. Individual circles on the Y-axis for each gene represent transcript variants pertaining to that gene. (C) Transcripts of the H3K36 methyltransferase (left) are significantly diminished (right) in THD’ dopaminergic neurons (DANs) either upon loss of Orai function (THD’>OraiEE180A) or by knockdown of Set2 (THD’>Set2 RNAi). qRT-PCRs were performed from FAC-sorted THD’ DANs with three biological replicates. Individual 2-ΔΔCT values are shown as points. Letters represent statistically distinguishable groups after performing an ANOVA and post hoc Tukey test (p<0.05). (D) Significant rescue of flight bout durations seen in THD’>OraiEE180A flies by overexpression of Set2 and by knockdown of the Kdm4B demethylase indicating a net requirement for H3K36me3. Flight durations of single flies are depicted as swarm plots and the Δ flight parameter is shown below. Both were measured as described in the legend to Figure 1. N = 30 or more flies for each genotype. Letters represent statistically distinguishable groups after performing an ANOVA and post hoc Tukey test (p<0.005). (E) Representative images (upper panel) and quantification (lower panel) from immunostaining of H3K36me3 and H2BmRFP in nuclei of THD’ DANs from at least 10 brains. Scale bar represents 5 μm. The boxplot represents individual H3K36me3/H2BmRFP ratios from each THD’ DAN for each genotype. Letters represent statistically distinguishable groups after performing an ANOVA and post hoc Tukey test (p<0.05). (F) H3K36me3 enrichment over the gene bodies of SOCE-responsive genes in wildtype fly heads represented in the form of a tag density plot. (G) H3K36me3 signal is enriched on WT SOCE-responsive genes with greater downregulation upon loss of Orai function. Individual data points represent WT H3K36me3 ChIP-seq signals from adult fly heads represented as a boxplot (left) and a regression plot (right; Pearson’s correlation coefficient = 0.11), indicating a correlation between extent of downregulation upon loss of SOCE and greater enrichment of H3K36me3. (H) SOCE-responsive genes are enriched in H3K36me3 signal compared to H3K27me3 signal as measured from relevant ChIP-seq datasets. Adult fly head ChIP-seq datasets for measurements in (F–H) were obtained from modEncode (modENCODE Consortium et al., 2010). (I) Schematic representation of how Orai-mediated Ca2+ entry regulates a balance of two opposing epigenetic signatures in developing DANs. (J) Pharmacological inhibition of H3K27me3 using GSKS343 (left) in THD’>OraiEE180A flies results in a dose-dependent rescue of flight bout durations (right). Flight assay measurements from N > 30 flies, are represented as described earlier. Letters represent statistically distinguishable groups after performing an ANOVA and post hoc Tukey test (p<0.005).
-
Figure 2—source data 1
Raw data for GO Analysis (A), Transcript quantification (B), RT-qPCRs (C), flight assays (D, J), IHC quantification (E), and ChIP-Seq peak quantification (F, G, H).
- https://cdn.elifesciences.org/articles/88808/elife-88808-fig2-data1-v1.xlsx
Figure 2—figure supplement 1
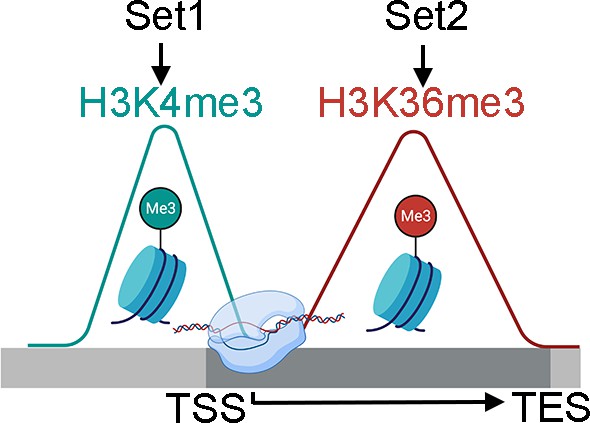
Schematic comparison between Set2-mediated H3K36me3 (red) and Set1-mediated H3K4me3 (cyan) over the gene body.
Figure 2—figure supplement 2

Developmental gene expression trajectories of Set1 and Set2 (modEncode).
-
Figure 2—figure supplement 2—source data 1
Raw data for transcript quantification from RNA-Seq.
- https://cdn.elifesciences.org/articles/88808/elife-88808-fig2-figsupp2-data1-v1.xlsx
Figure 2—figure supplement 3

Set2 is required in THD’ dopaminergic neurons (DANs) for flight.
Flight bout durations in seconds (s) are represented as a swarm plot where each genotype is represented by a different colour, and each fly as a single data point. The Δ Flight parameter shown below indicates the mean difference for comparisons against the shared Canton S control and is shown as a Cumming estimation plot. Mean differences are plotted as bootstrap sampling distributions. Each 95% confidence interval is indicated by the ends of the vertical error bars. The same letter beneath each distribution refers to statistically indistinguishable groups after performing a Kruskal–Wallis test followed by a post hoc Mann–Whitney U-test (p<0.005). At least 30 flies were tested for each genotype.
-
Figure 2—figure supplement 3—source data 1
Raw data for flight assays.
- https://cdn.elifesciences.org/articles/88808/elife-88808-fig2-figsupp3-data1-v1.xlsx
Figure 2—figure supplement 4

Set2 is required in mushroom body dopaminergic neurons (DANs) relevant for flight.
Flight bout durations in seconds (s) are represented as a swarm plot where each genotype is represented by a different colour, and each fly as a single data point. The Δ Flight parameter shown below indicates the mean difference for comparisons against the shared Canton S control and is shown as a Cumming estimation plot. Mean differences are plotted as bootstrap sampling distributions. Each 95% confidence interval is indicated by the ends of the vertical error bars. The same letter beneath each distribution refers to statistically indistinguishable groups after performing a Kruskal–Wallis test followed by a post hoc Mann–Whitney U-test (p<0.005). At least 30 flies were tested for each genotype.
-
Figure 2—figure supplement 4—source data 1
Raw data for flight assays.
- https://cdn.elifesciences.org/articles/88808/elife-88808-fig2-figsupp4-data1-v1.xlsx
Figure 2—figure supplement 5

Flight defects in the Orai loss-of-function background could not be rescued by overexpression of a control GCaMP6m transgene.
Flight bout durations in seconds (s) are represented as a swarm plot where each genotype is represented by a different colour, and each fly as a single data point. The Δ Flight parameter shown below indicates the mean difference for comparisons against the shared Canton S control and is shown as a Cumming estimation plot. Mean differences are plotted as bootstrap sampling distributions. Each 95% confidence interval is indicated by the ends of the vertical error bars. The same letter beneath each distribution refers to statistically indistinguishable groups after performing a Kruskal–Wallis test followed by a post hoc Mann–Whitney U-test (p<0.005). At least 30 flies were tested for each genotype.
-
Figure 2—figure supplement 5—source data 1
Raw data for flight assays.
- https://cdn.elifesciences.org/articles/88808/elife-88808-fig2-figsupp5-data1-v1.xlsx
Figure 2—figure supplement 6

Of the two H3K36 demethylases, Kdm4B is more highly expressed in THD’ dopaminergic neurons (DANs) at 72 hr after puparium formation (APF).
-
Figure 2—figure supplement 6—source data 1
Raw data for transcript quantification from RNA-Seq.
- https://cdn.elifesciences.org/articles/88808/elife-88808-fig2-figsupp6-data1-v1.xlsx
Figure 2—figure supplement 7

Kdm4B but not Kdm4A overexpression in THD’ dopaminergic neurons (DANs) mediates a flight rescue in the Orai loss-of-function background.
Flight bout durations in seconds (s) are represented as a swarm plot where each genotype is represented by a different colour, and each fly as a single data point. The Δ Flight parameter shown below indicates the mean difference for comparisons against the shared Canton S control and is shown as a Cumming estimation plot. Mean differences are plotted as bootstrap sampling distributions. Each 95% confidence interval is indicated by the ends of the vertical error bars. The same letter beneath each distribution refers to statistically indistinguishable groups after performing a Kruskal–Wallis test followed by a post hoc Mann–Whitney U-test (p<0.005). At least 30 flies were tested for each genotype.
-
Figure 2—figure supplement 7—source data 1
Raw data for flight assays.
- https://cdn.elifesciences.org/articles/88808/elife-88808-fig2-figsupp7-data1-v1.xlsx
Figure 2—figure supplement 8

GSK343 feeding results in a dose-dependent rescue in terms of number of flies showing >30 s of flight.
Flight assays are represented as a bar plot indicating number of individuals sustaining flight for atleast 30 seconds. Identical letters next to each group refers to statistically indistinguishable groups after performing a Kruskal–Wallis test followed by a post hoc Mann–Whitney U-test (p<0.005). At least 30 flies were tested for each genotype.
-
Figure 2—figure supplement 8—source data 1
Raw data for flight assays.
- https://cdn.elifesciences.org/articles/88808/elife-88808-fig2-figsupp8-data1-v1.xlsx
Figure 3 with 1 supplement
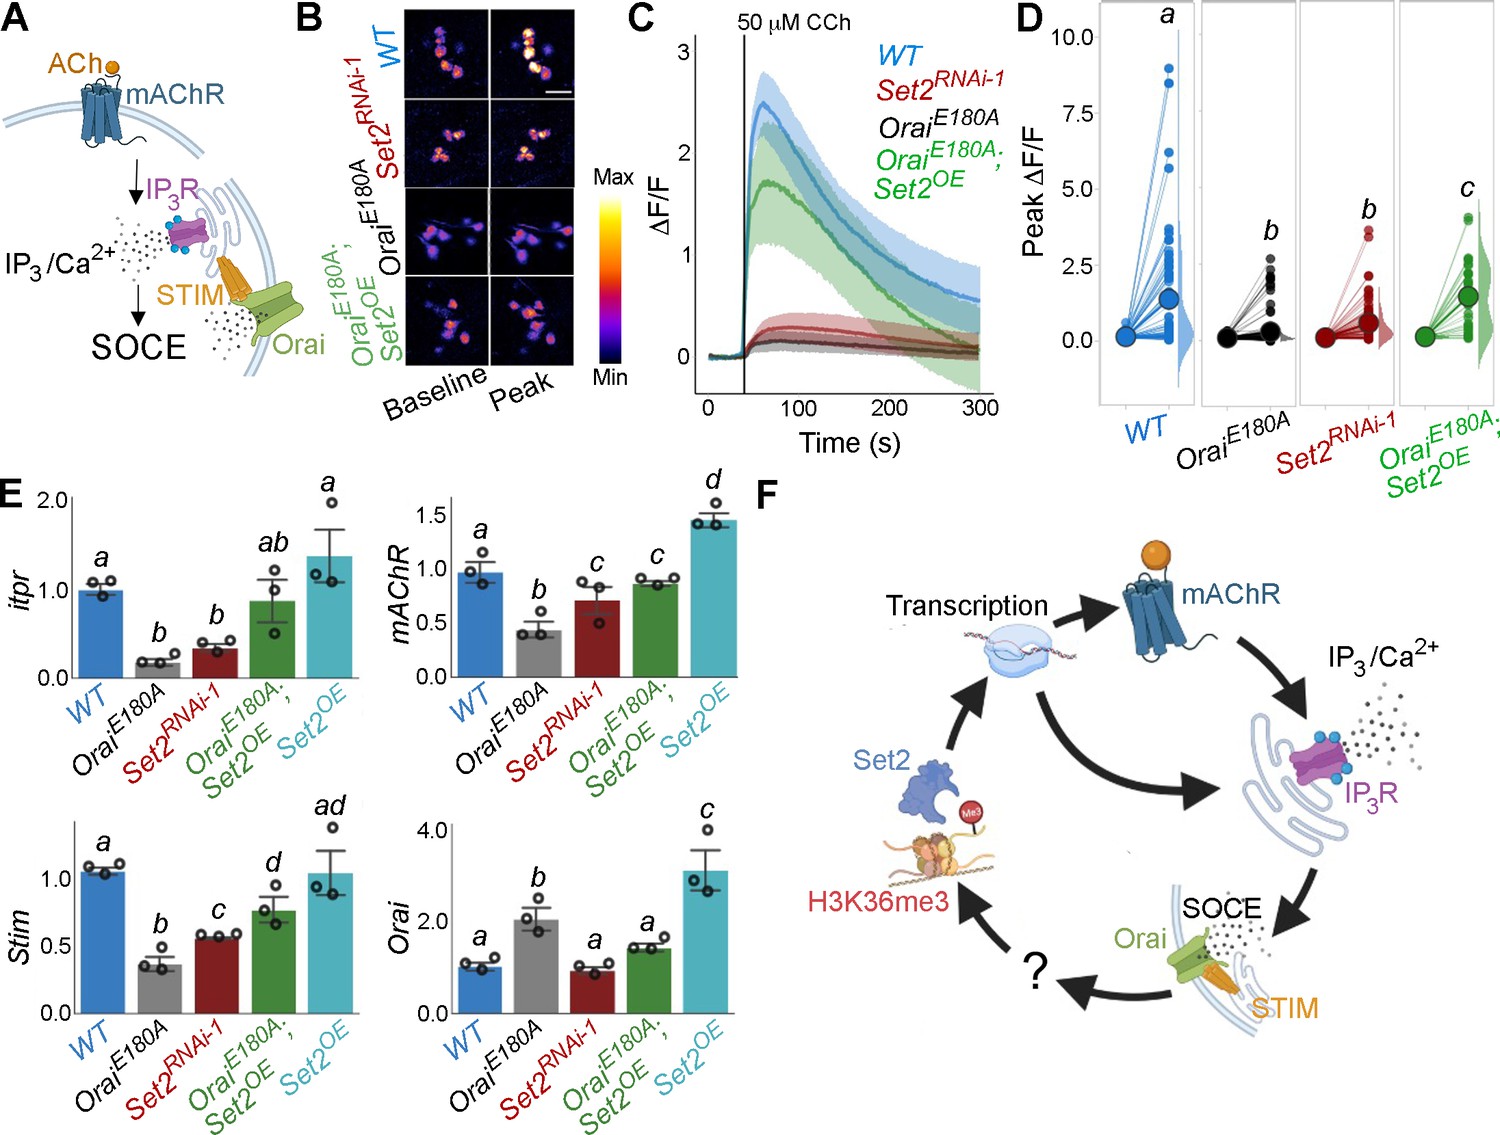
Orai-mediated Ca2+ entry potentiates cellular Ca2+ responses to cholinergic inputs through Set2 and a transcriptional feedback loop.
(A) A schematic of intracellular Ca2+ signalling downstream of neuromodulatory signalling where activation of muscarinic acetylcholine receptor (mAchR) stimulates intracellular Ca2+ release through the inositol 1,4,5-trisphosphate receptor (IP3R) followed by store-operated Ca2+ entry (SOCE) through STIM/Orai. (B) Cholinergic inputs by addition of carbachol (CCh) evoke Ca2+ signals as measured by change in the fluorescence of GCaMP6m in THD’ dopaminergic neurons (DANs) of ex vivo brains. Representative GCaMP6m images of THD’ DANs are shown with baseline and peak-evoked responses in the indicated genotypes. Scale bar = 10 μM. (C) Median GCaMP6m responses plotted as a function of time. A shaded region around the solid line represents the 95% confidence interval from 4 to 5 cells imaged per brain from 10 or more brains per genotype. (D) Individual cellular responses depicted as a paired plot where different letters above indicate statistically distinguishable groups after performing a Kruskal–Wallis test and a Mann–Whitney U-test (p<0.05). (E) qRT-PCR measurements of itpr, mAChR, Stim, and Orai from FAC-sorted THD’ DANs obtained from three biological replicates of appropriate genetic backgrounds. The genotypes include DANs with loss of cellular Ca2+ responses (THD’>OraiEE180A; and THD’>Set2RNAi-1), rescue of cellular Ca2+ response by overexpression of Set2 (THD’>OraiEE180A; Set2OE), and Set2 overexpression. Bar plots indicate mean expression levels in comparison to rp49, with individual data points represented as hollow circles. The letters above indicate statistically indistinguishable groups after performing a Kruskal–Wallis test and a Mann–Whitney U-test (p<0.05). (F) Schematic representation of a transcriptional feedback loop downstream of cholinergic stimulation in THD’ DANs.
-
Figure 3—source data 1
Raw data for imaging quantification (C, D) and RT-qPCRs (E).
- https://cdn.elifesciences.org/articles/88808/elife-88808-fig3-data1-v1.xlsx
Figure 3—figure supplement 1
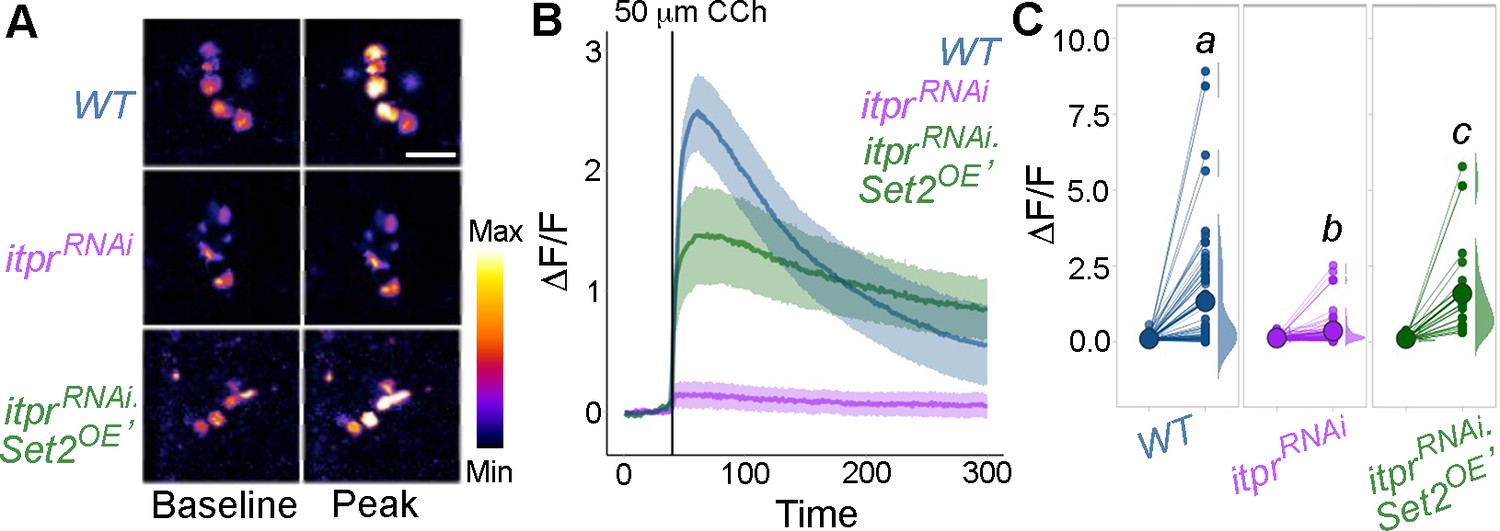
Carbachol (CCh)-evoked Ca2+ responses require inositol 1,4,5-trisphosphate receptor (IP3R) function.
(A) Representative GCaMP6m images of THD’ DANs are shown with baseline and peak-evoked responses in the indicated genotypes. Genetic depletion of IP3R abolishes the GCaMP6m response which can be rescued by overexpression of Set2. Representative images displayed with baseline and peak CCh-evoked responses of THD’ dopaminergic neurons (DANs) (A). The scale bar indicates 10 μm. (B) Median GCaMP6m responses is plotted as a function of time, with different colours representing different genotypes and a shaded region around the solid line representing the 95% confidence interval from at least 10 biological replicates per genotype. The solid black line indicates the time point of addition of 50 μM CCh. Individual cellular responses are plotted as a paired plot in (C). Letters above indicate statistically indistinguishable groups after performing a Kruskal–Wallis test and a Mann–Whitney U-test (p<0.05).
-
Figure 3—figure supplement 1—source data 1
Raw data for imaging quantification (B, C).
- https://cdn.elifesciences.org/articles/88808/elife-88808-fig3-figsupp1-data1-v1.xlsx
Figure 4 with 4 supplements
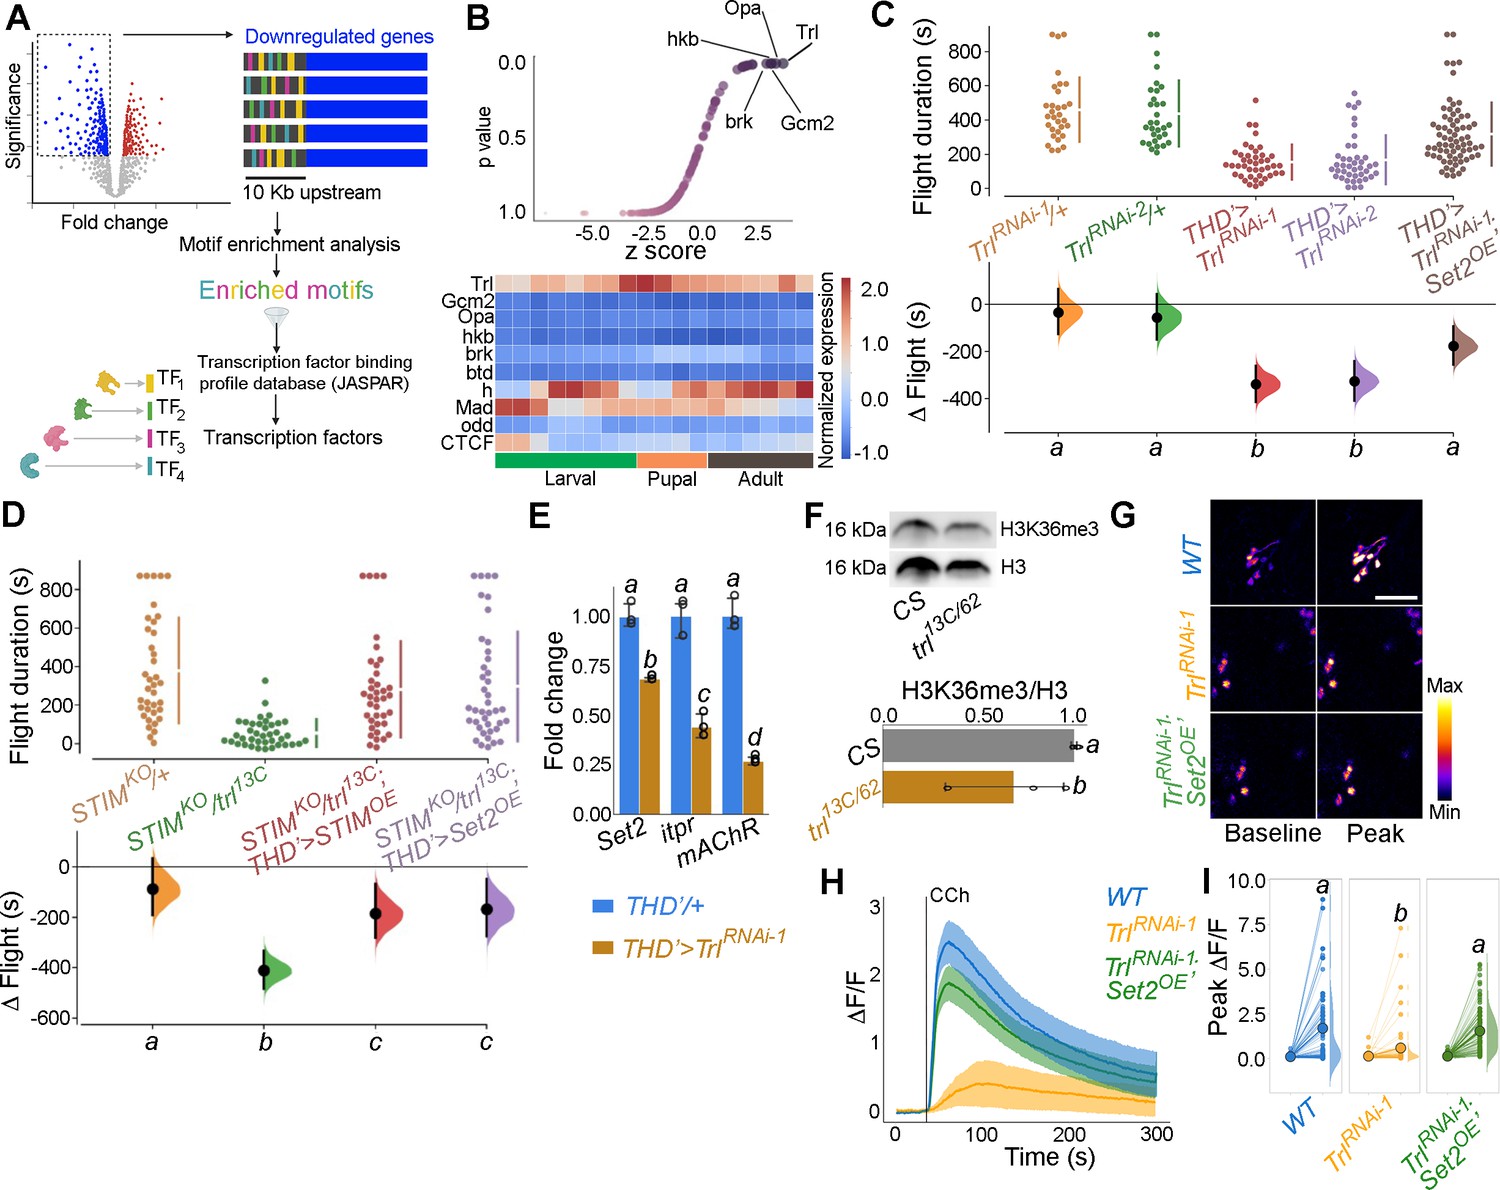
Identification of trithorax-like (Trl) as a store-operated Ca2+ entry (SOCE)-responsive transcription factor (TF).
(A) Schematic of motif enrichment analysis for identification of putative SOCE-dependent TFs. (B) Candidate TFs identified (upper panel) and their expression through development (lower panel; modEncode; modENCODE Consortium et al., 2010) suggests Trl as a top SOCE-responsive candidate TF. (C) Genetic depletion of Trl in THD’ dopaminergic neurons (DANs) results in significant flight defects, which can be rescued by overexpression of Set2. (D) Heteroallelic combination of the Trl hypomorphic allele (trl13C) with a STIM deficiency causes significant flight deficits, which can be rescued by overexpression of STIM or Set2. (E) qRT-PCRs measured relative to rp49 show reduced Set2, itpr, and mAChR levels in THD’ DANs upon Trl knockdown with TrlRNAi-1. Individual data points of four biological replicates are shown as circles and mean expression level as a bar plot (± SEM). The letters above indicate statistically indistinguishable groups after performing a Kruskal–Wallis test and a Mann–Whitney U-test (p<0.05). (F) A representative western blot (left) showing reduced H3K36me3 levels in a Trl mutant combination. Quantification of H3K36me3 from three biological replicates of WT (control) and Trl mutant brain lysates (panel on the right). Letters indicate statistically indistinguishable groups after performing a two-tailed t-test (p<0.05). (G) Knockdown of Trl in THD’ neurons attenuates Ca2+ response to carbachol (CCh) as shown in representative images of GCamP6m fluorescence quantified in (H, I). Scale bar = 10 μM. Set2 overexpression in the background of THD’>TrlRNAi rescues the cholinergic response (G–I). Quantification of Ca2+ responses is from 10 or more brains per genotype and performed as described in the legend to Figure 3. The letters above indicate statistically indistinguishable groups after performing a Kruskal–Wallis test and a Mann–Whitney U-test (p<0.05).
-
Figure 4—source data 1
Raw data for TF motif enrichment analysis (B), flight assays (C, D), RT-qPCRs (E), western blot quantifications (F),and imaging quantifications (H, I).
- https://cdn.elifesciences.org/articles/88808/elife-88808-fig4-data1-v1.xlsx
Figure 4—figure supplement 1

Motifs of the top ranked transcription factors (TFs) identified using motif enrichment.
Figure 4—figure supplement 2
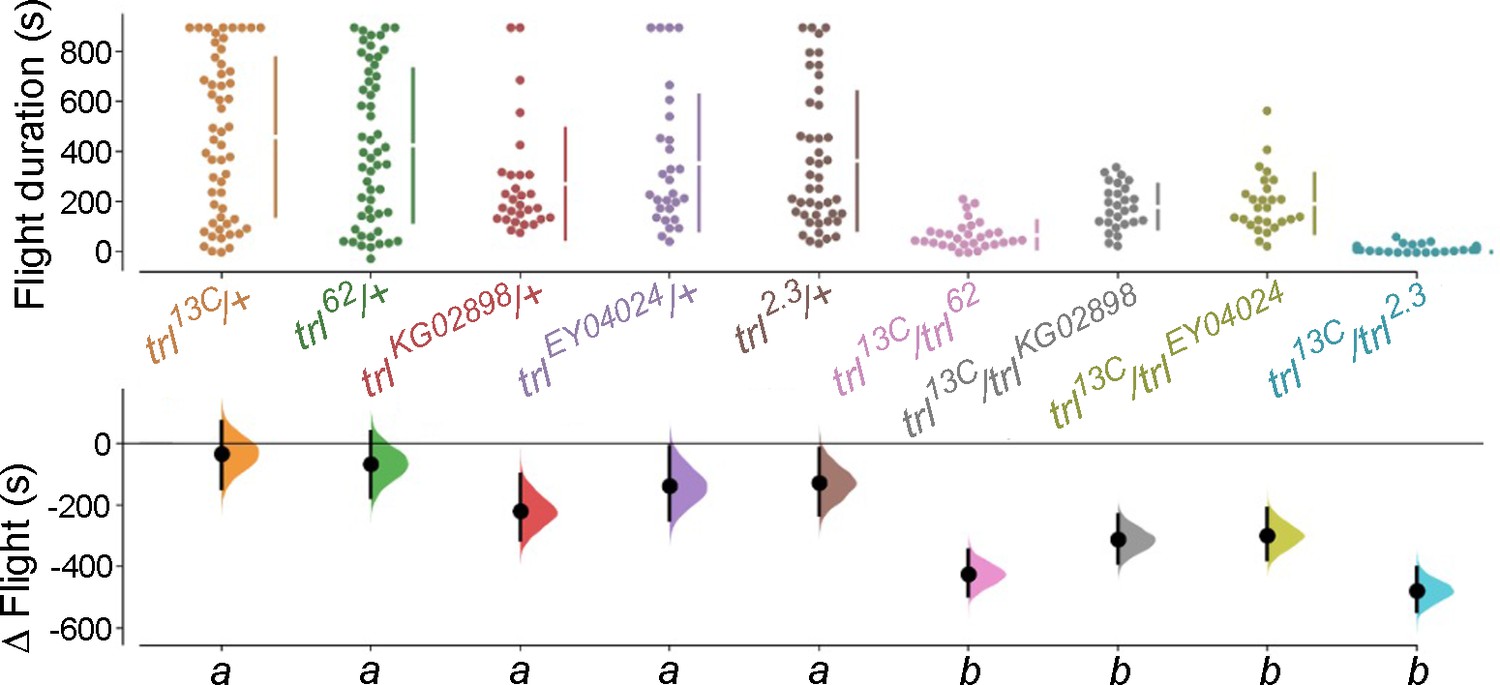
Trithorax-like (Trl) is required for flight.
Genotypes with heteroallelic combinations hypomorphic Trl alleles show flight deficits to varying extents.
-
Figure 4—figure supplement 2—source data 1
Raw data for flight assays.
Flight bout durations in seconds (s) are represented as a swarm plot where each genotype is represented by a different colour, and each fly as a single data point. The Δ Flight parameter shown below indicates the mean difference for comparisons against the shared Canton S control and is shown as a Cumming estimation plot. Mean differences are plotted as bootstrap sampling distributions. Each 95% confidence interval is indicated by the ends of the vertical error bars. The same letter beneath each distribution refers to statistically indistinguishable groups after performing a Kruskal–Wallis test followed by a post hoc Mann–Whitney U-test (p<0.005). At least 30 flies were tested for each genotype.
- https://cdn.elifesciences.org/articles/88808/elife-88808-fig4-figsupp2-data1-v1.xlsx
Figure 4—figure supplement 3
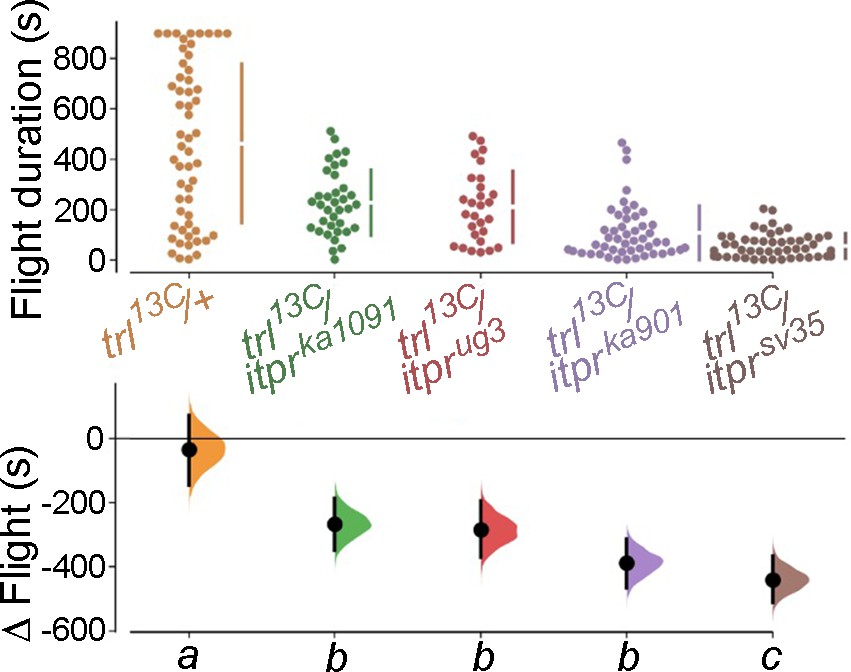
Genetic interaction between hypomorphic Trl alleles and itpr alleles results in significant flight defects.
Flight bout durations in seconds (s) are represented as a swarm plot where each genotype is represented by a different colour, and each fly as a single data point. The Δ Flight parameter shown below indicates the mean difference for comparisons against the shared Canton S control and is shown as a Cumming estimation plot. Mean differences are plotted as bootstrap sampling distributions. Each 95% confidence interval is indicated by the ends of the vertical error bars. The same letter beneath each distribution refers to statistically indistinguishable groups after performing a Kruskal–Wallis test followed by a post hoc Mann–Whitney U-test (p<0.005). At least 30 flies were tested for each genotype.
-
Figure 4—figure supplement 3—source data 1
Raw data for flight assays.
- https://cdn.elifesciences.org/articles/88808/elife-88808-fig4-figsupp3-data1-v1.xlsx
Figure 4—figure supplement 4

Annotation of the Set2 promoter revealed multiple trithorax-like (Trl)-binding sites.
Flight assay measurements are represented as described earlier.
Figure 5 with 4 supplements
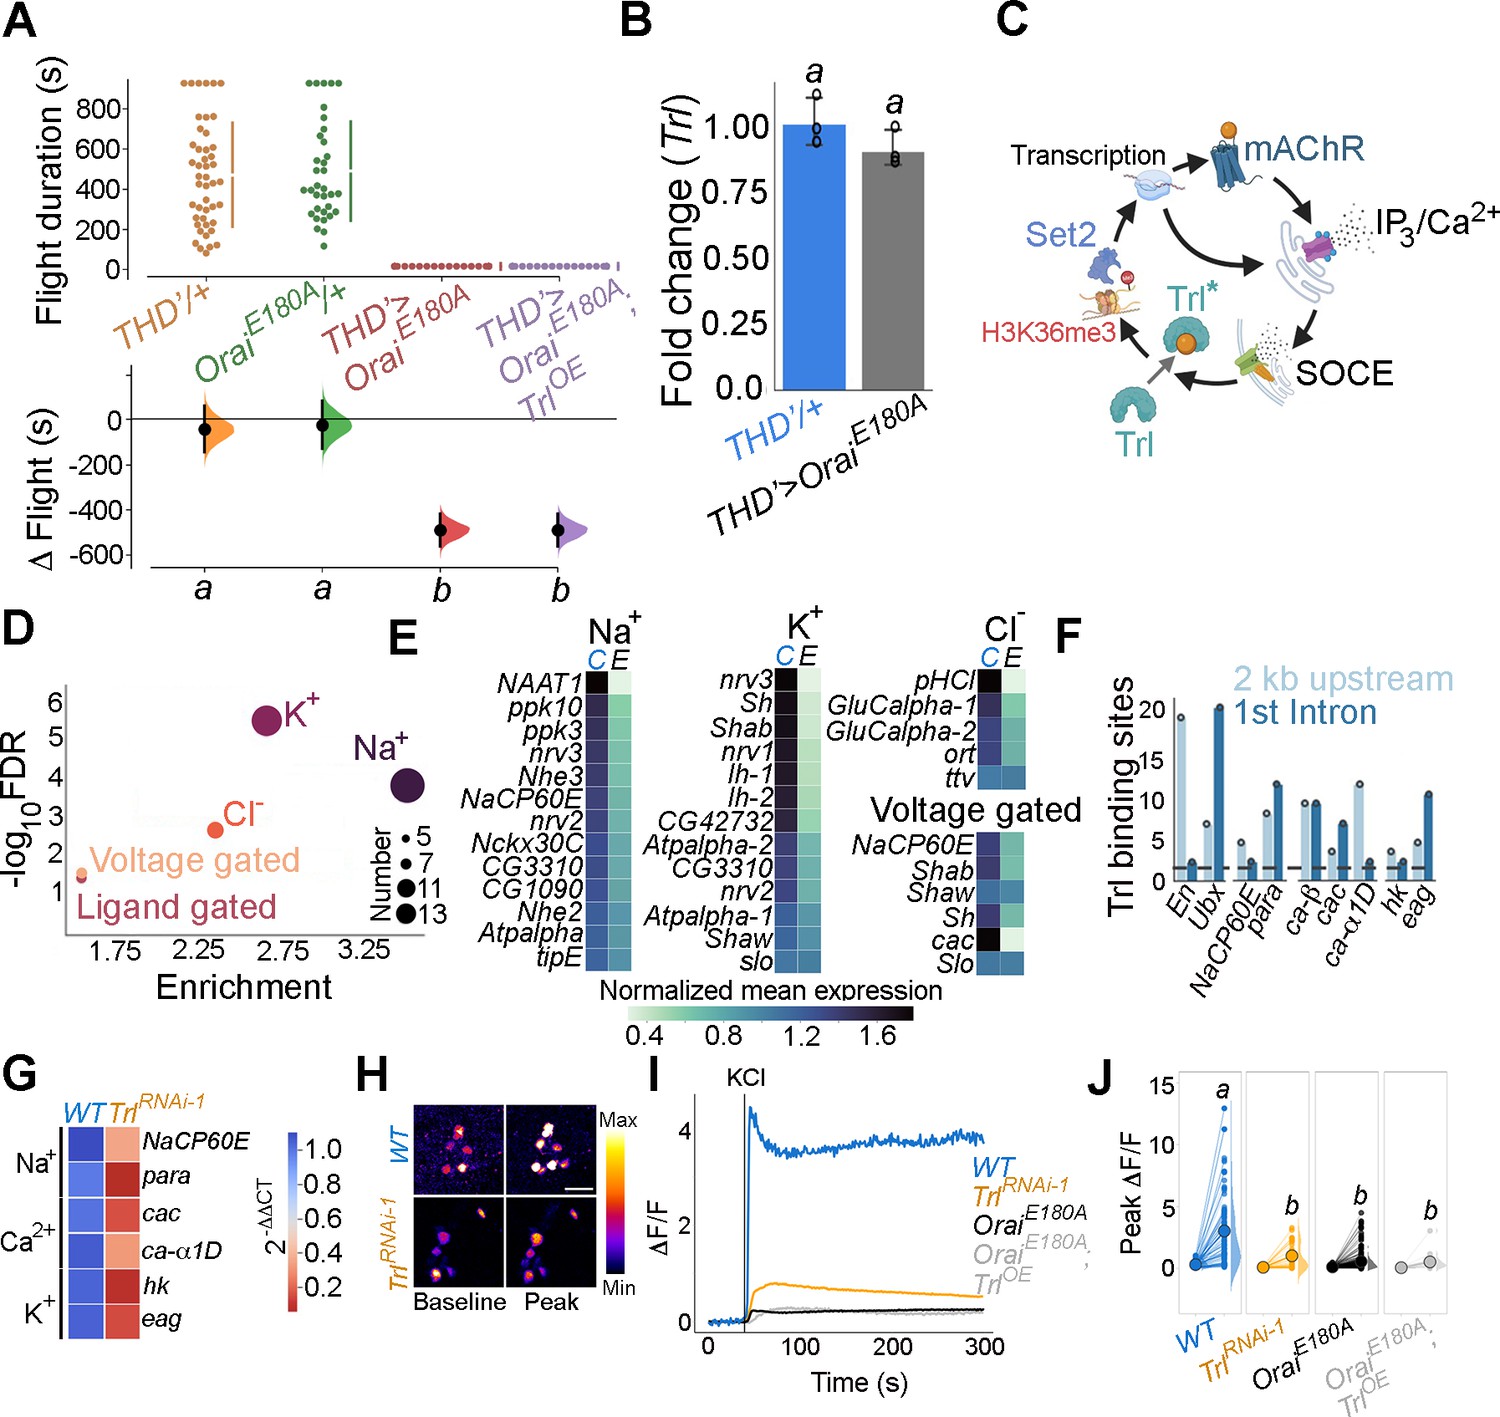
Trithorax-like (Trl) activity downstream of store-operated Ca2+ entry (SOCE) is required for THD’ dopaminergic neuron (DAN) activity.
(A) Overexpression of WT Trl is insufficient to rescue flight deficits in THD’>OraiEE180A flies as evident from flight bout measurements in the indicated genotypes. Flight assay measurements are as described earlier. (B) Trl transcript levels are not altered in THD’>OraiEE180A neurons with loss of SOCE. qRT-PCR data are measured relative to rp49. The bar plot indicates mean expression levels, with individual data points represented as circles. The letters above indicate statistically indistinguishable groups from three independent biological replicates after performing a two-tailed t-test (p<0.05). (C) Schematic with possible Ca2+- mediated activation of Trl downstream of Orai-mediated Ca2+ entry (SOCE). (D). Genes encoding ion channels are enriched among SOCE-responsive genes in THD’ DANs as determined by Gene Ontology (GO) analysis. Circles of varying radii are scaled according to the number of genes enriched in that category. (E) Downregulation of individual ion channel genes depicted as a heatmap. (F) Number of Trl binding sites (GAGA repeats) shown as a bar plot in the regulatory regions (2 kb upstream or first intron) of key SOCE-responsive ion channel genes compared to known Trl targets (En and Ubx). The dashed line indicates the average expected number of Trl targets. (G) Heatmap of 2^-ΔΔCT values measured using qRT-PCRs from sorted THD’ DANs with knockdown of Trl. (H) Representative images of KCl-induced depolarising responses in THD’ DANs with knockdown of Trl. (scale bar = 10 μM) quantified in (I, J). Quantification of Ca2+ responses is from 10 or more brains per genotype and performed as described in the legend to Figure 3. The letters above indicate statistically indistinguishable groups after performing a Kruskal–Wallis test and a Mann–Whitney U-test (p<0.05).
-
Figure 5—source data 1
Raw data for flight assays (A), RT-qPCRs (B), GO analysis (D), transcript quantfication from RNA-Seq (E, G), TF bindiing site analysis (F),and imaging quantifications (I, J).
- https://cdn.elifesciences.org/articles/88808/elife-88808-fig5-data1-v1.xlsx
Figure 5—figure supplement 1

In silico analysis of trithorax-like (Trl) reveals a BTB/POZ domain, a Zn-finger domain, and a Q-rich domain.
Figure 5—figure supplement 2

Possible interacting partners of trithorax-like (Trl) enriched from an LC-MS dataset (Lomaev et al., 2017) and compared to their expression in THD’ neurons as a scatter plot.
Individual circles represent interacting partners scaled according to their relative expression.
-
Figure 5—figure supplement 2—source data 1
Raw data for Trl interacting proteins.
- https://cdn.elifesciences.org/articles/88808/elife-88808-fig5-figsupp2-data1-v1.xlsx
Figure 5—figure supplement 3

THD’-specific inhibition of CamKII activity either by expression of an inhibitory Ala peptide or through RNAi downregulation results in significant flight deficits.
Flight bout durations in seconds (s) are represented as a swarm plot where each genotype is represented by a different colour, and each fly as a single data point. The Δ Flight parameter shown below indicates the mean difference for comparisons against the shared Canton S control and is shown as a Cumming estimation plot. Mean differences are plotted as bootstrap sampling distributions. Each 95% confidence interval is indicated by the ends of the vertical error bars. The same letter beneath each distribution refers to statistically indistinguishable groups after performing a Kruskal–Wallis test followed by a post hoc Mann–Whitney U-test (p<0.005). At least 30 flies were tested for each genotype.
-
Figure 5—figure supplement 3—source data 1
Raw data for flight assays.
- https://cdn.elifesciences.org/articles/88808/elife-88808-fig5-figsupp3-data1-v1.xlsx
Figure 5—figure supplement 4

Expression of a dominant active Ca2+-insensitive CamKII (CamKIIT287D) partially rescues flight in THD’>OraiEE180A flies.
Flight bout durations in seconds (s) are represented as a swarm plot where each genotype is represented by a different colour, and each fly as a single data point. The Δ Flight parameter shown below indicates the mean difference for comparisons against the shared Canton S control and is shown as a Cumming estimation plot. Mean differences are plotted as bootstrap sampling distributions. Each 95% confidence interval is indicated by the ends of the vertical error bars. The same letter beneath each distribution refers to statistically indistinguishable groups after performing a Kruskal–Wallis test followed by a post hoc Mann–Whitney U-test (p<0.005). At least 30 flies were tested for each genotype.
-
Figure 5—figure supplement 4—source data 1
Raw data for flight assays.
- https://cdn.elifesciences.org/articles/88808/elife-88808-fig5-figsupp4-data1-v1.xlsx
Figure 6
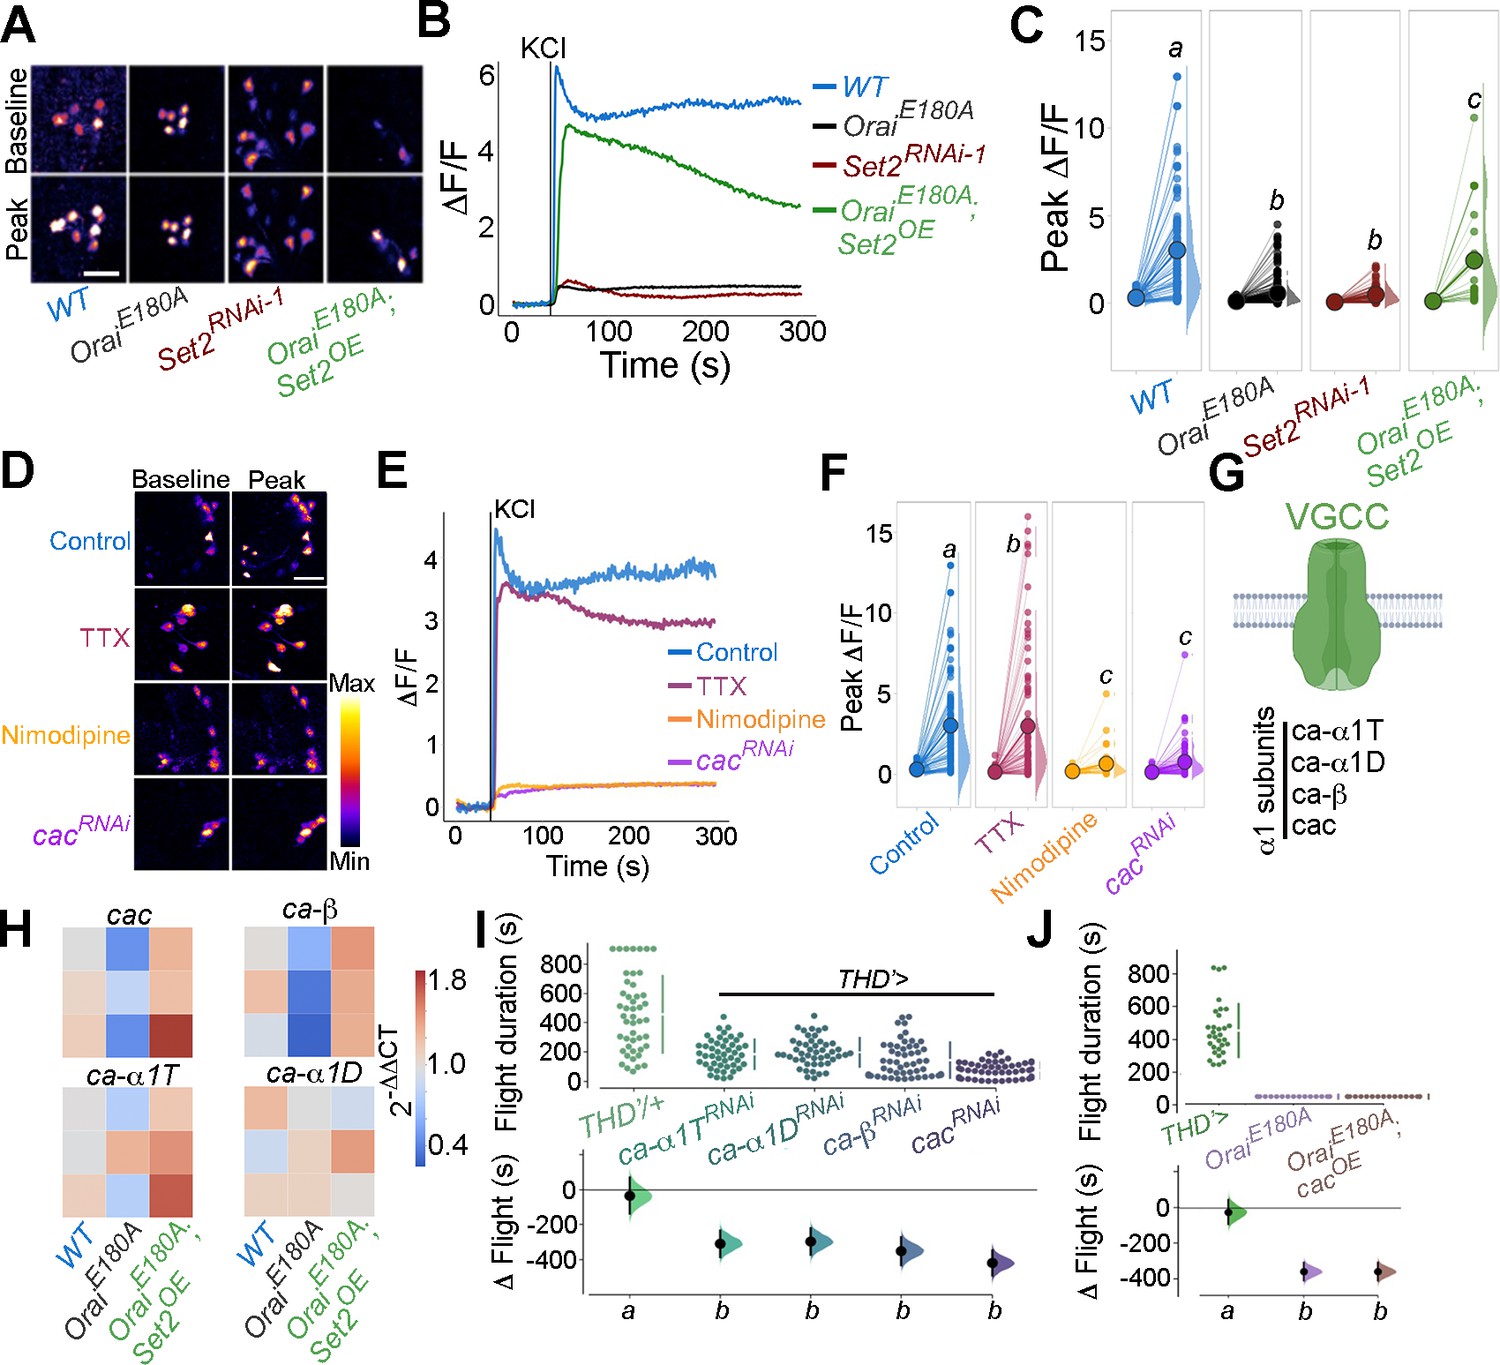
Flight-promoting central dopaminergic neuron (fpDAN) excitability requires Orai-mediated Ca2+ entry acting through Set2-mediated VGCC gene expression.
KCl-induced depolarising responses in fpDANs of the indicated genotypes measured using GCaMP6m indicate a requirement for Orai and Set2. Representative images (A). Scale bar = 10 μM, quantified in (B) and (C). KCl-evoked responses are modulated upon treatment with 10 μM tetrodotoxin (TTX) (magenta), 10 μM nimodipine (orange), and upon cacRNAi (purple), representative images (scale bar = 10 μM) (D), quantified in (E). Median KCl-evoked GCaMP6m responses plotted as a function of time. The solid line indicates the time point of addition of 70 mM KCl. KCl responses are quantified as a paired plot of peak responses and (F) with letters representing statistically indistinguishable groups as measured using a Kruskal–Wallis test and post hoc Mann–Whitney U-test (p<0.05). Quantification of Ca2+ responses is from 10 or more brains per genotype and performed as described in the legend to Figure 3. (G) Schematic of a typical VGCC and its constituent subunits. (H) Heatmap of 2^-ΔΔCT values measured using qRT-PCRs from sorted THD’ DANs shows a reduction in the expression of VGCC subunit genes upon loss of Orai function and a rescue by Set2 overexpression. (I) Flight assays representing the effect of various VGCC subunit gene RNAis showing flight defects to varying extents. Overexpression of the key VGCC subunit gene-cac is required (I) but not sufficient (J) for restoring flight defects caused by loss of Orai function. Flight assay measurements are as described earlier.
-
Figure 6—source data 1
Raw data for imaging quantitations (B, C, E, F), RT-qPCRs (H),and flight assays and (I, J).
- https://cdn.elifesciences.org/articles/88808/elife-88808-fig6-data1-v1.xlsx
Figure 7 with 3 supplements
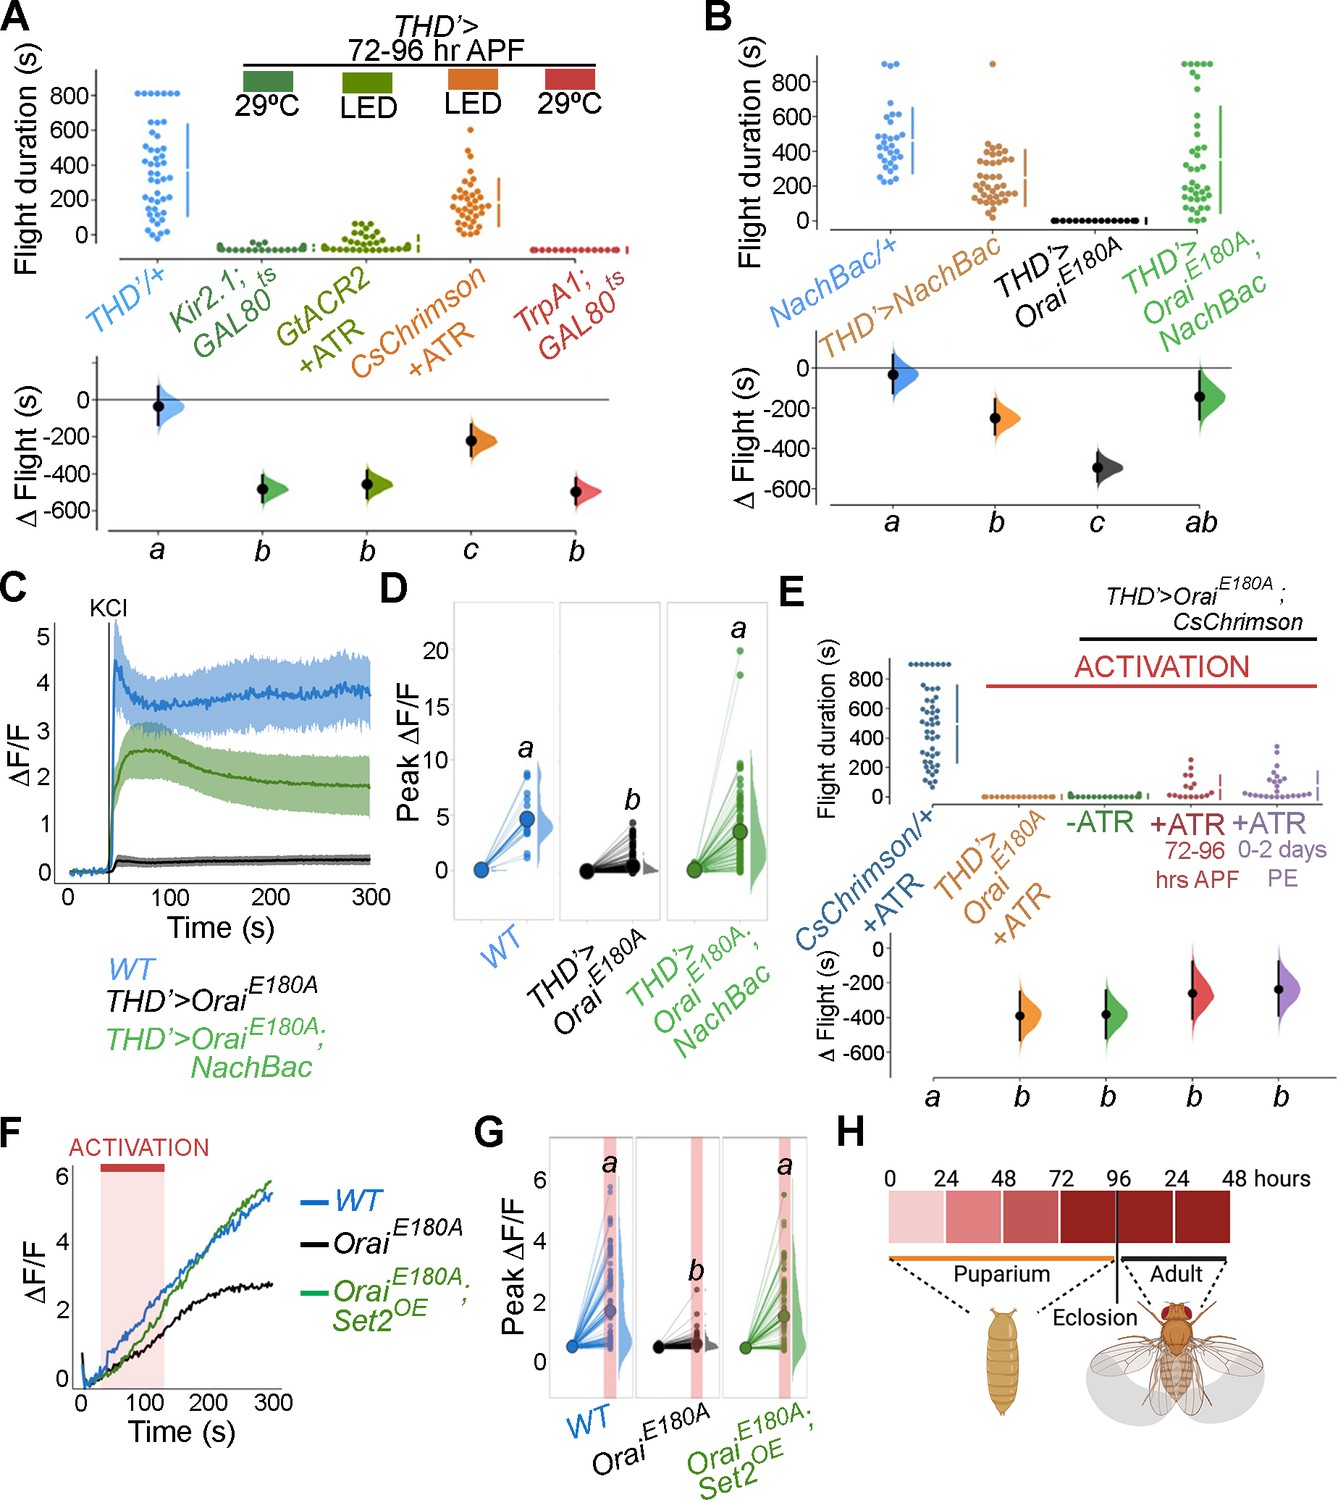
Store-operated Ca2+ entry (SOCE)-mediated gene expression sets the excitability threshold during pupal development.
(A) Altering excitability in THD’ dopaminergic neurons (DANs) using Kir2.1 or GtACR2-mediated inhibition or CsChrimson or TrpA1 during the critical 72–96 hr after puparium formation (APF) developmental window results in significant flight defects. Orai loss-of-function phenotypes can be rescued by overexpression of NachBac or CsChrimson in terms of flight bout durations (B, E) and depolarising KCl responses (C, D, F, G). (H) Schematic of Orai-mediated Ca2+ entry regulating expression of key genes that regulate the excitability threshold of dopaminergic neurons regulating flight during a critical developmental window. Flight assays are represented as described earlier (n > 30). Ca2+ responses were quantified as described in the legend to Figure 3 and were from 10 or more brains per genotype. Letters above each genotype represent statistically indistinguishable groups as measured using a Kruskal–Wallis test and post hoc Tukey test (p<0.05).
-
Figure 7—source data 1
Raw data for flight assays (A, B, E), and imaging quantifications (C, D, F, G).
- https://cdn.elifesciences.org/articles/88808/elife-88808-fig7-data1-v1.xlsx
Figure 7—figure supplement 1

Dietary KCl supplementation shows a minor rescue of flight in a dose-dependent manner in Orai-deficient (THD’>OraiEE180A) animals.
Flight bout durations in seconds (s) are represented as a swarm plot where each genotype is represented by a different colour, and each fly as a single data point. The Δ Flight parameter shown below indicates the mean difference for comparisons against the shared Canton S control and is shown as a Cumming estimation plot. Mean differences are plotted as bootstrap sampling distributions. Each 95% confidence interval is indicated by the ends of the vertical error bars. The same letter beneath each distribution refers to statistically indistinguishable groups after performing a Kruskal–Wallis test followed by a post hoc Mann–Whitney U-test (p<0.005). At least 30 flies were tested for each genotype.
-
Figure 7—figure supplement 1—source data 1
Raw data for flight assays.
- https://cdn.elifesciences.org/articles/88808/elife-88808-fig7-figsupp1-data1-v1.xlsx
Figure 7—figure supplement 2

Inhibition of glial K+ uptake by knockdown of the K+ channel-sandman in the background of Orai deficiency in the dopaminergic neurons (DANs) shows a partial rescue in flight.
Flight bout durations in seconds (s) are represented as a swarm plot where each genotype is represented by a different colour, and each fly as a single data point. The Δ Flight parameter shown below indicates the mean difference for comparisons against the shared Canton S control and is shown as a Cumming estimation plot. Mean differences are plotted as bootstrap sampling distributions. Each 95% confidence interval is indicated by the ends of the vertical error bars. The same letter beneath each distribution refers to statistically indistinguishable groups after performing a Kruskal–Wallis test followed by a post hoc Mann–Whitney U-test (p<0.005). At least 30 flies were tested for each genotype.
-
Figure 7—figure supplement 2—source data 1
Raw data for flight assays.
- https://cdn.elifesciences.org/articles/88808/elife-88808-fig7-figsupp2-data1-v1.xlsx
Figure 7—figure supplement 3
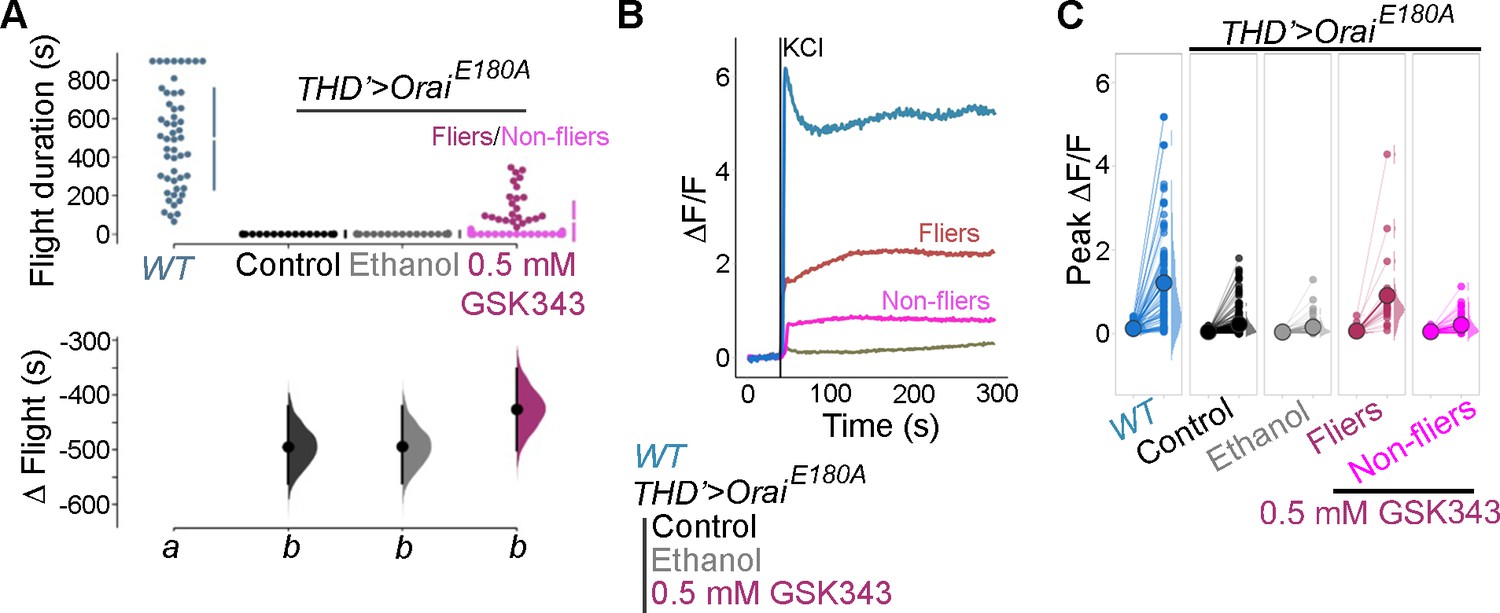
Loss of flight (A) and loss of Ca2+ entry upon KCl depolarisation (B) in THD’>OraiE180A flies are partially rescued upon feeding an H3K27me3 antagonist- GSK343 (0.5 mm).
Flies showing >30 s of flight (fliers, in dark magenta) show correspondingly elevated KCl responses (B), quantified in (C). Flight assay and Ca2+ measurements are as described earlier.
-
Figure 7—figure supplement 3—source data 1
Raw data for flight assays (A) and imaging quantifications (B, C).
- https://cdn.elifesciences.org/articles/88808/elife-88808-fig7-figsupp3-data1-v1.xlsx
Figure 8
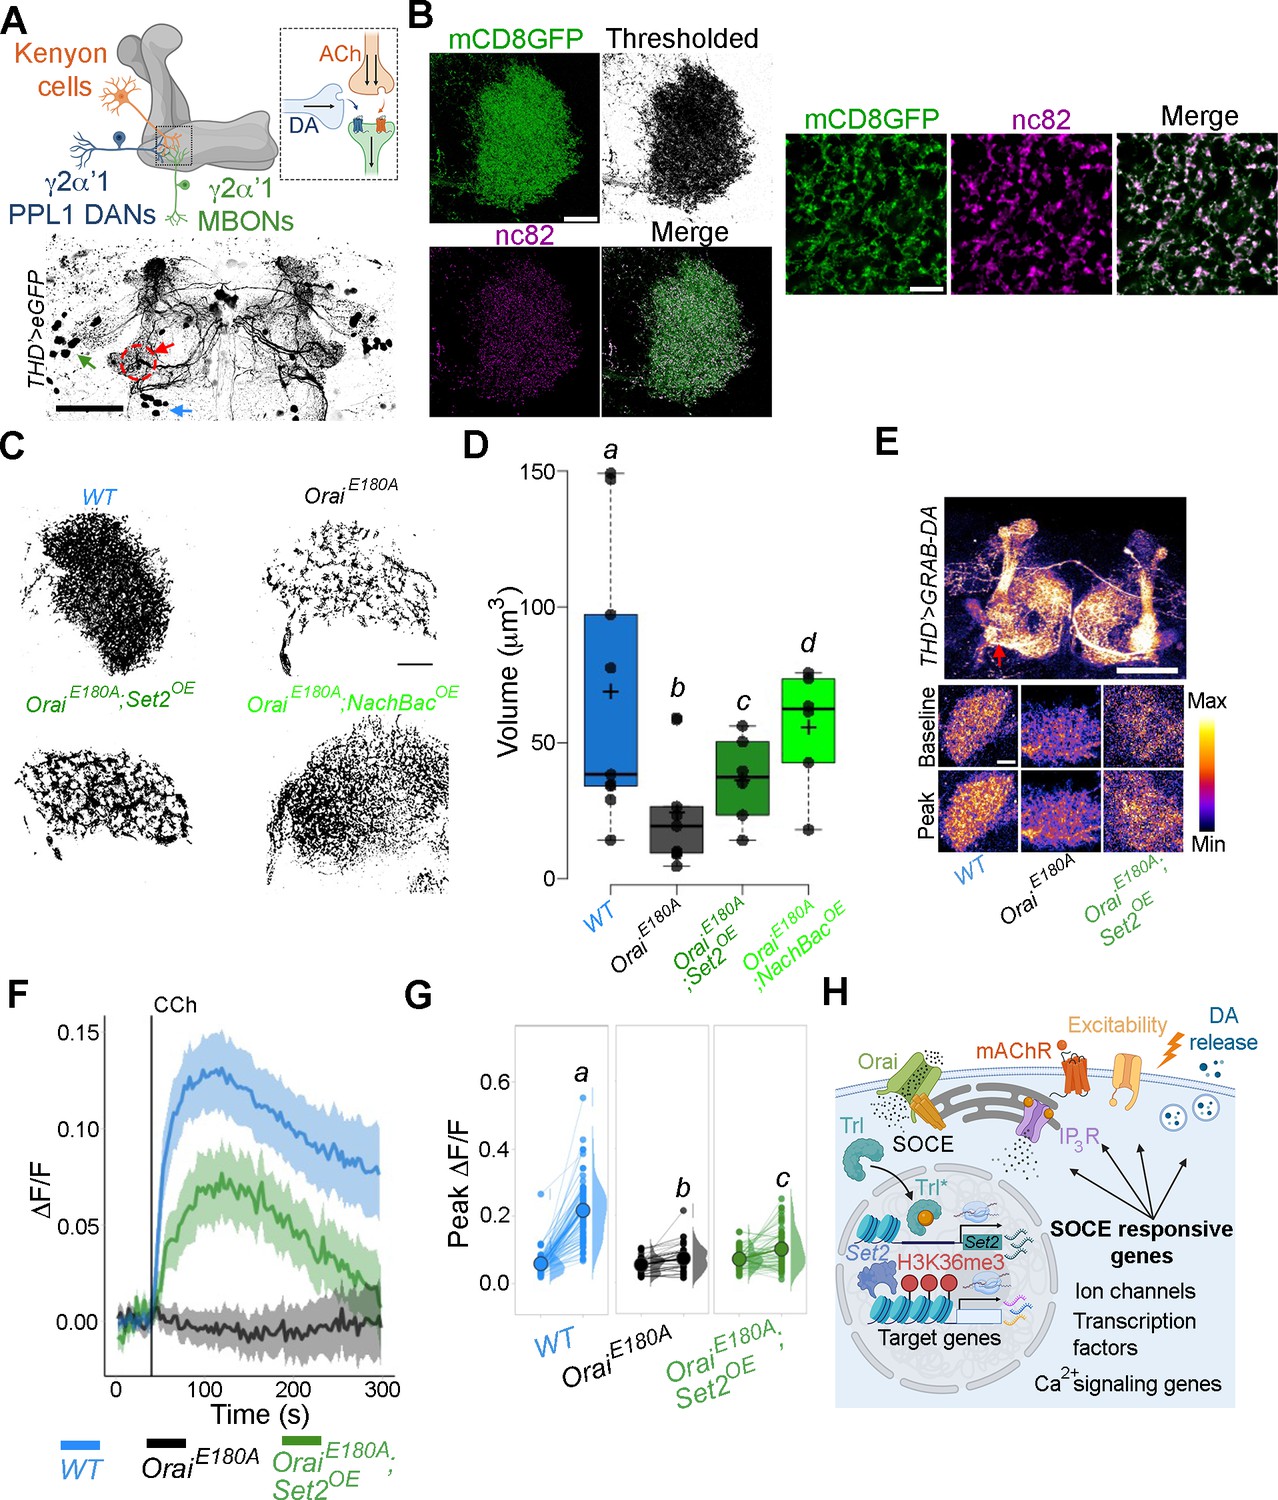
THD’ dopaminergic neurons (DANs) require store-operated Ca2+ entry (SOCE)-mediated gene expression for axonal arborisation and neuromodulatory dopamine release in the mushroom body (MB) γ lobe.
(A) Schematic of a KC-DAN-MBON tripartite synapse at the γ2α’1 MB lobe (upper), innervated by flight-promoting central dopaminergic neurons (fpDANs) (lower). The γ2α’1 MB lobe is marked by a red circle and arrow, and the fpDAN clusters are marked with a green arrow (PPL1) and blue arrow (PPM3). Scale bar = 50 μM. (B) Representative images of the MB γ lobe marked with THD’-driven mCD8GFP (green) and immunolabelled with anti-nc82 (Brp) antibody (magenta) to mark the presynaptic terminals. Scale bar = 5 μm. (C) Representative optical sections through the MB γ lobe from the indicated genotypes. Changes in axonal arborisation observed were quantified as total projection volume in (D, E). Carbachol (CCh)-evoked DA release measured at the γ2α’1 MB lobe using the GRAB-DA sensor expressed in THD’ DANs. Representative GRAB-DA images of THD’ DANs are shown with baseline and peak-evoked responses in the indicated genotypes. Scale bar = 10 μM. (F) Median GRAB-DA responses plotted as a function of time. A shaded region around the solid line represents the 95% confidence interval from 10 or more brains per genotype. (G) Individual cellular responses depicted as a paired plot of peak responses where different letters above indicate statistically distinguishable groups after performing a Kruskal–Wallis test and a Mann–Whitney U-test. (H) Schematic describing how Orai-mediated Ca2+ entry regulates expression of key genes that control neuronal activity in fpDANs.
-
Figure 8—source data 1
Raw data for imaging quantifications (D, F, G).
- https://cdn.elifesciences.org/articles/88808/elife-88808-fig8-data1-v1.xlsx
Figure 9
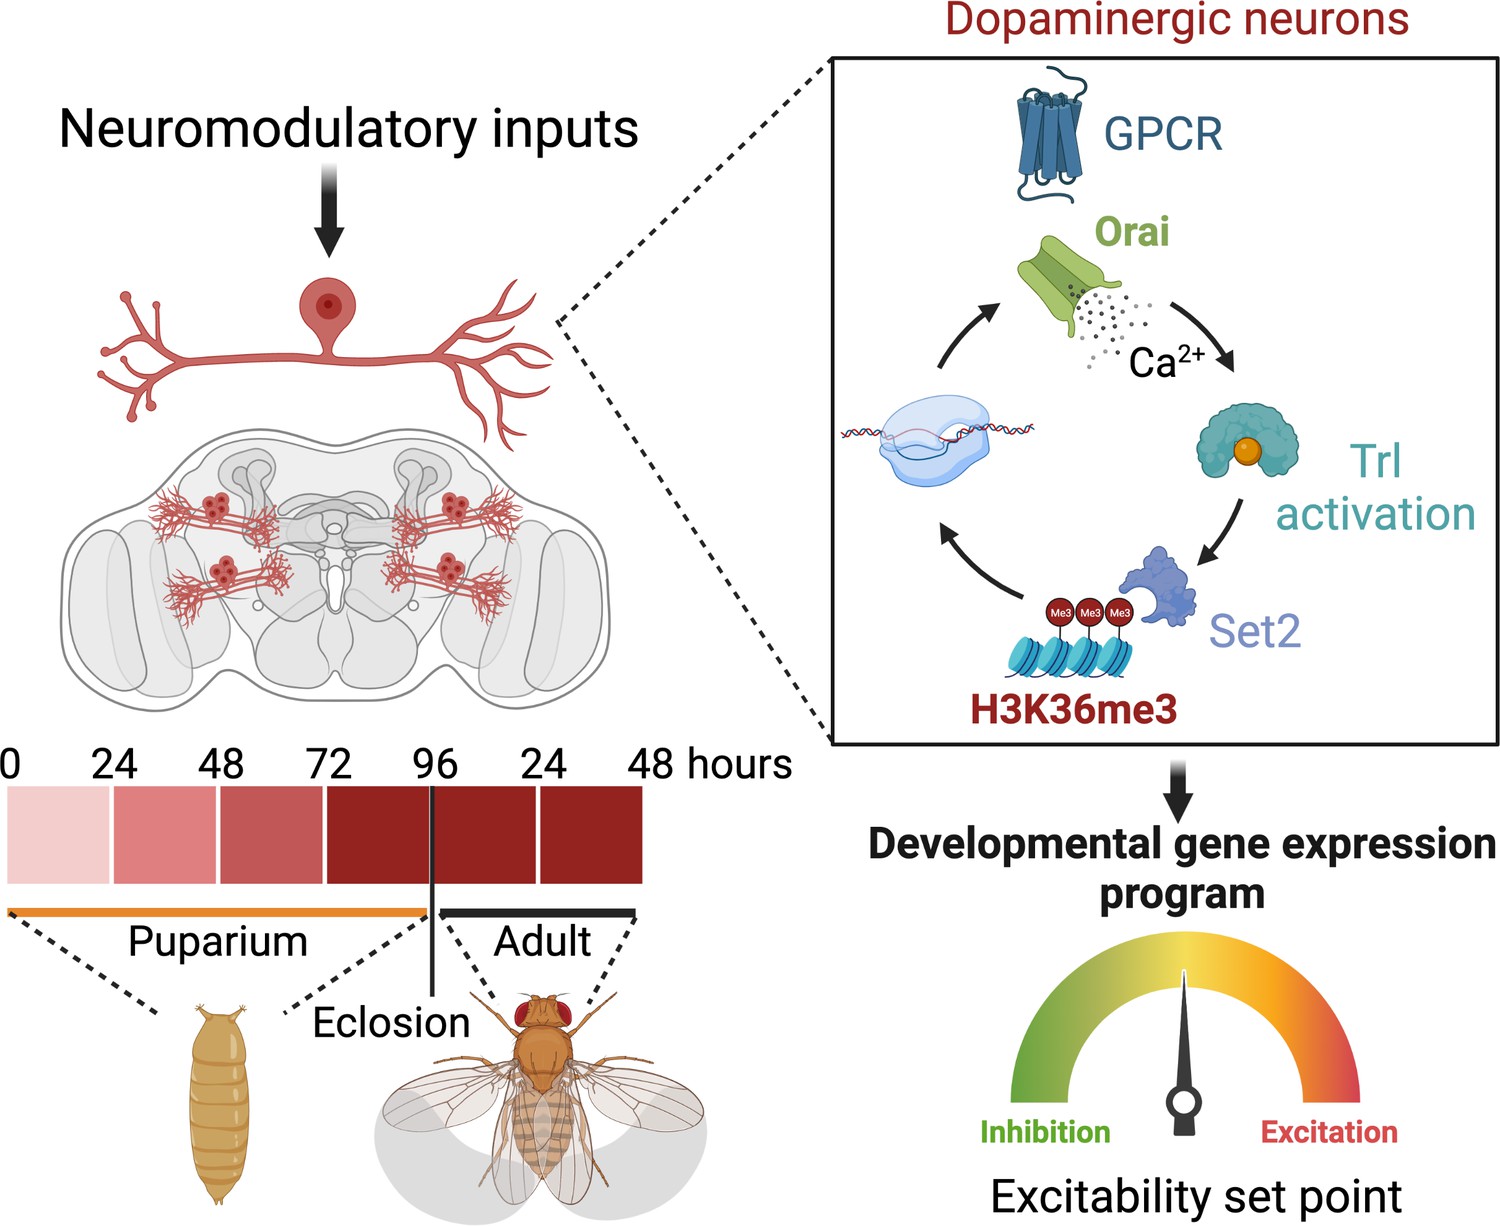
Schematic outline of the role of store-operated Ca2+ entry (SOCE) in determining excitability and function of dopaminergic neurons required for flight circuit development.
SOCE acts through a transcriptional feedback loop including the transcription factor trithorax-like (Trl), and the H3K36 methyltransferase Set2 to induce the expression of genes required for neuronal excitability and flight.
Author response image 1
Additional files
-
Supplementary file 1
List of fly stocks (a), reagents (b), and primer sequences (c) used in this article.
- https://cdn.elifesciences.org/articles/88808/elife-88808-supp1-v1.docx
-
MDAR checklist
- https://cdn.elifesciences.org/articles/88808/elife-88808-mdarchecklist1-v1.pdf
Download links
A two-part list of links to download the article, or parts of the article, in various formats.
Downloads (link to download the article as PDF)
Open citations (links to open the citations from this article in various online reference manager services)
Cite this article (links to download the citations from this article in formats compatible with various reference manager tools)
Orai-mediated calcium entry determines activity of central dopaminergic neurons by regulation of gene expression
eLife 12:RP88808.
https://doi.org/10.7554/eLife.88808.4


