N-cadherin directs the collective Schwann cell migration required for nerve regeneration through Slit2/3-mediated contact inhibition of locomotion
- UCL Laboratory for Molecular Cell Biology and the UCL Cancer Institute, University College London, United Kingdom
Figures
Figure 1 with 2 supplements
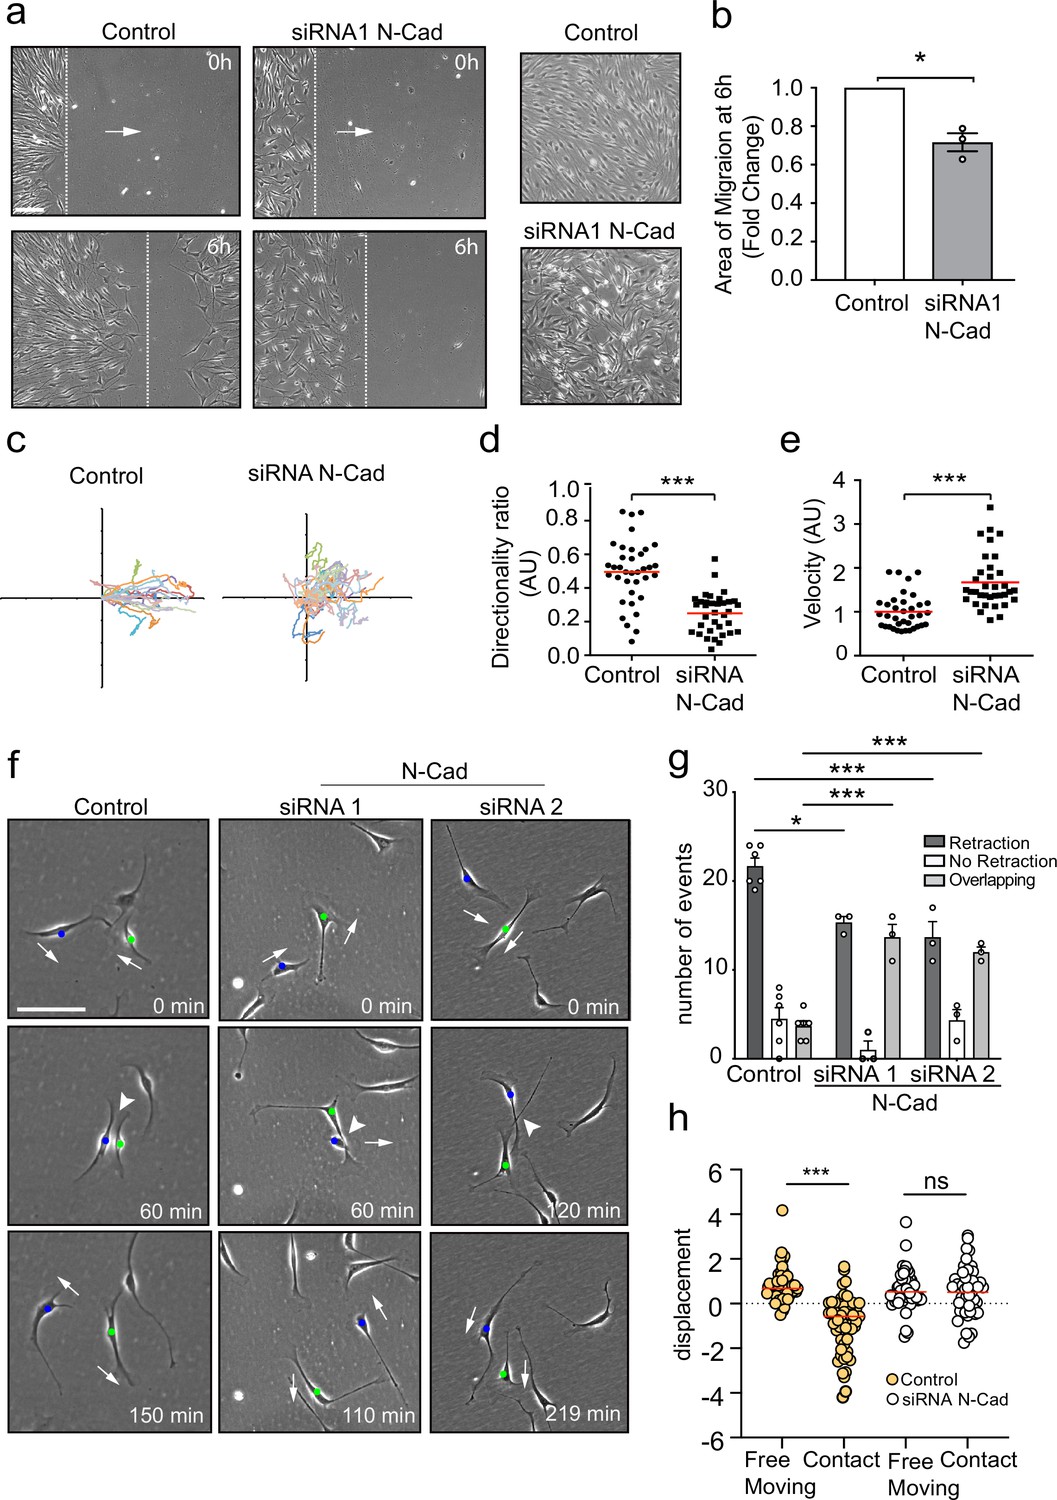
N-cadherin is required for contact inhibition of locomotion between Schwann cells (SCs).
(a) Representative still images comparing the collective migration of siRNA Scrambled Control or N-cadherin (N-Cad) KD SCs in a wound healing assay. The dashed lines indicate the leading edge of migration at 0 hr and 6 hr. Arrows indicate the direction of migration. Zoomed images on the right show control SCs form a monolayer, whereas N-Cad KD SCs exhibit loss of cell:cell recognition with cells growing on top of each other. Scale bar = 100 μm. (b) Quantification of the area of migration of N-Cad knockdown SCs normalised to controls from (a). Data is presented as mean ± SEM and represent three independent experiments. p-values were calculated by using a two-tailed unpaired t-test with Welch’s correction. (c) A representative graph of three independent experiments showing the trajectories of control or N-Cad knockdown cells treated with siRNA1. n = 36 and 35 for control and N-Cad knockdown cells, respectively. (d, e) Quantification of the directionality ratio (d) and the velocity (e) from the cells tracked in (c). The red line indicates the mean. p-values were calculated using unpaired two-tailed t-tests. (f) Representative time-lapse images of a contact inhibition of locomotion (CIL) assay, showing control or N-Cad knockdown cells, treated with siRNA1 or siRNA2 that repulsed or overlapped respectively (Figure 1—video 1). The blue and green dots indicate the two interacting cells. Arrows indicate the direction of migration. Scale bar = 100 μm. (g) Quantification of (f). Data are representative of n = 3 independent experiments and presented as mean ± SEM. p-values were calculated using a two-way ANOVA followed by Sidak’s test for multiple comparisons. *p<0.05, **p<0.01, ***p<0.001. Note that random protrusions and retractions are produced by SCs in all directions that leads to a high number of apparent repulsion events, even when loss of CIL has occurred. (h) siRNA Scrambled cells (orange dots) exhibit a change in direction following contact (n=54) compared to free moving controls (n=58), indicative of CIL. N-cadherin knockdown (white dots) results in loss of CIL, with no difference in the displacement index between free moving (n=53) or contacting (n=53) cells. p-values were calculated using the Wilcoxon rank sum test. ***p<0.001.
-
Figure 1—source data 1
Excel spreadsheet containing data used to generate graphs in Figure 1.
- https://cdn.elifesciences.org/articles/88872/elife-88872-fig1-data1-v2.xlsx
Figure 1—figure supplement 1

N-cadherin is required for contact inhibition of locomotion between Schwann cells (SCs).
(a) Representative western blot from three independent experiments showing N-cadherin (N-Cad) (127 kDa) protein levels in SCs treated with either 2 nM control, siRNA1, or siRNA2 for 48 hr. ERK (44, 42 kDa) was used as a loading control. (b) Representative confocal images of control, siRNA1, or siRNA2 treated cells at 36 hr, immunostained to detect N-Cad (green), F-actin (red), and nuclei are labelled with Hoechst (blue). White arrows indicate the cell contacts. Images are representative of n = 3 experiments. Scale bar = 20 μm. (c) Representative bright-field images of SCs or N-Cad siRNA1 or siRNA2. Note that whereas control SCs form a monolayer, N-Cad siRNA-treated cells grow on top of each other. Images are representative of n = 3 independent experiments. Scale bar = 200 μm.
-
Figure 1—figure supplement 1—source data 1
Original file for the western blot analysis of N-cadherin KD in Figure 1—figure supplement 1a (N-cadherin).
- https://cdn.elifesciences.org/articles/88872/elife-88872-fig1-figsupp1-data1-v2.zip
-
Figure 1—figure supplement 1—source data 2
Labelled file for the western blot analysis of N-cadherin KD in Figure 1—figure supplement 1a (N-cadherin).
- https://cdn.elifesciences.org/articles/88872/elife-88872-fig1-figsupp1-data2-v2.zip
-
Figure 1—figure supplement 1—source data 3
Original file for the western blot analysis of loading control in Figure 1—figure supplement 1a (ERK).
- https://cdn.elifesciences.org/articles/88872/elife-88872-fig1-figsupp1-data3-v2.zip
-
Figure 1—figure supplement 1—source data 4
Labelled file for the western blot analysis of loading control in Figure 1—figure supplement 1a (ERK).
- https://cdn.elifesciences.org/articles/88872/elife-88872-fig1-figsupp1-data4-v2.zip
Figure 1—video 1
N-cadherin mediates contact inhibition of locomotion (CIL).
Related to Figure 1f. Representative time-lapse microscopy of control and N-cadherin (N-Cad) knockdown Schwann cells treated with siRNA1 or siRNA2, which repulsed or overlapped respectively. Cells of interest are indicated with a green and blue dot. Video acquired at 20X magnification.
Figure 2 with 2 supplements
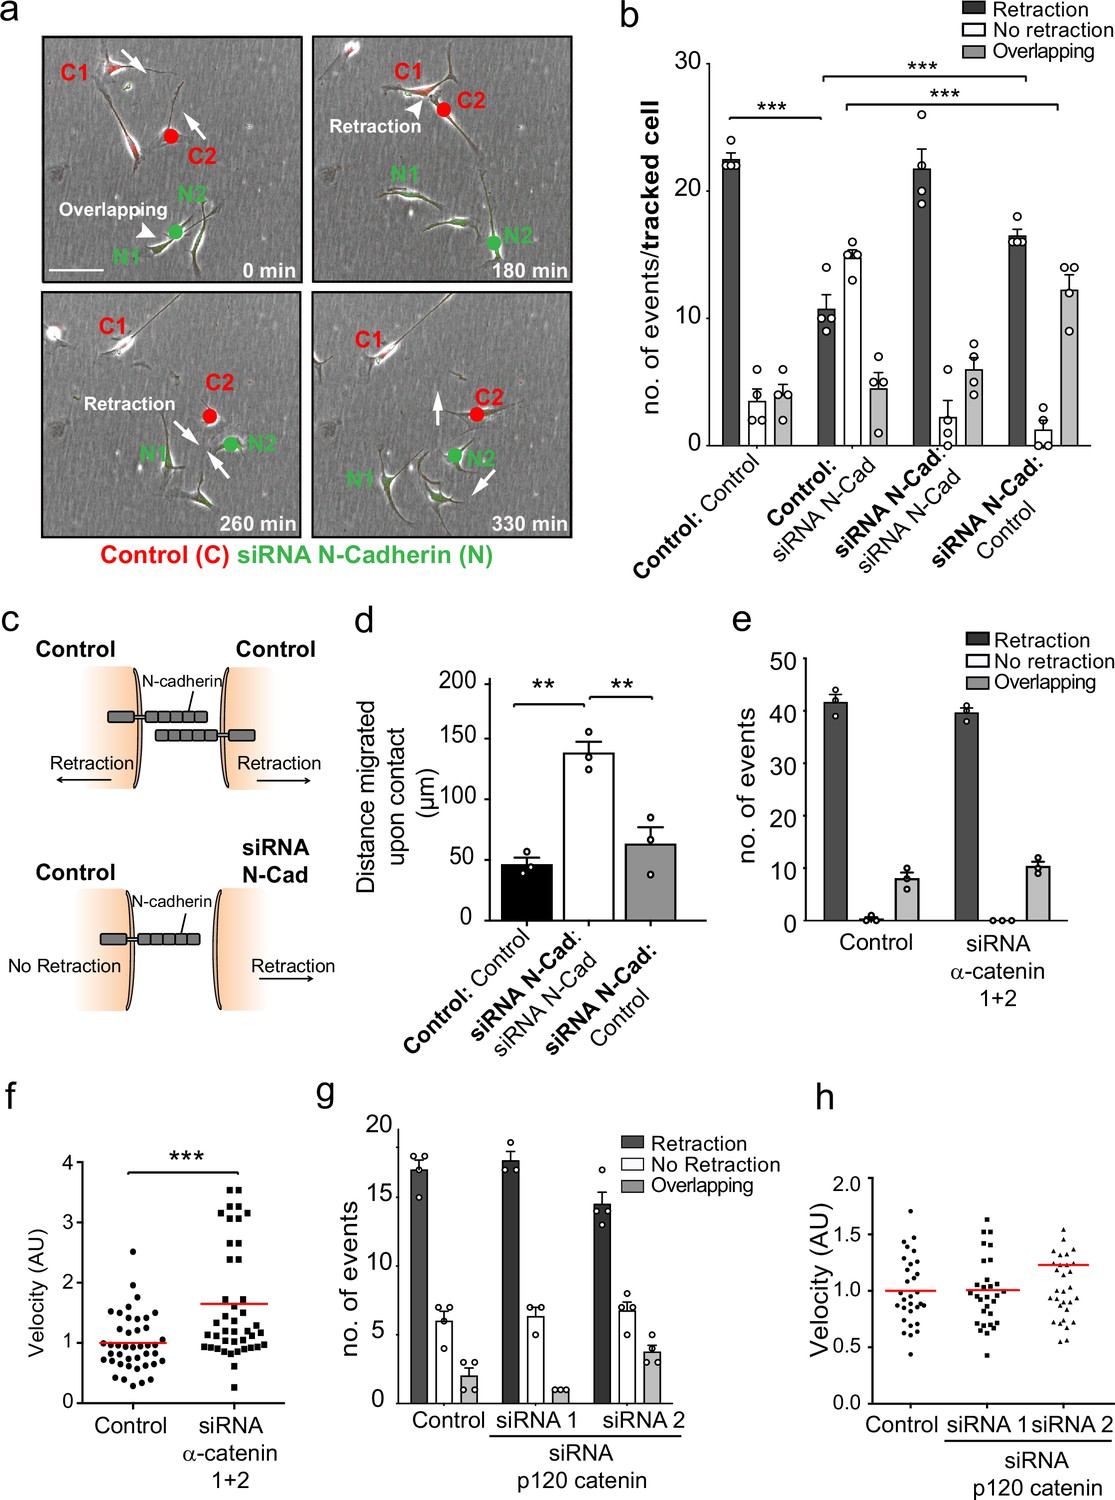
N-cadherin-dependent contact inhibition of locomotion (CIL) is independent of the adherens junction complex.
(a) Representative time-lapse microscopy images of a CIL assay in which red fluorescence-labelled control cells (C1 and C2) were mixed with green fluorescent-labelled N-cadherin (N-Cad) knockdown cells (N1 and N2) (Figure 2—video 1). Cells of interest are indicated with a red or green dot for control and N-Cad knockdown cells, respectively. Arrows indicate the direction of migration. Scale bar = 100 μm. (b) Quantification of (a) n = 3 independent experiments. Graph represents the response of the cell being tracked (in bold) when it encounters the other cell type (not bold). Graph represents mean ± SEM; p-values were calculated using a two-way ANOVA followed by Sidak’s test for multiple comparisons. (c) Schematic illustrating the mixing experiment in (a, b). When an siRNA scrambled control encounters another control cell, both cells express N-Cad and are repulsed away from each other. When a control cell makes contact with a N-Cad knockdown cell, only the control cell expressing N-Cad is capable of enacting a repulsive signal. (d) Quantification of the collective migration assay shown in Figure 2—figure supplement 1a, showing the distance migrated upon contact of control, N-Cad knockdown, or control and N-Cad knockdown cells following release from dual-chamber inserts. Data is presented as mean ± SEM and represents n = 3 independent experiments. p-values were calculated using a one-way ANOVA followed by Tukey’s test for multiple comparisons. (e) Quantification of CIL in control and α-catenin knockdown cells. Data is presented as mean ± SEM from three independent experiments. p-values were calculated using a one-way ANOVA followed by Tukey’s multiple comparisons test. (f) Quantification of the velocity of control and α-catenin knockdown cells. Red line indicates mean of n = 3 independent experiments. p-values were calculated by a two-tailed unpaired t-test. (g) Graph shows the quantification of CIL from n = 3 independent experiments. Data is presented as mean ± SEM. p-values were calculated using a one-way ANOVA followed by Tukey’s multiple comparisons test. (h) Velocity of the tracks from control-treated cells (dots) and p120-catenin knockdown cells treated with siRNA1 (squares) or siRNA2 (triangles). Red lines indicate the mean of n = 3 independent experiments. p-values were calculated using a one-way ANOVA followed by Dunnett’s post-test. *p<0.05, **p<0.01, ***p<0.001.
-
Figure 2—source data 1
Excel spreadsheet containing data used to generate graphs in Figure 2.
- https://cdn.elifesciences.org/articles/88872/elife-88872-fig2-data1-v2.xlsx
Figure 2—figure supplement 1
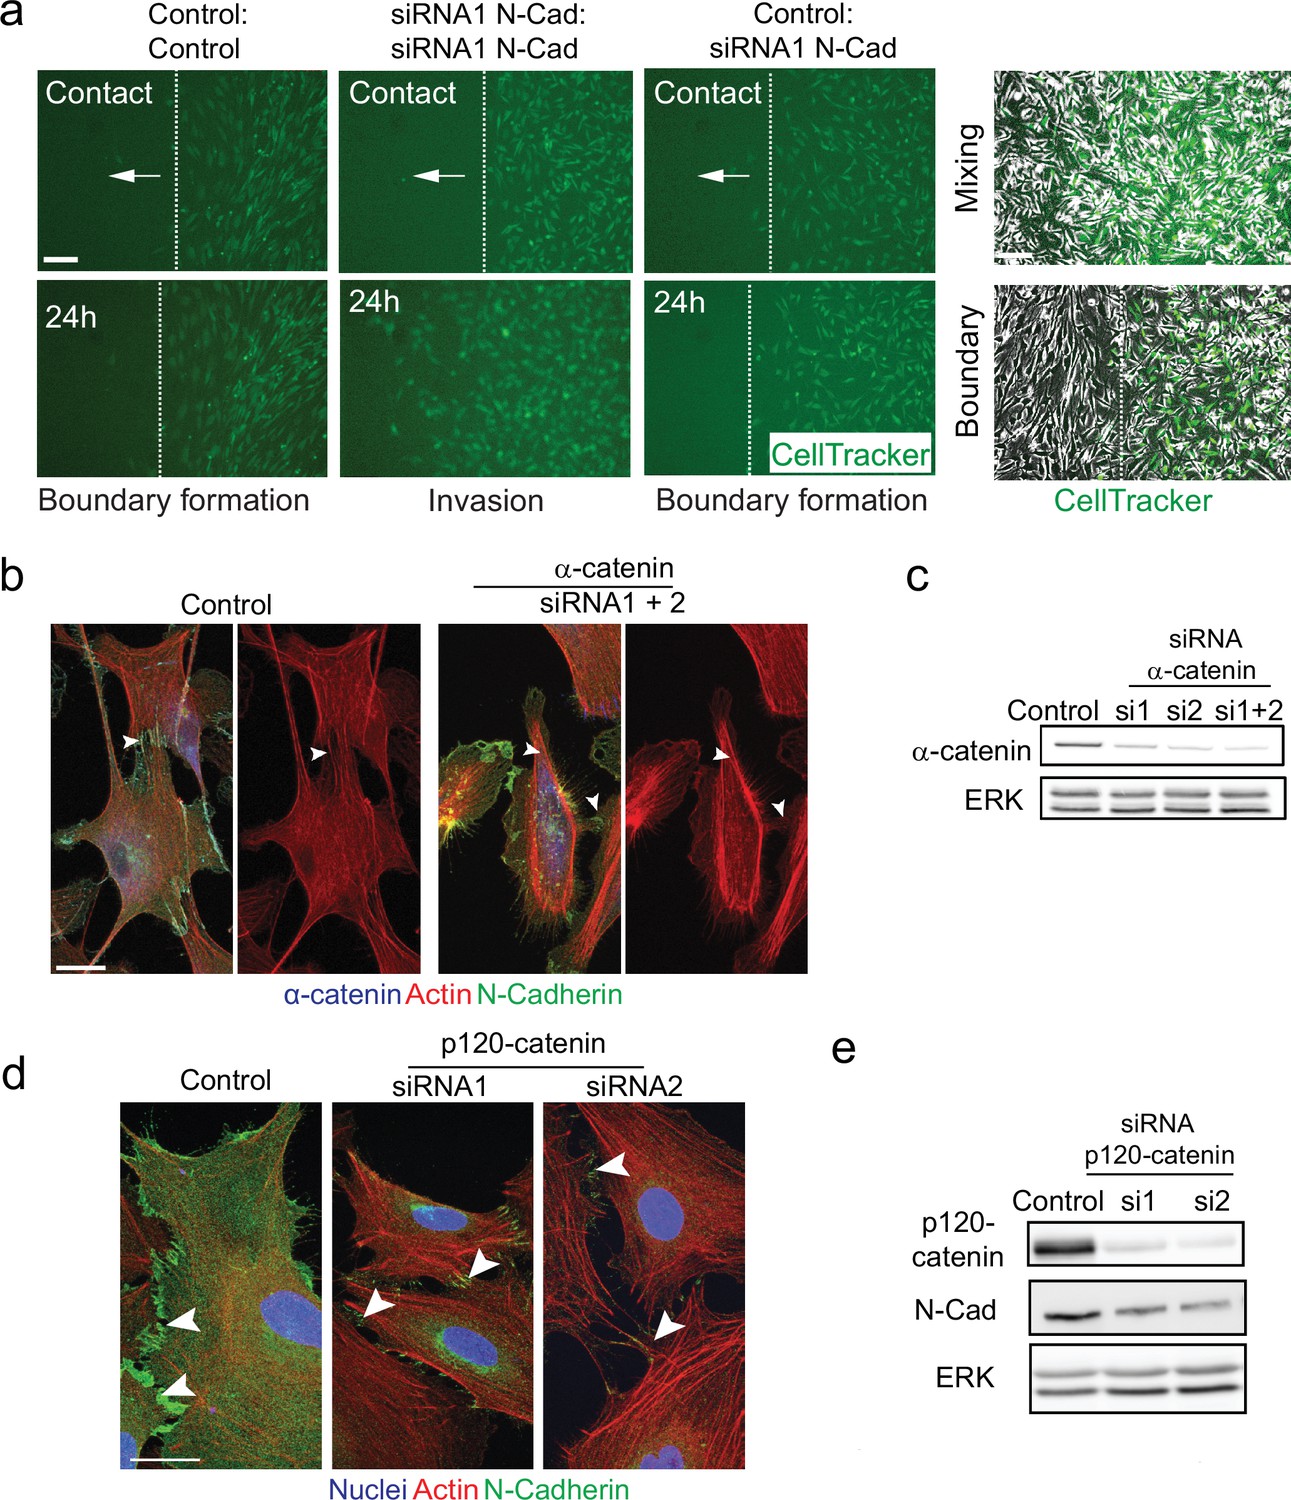
N-cadherin-dependent contact inhibition of locomotion (CIL) is independent of the adherens junction complex.
(a) Representative images from time-lapse microscopy showing the collective migration of control, N-cadherin (N-Cad) knockdown, or control and N-Cad knockdown Schwann cells (SCs) upon contact and at 24 hr following the removal of inserts in a dual-chamber assay in which SCs on the right are labelled with CellTracker (green). Dashed lines in the upper panels indicate the initial contact of the migrating cells, and in the lower panel indicate the leading edge of migrating cells at 24 hr. Arrows indicate the direction of migration. Images on the right show phase-contrast images showing mixing (upper) or boundary (lower) formation upon cell contact. (b) Representative confocal images of control-treated and α-catenin knockdown cells at 36 hr, immunostained to detect α-catenin (blue), N-Cad (green), and co-stained for F-actin (red). Note that N-Cad is still localised at the junctions following α-catenin knockdown (arrowheads) but actin is no longer polarised at these junctions. Scale bars = 20 μm. (c) Representative western blots showing the efficiency of (c) α-catenin (100 kDa) or (e) p120-catenin (120 kDa) knockdown using two independent siRNAs compared to control at 36 hr for α-catenin and at 96 hr for p120-catenin. ERK (44, 42 kDa) was used as a loading control. (d) Representative confocal images of control or p120-catenin knockdown cells at 96 hr, immunostained for N-Cad (green), and co-stained for F-actin (red) and nuclei (blue). Arrowheads indicate N-Cad-positive cell contacts. Scale bar = 20 μm. All data are representative of n = 3 independent experiments.
-
Figure 2—figure supplement 1—source data 1
Original file for the western blot analysis of α-catenin KD in Figure 2—figure supplement 1c (α-catenin).
- https://cdn.elifesciences.org/articles/88872/elife-88872-fig2-figsupp1-data1-v2.zip
-
Figure 2—figure supplement 1—source data 2
Labelled file for the western blot analysis of α-catenin KD in Figure 2—figure supplement 1c (α-catenin).
- https://cdn.elifesciences.org/articles/88872/elife-88872-fig2-figsupp1-data2-v2.zip
-
Figure 2—figure supplement 1—source data 3
Original file for the western blot analysis of loading control in Figure 2—figure supplement 1c (ERK).
- https://cdn.elifesciences.org/articles/88872/elife-88872-fig2-figsupp1-data3-v2.zip
-
Figure 2—figure supplement 1—source data 4
Labelled file for the western blot analysis of loading control in Figure 2—figure supplement 1c (ERK).
- https://cdn.elifesciences.org/articles/88872/elife-88872-fig2-figsupp1-data4-v2.zip
-
Figure 2—figure supplement 1—source data 5
Original file for the western blot analysis of p120 catenin KD in Figure 2—figure supplement 1e (p120 catenin).
- https://cdn.elifesciences.org/articles/88872/elife-88872-fig2-figsupp1-data5-v2.zip
-
Figure 2—figure supplement 1—source data 6
Labelled file for the western blot analysis of p120 catenin KD in Figure 2—figure supplement 1e (p120 catenin).
- https://cdn.elifesciences.org/articles/88872/elife-88872-fig2-figsupp1-data6-v2.zip
-
Figure 2—figure supplement 1—source data 7
Original file for the western blot analysis of N-cadherin in Figure 2—figure supplement 1 (N-cadherin).
- https://cdn.elifesciences.org/articles/88872/elife-88872-fig2-figsupp1-data7-v2.zip
-
Figure 2—figure supplement 1—source data 8
Labelled file for the western blot analysis of N-cadherin in Figure 2—figure supplement 1e (N-cadherin).
- https://cdn.elifesciences.org/articles/88872/elife-88872-fig2-figsupp1-data8-v2.zip
-
Figure 2—figure supplement 1—source data 9
Original file for the western blot analysis of loading control in Figure 2—figure supplement 1e (ERK).
- https://cdn.elifesciences.org/articles/88872/elife-88872-fig2-figsupp1-data9-v2.zip
-
Figure 2—figure supplement 1—source data 10
Labelled file for the western blot analysis of loading control in Figure 2—figure supplement 1e (ERK).
- https://cdn.elifesciences.org/articles/88872/elife-88872-fig2-figsupp1-data10-v2.zip
Figure 2—video 1
Contact inhibition of locomotion (CIL) is independent of trans-homodimerisation.
Related to Figure 2a. Representative time-lapse microscopy of a CIL assay in which red-labelled control cells were mixed with green-labelled N-cadherin (N-Cad) knockdown cells. Cells of interest are indicated with a red or green dot for control and N-Cad knockdown cells, respectively. Video acquired at 20X magnification.
Figure 3 with 2 supplements
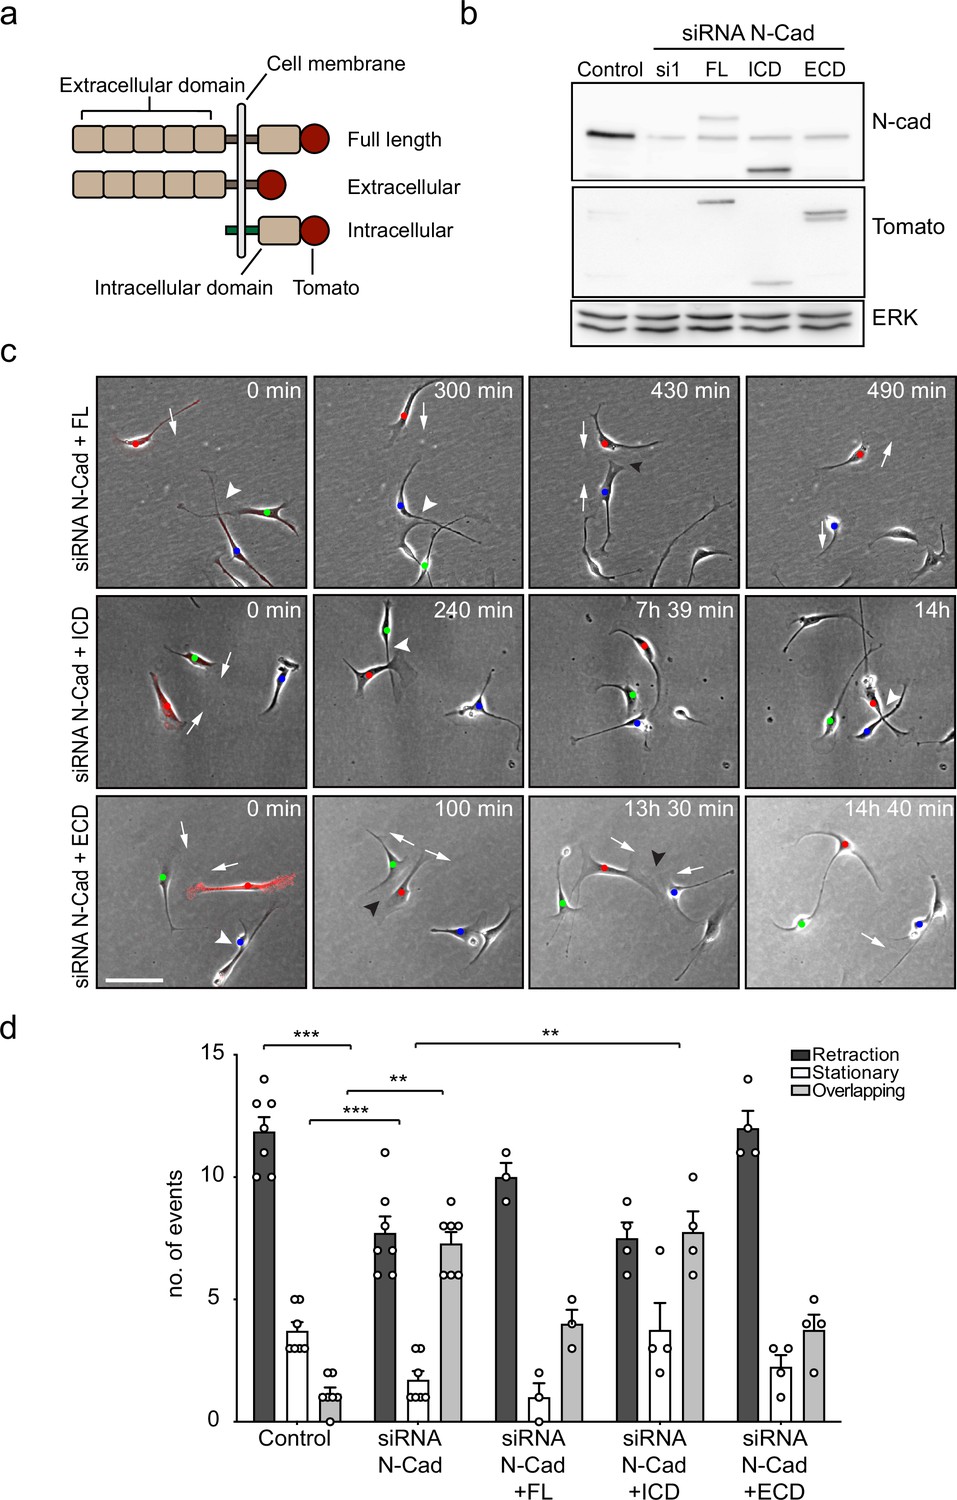
The extracellular domain of N-cadherin is sufficient to mediate contact inhibition of locomotion (CIL).
(a) Schematic of N-cadherin (N-Cad) full-length, extracellular, and intracellular domains tagged with tomato at the C-terminus. The intracellular domain of N-Cad has an additional Lyn membrane-targeting sequence at the N-terminus to target it to the membrane. (b) Representative western blot using antibodies that recognise the C-terminus of N-Cad (127 kDa) and tomato (43 kDa), showing the expression levels of the constructs, 48 hr after knockdown of endogenous N-Cad using siRNA1. ERK (44, 42 kDa) was used a loading control. (c) Representative time-lapse microscopy images from a CIL assay of N-Cad knockdown cells transfected with siRNA-resistant full-length, intracellular domain (siRNA1+ICD) or the extracellular domain (siRNA1+ECD) of N-Cad tagged with tomato. Arrows indicate the direction of migration. Black arrowheads indicate repulsion events (siRNA1+full length and ECD). White arrowheads indicate overlapping events (siRNA1+Full length, ICD and ECD) (Figure 3—video 1). Cells of interest that are interacting are indicated by blue, red, and green dots. Scale bar = 100 μm. (d) Quantification of (c) full length (n = 3), the ECD and ICD of N-Cad (n = 4), and control and siRNA1 to N-Cad (n = 7). Graph shows the mean ± SEM. p-values were calculated using a two-way ANOVA followed by Sidak’s test for multiple comparisons, **p<0.01, ***p<0.001.
-
Figure 3—source data 1
Original file for the western blot analysis of N-cadherin KD in Figure 3b (N-cadherin).
- https://cdn.elifesciences.org/articles/88872/elife-88872-fig3-data1-v2.xlsx
-
Figure 3—source data 2
Labelled file for the western blot analysis of N-cadherin KD in Figure 3b (N-cadherin).
- https://cdn.elifesciences.org/articles/88872/elife-88872-fig3-data2-v2.zip
-
Figure 3—source data 3
Original file for the western blot analysis showing the expression levels of the constructs in Figure 3b (tomato).
- https://cdn.elifesciences.org/articles/88872/elife-88872-fig3-data3-v2.zip
-
Figure 3—source data 4
Labelled file for the western blot analysis showing the expression levels of the constructs in Figure 3b (tomato).
- https://cdn.elifesciences.org/articles/88872/elife-88872-fig3-data4-v2.zip
-
Figure 3—source data 5
Original file for the western blot analysis of loading control in Figure 3b (ERK).
- https://cdn.elifesciences.org/articles/88872/elife-88872-fig3-data5-v2.zip
-
Figure 3—source data 6
Labelled file for the western blot analysis loading control in Figure 3b (ERK).
- https://cdn.elifesciences.org/articles/88872/elife-88872-fig3-data6-v2.zip
-
Figure 3—source data 7
Excel spreadsheet containing data used to generate graphs in Figure 3.
- https://cdn.elifesciences.org/articles/88872/elife-88872-fig3-data7-v2.xlsx
Figure 3—figure supplement 1
The extracellular domain of N-cadherin is sufficient to mediate contact inhibition of locomotion (CIL).
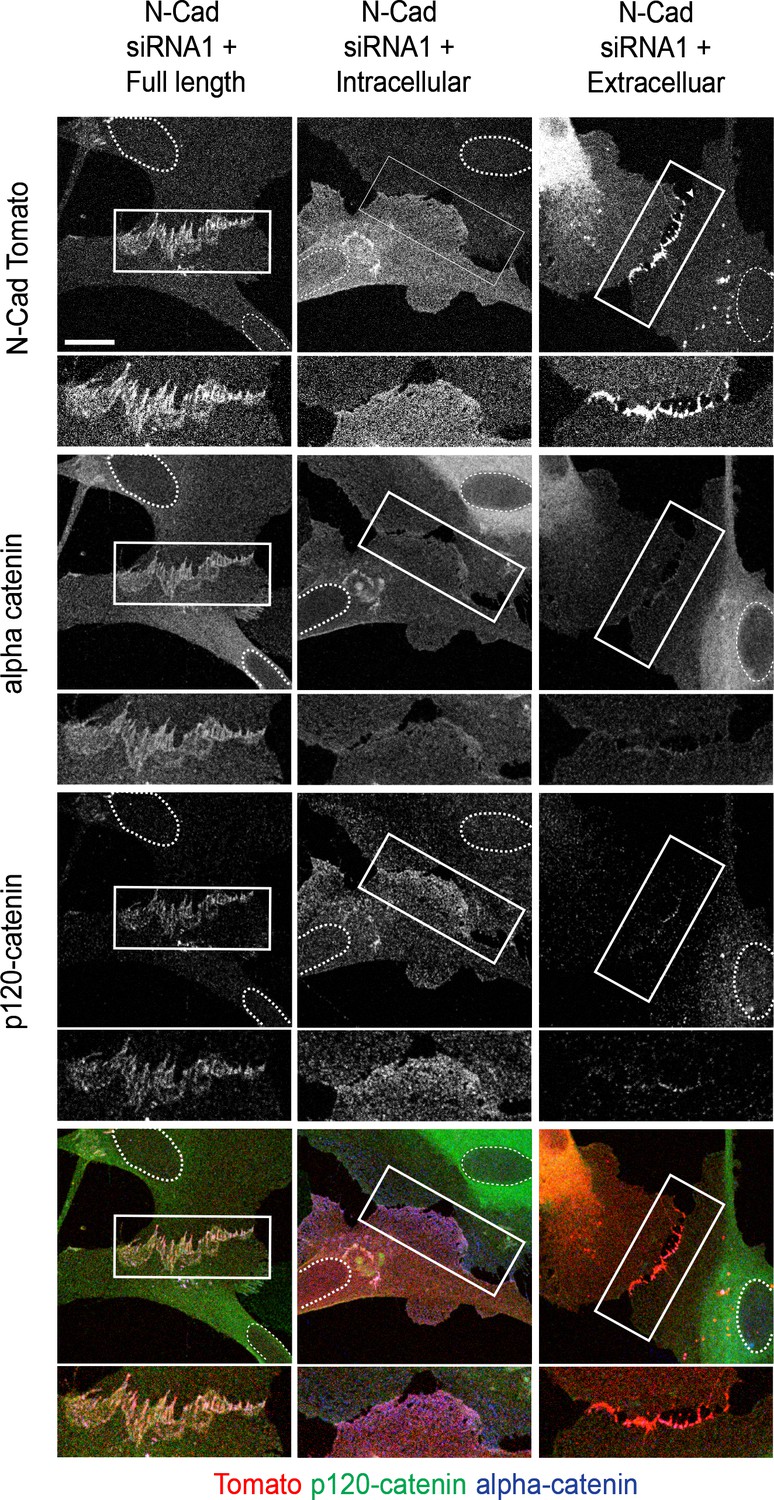
Representative confocal images of N-cadherin (N-cad) knockdown cells overexpressing siRNA-resistant, tomato-tagged N-Cad full length (left panel), the intracellular domain (middle panel), or the extracellular domain of N-Cad (right panel) (red), immunolabelled to detect p120-catenin (green) or α-catenin (blue). Enlarged images show cell-contact points indicated by white rectangles. Images are representative of n = 3 independent experiments. Scale bar = 20 μm.
Figure 3—video 1
The extracellular domain is sufficient to mediate contact inhibition of locomotion (CIL).
Related to Figure 3c. A video compilation of representative time-lapse microscopy from a CIL assay of N-cadherin (N-Cad) knockdown cells transfected with the full length of N-Cad (siRNA1+FL), the intracellular domain of N-Cad (siRNA1+ICD), or the extracellular domain of N-Cad (siRNA1+ECD) tagged with tomato. Cells of interest that are interacting are indicated by blue, red, and green dots. Videos were aquired at 20X.
Figure 4 with 3 supplements
Glypican-4 and Slit2/Slit3 are required for contact inhibition of locomotion (CIL).
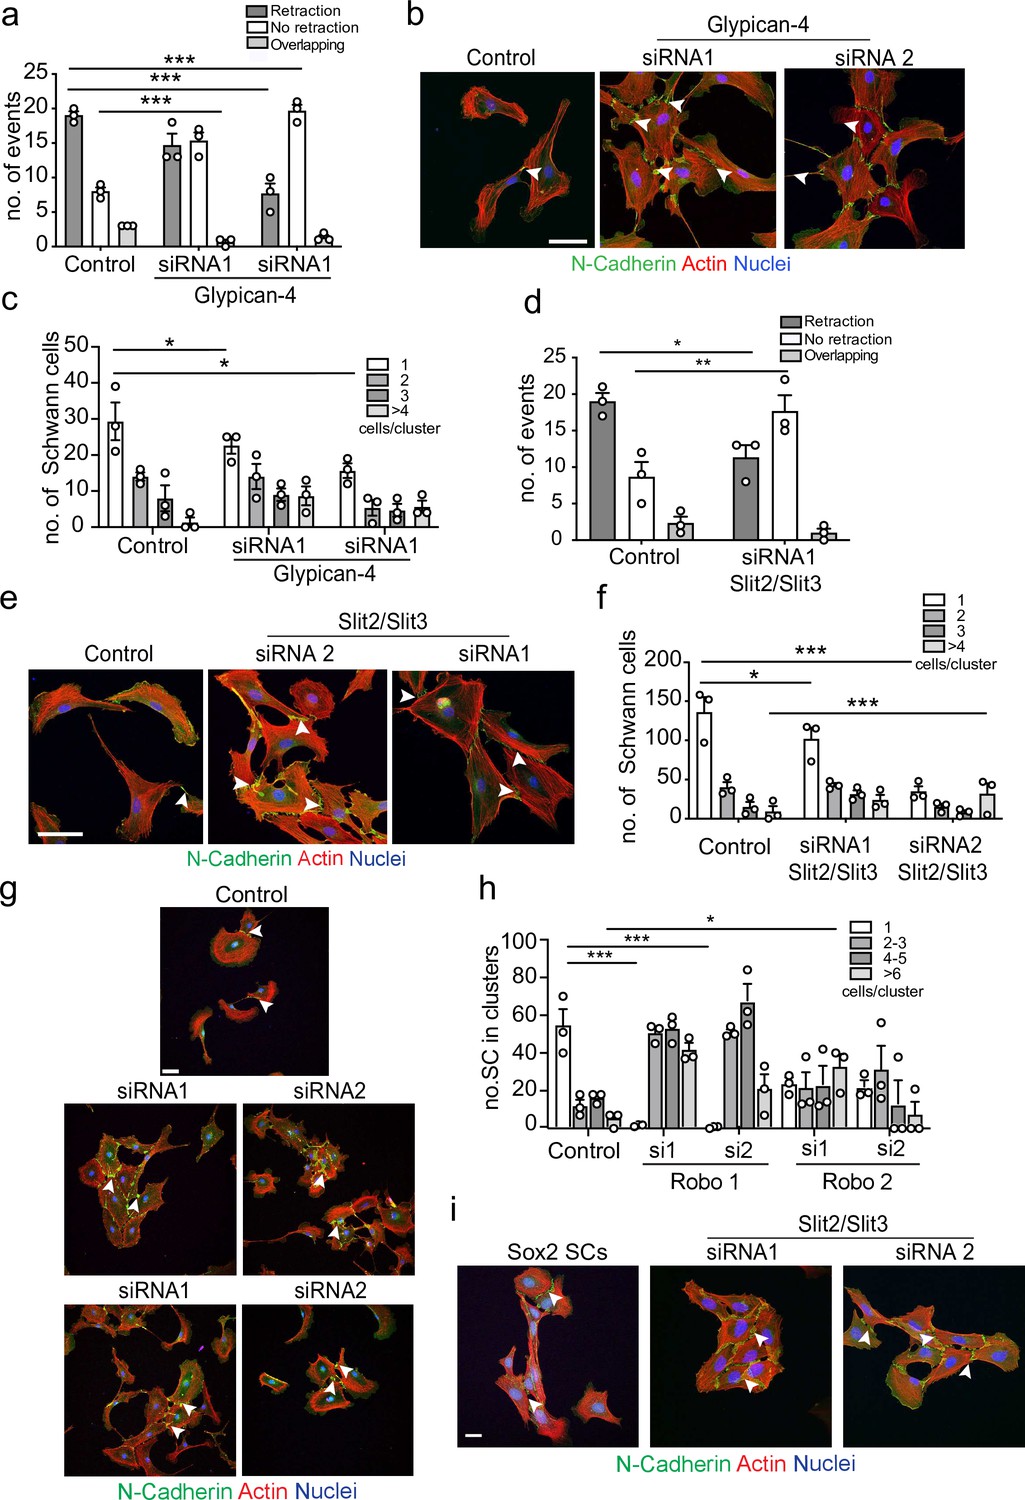
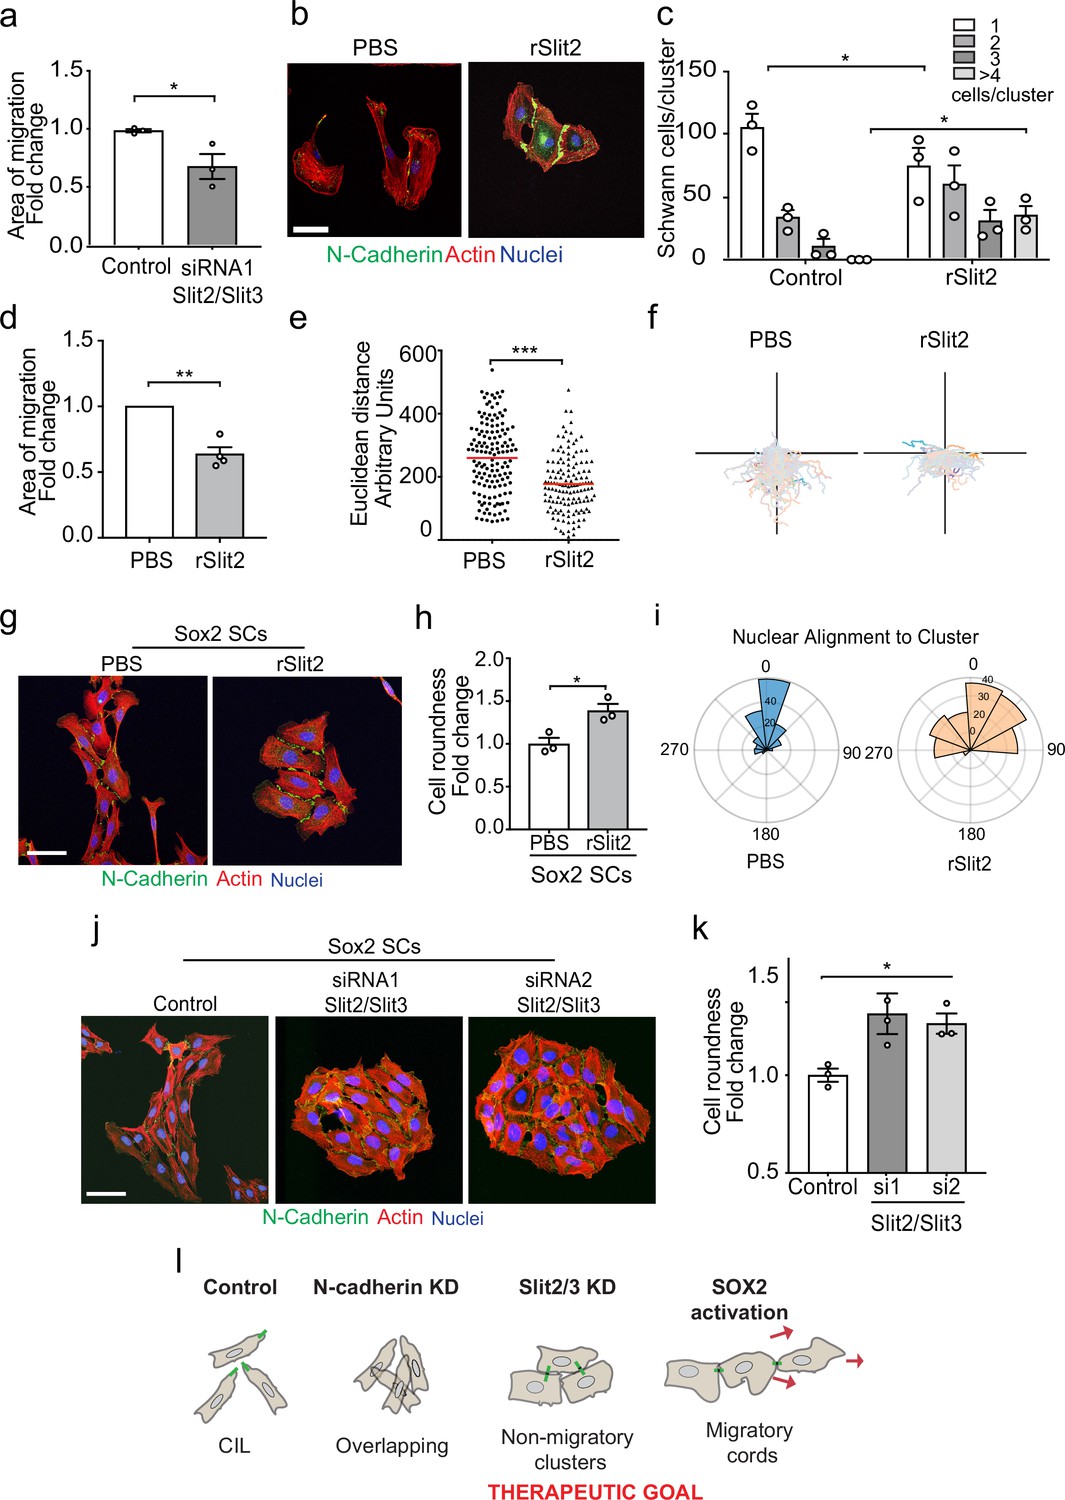
(a) Quantification of a CIL assay, showing control or Glypican-4 knockdown cells, treated with siRNA1 or siRNA2, that are repulsed or not repulsed upon contact respectively (Figure 4—video 1). Data represents n = 3 independent experiments and mean ± SEM. p-values were calculated using a two-way ANOVA followed by Sidak’s multiple comparisons test. (b) Representative confocal images showing control or Glypican-4 knockdown cells stained with phalloidin (red) and immunolabelled to detect N-cadherin (N-Cad) (green). Scale bar = 50 μM. Arrowheads indicate N-cadherin junctions. (c) Quantification of cluster formation in control or Glypican-4 knockdown Schwann cells (SCs) at 72 hr post-knockdown. Data represents n = 3 independent experiments and shows mean ± SEM. p-values were calculated using a two-way ANOVA followed by the appropriate post-test. (d) Quantification of CIL in control or Slit2/Slit3 knockdown cells treated with siRNA1 (n = 3, mean ± SEM) (Figure 4—video 2). p-values were calculated using a two-way ANOVA followed by Tukey’s post-test for multiple comparisons. (e) Representative immunofluorescence images of control and Slit2/Slit3 knockdown SCs stained with phalloidin (red) and N-Cad (green). Scale bar = 50 μM. Arrowheads indicate N-cadherin junctions. (f) Quantification of SCs in clusters in control or Slit2/Slit3 knockdown cells (n = 3, mean ± SEM). p-values were calculated using a two-way ANOVA followed by Tukey’s test for multiple comparisons. (g) Representative confocal images showing control, Robo1, or Robo2 knockdown cells stained with phalloidin (red) and immunolabelled to detect N-cadherin (N-Cad) (green). Scale bar = 50 μm. Arrowheads indicate N-cadherin junctions (h) Quantification of the percentage of SCs in clusters following control or Robo1 or Robo2 knockdown (n = 3, mean ± SEM). p-values were calculated using a two-way ANOVA followed by Tukey’s test for multiple comparisons. (i) Representative confocal images from n = 3 independent experiments of Sox2 overexpressing SCs compared to Slit2/Slit3 knockdown SCs stained with phalloidin to detect F-actin (red), antibodies to detect N-Cad (green), and Hoechst to detect nuclei (blue). Scale bar = 50 μm. *p<0.05, **p<0.01, ***p<0.001.
-
Figure 4—source data 1
Excel spreadsheet containing data used to generate graphs in Figure 4.
- https://cdn.elifesciences.org/articles/88872/elife-88872-fig4-data1-v2.xlsx
Figure 4—figure supplement 1
Glypican-4 and Slit2/Slit3 are required for contact inhibition of locomotion (CIL).
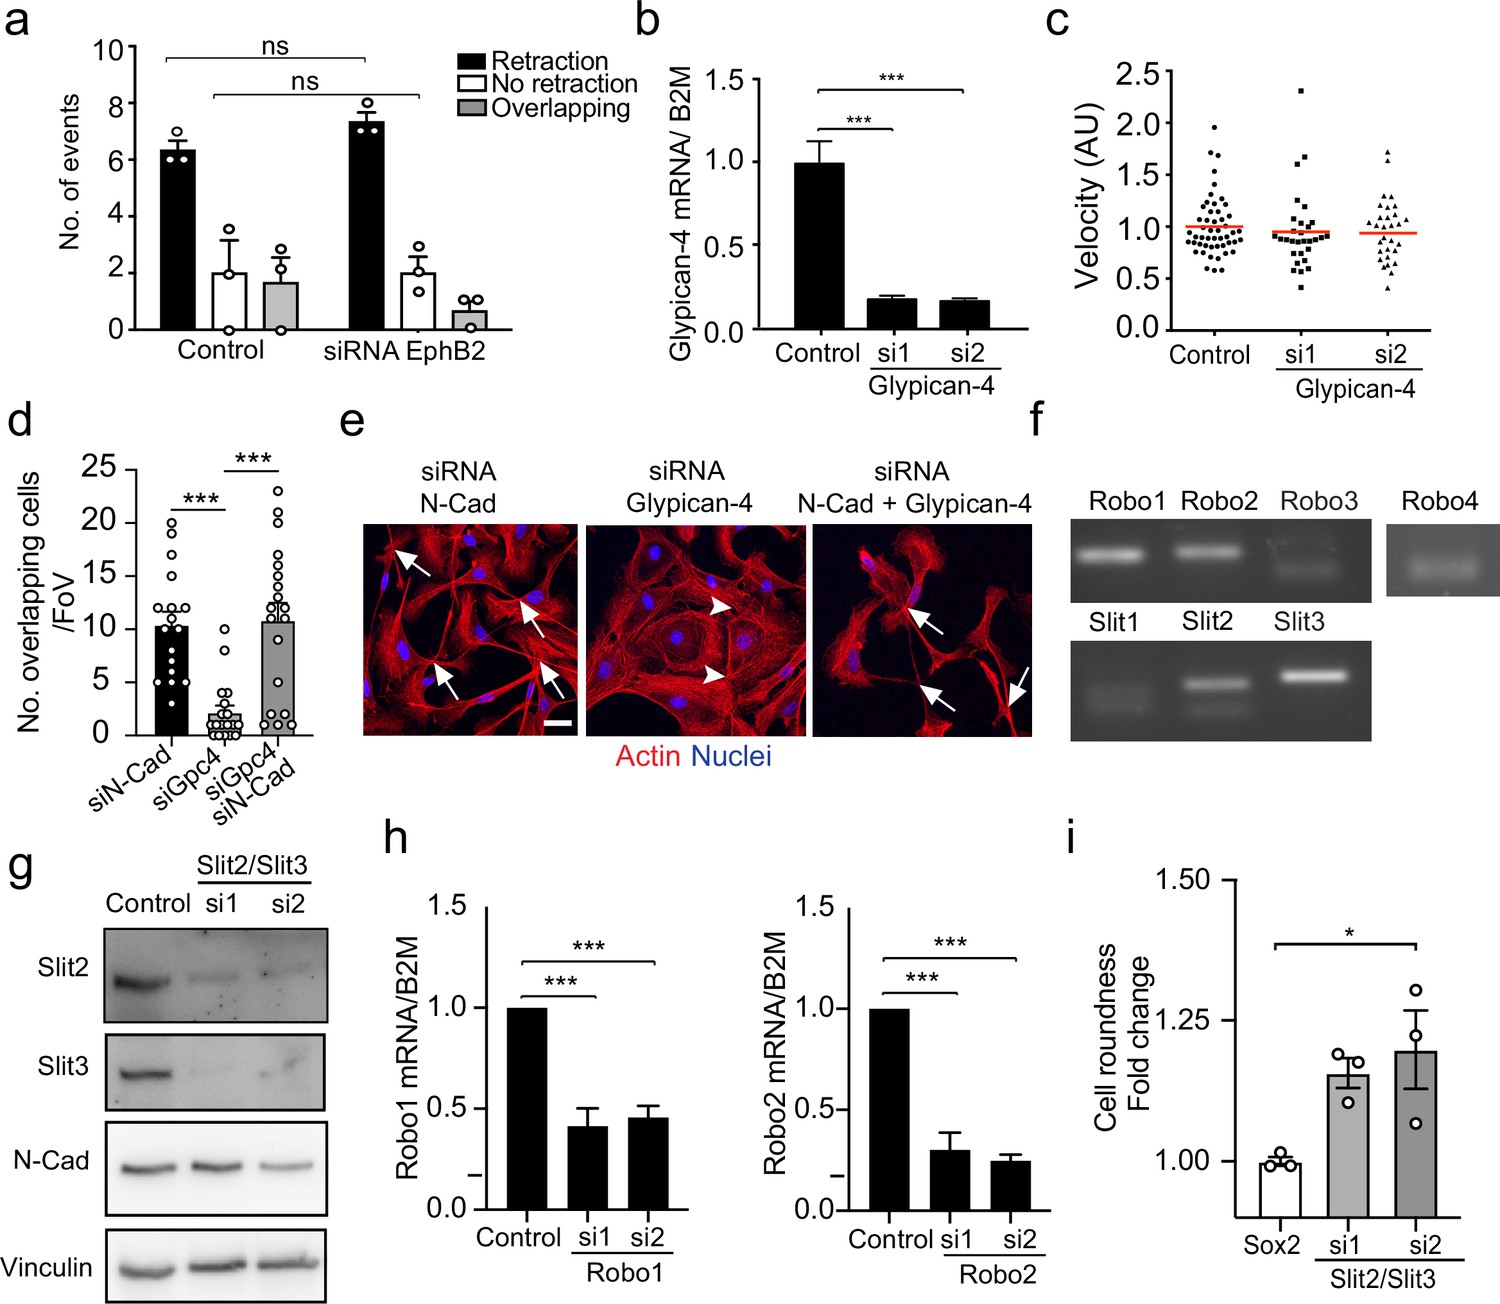
(a) Quantification of CIL in control or EphB2 knockdown Schwann cells (SCs) (n = 3, mean ± SEM). p-values were calculated using a two-way ANOVA followed by Sidak’s test for multiple comparisons. (b) Graph shows Glypican-4 mRNA levels detected by RT-qPCR of control or Glypican-4 knockdown SCs at 36 r (n = 3, mean ± SEM). p-values were calculated using a one-way ANOVA followed by multiple comparisons test. (c) Quantification of the velocity of individual cells in Figure 4a, red line shows the mean, n = 30 cells/ group from n = 3 independent experiments. p-values were calculated using a one-way ANOVA followed by multiple comparisons test. (d) Quantification of number of overlapping cells per field of view in N-cadherin (N-cad), Glypican-4, or N-cad+Glypican-4 knockdown cells (n = 3, mean ± SEM). p-values were calculated using one-way ANOVA followed by multiple comparisons test. (e) Representative confocal images from (d). Arrowheads indicate junctions, arrows indicate overlapping cells. Scale bar = 10 μm. (f) Representative gel showing the expression of the different Slit ligand and Robo receptors in SCs as detected by RT-qPCR (n = 3). (g) Representative western blots of control and Slit2/Slit3 (200 kDa) knockdown cells from n = 3 independent experiments, showing the knockdown efficiency and N-cadherin (127 kDa) expression levels. Vinculin (117 kDa) was used as a loading control. (h) Graph shows Robo1 and Robo2 mRNA levels detected by RT-qPCR of control or Robo1 and Robo2 knockdown SCs at 36 hr (n = 3, mean ± SEM). p-values were calculated using a one-way ANOVA followed by multiple comparisons test. (i) Quantification of cell roundness in SCs overexpressing Sox2 compared to Slit2/Slit3 KD in control SC normalised to Sox2 SCs. Data is presented as mean ± SEM from n = 3 independent experiments. p-values were calculated using a one-way ANOVA followed by Sidak’s test for multiple comparisons. *p<0.05; ***p<0.001.
-
Figure 4—figure supplement 1—source data 1
Original gel for analysis of Robo1-3 expression in SCs in Figure 4—figure supplement 1f.
- https://cdn.elifesciences.org/articles/88872/elife-88872-fig4-figsupp1-data1-v2.xlsx
-
Figure 4—figure supplement 1—source data 2
Labelled gel for analysis of Robo1-3 expression in SCs in Figure 4—figure supplement 1f.
- https://cdn.elifesciences.org/articles/88872/elife-88872-fig4-figsupp1-data2-v2.zip
-
Figure 4—figure supplement 1—source data 3
Original gel for analysis of Robo 4 expression in SCs in Figure 4—figure supplement 1.
- https://cdn.elifesciences.org/articles/88872/elife-88872-fig4-figsupp1-data3-v2.zip
-
Figure 4—figure supplement 1—source data 4
Labelled gel for analysis of Robo 4 expression in SCs in Figure 4—figure supplement 1f.
- https://cdn.elifesciences.org/articles/88872/elife-88872-fig4-figsupp1-data4-v2.zip
-
Figure 4—figure supplement 1—source data 5
Original file for the western blot analysis of Slit2/3 KD in Figure 4—figure supplement 1g (Slit2).
- https://cdn.elifesciences.org/articles/88872/elife-88872-fig4-figsupp1-data5-v2.zip
-
Figure 4—figure supplement 1—source data 6
Labelled file for the western blot analysis of Slit2/3 KD in Figure 4—figure supplement 1g (Slit2).
- https://cdn.elifesciences.org/articles/88872/elife-88872-fig4-figsupp1-data6-v2.zip
-
Figure 4—figure supplement 1—source data 7
Original file for the western blot analysis of Slit2/3 KD in Figure 4—figure supplement 1g (Slit3).
- https://cdn.elifesciences.org/articles/88872/elife-88872-fig4-figsupp1-data7-v2.zip
-
Figure 4—figure supplement 1—source data 8
Labelled file for the western blot analysis of Slit2/3 KD in Figure 4—figure supplement 1g (Slit3).
- https://cdn.elifesciences.org/articles/88872/elife-88872-fig4-figsupp1-data8-v2.zip
-
Figure 4—figure supplement 1—source data 9
Original file for the western blot analysis of Slit2/3 KD in Figure 4—figure supplement 1 (N-cadherin).
- https://cdn.elifesciences.org/articles/88872/elife-88872-fig4-figsupp1-data9-v2.zip
-
Figure 4—figure supplement 1—source data 10
Labelled file for the western blot analysis of Slit2/3 KD in Figure 4—figure supplement 1g (N-cadherin).
- https://cdn.elifesciences.org/articles/88872/elife-88872-fig4-figsupp1-data10-v2.zip
-
Figure 4—figure supplement 1—source data 11
Original file for the western blot analysis of loading control in Figure 4—figure supplement 1g (Vinculin).
- https://cdn.elifesciences.org/articles/88872/elife-88872-fig4-figsupp1-data11-v2.zip
-
Figure 4—figure supplement 1—source data 12
Labelled file for the western blot analysis of loading control in Figure 4—figure supplement 1g (Vinculin).
- https://cdn.elifesciences.org/articles/88872/elife-88872-fig4-figsupp1-data12-v2.zip
-
Figure 4—figure supplement 1—source data 13
Excel spreadsheet containing data used to generate graphs in Figure 4—figure supplement 1.
- https://cdn.elifesciences.org/articles/88872/elife-88872-fig4-figsupp1-data13-v2.xlsx
Figure 4—video 1
Glypican-4 is required for contact inhibition of locomotion (CIL) between Schwann cells.
Related to Figure 4a. Representative time-lapse microscopy of a CIL assay, showing control or Glypican-4 knockdown cells, treated with siRNA1 (si1) or siRNA2 (si2), that are repulsed or not repulsed upon contact, respectively. The green and blue dots indicate the interacting cells. Video acquired at 20X magnification.
Figure 4—video 2
Slit2/3 mediates contact inhibition of locomotion (CIL) between Schwann cells (SCs).
Related to Figure 4h. Representative time-lapse microscopy of showing Sox2 overexpressing or Slit2/3 knockdown cells, treated with siRNA1. Sox2 induces SC clustering of migratory, polarised cords, in which the CIL signal is maintained. In contrast, Slit2/3 knockdown in SCs results in quieter, more round clusters. Video acquired at 20X magnification.
Figure 5 with 2 supplements
N-cadherin is required for the trafficking of Slit2/Slit3 to the cell surface.
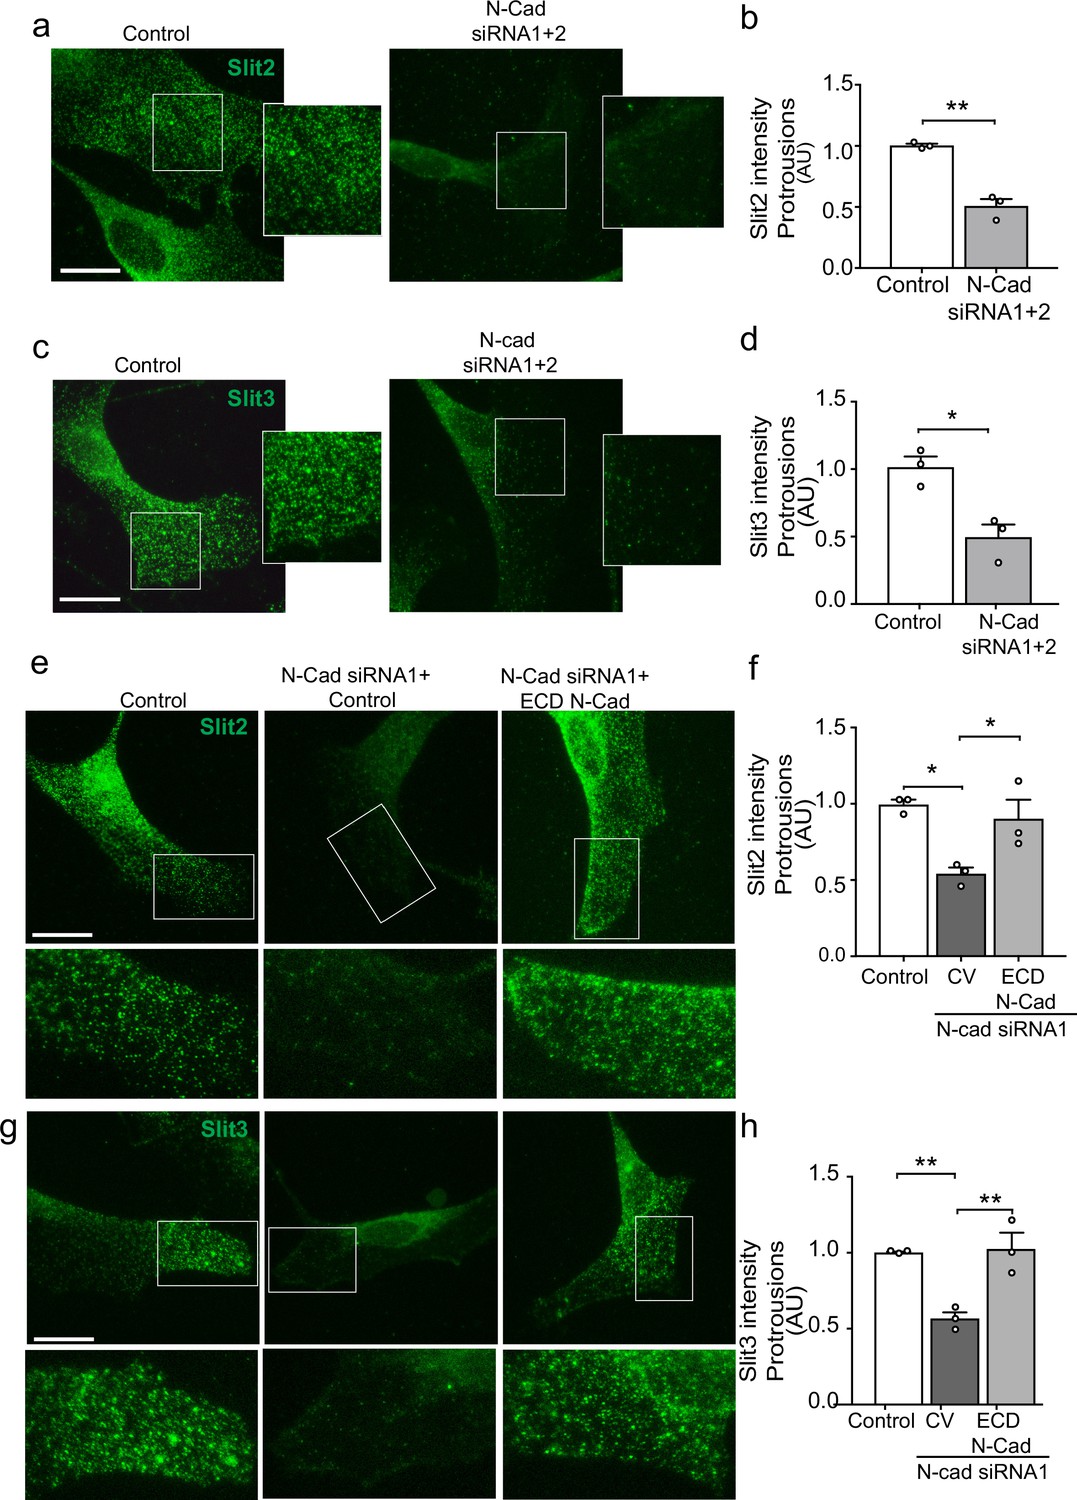
(a–d) Representative confocal images of control or N-cadherin (N-Cad) knockdown Schwann cells (SCs). Cells were labelled with antibodies to (a) Slit2 or (c) Slit3 (green) with quantification of Slit2 and Slit3 levels in the cell protrusions indicated by the boxes (n = 3, mean ± SEM for both conditions). Scale bars = 15 μm. p-values were calculated using an unpaired t-test. (e) Representative confocal images of rescue experiments in which SCs depleted of N-Cad were transfected with the N-Cad ECD tagged with tomato, or tomato control vector and immunolabelled to detect Slit2 (green). Scale bar = 15 μm. (f) Quantification of (e) (n = 3, mean ± SEM). p-values were calculated using a one-way ANOVA followed by Tukey’s multiple comparisons tests. (g) As (e) but stained for Slit3 (green). (h) Quantification of (g) (n = 3, mean ± SEM). Scale bar = 15 μm. p-values were calculated using a one-way ANOVA followed by Tukey’s multiple comparisons tests. *p<0.05, **p<0.01.
-
Figure 5—source data 1
Excel spreadsheet containing data used to generate graphs in Figure 5.
- https://cdn.elifesciences.org/articles/88872/elife-88872-fig5-data1-v2.xlsx
Figure 5—figure supplement 1

N-cadherin is required for the localisation of Slit2/Slit3 at the cell surface.
(a) Representative western blot (n = 3) of control and N-cadherin (N-Cad) knockdown cells, probed for Slit2 (200 kDa), Slit3 (200 kDa), and N-Cad (127 kDa). Vinculin (117 kDa) was used as a loading control. (b) Graph showing mRNA expression levels of Slit2, Slit3, and Glypican-4 in N-Cad knockdown cells compared to control (mean ± SEM, from n = 3 independent experiments). (c) Representative western blot showing the co-immunoprecipitation of either tomato or full-length N-Cad tagged with tomato, co-expressed with myc-tagged Slit2 in HEK cells. Blots were probed with anti-tomato (43 kDa), anti-myc (49 kDa), and anti-Slit2 (200 kDa) antibodies (n = 3). (d) Representative stills from spinning disc confocal images of Schwann cells (SCs) transfected with tomato labelled N-Cad, demonstrating the dynamic activity of N-Cad (red) arriving at waves towards the moving front of cells (see Figure 5—video 1). Arrowheads indicate N-Cad at cell–cell contacts. Arrows indicate waves of N-Cad moving towards the front of the lamellipodia of SCs. Scale bar = 50 μm. (e) Quantification of total Slit2 and (f) Slit3 intensity in N-Cad KD cells compared to control (each dot represents a single cell from n = 3, red bars represent mean ± SEM). p-values were calculated by unpaired t-test. (g) Representative immunofluorescence images of Slit2 (white) and Slit3 (white) staining following N-Cad knockdown. Note the lack of Slit2/3 staining at the cell protrusions, but with expression detectable in the perinuclear area. Dashed lines denote outline of cell. Scale bar = 10 μm. (h) Representative immunofluorescence images of Slit2 (white) staining at the membrane in free moving and cells in contact. Arrowheads indicate Slit2 (white) staining at the membrane, and arrowheads indicate Slit2 staining at the site of contact. Scale bar = 10 μm (i) Representative immunofluorescence images of Slit2 staining at the membrane in control and Glypican-4 KD cells. Scale bar = 10 μm. **p<0.01. n.s. = not significant.
-
Figure 5—figure supplement 1—source data 1
Original file for the western blot analysis of N-cadherin KD in Figure 5—figure supplement 1a (N-cadherin).
- https://cdn.elifesciences.org/articles/88872/elife-88872-fig5-figsupp1-data1-v2.xlsx
-
Figure 5—figure supplement 1—source data 2
Labelled file for the western blot analysis of N-cadherin KD in Figure 5—figure supplement 1a (N-cadherin).
- https://cdn.elifesciences.org/articles/88872/elife-88872-fig5-figsupp1-data2-v2.zip
-
Figure 5—figure supplement 1—source data 3
Original file for the western blot analysis of N-cadherin KD in Figure 5—figure supplement 1a (Slit2).
- https://cdn.elifesciences.org/articles/88872/elife-88872-fig5-figsupp1-data3-v2.zip
-
Figure 5—figure supplement 1—source data 4
Labelled file for the western blot analysis of N-cadherin KD in Figure 5—figure supplement 1a (Slit2).
- https://cdn.elifesciences.org/articles/88872/elife-88872-fig5-figsupp1-data4-v2.zip
-
Figure 5—figure supplement 1—source data 5
Original file for the western blot analysis of N-cadherin KD in Figure 5—figure supplement 1a (Slit3).
- https://cdn.elifesciences.org/articles/88872/elife-88872-fig5-figsupp1-data5-v2.zip
-
Figure 5—figure supplement 1—source data 6
Labelled file for the western blot analysis of N-cadherin KD in Figure 5—figure supplement 1a (Slit3).
- https://cdn.elifesciences.org/articles/88872/elife-88872-fig5-figsupp1-data6-v2.zip
-
Figure 5—figure supplement 1—source data 7
Original file for the western blot analysis of N-cadherin KD in Figure 5—figure supplement 1a (Vinculin).
- https://cdn.elifesciences.org/articles/88872/elife-88872-fig5-figsupp1-data7-v2.zip
-
Figure 5—figure supplement 1—source data 8
Labelled file for the western blot analysis of N-cadherin KD in Figure 5—figure supplement 1a (Vinculin).
- https://cdn.elifesciences.org/articles/88872/elife-88872-fig5-figsupp1-data8-v2.zip
-
Figure 5—figure supplement 1—source data 9
Original file for the western blot showing the co-immunoprecipitation of either tomato or full-length N-Cad tagged with tomato, co-expressed with myc-tagged Slit2 in HEK cells in Figure 5—figure supplement 1c (Slit2).
- https://cdn.elifesciences.org/articles/88872/elife-88872-fig5-figsupp1-data9-v2.zip
-
Figure 5—figure supplement 1—source data 10
Labelled file for the western blot showing the co-immunoprecipitation of either tomato or full-length N-Cad tagged with tomato, co-expressed with myc-tagged Slit2 in HEK cells in Figure 5—figure supplement 1 (Slit2).
- https://cdn.elifesciences.org/articles/88872/elife-88872-fig5-figsupp1-data10-v2.zip
-
Figure 5—figure supplement 1—source data 11
Original file for the western blot showing the co-immunoprecipitation of either tomato or full-length N-Cad tagged with tomato, co-expressed with myc-tagged Slit2 in HEK cells in Figure 5—figure supplement 1c (myc).
- https://cdn.elifesciences.org/articles/88872/elife-88872-fig5-figsupp1-data11-v2.zip
-
Figure 5—figure supplement 1—source data 12
Labelled file for the western blot showing the co-immunoprecipitation of either tomato or full-length N-Cad tagged with tomato, co-expressed with myc-tagged Slit2 in HEK cells in Figure 5—figure supplement 1c (myc).
- https://cdn.elifesciences.org/articles/88872/elife-88872-fig5-figsupp1-data12-v2.zip
-
Figure 5—figure supplement 1—source data 13
Original file for the western blot showing the co-immunoprecipitation of either tomato or full-length N-Cad tagged with tomato, co-expressed with myc-tagged Slit2 in HEK cells in Figure 5—figure supplement 1c (tomato).
- https://cdn.elifesciences.org/articles/88872/elife-88872-fig5-figsupp1-data13-v2.zip
-
Figure 5—figure supplement 1—source data 14
Labelled file for the western blot showing the co-immunoprecipitation of either tomato or full-length N-Cad tagged with tomato, co-expressed with myc-tagged Slit2 in HEK cells in Figure 5—figure supplement 1 (tomato).
- https://cdn.elifesciences.org/articles/88872/elife-88872-fig5-figsupp1-data14-v2.zip
-
Figure 5—figure supplement 1—source data 15
Excel spreadsheet containing data used to generate graphs in Figure 5—figure supplement 1.
- https://cdn.elifesciences.org/articles/88872/elife-88872-fig5-figsupp1-data15-v2.xlsx
Figure 5—video 1
N-cadherin moves in waves towards cell contacts.
Related to Figure 5—figure supplement 1d. Spinning disc confocal microscopy of Schwann cells (SCs) transfected with construct expressing siRNA resistant tomato-tagged N-cadherin in order to visualise N-Cad movement during cell migration. This video demonstrates the dynamic activity of N-Cad which arrives in waves towards the moving front of the cell. Video acquired at 40X magnification.
Figure 6 with 4 supplements
The Slit-repulsive signal is required for the efficient collective migration of Schwann cells (SCs) during nerve regeneration.
(a) Quantification of the collective migration of control compared to Slit2/Slit3 knockdown SCs at 6 hr using a chamber assay (Figure 6—video 1). Data is normalised to control and presented as mean area ± SEM of n = 3 independent experiments. p-values were calculated using an unpaired t-test with Welch’s correction compared to control. (b) Representative confocal images of SCs treated with recombinant-Slit2 (rSlit2) or PBS immunolabelled to detect N-Cadherin (N-Cad) (green) and co-stained with phalloidin (red) to detect F-actin and Hoechst to detect nuclei (blue). (n = 3). Scale bar = 50 μM. (c) Quantification of SC clusters from (b) (n = 3, mean ± SEM) (Figure 6—video 2). p-values were calculated using a two-way ANOVA followed by Sidak’s test for multiple comparisons. (d) Graph shows the collective migration of SCs in a chamber assay treated with rSlit2 or PBS control (n = 3, mean area ± SEM). p-values were calculated using an unpaired t-test with Welch’s correction compared to PBS controls. (e) Graph shows the Euclidean distance (shortest distance travelled) for cells in (d) at 24 hr (PBS n = 141, rSlit2 n = 138 from n = 3 independent experiments). The red line denotes the mean. p-values were calculated using an unpaired two-tailed t-test. (f) Graph shows tracks of individual cells in the collective migration assay quantified in (d) n = 3. (g) Representative confocal images from three independent experiments of Sox2-induced SC clusters treated with Shield for 24 hr and PBS or rSlit2 immunolabelled to detect N-Cad (green) and co-stained with phalloidin (red) to detect F-actin and Hoechst to detect nuclei (blue) (Figure 6—video 3). Scale bar = 50 μM. (h) Quantification of cell roundness of Sox2-induced SC clusters treated with PBS or rSlit2. (n = 3, mean ± SEM). Data was normalised to Sox2 controls and p-values calculated using an unpaired t-test. (i) Polar histograms showing alignment of nuclei within each cluster from PBS (n = 168) or rSlit2 (n = 166) treated Sox2 SCs as an indicator of polarisation. Angles closer to 0 represent more aligned nuclei in the PBS (blue) whereas they are more randomly distributed in the rSlit2-treated Sox2 SCs (orange). Data is representative of n = 3. (j) Representative confocal images of Sox2 SC clusters treated with control, or Slit2/Slit3 siRNAs and immunolabelled to detect N-Cad (green) and co-stained with phalloidin (red) to detect F-actin and Hoechst to detect nuclei (blue). Scale bar = 50 μm. (k) Quantification of the cell roundness of individual cells in Sox2-induced SC clusters treated with control or Slit2/Slit3 siRNA1 or 2 (n = 3, mean ± SEM). Data was normalised to Sox2 controls and p-values calculated using an unpaired two-tailed t-test. (l) Schematic illustrating that in control conditions SC exhibit CIL but upon KD of N-cadherin, CIL is lost and SCs become overlapping. Knockdown or inhibition of Slit2/Slit3 inhibits CIL but the persistence of N-cadherin expression results in the formation of non-migratory clusters. In contrast, SC cords in which Sox2 is activated maintain CIL signals which drive their collective migration. *p<0.05, **p<0.01, ***p<0.001.
-
Figure 6—source data 1
Excel spreadsheet containing data used to generate graphs in Figure 6.
- https://cdn.elifesciences.org/articles/88872/elife-88872-fig6-data1-v2.xlsx
Figure 6—figure supplement 1

The Slit-repulsive signal is required for the efficient collective migration of Schwann cells (SCs).
(a) Representative stills from time-lapse microscopy (Figure 6—video 1) showing the collective migration of control or Slit2/Slit3 knockdown SCs seeded in chambers at the indicated time points and quantified in Figure 6a (n = 3). The dashed lines indicate the leading edge of the migrating cells. Arrows indicate the direction of migration. Scale bar = 50 μm. (b) As in (a) but the SCs were treated with 2 μg/ml recombinant-Slit-2 (rSlit2) or PBS (n = 3), quantified in Figure 6d (Figure 6—video 3). Scale bar = 50 μm. (c) Representative western blot showing pTuner empty vector SCs or pTuner Sox2 SCs response to Shield treatment at 24 hr. Note that high Sox2 expression is only evident in the Shield-treated pTuner Sox2 SCs at 24 hr. N-cadherin (127 kDa), Sox2 (32 kDa) Vinculin (117 kDa), α-tubulin (50 kDa). (d) Diagram showing how nuclear alignment and cluster roundness were quantified. (e) Quantification of overall cluster roundness in Sox2 SCs treated with rSlit2 or (f) Slit2/3 siRNA (each dot represents a cluster from n = 3, red bars represent mean ± SEM). (g) Polar histograms representative of n = 3 experiments, showing the alignment of the nuclei within each cluster in control (blue) or Slit2/3 siRNA 1 and Slit2/3 siRNA2 (orange). p-values were calculated by t-test or one-way ANOVA as appropriate. **p<0.01, ***p<0.001.
-
Figure 6—figure supplement 1—source data 1
Original gel for analysis of western blot showing pTuner empty vector SCs or pTuner Sox2 SCs response to Shield treatment at 24 hr in Figure 6—figure supplement 1 (N-cadherin).
- https://cdn.elifesciences.org/articles/88872/elife-88872-fig6-figsupp1-data1-v2.xlsx
-
Figure 6—figure supplement 1—source data 2
Labelled gel for analysis of western blot showing pTuner empty vector SCs or pTuner Sox2 SCs response to Shield treatment at 24 hr in Figure 6—figure supplement 1c (N-cadherin).
- https://cdn.elifesciences.org/articles/88872/elife-88872-fig6-figsupp1-data2-v2.zip
-
Figure 6—figure supplement 1—source data 3
Original gel for analysis of western blot showing pTuner empty vector SCs or pTuner Sox2 SCs response to Shield treatment at 24 hr in Figure 6—figure supplement 1c (Sox2).
- https://cdn.elifesciences.org/articles/88872/elife-88872-fig6-figsupp1-data3-v2.zip
-
Figure 6—figure supplement 1—source data 4
Labelled gel for analysis of western blot showing pTuner empty vector SCs or pTuner Sox2 SCs response to Shield treatment at 24 hr in Figure 6—figure supplement 1c (Sox2).
- https://cdn.elifesciences.org/articles/88872/elife-88872-fig6-figsupp1-data4-v2.zip
-
Figure 6—figure supplement 1—source data 5
Original gel for analysis of western blot showing loading controls for pTuner empty vector SCs or pTuner Sox2 SCs response to Shield treatment at 24 hr in Figure 6—figure supplement 1c (Vinculin and α-tubulin).
- https://cdn.elifesciences.org/articles/88872/elife-88872-fig6-figsupp1-data5-v2.zip
-
Figure 6—figure supplement 1—source data 6
Labelled gel for analysis of western blot showing loading controls for pTuner empty vector SCs or pTuner Sox2 SCs response to Shield treatment at 24 hr in Figure 6—figure supplement 1 (Vinculin and α-tubulin).
- https://cdn.elifesciences.org/articles/88872/elife-88872-fig6-figsupp1-data6-v2.zip
-
Figure 6—figure supplement 1—source data 7
Excel spreadsheet containing data used to generate graphs in Figure 6—figure supplement 1.
- https://cdn.elifesciences.org/articles/88872/elife-88872-fig6-figsupp1-data7-v2.xlsx
Figure 6—video 1
Slit2/3 are required for the efficient collective migration of Schwann cells (SCs).
Related to Figure 6a. Representative time-lapse microscopy of the collective migration of SCs treated with control siRNA or Slit2/3 siRNA2. Following Slit2/3 knockdown, SCs are clustered and migrate less efficiently towards to gap. Video acquired at 20X magnification.
Figure 6—video 2
Recombinant Slit2 induces Schwann cell clustering.
Related to Figure 6c. Representative time-lapse microscopy of a cell clustering assay, showing PBS or recombinant Slit2 (rSlit2)-treated Schwann cells, that are repulsed and not repulsed upon contact respectively. Video acquired at 20X magnification.
Figure 6—video 3
Slit2 is required for the efficient collective migration of Schwann cells (SCs).
Related to Figure 6d. Representative time-lapse microscopy of a collective migration assay, showing PBS or recombinant Slit2 (rSlit2)-treated SCs. Note that rSlit2-treated SCs close the gap more slowly than PBS-treated cells. Video acquired at 20X magnification.
Figure 7 with 2 supplements
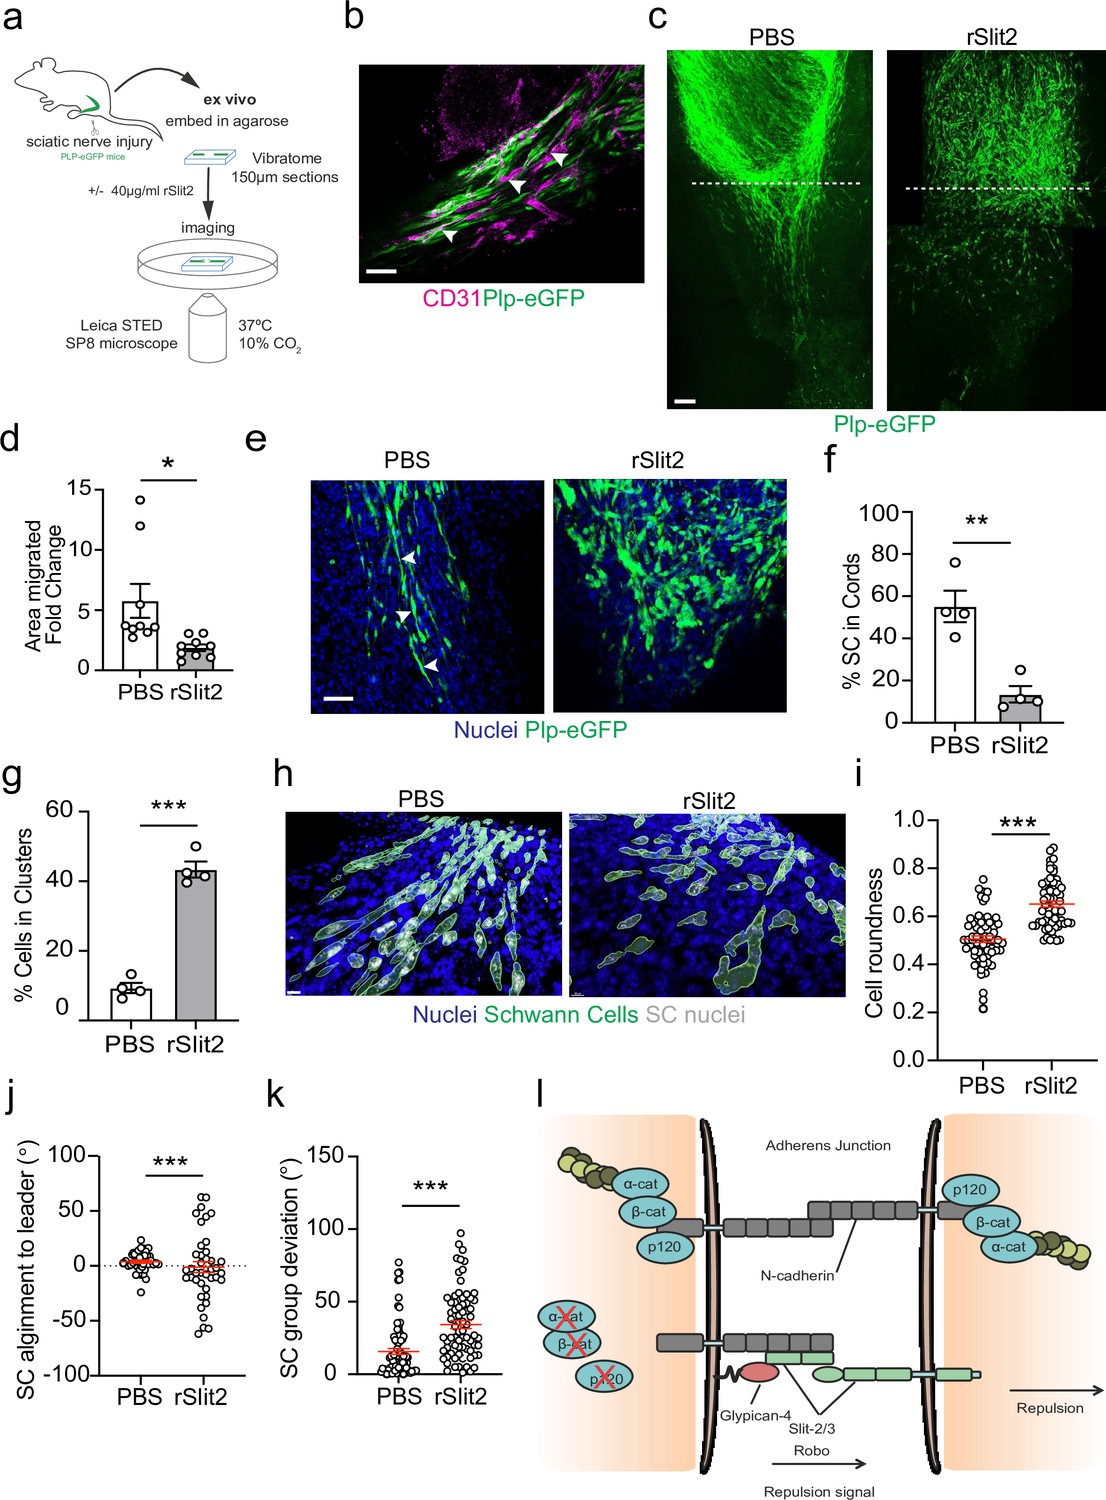
The Slit-repulsive signal is required for the efficient collective migration of Schwann cells (SCs) in the ex vivo nerve bridge.
(a) Schematic showing ex vivo migration protocol. (b) Representative immunofluorescence images in untreated ex vivo explants showing plp-eGFP SCs (green) migrating along the vasculature (magenta) in the ex vivo bridge. Arrowheads indicate SCs in close contact with blood vessels. Scale bar = 50 μm. (c) Representative tile scan images of the nerve bridge explants following nerve transection in plp-eGFP (green) mice at 24 hr after treatment with PBS or rSlit (40 µg/ml). At 24 hr, PBS-treated explants showed the migration of aligned cords of SC into the bridge. In contrast, rSlit2-treated sections showed less SC migration, with groups of clustered, more round cells. Scale bar = 100 μm. (d) Graph showing quantification of SC migration at 24 hr following treatment with either PBS or rSlit2 in tile scan images. Data was expressed as the fold change in migration from 0 hr. Data are representative of n = 9 animals/group from n = 5 independent experiments. Data are represented as mean area ± SEM and p-values calculated by an unpaired t-test. (e) Representative ex vivo images of the nerve bridge 24 hr following treatment with PBS or rSlit2 to detect SC with endogenous plp-eGFP (green) and Hoechst (blue). Images show that PBS SC appear to migrate as directional cords whereas rSlit2-treated SC exhibit a rounder and more clustered phenotype (Figure 7—video 1). Scale bar = 50 µm. Images are representative of n = 4 animals/group from n = 3 independent experiments. (f) Quantification of (d) comparing the number of SC in cords following PBS or rSlit2 treatment and expressed as a percentage. p-values calculated by a Fisher’s exact test (n = 4 animals/group mean ± SEM). (g) Quantification of (d) showing the number of SC in clusters following PBS or rSlit2 treatment and expressed as a percentage (n = 4 animals/group mean ± SEM). p-values calculated by a Fisher’s exact test. (h) Representative 3D surface reconstructed images of nerve bridge explants following PBS or rSlit2 treatment labelled for SC (plp-eGFP, green), nuclei (blue), and SC nuclei (white). Images were used to quantify the sphericity of the migrating SC. Scale bar = 10 μm (i) Quantification of SC roundness from (h). PBS (n = 64) and rSlit2 (n = 65). p-values were calculated by an unpaired t-test with Welch’s correction, n = 4 animals/group mean ± SEM (red). (j) Quantification of nuclear alignment of SCs to the leader cell within a cord or cluster. PBS (n = 41) and rSlit (n = 40). p-values were calculated by an unpaired t-test with Welch’s correction, n = 3 animals/group mean ± SEM. (k) Quantification SC persistent migration. Graph represents how far SC groups have deviated from directed migration into the bridge. PBS (n = 72) and rSlit (n = 71). p-values were calculated by an unpaired t-test with Welch’s correction, n = 4 animals/group mean ± SEM (red). (l) Cartoon representing the dual role of N-cadherin in SC collective migration. *p<0.05, **p<0.01, ***p<0.001.
-
Figure 7—source data 1
Excel spreadsheet containing data used to generate graphs in Figure 7.
- https://cdn.elifesciences.org/articles/88872/elife-88872-fig7-data1-v2.xlsx
Figure 7—figure supplement 1
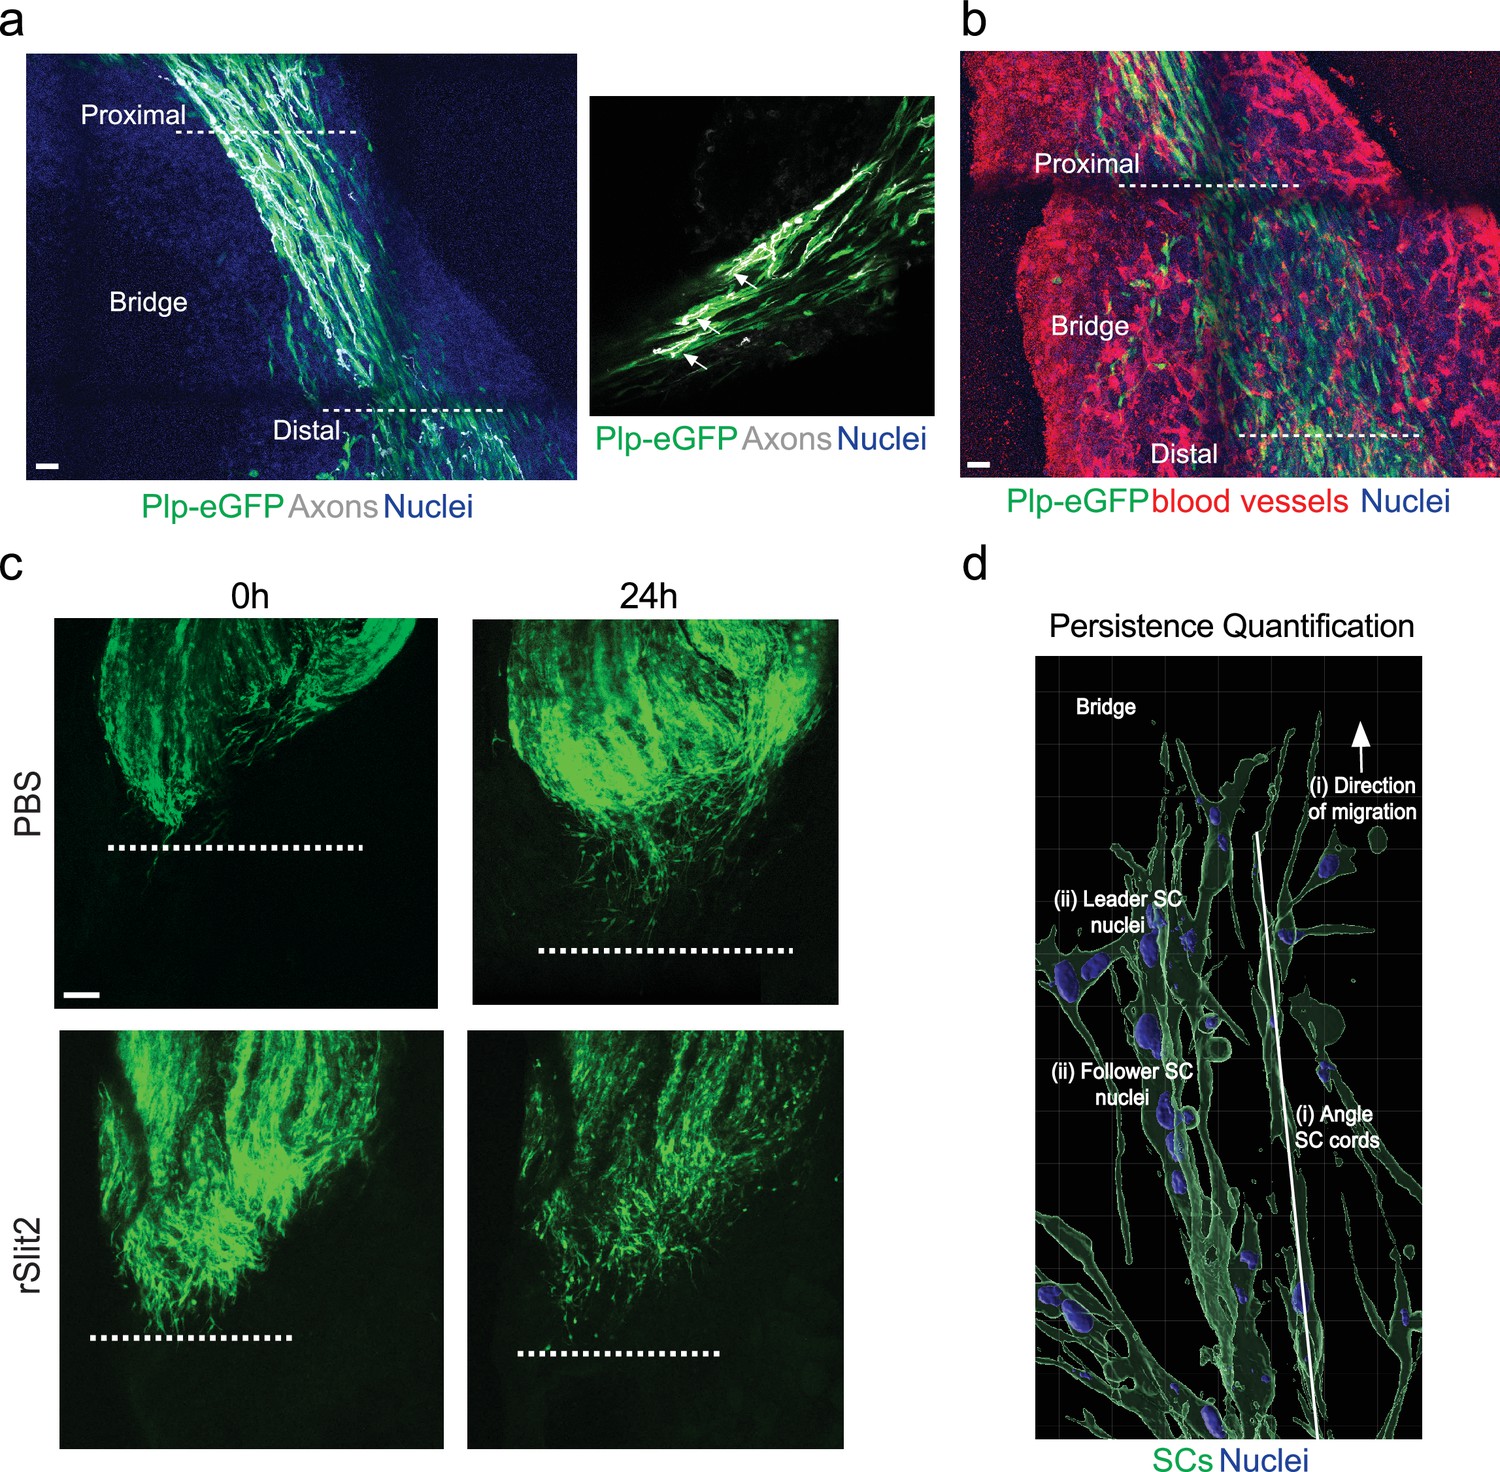
The Slit-repulsive signal is required for the efficient collective migration of Schwann cells (SCs) ex vivo.
(a) Representative tile scans of untreated ex vivo explants showing the components of the bridge. Images show densely packed nuclei (blue) between the proximal and distal stumps. Regrowing axons (white) are evident following the SC (green) cords, which are migrating along the (b) vasculature (red). Scale bars = 100 μm. (c) Representative tile scan images from ex vivo explants harvested on day 5 following sciatic nerve injury at 0 hr and 24 hr following treatment with PBS or rSlit2 (40 μg/ml) and quantified in Figure 7b. Images show similar levels of SC migration into the bridge between groups at the 0 hr time point as marked by plp-eGFP (green). At 24 hr post treatment, rSlit2-treated nerves show reduced SC migration into the bridge. Images are representative of n = 9 animals/group from n = 5 independent experiments. Dashed lines indicate area where migration begins. Scale bar = 100 μm. (d) Imaris diagram showing quantification of SC persistence of migration ex vivo. (i) The angle of SC cords was measured relative to the stump. (ii) The angle of each nucleus within a cord was measured and compared to the leader cell and expressed as SC alignment to leader (degrees).
Figure 7—video 1
Slit2 is required for the collective migration of Schwann cells (SCs) within a regenerating nerve.
Related to Figure 7b. Representative time-lapse microscopy of nerve explants from mice 5 d following sciatic nerve transection showing the effect of PBS or recombinant Slit2 (rSlit2) (60 μg/ml) treatment on migration into the nerve bridge. PBS-treated explants migrated in cords, whereas SC in nerves treated with rSlit2 became clustered. Video acquired at 20X magnification.
Tables
Appendix 1—key resources table
| Reagent type (species) or resource | Designation | Source or reference | Identifiers | Additional information |
|---|---|---|---|---|
| Other | Plp-eGFP | Mallon et al., 2002 | Available from Jackson Laboratories https://www.jax.org/strain/033357 | |
| Cell line (Rattus norvegius) | Schwann cells | Mathon et al., 2001 | SCs | |
| Cell line (R. norvegius) | Sox2 Schwann cells | This paper | Created using the Proteotuner Shield System by Clontech | |
| Cell line (R. norvegius) | ProteoTuner Schwann Cells | This paper | Created using the Proteotuner Shield System by Clontech | |
| Sequence-based reagent | αE-catenin siRNA1 | This paper | siRNA | AAGAACGCCTGGAAAGCATAA |
| Sequence-based reagent | αE-catenin siRNA2 | This paper | siRNA | CAACCGGGACTTGATATACAA |
| Sequence-based reagent | Cadherin-2 siRNA1 | This paper | siRNA | TCCCAACATGTTTACAATCAA |
| Sequence-based reagent | Cadherin-2 siRNA2 | This paper | siRNA | CAGTATACGTTAATAATTCAA |
| Sequence-based reagent | p120-catenin siRNA1 | This paper | siRNA | AGGTCAGATCGTGGAAACCTA |
| Sequence-based reagent | p120-catenin siRNA2 | This paper | siRNA | ATGCTCGGAACAACAAAGAGTTAA |
| Sequence-based reagent | Glypican-4 siRNA1 | This paper | siRNA | CCGACTGGTTACTGATGTCAA |
| Sequence-based reagent | Glypican-4 siRNA2 | This paper | siRNA | CGGTGTAGTTACAGAACTGTA |
| Sequence-based reagent | Slit2 siRNA1 | This paper | siRNA | ATCAATATTGATGATTGCGAA |
| Sequence-based reagent | Slit2 siRNA1 | This paper | siRNA | GACGACTAGACCGTAGTAATA |
| Sequence-based reagent | Slit3 siRNA1 | This paper | siRNA | AACGGCGGTGCCCAAAGAATT |
| Sequence-based reagent | Slit3 siRNA1 | This paper | siRNA | ATCGTGGAAATACGCCTAGAA |
| Sequence-based reagent | Robo1 siRNA1 | This paper | siRNA | AAGGGCGGCGAAAGAGTGGAA |
| Sequence-based reagent | Robo1 siRNA2 | This paper | siRNA | CCCGACTATAGAATGGTACAA |
| Sequence-based reagent | Robo2 siRNA1 | This paper | siRNA | CTCATTGGATTGTCCGGCTAA |
| Sequence-based reagent | Robo2 siRNA2 | This paper | siRNA | CTCGGACACTATCCTGCGGAA |
| Sequence-based reagent | N-cadherin siRNA1 targeting sequence | This paper | Forward primer | 5’-CACGATAAACAATGAGACTGGGGACATC-3’ |
| Sequence-based reagent | N-cadherin siRNA1 targeting sequence | This paper | Reverse primer | Reverse primer 5’-AACATATTGGGTGAAGGTGTGCTGGG-3’ |
| Sequence-based reagent | Slit1 forward | This paper | PCR primers | GCACTTGTCACAATGACCCT |
| Sequence-based reagent | Slit1 reverse | This paper | PCR primers | CCCTTCAAAGCCGGAAGGA |
| Sequence-based reagent | Slit2 forward | This paper | PCR primers | GTGTTAGAAGCCACGGGAAT |
| Sequence-based reagent | Slit2 reverse | This paper | PCR primers | GCGTCTGGTGTGAATGAGAT |
| Sequence-based reagent | Slit3 forward | This paper | PCR primers | GGATTATCGCAACAGATTCAG |
| Sequence-based reagent | Slit3 reverse | This paper | PCR primers | GGTCAGTGGTATATTCAGGG |
| Sequence-based reagent | Robo1 forward | This paper | PCR primers | AGGGGAGTCAGAATCTGCTT |
| Sequence-based reagent | Robo1 reverse | This paper | PCR primers | CCTCTGGACGTTCGTAACAG |
| Sequence-based reagent | Robo2 forward | This paper | PCR primers | TTGGATCAGAGGAGTCCCTG |
| Sequence-based reagent | Robo2 reverse | This paper | PCR primers | ACCCTTTAGAGGAGGCTGTT |
| Antibody | N-Cadherin (mouse monoclonal) | BD Transduction | 610920 | 1:1000 immunofluorescence western blot |
| Antibody | α-catenin (rabbit polyclonal) | Sigma | C2081 | 1:1000 immunofluorescence western blot |
| Antibody | β-catenin (mouse monoclonal) | BD Transduction | 610920 | 1:2000 immunofluorescence western blot |
| Antibody | p120-catenin (mouse monoclonal) | BD Transduction | 61034 | 1:2000 immunofluorescence western blot |
| Antibody | ERK1/2 (rabbit polyclonal) | Sigma | M5670 | 1:1000 western blot |
| Antibody | mCherry (rabbit polyclonal) | Abcam | ab183628 | 1:1000 western blot |
| Antibody | mCherry (rat monoclonal) | Life Technologies | M11217 | 1:1000 Immunoprecipitation |
| Antibody | Slit2 (rabbit monoclonal) | Abcam | ab134166 | 1:1000 western blot |
| Antibody | Slit2 (rabbit polyclonal) | Thermo Fisher Scientific | PA531133 | 1:1000 Immunofluorescence |
| Antibody | Slit3 (rabbit polyclonal) | Sigma | SAB2104337 | 1:1000 Immunofluorescence |
| Antibody | Slit3 (goat polyclonal) | R&D Systems | AF3629 | 1:1000 western blot |
| Antibody | Myc (mouse monoclonal) | Merck Millipore | 05-724 | 1:1000 western blot |
| Antibody | Alexa Fluor 546 Phalloidin | Life Technologies | A22283 | 1:1000 Immunofluorescence |
| Antibody | Goal anti-mouse Alexa Flour 488 | Thermo Fisher Scientific | A1100 | 1:1000 Immunofluorescence |
| Antibody | Rabbit IgG HRP | GE Healthcare | NA934V | 1:1000 western blot |
| Antibody | Mouse IgG HRP | GE Healthcare | NA931V | 1:1000 western blot |
| Antibody | Goat IgG HRP | R&D Systems | HAF012 | 1:1000 western blot |
| Software, algorithm | Prism | GraphPad | RRID:SCR_002798 | https://www.graphpad.com/features |
| Software, algorithm | Adobe Photoshop | Adobe Systems | RRID:SCR_014199 | https://www.adobe.com/ |
| Software, algorithm | Adobe Illustrator | Adobe Systems | RRID:SCR_010279 | https://www.adobe.com/ |
| Software, algorithm | FIJI/ImageJ | Shih and Yamada, 2012 #370 | RRID:SCR_002285 | https://imagej.net/Fiji/Downloads |
Additional files
Download links
A two-part list of links to download the article, or parts of the article, in various formats.
Downloads (link to download the article as PDF)
Open citations (links to open the citations from this article in various online reference manager services)
Cite this article (links to download the citations from this article in formats compatible with various reference manager tools)
N-cadherin directs the collective Schwann cell migration required for nerve regeneration through Slit2/3-mediated contact inhibition of locomotion
eLife 13:e88872.
https://doi.org/10.7554/eLife.88872


