PAK3 downregulation induces cognitive impairment following cranial irradiation
- Department of Integrated Biological Science, Pusan National University, Republic of Korea
- Department of Veterinary Anatomy and Animal Behavior, College of Veterinary Medicine and BK21 FOUR Program, Chonnam National University, Republic of Korea
- Department of Biological Sciences, Pusan National University, Republic of Korea
- Nuclear Science Research Institute, Pusan National University, Republic of Korea
Figures
Figure 1 with 1 supplement
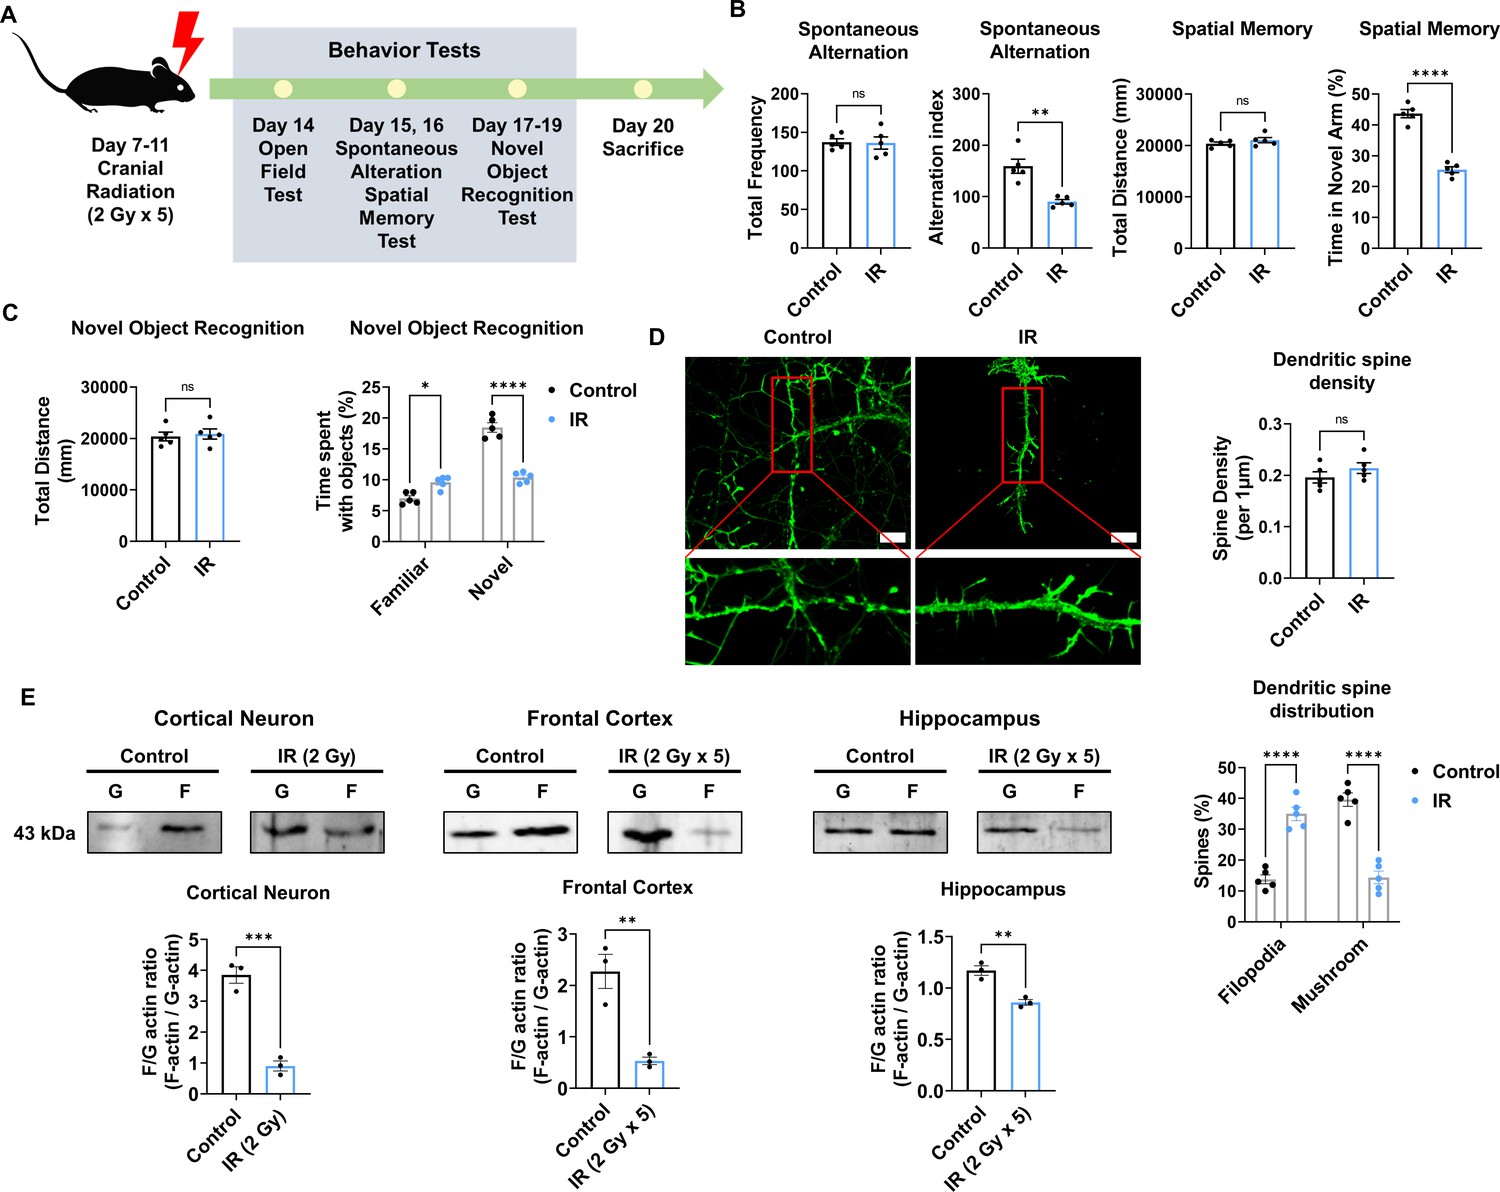
Cranial irradiation affects cognitive function and the maturation of dendritic spine.
(A) A scheme illustrating the schedule of ionizing radiation (IR) and overall behavioral tests. (B) The results of spontaneous alteration (left) and spatial memory test (right) after IR using Y-maze. The parameters of spontaneous alteration and spatial memory are described in methods. (C) The result of novel object recognition test after IR. (D) Left: representative fluorescence image of filamentous actin (F-actin, green) after IR in cortical neuron. Right: The density and distribution of dendritic spine in IR group compared to control group. Scale bars, 10 μm. (E) The alterations of F/G-actin ratio after IR in cortical neuron, frontal cortex, and hippocampus. Statistical analysis was performed with Student’s t-test for (B), left of (C), and (E) and one-way ANOVA plus a Tukey’s multiple comparisons test for (right of C) and (D) ns, non-significant; *p<0.05; **p<0.01; ***p<0.001; ****p<0.0001.
-
Figure 1—source data 1
Western blot data for the level of F/G-actin in cortical neurons, frontal cortex, and hippocampus without or with ionizing radiation (IR).
- https://cdn.elifesciences.org/articles/89221/elife-89221-fig1-data1-v1.zip
Figure 1—figure supplement 1
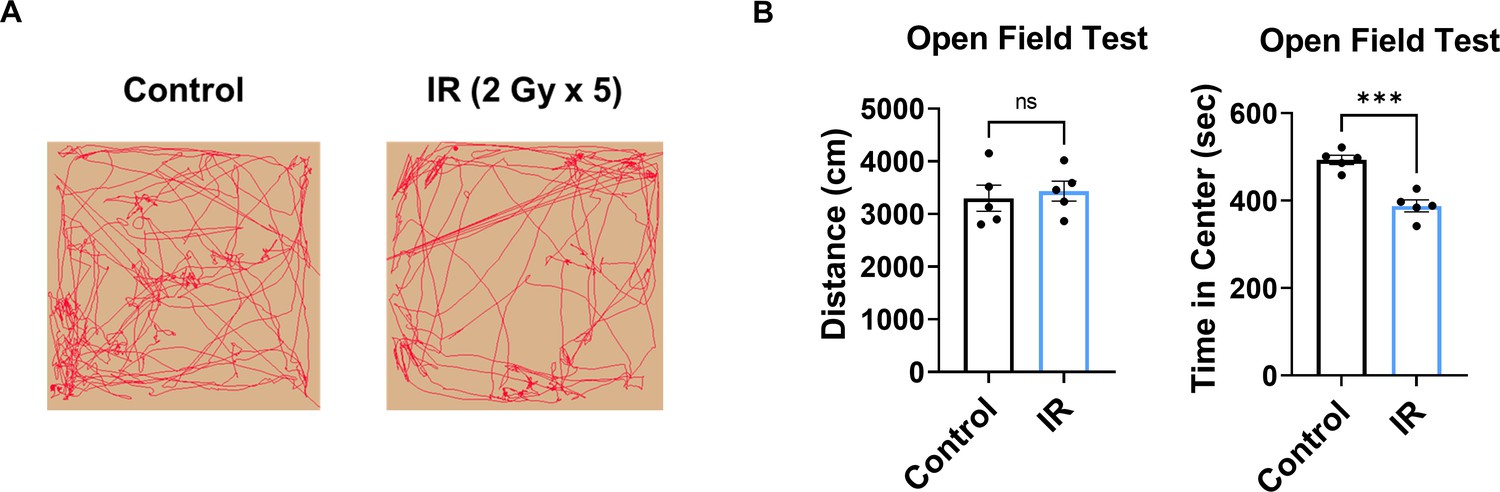
Cranial radiation affects depressive-like behavior.
(A) The representative heatmaps of open field test after ionizing radiation (IR). (B) The result of open field test after IR. Statistical analysis was performed with Student’s t-test. ns, non-significant; ***p<0.001.
Figure 2 with 2 supplements
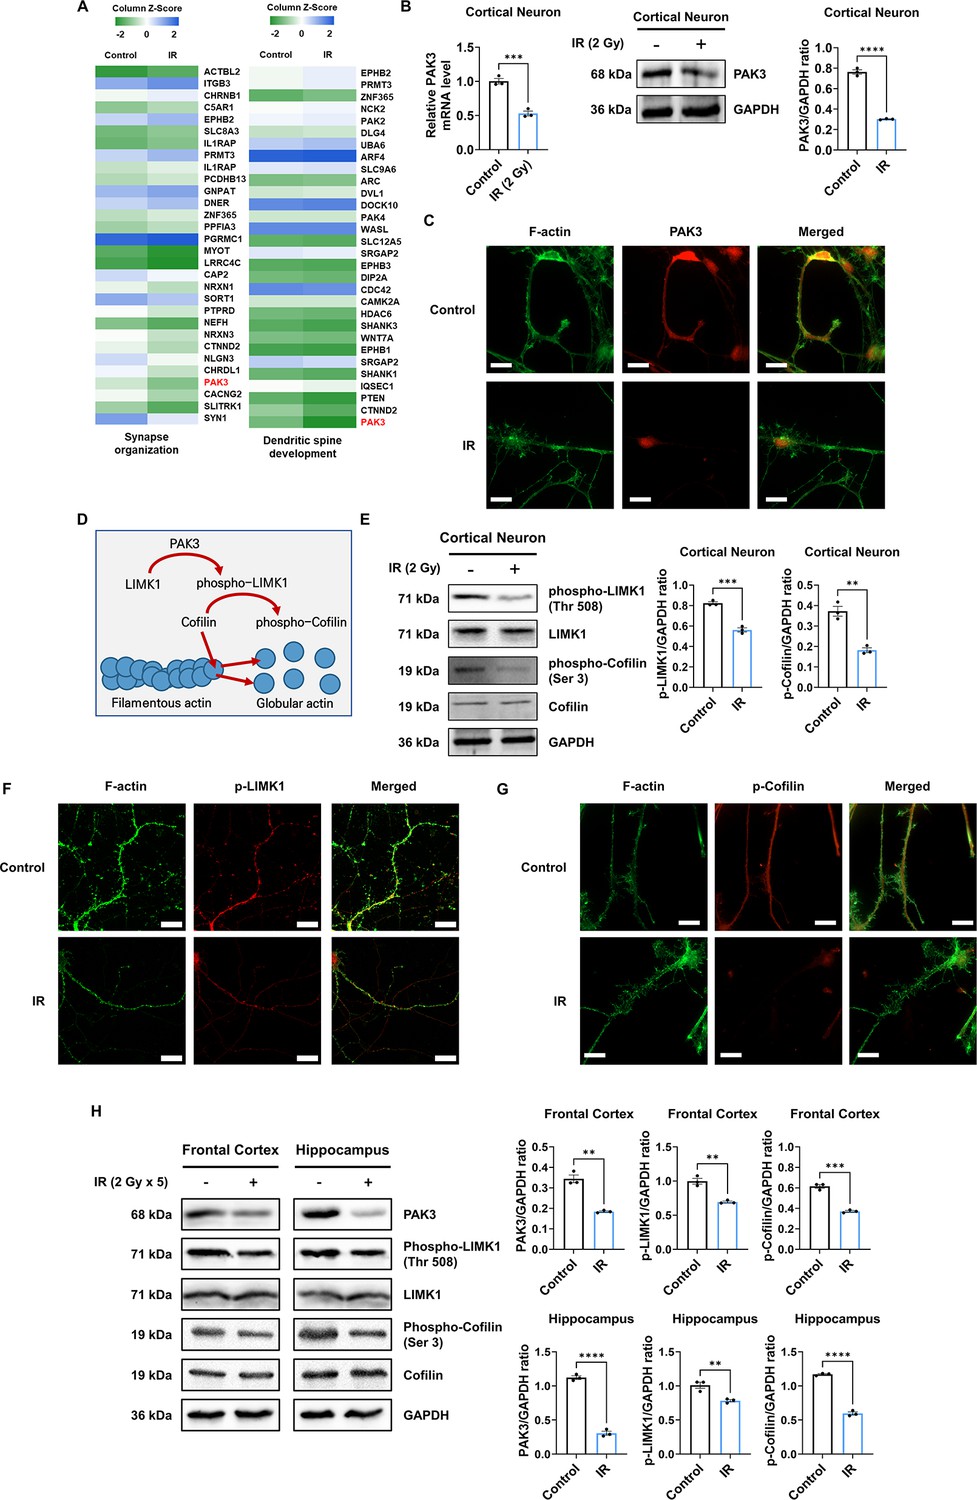
IR decreases phosphorylation of LIM kinase 1 (LIMK1) and Cofilin via p21-activated kinase 3 (PAK3) downregulation.
(A) The heatmap for the expression of genes in the term ‘synapse organization’ and ‘dendritic spine development’ in the irradiated brain. (B) The changes of PAK3 mRNA and protein levels after ionizing radiation (IR) in cortical neuron. Each western blot bands are quantified by ImageJ. (C) Representative fluorescence image of filamentous actin (F-actin) (green) and PAK3 (red) in cortical neuron. Scale bars, 10 μm. (D) Schematic illustration of PAK3-LIMK1-cofilin signaling. (E) Left: the protein levels of phosphorylated LIMK1, LIMK1, phosphorylated cofilin, and cofilin after IR in cortical neuron. Right: each western blot bands are quantified by ImageJ. (F–G) Representative fluorescence image of F-actin (green) and phosphorylated LIMK1 (F), (red) or phosphorylated cofilin (G), (red) in cortical neuron. Scale bars, 10 μm. (H) Left: the protein levels of phosphorylated LIMK1, LIMK1, phosphorylated cofilin, and cofilin after IR in frontal cortex and hippocampus. Right: each western blot bands are quantified by ImageJ. Statistical analysis was performed with Student’s t-test. ns, non-significant; **p<0.01; ***p<0.001; ****p<0.0001.
-
Figure 2—source data 1
Western blot data for the level of p21-activated kinase 3 (PAK3) in cortical neurons without or with ionizing radiation (IR).
- https://cdn.elifesciences.org/articles/89221/elife-89221-fig2-data1-v1.zip
-
Figure 2—source data 2
Western blot data for the levels of phospho-LIMK1, LIM kinase 1 (LIMK1), phospho-Cofilin, Cofilin, and GAPDH in cortical neurons without or with ionizing radiation (IR).
- https://cdn.elifesciences.org/articles/89221/elife-89221-fig2-data2-v1.zip
-
Figure 2—source data 3
Western blot data for the levels of p21-activated kinase 3 (PAK3), phospho-LIMK1, LIM kinase 1 (LIMK1), phospho-Cofilin, Cofilin, and GAPDH in frontal cortex and hippocampus without or with ionizing radiation (IR).
- https://cdn.elifesciences.org/articles/89221/elife-89221-fig2-data3-v1.zip
Figure 2—figure supplement 1
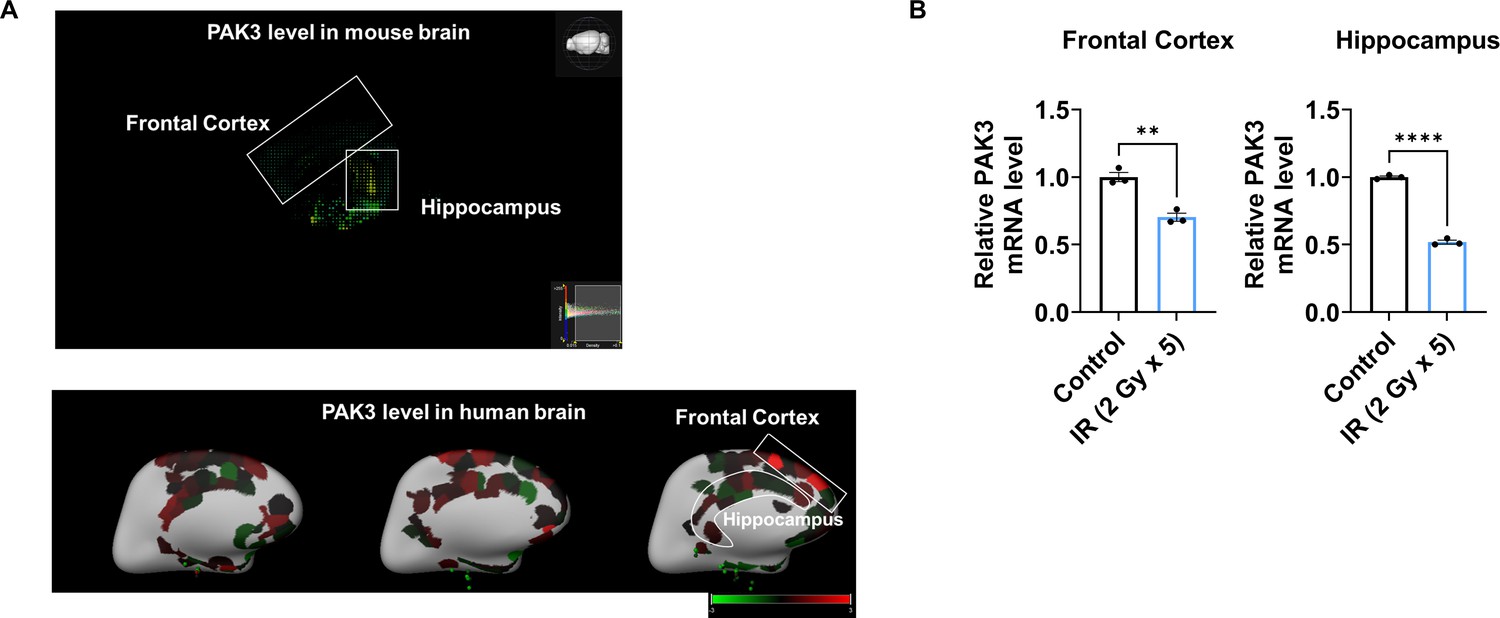
p21-activated kinase 3 (PAK3) is related to synapse organization and dendritic spine development in frontal cortex and hippocampus.
(A) The localization of PAK3 in mouse and three human brain from Allen brain map (https://portal.brain-map.org/). (B) The changes of PAK3 mRNA level after ionizing radiation (IR) in frontal cortex and hippocampus. Statistical analysis was performed with Student’s t-test. **p<0.01; ****p<0.0001.
Figure 2—figure supplement 2

Oncoprotein 18 (OP18) and tubulin folding cofactor b (TBCB) signaling are not affected by ionizing radiation (IR).
(A) The protein levels of phosphorylated OP18, OP18, TBCB after IR in cortical neuron. (B) The protein levels of phosphorylated OP18, OP18, TBCB after IR in frontal cortex and hippocampus.
-
Figure 2—figure supplement 2—source data 1
Western blot data for the levels of phospho-OP18, oncoprotein 18 (OP18), tubulin folding cofactor b (TBCB), and GAPDH in cortical neurons without or with ionizing radiation (IR).
- https://cdn.elifesciences.org/articles/89221/elife-89221-fig2-figsupp2-data1-v1.zip
-
Figure 2—figure supplement 2—source data 2
Western blot data for the levels of phospho-OP18, oncoprotein 18 (OP18), tubulin folding cofactor b (TBCB), and GAPDH in frontal cortex and hippocampus without or with ionizing radiation (IR).
- https://cdn.elifesciences.org/articles/89221/elife-89221-fig2-figsupp2-data2-v1.zip
Figure 3
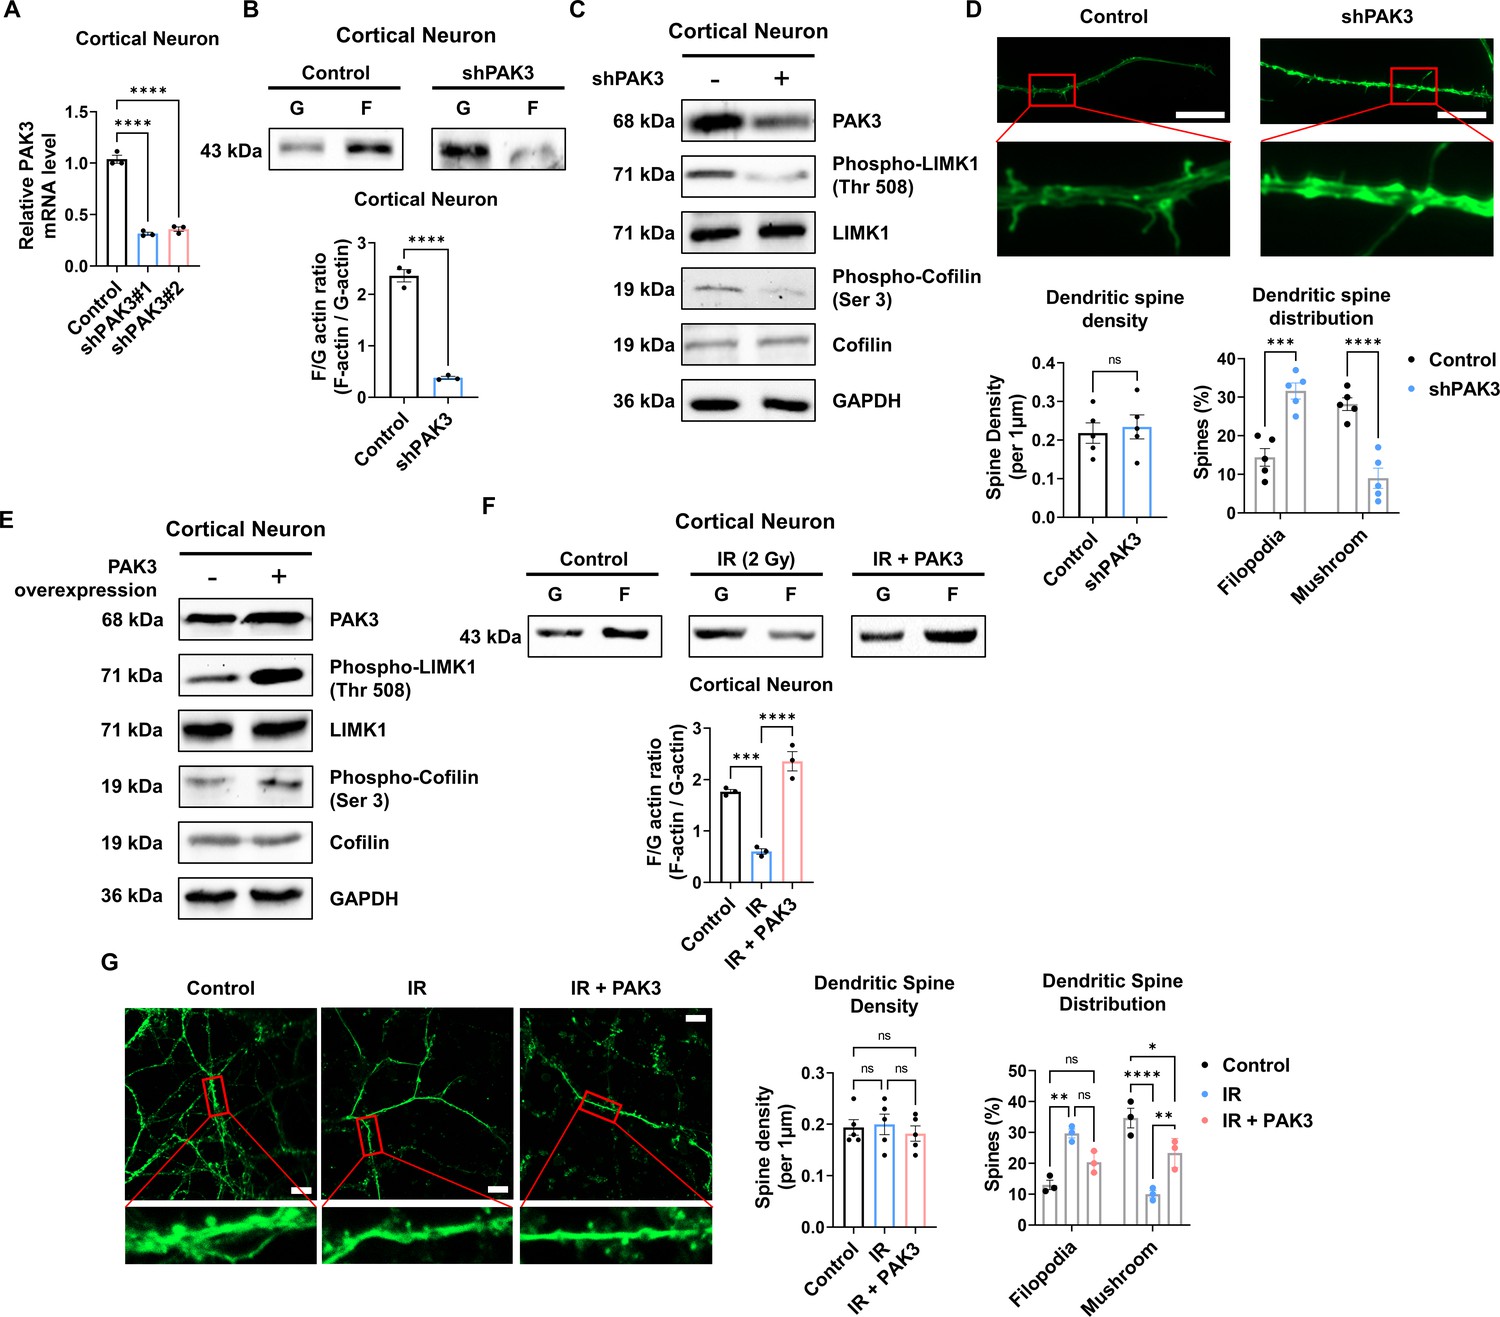
p21-activated kinase 3 (PAK3) regulates filamentous/globular (F/G)-actin and dendritic spine in neuron.
(A) The changes of PAK3 mRNA levels after PAK3 downregulation (shPAK3) in cortical neuron. (B) The F/G-actin ratio after expression of PAK3 downregulation (shPAK3) in cortical neuron. Each filamentous actin (F-actin) and globular (G)-actin are quantified by ImageJ. (C) The protein levels of phosphorylated LIMK1, LIM kinase 1 (LIMK1), phosphorylated cofilin, and cofilin after PAK3 downregulation (shPAK3) in cortical neuron. (D) Upper: representative fluorescence image of filamentous actin (F-actin, green) after PAK3 downregulation (shPAK3) in cortical neuron. Lower: the density and distribution of dendritic spine in shPAK3 group compared to control group. Scale bars, 10 μm. (E) The protein levels of PAK3, phosphorylated LIMK1, LIMK1, phosphorylated cofilin, and cofilin after PAK3 overexpression in cortical neuron. (F) The F/G-actin ratio after ionizing radiation (IR) or IR with PAK3 overexpression in cortical neuron. Each F-actin and G-actin are quantified by ImageJ. (G) Upper: representative fluorescence image of filamentous actin (F-actin, green) after IR and/or PAK3 overexpression in cortical neuron. Lower: the density and distribution of dendritic spine in control, IR and/or PAK3 overexpression group. Scale bars, 10 μm. Statistical analysis was performed with Student’s t-test for (B and D) and one-way ANOVA plus a Tukey’s multiple comparisons test for (A, D, F, and G) ns, non-significant; *p<0.05; **p<0.01; ***p<0.001; ****p<0.0001.
-
Figure 3—source data 1
Western blot data for the level of F/G-actin in cortical neurons without or with p21-activated kinase 3 (PAK3) downregulation.
- https://cdn.elifesciences.org/articles/89221/elife-89221-fig3-data1-v1.zip
-
Figure 3—source data 2
Western blot data for the levels of p21-activated kinase 3 (PAK3), phospho-LIMK1, LIM kinase 1 (LIMK1), phospho-Cofilin, Cofilin, and GAPDH in cortical neurons without or with PAK3 downregulation.
- https://cdn.elifesciences.org/articles/89221/elife-89221-fig3-data2-v1.zip
-
Figure 3—source data 3
Western blot data for the levels of LIM kinase 1p21-activated kinase 3 (PAK3), phospho-LIMK1, LIM kinase 1 (LIMK1), phospho-Cofilin, Cofilin, and GAPDH in cortical neurons without or with PAK3 upregulation.
- https://cdn.elifesciences.org/articles/89221/elife-89221-fig3-data3-v1.zip
-
Figure 3—source data 4
Western blot data for the level of F/G-actin in cortical neurons in control, ionizing radiation (IR), and IR with p21-activated kinase 3 (PAK3) overexpression.
- https://cdn.elifesciences.org/articles/89221/elife-89221-fig3-data4-v1.zip
Figure 4 with 1 supplement
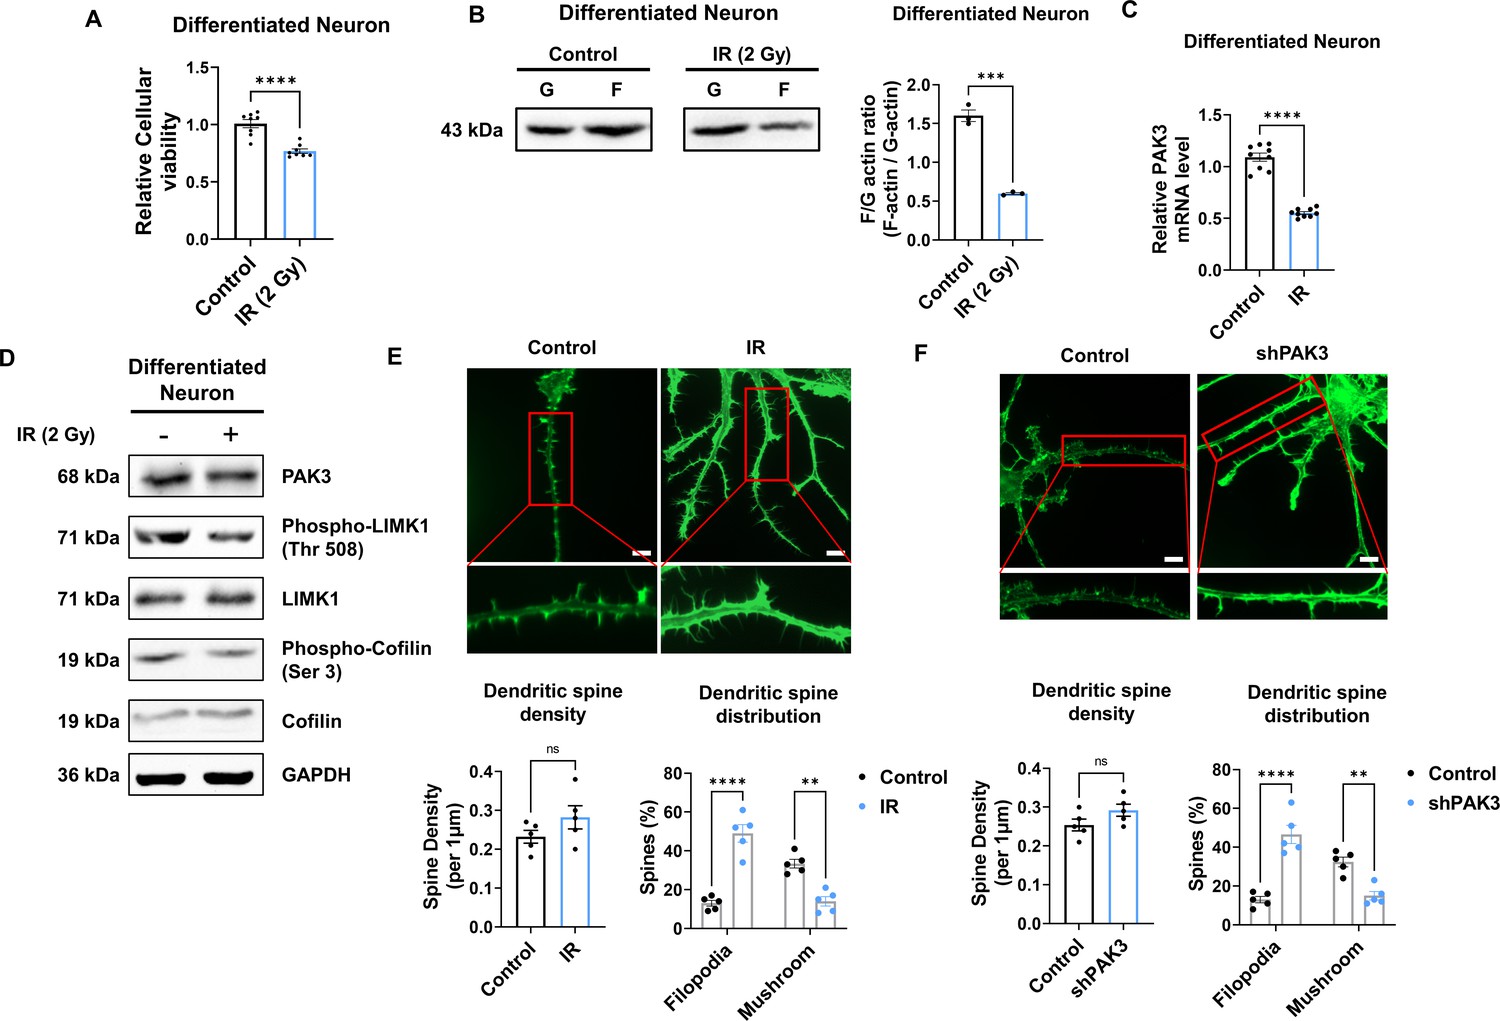
IR decreases PAK3-LIMK1-Cofilin signaling in differentiated human neuron.
(A) The filamentous/globular (F/G)-actin ratio after IR in differentiated neuron. Each F-actin and G-actin are quantified by ImageJ. (B) The mRNA level of p21-activated kinase 3 (PAK3) after ionizing radiation (IR) in differentiated neuron. (C) The protein levels of PAK3, phosphorylated LIMK1, LIM kinase 1 (LIMK1), phosphorylated cofilin, and cofilin after IR in differentiated neuron. (D) Upper: representative fluorescence image of filamentous actin (F-actin, green) after IR in differentiated neuron. Lower: the density and distribution of dendritic spine in IR group compared to control group. Scale bars, 10 μm. (E) Upper: representative fluorescence image of filamentous actin (F-actin, green) after PAK3 downregulation (shPAK3) in differentiated neuron. Lower: the density and distribution of dendritic spine in shPAK3 group compared to control group. Scale bars, 10 μm. Statistical analysis was performed with Student’s t-test for (A, B, D and E) and one-way ANOVA plus a Tukey’s multiple comparisons test for (D and E) ns, non-significant; **p<0.01; ***p<0.001; ****p<0.0001.
-
Figure 4—source data 1
Western blot data for the level of F/G-actin in differentiated neurons without or with ionizing radiation (IR).
- https://cdn.elifesciences.org/articles/89221/elife-89221-fig4-data1-v1.zip
-
Figure 4—source data 2
Western blot data for the levels of p21-activated kinase 3 (PAK3), phospho-LIMK1, LIM kinase 1 (LIMK1), phospho-Cofilin, Cofilin, and GAPDH in differentiated neurons without or with ionizing radiation (IR).
- https://cdn.elifesciences.org/articles/89221/elife-89221-fig4-data2-v1.zip
Figure 4—figure supplement 1
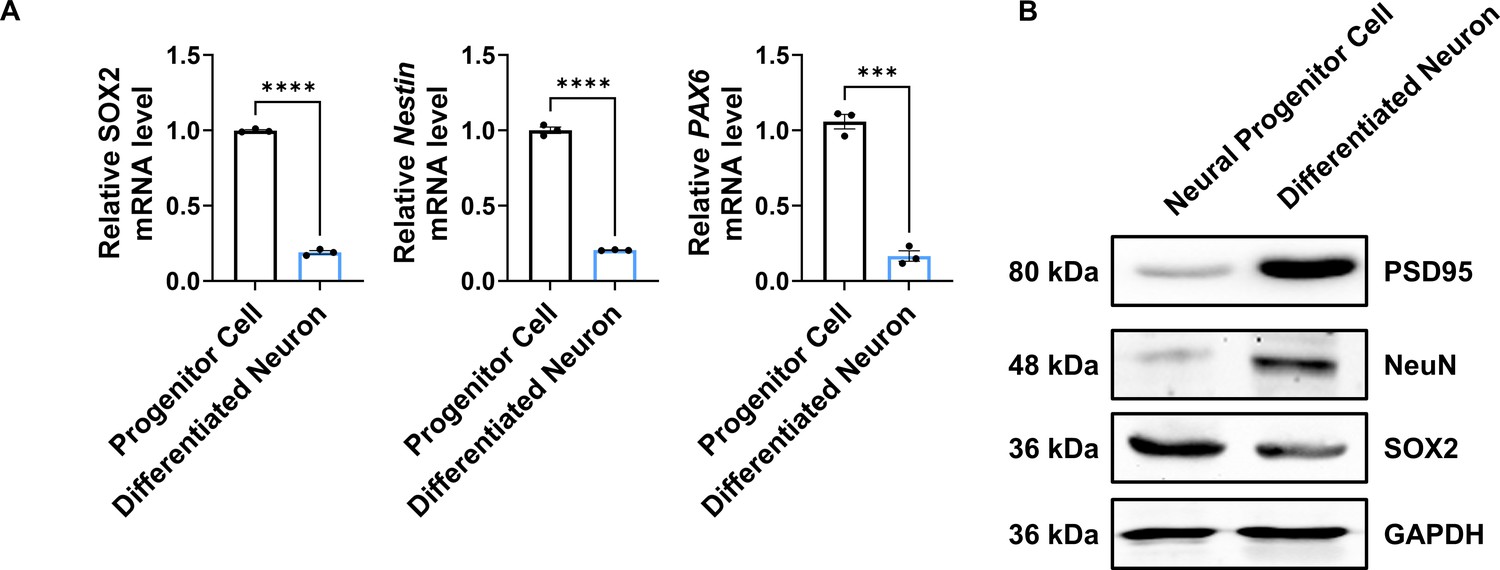
Neural progenitor cell is differentiated into human neuron.
(A) The mRNA levels of SOX2, Nestin, and PAX6 in neural progenitor cell and differentiated neuron. (B) The protein levels of PSD95, NeuN, SOX2, and GAPDH. Statistical analysis was performed with Student’s t-test. ***p<0.001; ****p<0.0001.
-
Figure 4—figure supplement 1—source data 1
Western blot data for the levels of PSD95, NeuN, SOX2, and GAPDH in neural progenitor cells and differentiated neurons.
- https://cdn.elifesciences.org/articles/89221/elife-89221-fig4-figsupp1-data1-v1.zip
Figure 5 with 1 supplement
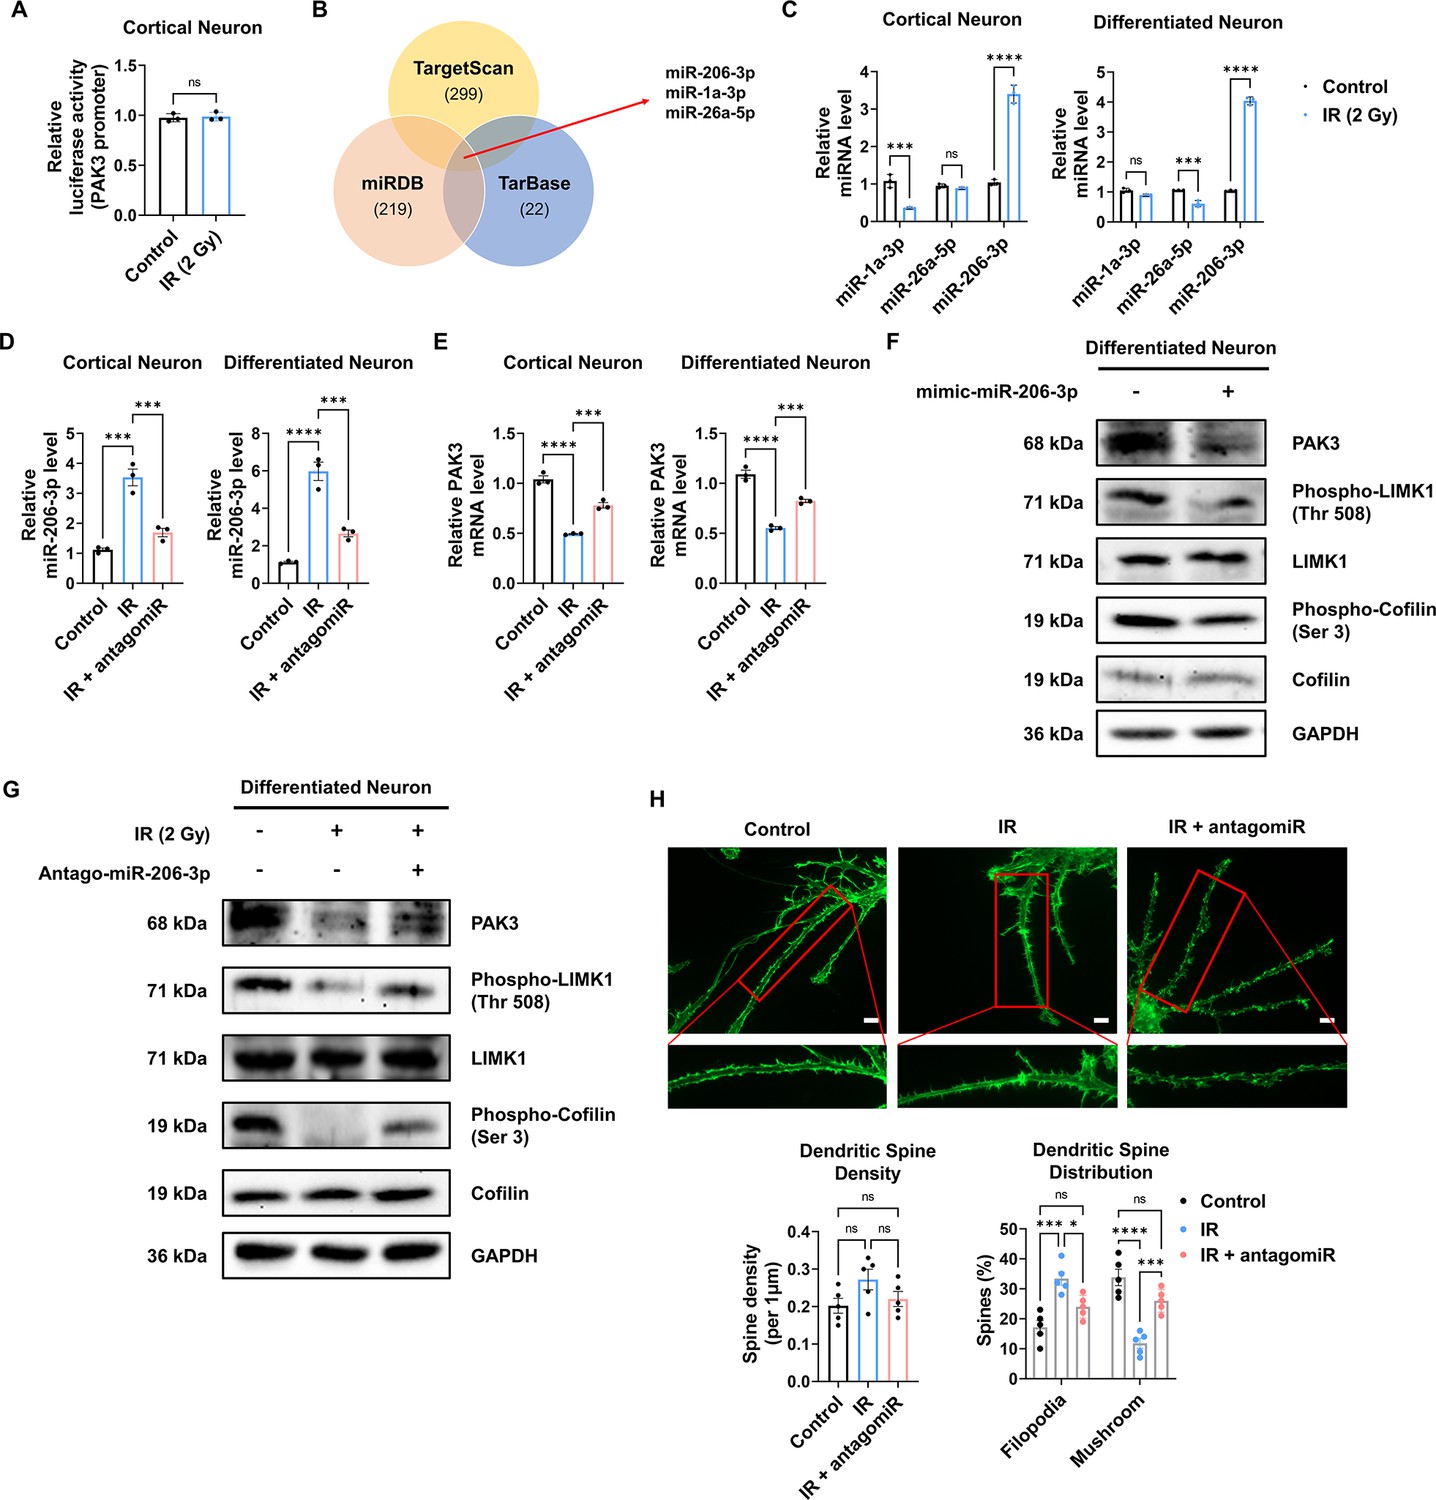
IR-induced miR-206–3 p affects PAK3-LIMK1-cofilin signaling.
(A) The relative luciferase activity of PAK3 promoter after ionizing radiation (IR) in cortical neuron. (B) Venn diagram of predictable PAK3-targeting miRNAs from databases (miRDB, TargetScan, and TarBase). (C) The relative miRNA expression of three overlapped miRNAs after IR in cortical neuron and differentiated neuron. (D) The relative miRNA expression of miR-206–3 p after IR and/or antagomiR-206–3 p treatment in cortical neuron and differentiated neuron. (E) The mRNA level of PAK3 after IR and/or treatment of antagomiR-206–3 p in cortical neuron and differentiated neuron. (F) The protein levels of PAK3, phosphorylated LIMK1, LIM kinase 1 (LIMK1), phosphorylated cofilin, and cofilin after treatment of miR-206–3 p mimic in differentiated neuron. (G) The protein levels of p21-activated kinase 3 (PAK3), phosphorylated LIMK1, LIMK1, phosphorylated cofilin, and cofilin after IR and/or treatment of antagomiR-206–3 p in differentiated neuron. (H) Upper: representative fluorescence image of filamentous actin (F-actin, green) after IR and/or treatment of antagomiR-206–3 p in cortical neuron. Lower: the density and distribution of dendritic spine in control, IR and/or treatment of antagomiR-206–3 p group. Scale bars, 10 μm. Statistical analysis was performed with Student’s t-test for (A) and one-way ANOVA plus a Tukey’s multiple comparisons test for the others. ns, non-significant; ***p<0.001; ****p<0.0001.
-
Figure 5—source data 1
Western blot data for the levels of p21-activated kinase 3 (PAK3), phospho-LIMK1, LIM kinase 1 (LIMK1), phospho-Cofilin, Cofilin, and GAPDH in differentiated neurons without or with the treatment of miR-206–3 p mimic.
- https://cdn.elifesciences.org/articles/89221/elife-89221-fig5-data1-v1.zip
-
Figure 5—source data 2
Western blot data for the level of F/G-actin in differentiated neurons in control, ionizing radiation (IR), and IR with the treatment of antagomiR-206–3 p.
- https://cdn.elifesciences.org/articles/89221/elife-89221-fig5-data2-v1.zip
Figure 5—figure supplement 1
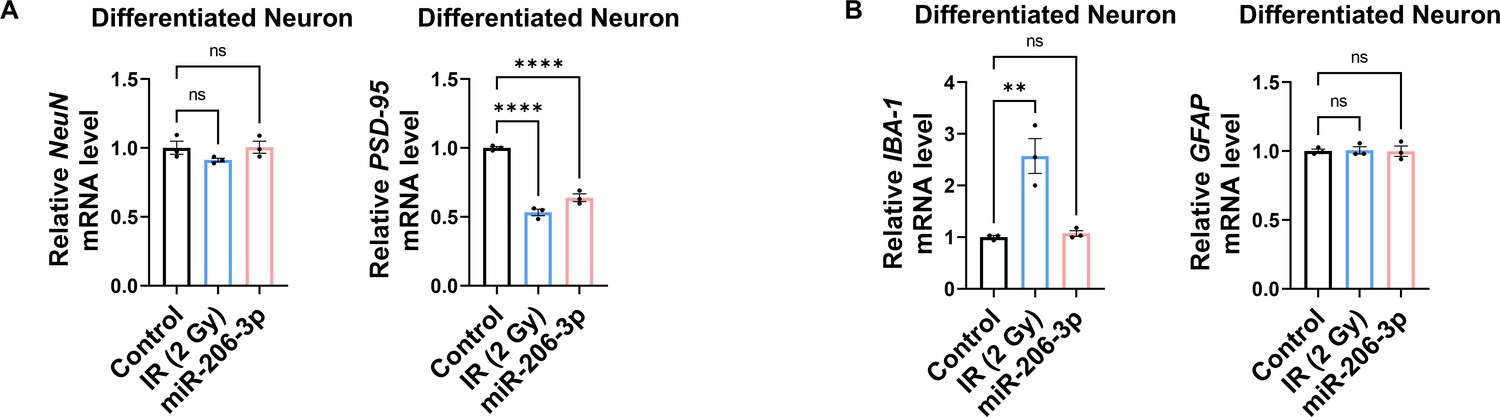
miR-206–3 p affects only PSD-95 but not other neuronal and non-neuronal markers.
(A) The mRNA levels of NeuN and PSD-95 after IR 2 Gy or miR-206–3 p in differentiated neuron. (B) The mRNA levels of IBA-1 and GFAP after IR 2 Gy or miR-206–3 p in differentiated neuron. Statistical analysis was performed with one-way ANOVA plus a Tukey’s multiple comparisons test. ns, non-significant; **p<0.01; ****p<0.0001.
Figure 6 with 2 supplements
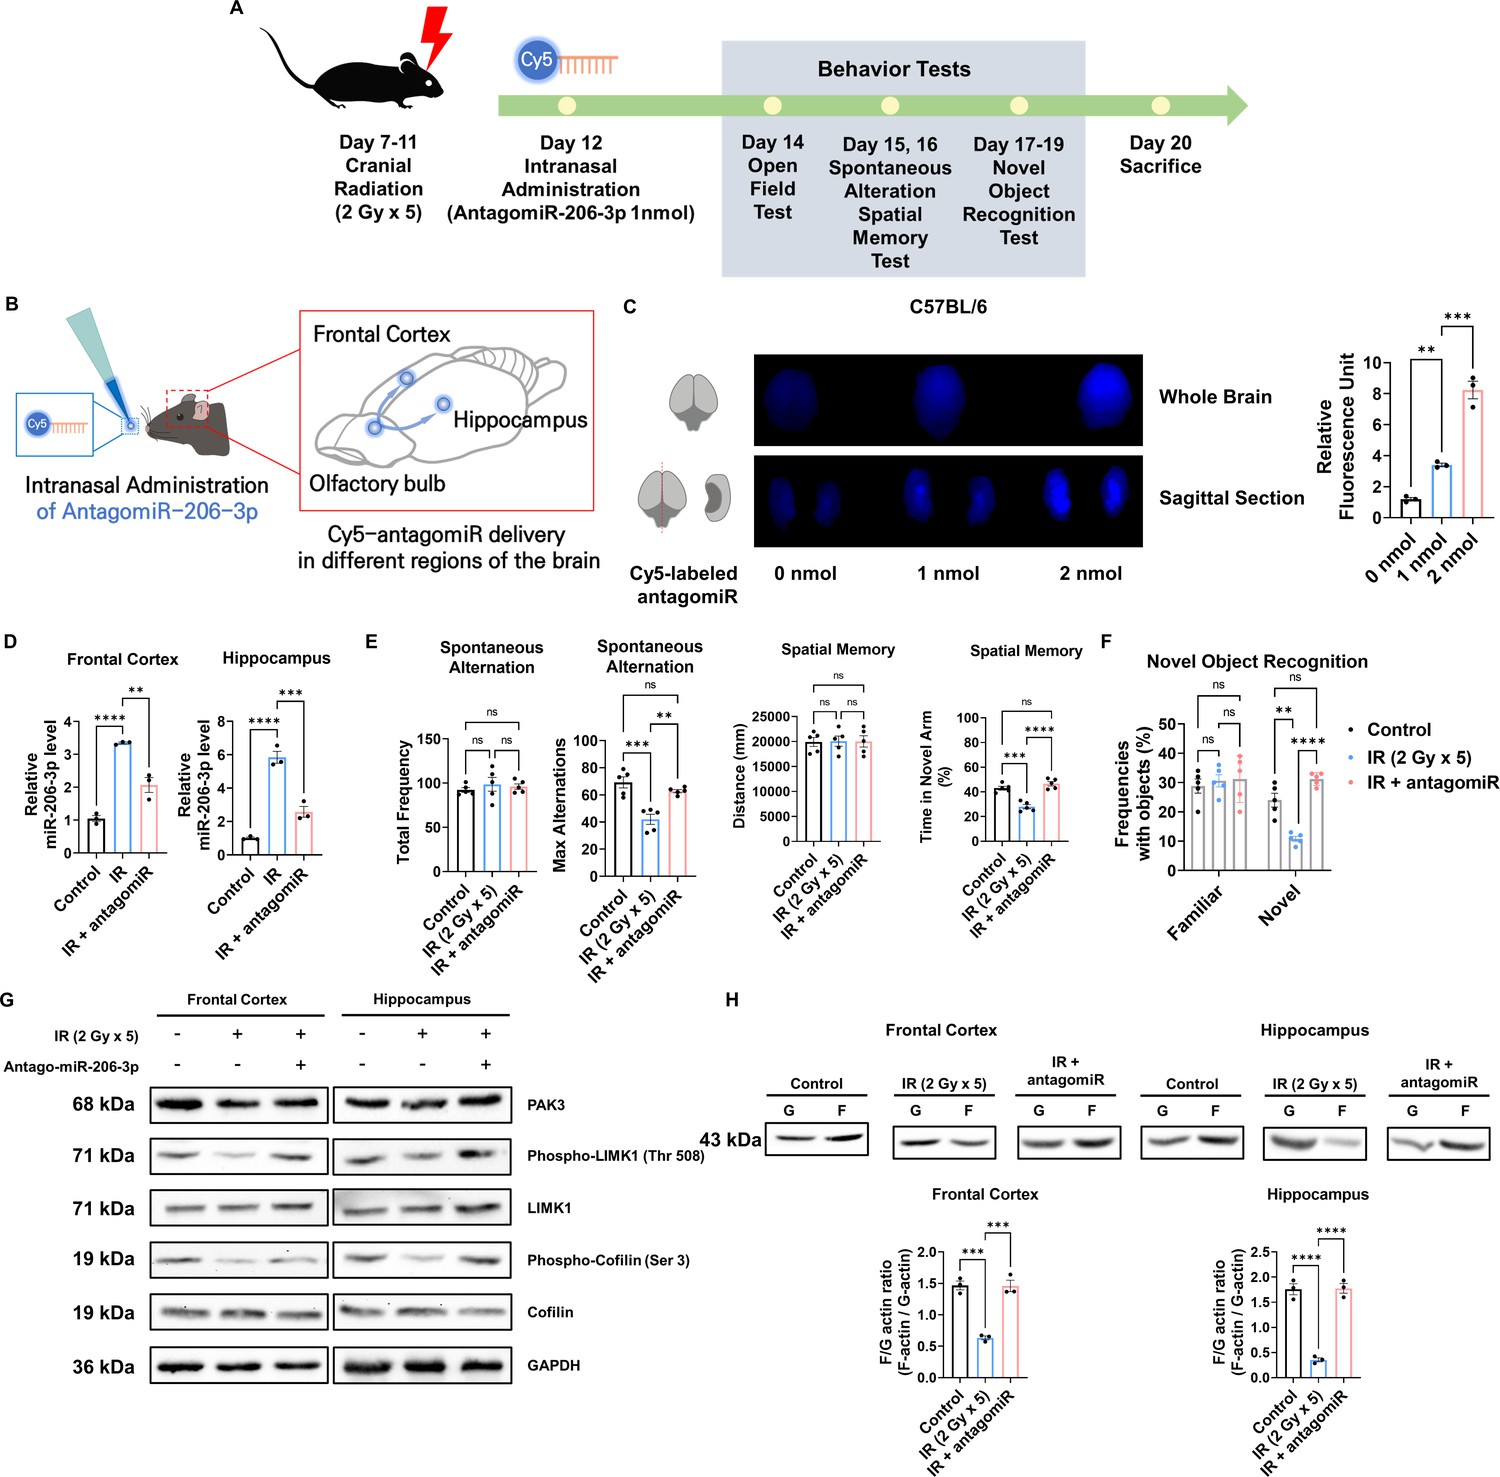
Intranasal administration of antagomiR-206–3 p recovers p21-activated kinase 3 (PAK3) signaling and cognitive impairment after ionizing radiation (IR).
(A) A scheme illustrating the schedule of IR and antagomiR-206–3 p treatment and overall behavioral tests. (B) Schematic illustration of antagomir-206–3 p delivery via intranasal administration. (C) The fluorescence images and relative units of cy5-antagomiR-206–3 p in the brain of mice 24 hr after intranasal administration. (D) The relative miRNA expression of miR-206–3 p after IR and/or antagomiR-206–3 p treatment in frontal cortex and hippocampus. (E) The results of spontaneous alteration (left) and spatial memory test (right) after IR and/or antagomiR-206–3 p using Y-maze. The parameters of spontaneous alteration are described in methods. (F) The result of novel object recognition test after IR and/or antagomiR-206–3 p. (G) The protein levels of PAK3, phosphorylated LIMK1, LIMK1, phosphorylated cofilin, and cofilin after IR and/or treatment of antagomiR-206–3 p in frontal cortex and hippocampus. (H) The alterations of F/G-actin ratio after IR and/or treatment of antagomiR-206–3 p in frontal cortex and hippocampus. Statistical analysis was performed with one-way ANOVA plus a Tukey’s multiple comparisons test. ns, non-significant; **p<0.01; ***p<0.001; ****p<0.0001.
-
Figure 6—source data 1
Western blot data for the levels of p21-activated kinase 3 (PAK3), phospho-LIMK1, LIM kinase 1 (LIMK1), phospho-Cofilin, Cofilin, and GAPDH in frontal cortex and hippocampus in control, ionizing radiation (IR), and IR with treatment of antagomiR-206–3 p.
- https://cdn.elifesciences.org/articles/89221/elife-89221-fig6-data1-v1.zip
-
Figure 6—source data 2
Western blot data for the level of F/G-actin in frontal cortex and hippocampus in control, ionizing radiation (IR), and IR with treatment of antagomiR-206–3 p.
- https://cdn.elifesciences.org/articles/89221/elife-89221-fig6-data2-v1.zip
Figure 6—figure supplement 1
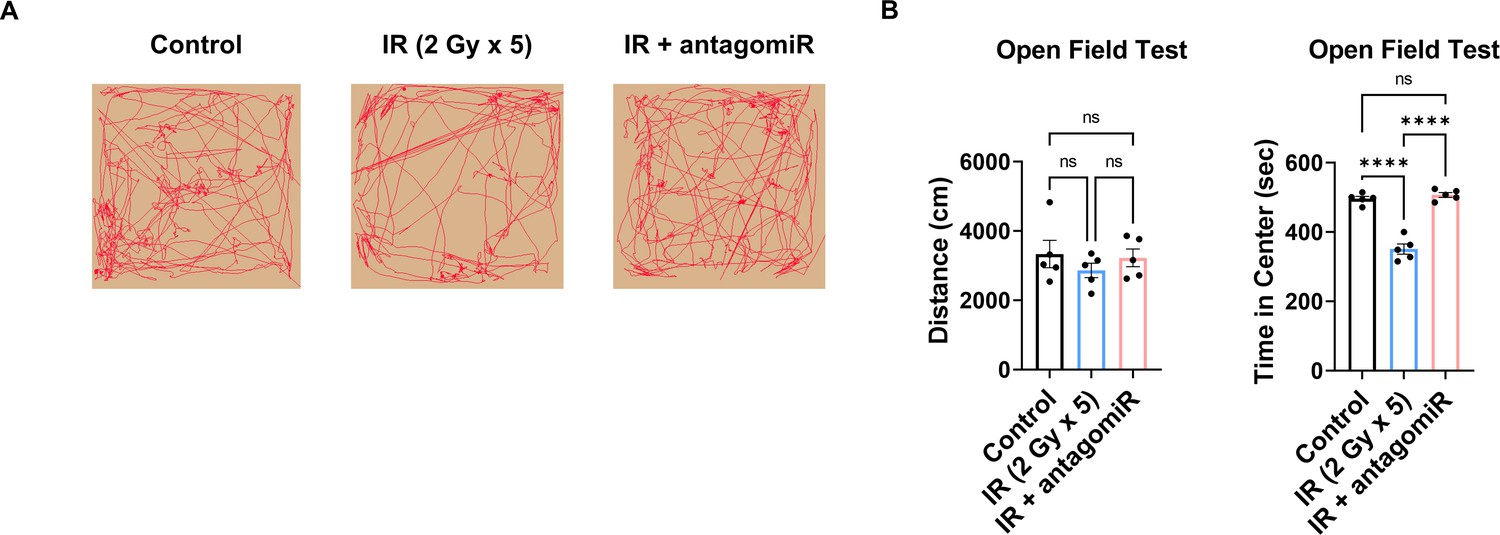
AntagomiR-206–3 p attenuates depressive-like behavior.
(A) The representative heatmaps of open field test after ionizing radiation (IR) or IR with antagomiR-206–3 p. (B) The result of open field test after IR or IR with antagomiR-206–3 p. Statistical analysis was performed with one-way ANOVA plus a Tukey’s multiple comparisons test. ns, non-significant; ****p<0.0001.
Figure 6—figure supplement 2

Summary of alterations to p21-activated kinase 3 (PAK3) signaling in dendritic spine upon ionizing radiation (IR) exposure.
Cranial irradiation impairs the maturation of dendritic spines by decreasing PAK3 signaling. Briefly, cranial irradiation increases miR-206–3 p, which targets PAK3 and decreases its levels. Decreased PAK3 reduces the phosphorylation of LIMK and cofilin, resulting in decreased actin polymerization. This leads to a reduction in the ratio of F-actin to G-actin, which in turn impairs the maturation of dendritic spines. As a result, cognitive function is impaired via dendritic spines.
Additional files
-
Supplementary file 1
Primers for determining levels of gene expression.
This table provides a comprehensive list of the primers used in this study. For each gene and microRNA, the specific forward and reverse primer sequences are detailed. The sequences are presented in a 5' to 3' direction.
- https://cdn.elifesciences.org/articles/89221/elife-89221-supp1-v1.docx
-
MDAR checklist
- https://cdn.elifesciences.org/articles/89221/elife-89221-mdarchecklist1-v1.docx
Download links
A two-part list of links to download the article, or parts of the article, in various formats.
Downloads (link to download the article as PDF)
Open citations (links to open the citations from this article in various online reference manager services)
Cite this article (links to download the citations from this article in formats compatible with various reference manager tools)
PAK3 downregulation induces cognitive impairment following cranial irradiation
eLife 12:RP89221.
https://doi.org/10.7554/eLife.89221.3


