Risk-sensitive learning is a winning strategy for leading an urban invasion
- Department of Human Behavior, Ecology and Culture, Max Planck Institute for Evolutionary Anthropology, Germany
- Science of Intelligence Excellence Cluster, Technical University Berlin, Germany
- Center for Adaptive Rationality, Max Planck Institute for Human Development, Germany
Figures
Figure 1
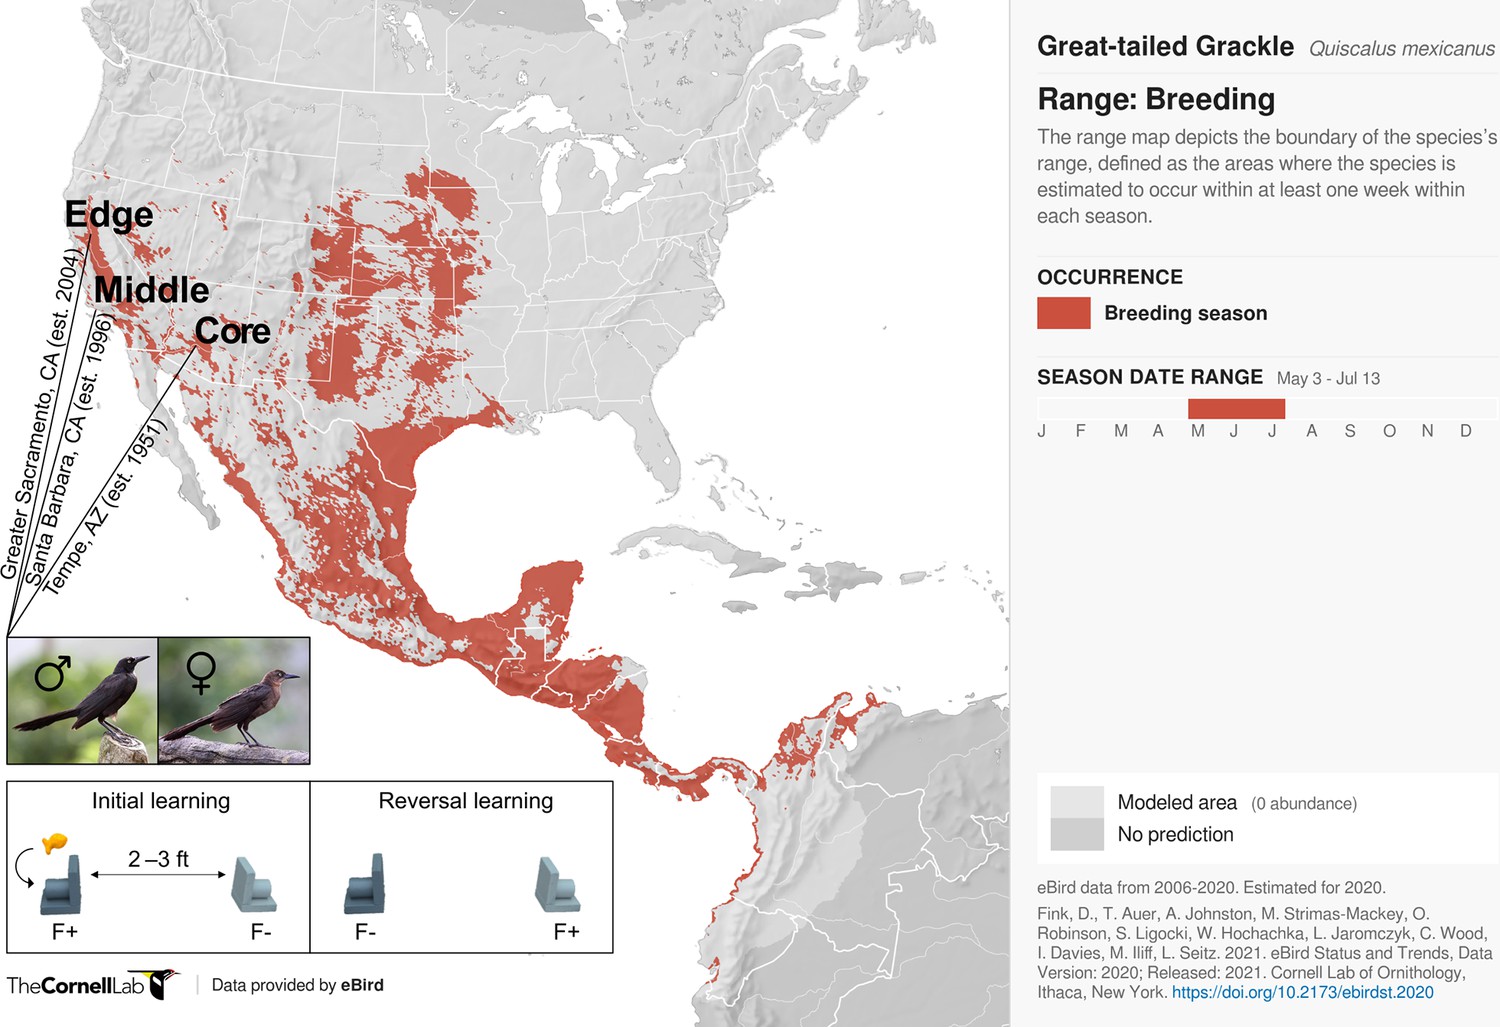
Participants and experimental protocol.
Thirty-two male and 17 female wild-caught, temporarily captive great-tailed grackles either inhabiting a core (17 males, 5 females), middle (4 males, 4 females), or edge (11 males, 8 females) population of their North American breeding range (establishment year: 1951, 1996, and 2004, respectively) are participants in the current study (grackle images: Wikimedia Commons). Each grackle is individually tested on a two-phase reinforcement learning paradigm: initial learning, two colour-distinct tubes are presented, but only one coloured tube (e.g., dark grey) contains a food reward (F+ versus F-); reversal learning, the stimulus-reward tube pairings are swapped. The learning criterion is identical in both learning phases: 17 F+ choices out of the last 20 choices, with trial 17 being the earliest a grackle can successfully finish (for details, see Materials and methods).
Figure 2 with 1 supplement
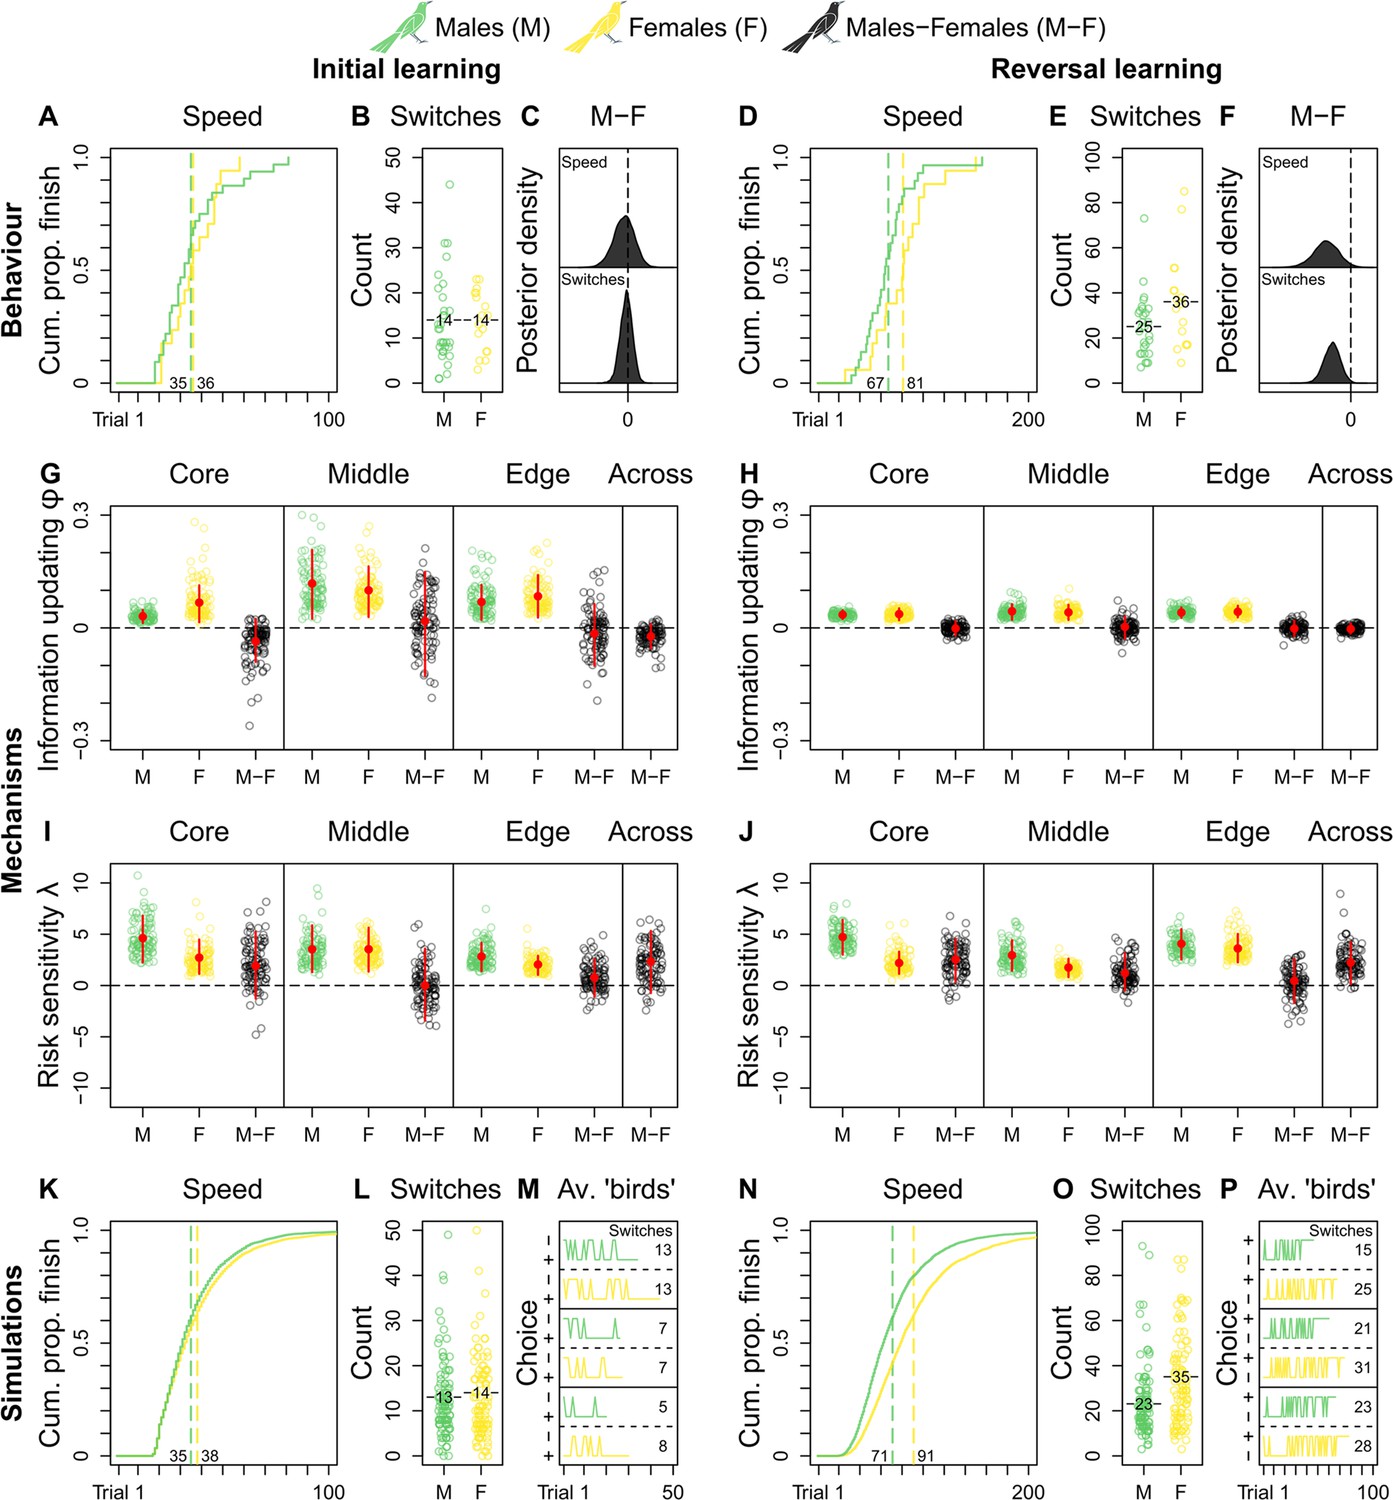
Grackle reinforcement learning.
Behaviour. Across-population reinforcement learning speed and choice-option switches in (A–B) initial learning (M, 32; F, 17) and (D–E) reversal learning (M, 29; F, 17), with (C, F) respective posterior estimates and male-female (M-F) contrasts. Mechanisms. Within- and across-population estimates and contrasts of information-updating rate φ and risk-sensitivity rate λ in (G, I) initial learning and (H, J) reversal learning. In (G–J) open circles show 100 random posterior draws; red filled circles and red vertical lines show posterior means and 89% highest posterior density intervals, respectively. Simulations. Across-population forward simulated reinforcement learning speed and choice-option switches in (K–M) initial learning and (N–P) reversal learning. In (K, N) the full simulation sample is plotted; in (L, O) open circles show 100 random simulant draws; and (M, P) show three random ‘average’ M or F simulants. Note (K, N) x-axes are cut to match (A, D) x-axes. Means are plotted/labelled in (A, B, D, E, K, L, N, O). Plots (G–P) are generated via model estimates using our full sample size (M, 32; F, 17).
Figure 2—figure supplement 1
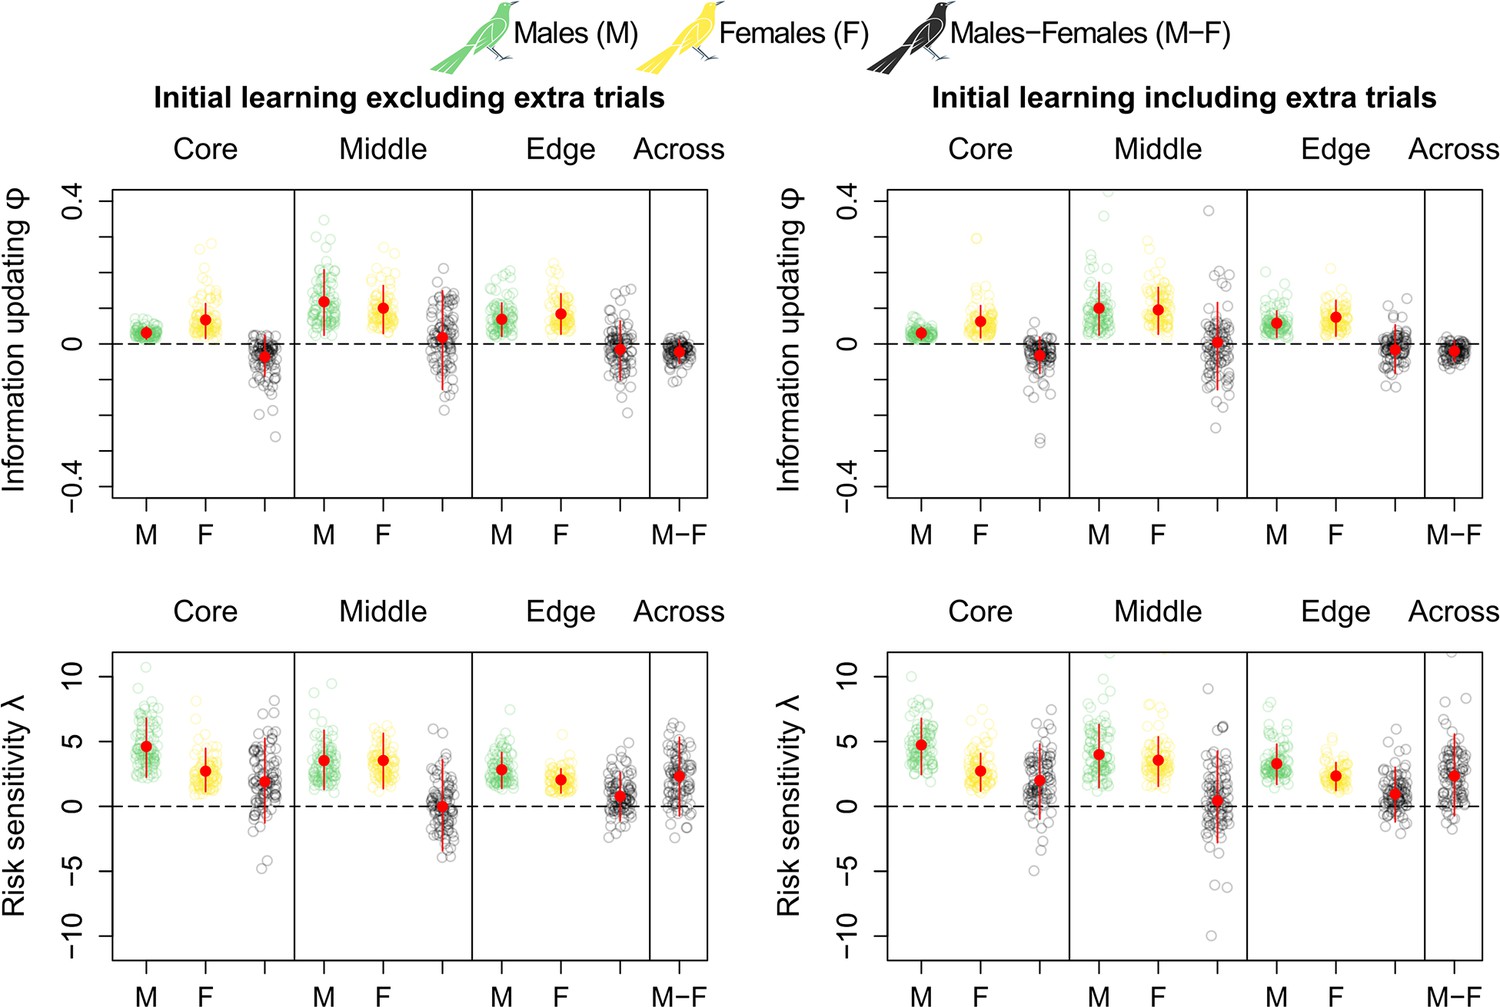
Extra initial learning trials do not noticeably influence grackles’ reversal learning.
Comparison of information-updating rate Φ and risk-sensitivity rate λ estimates (top and bottom row, respectively) in initial learning excluding and including extra initial learning trials (left and right column, respectively), which are present in the original data set (see Materials and methods). Because this comparison does not show any noticeable difference depending on their inclusion or exclusion, we excluded extra learning trials from our analyses. All plots are generated via model estimates using our full sample size: 32 males and 17 females.
Figure 3
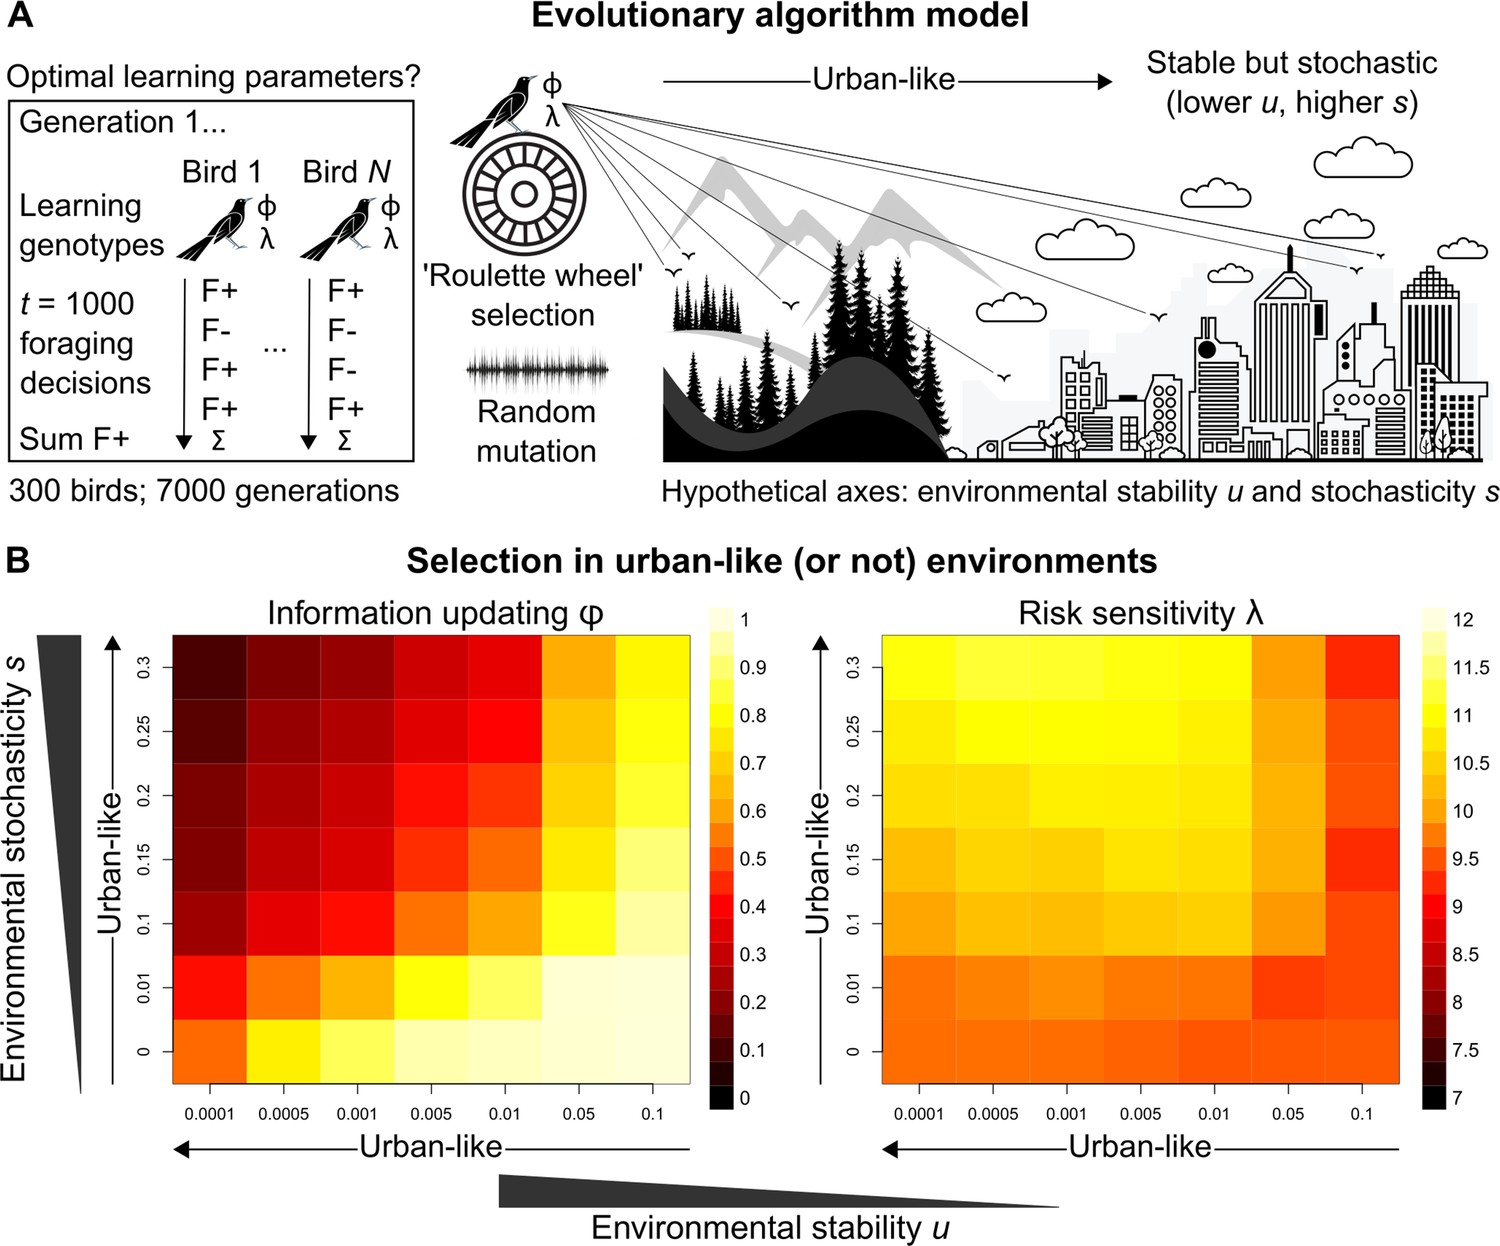
Evolutionary optimality of strategising risk-sensitive learning.
(A) Illustration of our evolutionary algorithm model to estimate optimal learning parameters that evolve under systematically varied pairings of two hypothesised urban ecology axes: environmental stability u and environmental stochasticity s. Specifically, 300-member populations run for 10 independent 7000-generation simulations per pairing, using ‘roulette wheel’ selection (parents are chosen for reproduction with a probability proportional to collected F+ rewards out of 1000 choices) and random mutation (offspring inherit learning genotypes with a small deviation in random direction). (B) Mean optimal learning parameter values discovered by our evolutionary model (averaged over the last 5000 generations). As the statistical environment becomes seemingly more urban-like (lower and higher values), selection should favour lower information-updating rate φ and higher risk-sensitivity rate λ (darker and lighter squares in left and right plot, respectively). We note arrows are intended as illustrative aids and do not correspond to a linear scale of ‘urbanness’.
Additional files
-
Supplementary file 1
Study preregistration, including reinforcement learning model validation.
- https://cdn.elifesciences.org/articles/89315/elife-89315-supp1-v1.pdf
-
Supplementary file 2
Supplementary tables.
(a) Total-trials-in-test Poisson regression model output. (b) Total-choice-option-switches-in-test Poisson regression model output. (c) Bayesian reinforcement learning model information-updating rate φ output. (d) Bayesian reinforcement learning model risk-sensitivity rate λ output. For (a–d), both between- and across-population posterior means and corresponding 89% highest-posterior density intervals are reported for males, females, and male-female contrasts.
- https://cdn.elifesciences.org/articles/89315/elife-89315-supp2-v1.docx
-
MDAR checklist
- https://cdn.elifesciences.org/articles/89315/elife-89315-mdarchecklist1-v1.pdf
Download links
A two-part list of links to download the article, or parts of the article, in various formats.
Downloads (link to download the article as PDF)
Open citations (links to open the citations from this article in various online reference manager services)
Cite this article (links to download the citations from this article in formats compatible with various reference manager tools)
Risk-sensitive learning is a winning strategy for leading an urban invasion
eLife 12:RP89315.
https://doi.org/10.7554/eLife.89315.3


