DNA methylation-environment interactions in the human genome
- Department of Evolutionary Anthropology, Duke University, United States
- Zoo New England, United States
- Broad Institute of MIT and Harvard, United States
- Department of Human Genetics, University of Chicago, United States
- Section of Genetic Medicine, Department of Medicine, University of Chicago, United States
- Committee on Immunology, University of Chicago, United States
- Department of Biological Sciences, Vanderbilt University, United States
- Canadian Institute for Advanced Research, Canada
- Duke Population Research Institute, Duke University, United States
- Department of Biology, Duke University, United States
- Department of Primate Behavior and Evolution, Max Planck Institute for Evolutionary Anthropology, Germany
Figures
Figure 1 with 11 supplements
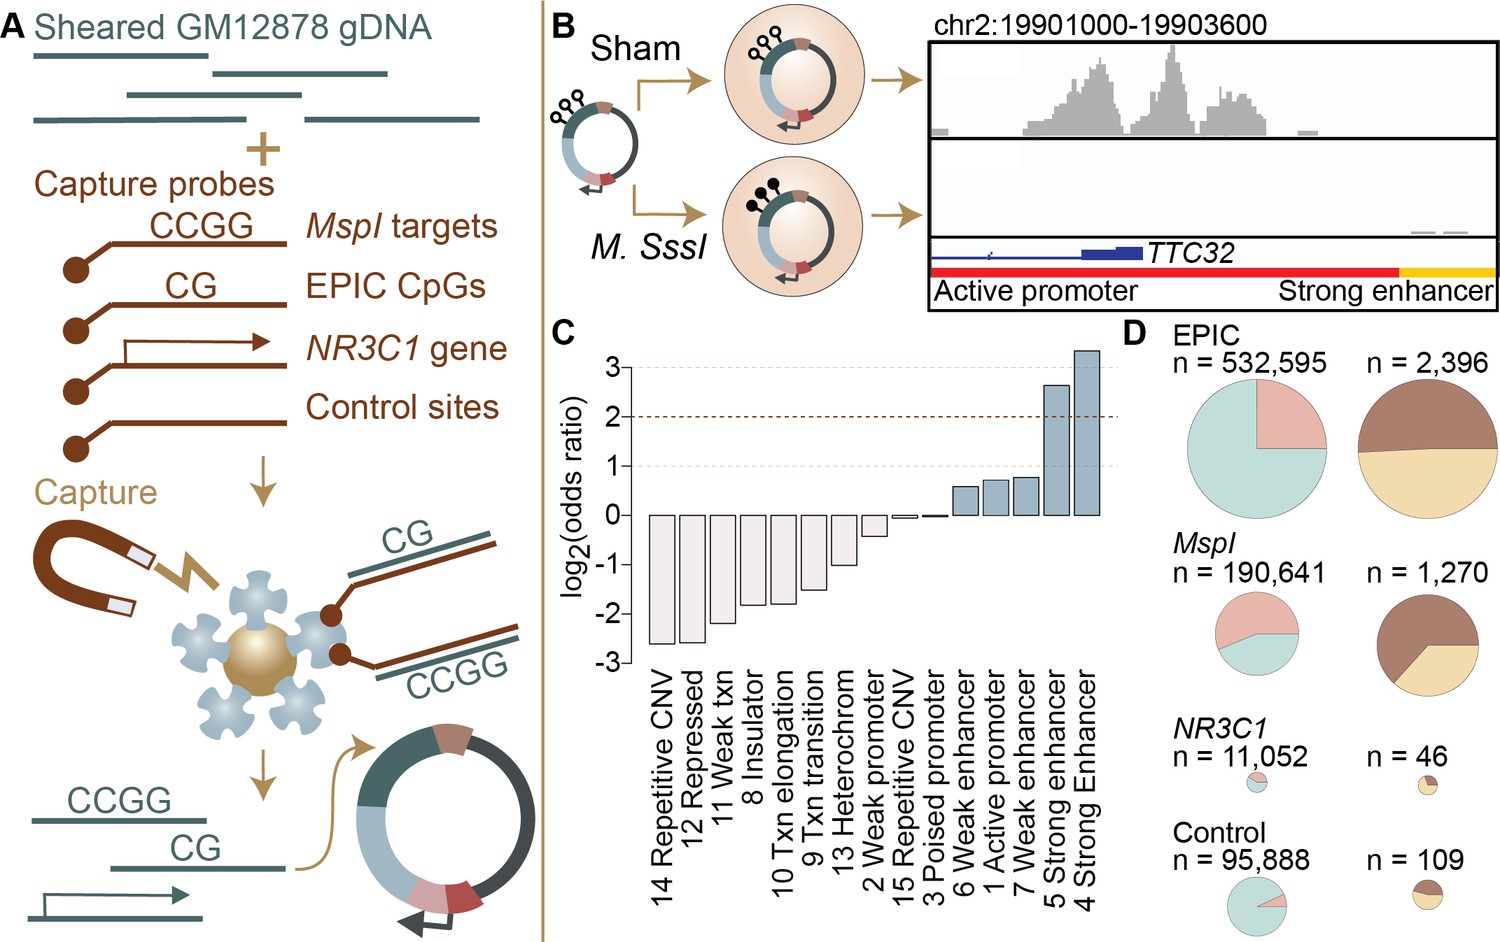
Study design and identification of enhancer activity.
(A) Sheared DNA from the GM12878 cell line was subjected to enrichment via capture with probes targeting loci selected in reduced representation bisulfite sequencing (RRBS) workflows (MspI targets), CpG sites on the Infinium EPIC array, the gene NR3C1 and flanking regions, and 100,000 randomly distributed control regions. Note that a single 600 bp window can contain multiple target types (Figure 1—figure supplement 1). Library diversity summaries are shown in Figure 1—figure supplement 2. (B) Captured loci were cloned into the mSTARR-seq vector, pmSTARRseq1, treated with either the CpG methylating enzyme M. SssI or a sham treatment, and transfected into K562 cells. Methylation levels post-transfection and rarefaction analyses of sequencing depth of replicate samples are shown in Figure 1—figure supplements 3 and 4. Right panel shows an example of DNA methylation-dependent regulatory activity near the first exon of the TTC32 gene, where the methylation-dependent regulatory element overlaps an active promoter chromatin state (red horizontal bar denotes active promoter as defined by ENCODE: The ENCODE Project Consortium, 2012). (C) mSTARR-seq regulatory activity in the baseline condition is strongly enriched in ENCODE-defined enhancers and some classes of promoters (indicated in blue), and depleted in repressed, repetitive, and heterochromatin states. See Supplementary file 4 for full results of this analysis. Regions with mSTARR-seq regulatory activity detected in this experiment also significantly overlap with regions with regulatory activity in other mSTARR-seq and conventional STARR-seq datasets (Figure 1—figure supplement 5; see also Figure 1—figure supplement 6 for estimates of concordance across technical replicates). (D) Left column shows, under the baseline condition (i.e. unstimulated cells), the proportion of 600 bp windows that exhibited minimal regulatory activity (at least 3 replicate samples produced non-zero RNA-seq reads in either the methylated condition or the unmethylated condition) in the mSTARR-seq assay (pink) versus those with detectable input DNA but no evidence of regulatory activity (blue), for windows containing sites from each target set. Right column shows the proportion of windows with regulatory capacity (i.e., the subset of the windows represented in pink on the left that produce excess RNA relative to the DNA input at FDR <1%) that are also methylation-dependent (dark brown). Within each column, pie charts are scaled by the total numbers of windows represented. See Figure 1—figure supplements 7 and 8 for comparisons to regulatory regions in other datasets. Figure 1—figure supplements 9 and 10 show window-level RNA to DNA ratios. Figure 1—figure supplement 11 shows the relationship between CpG density and methylation-dependent regulatory activity.
Figure 1—figure supplement 1
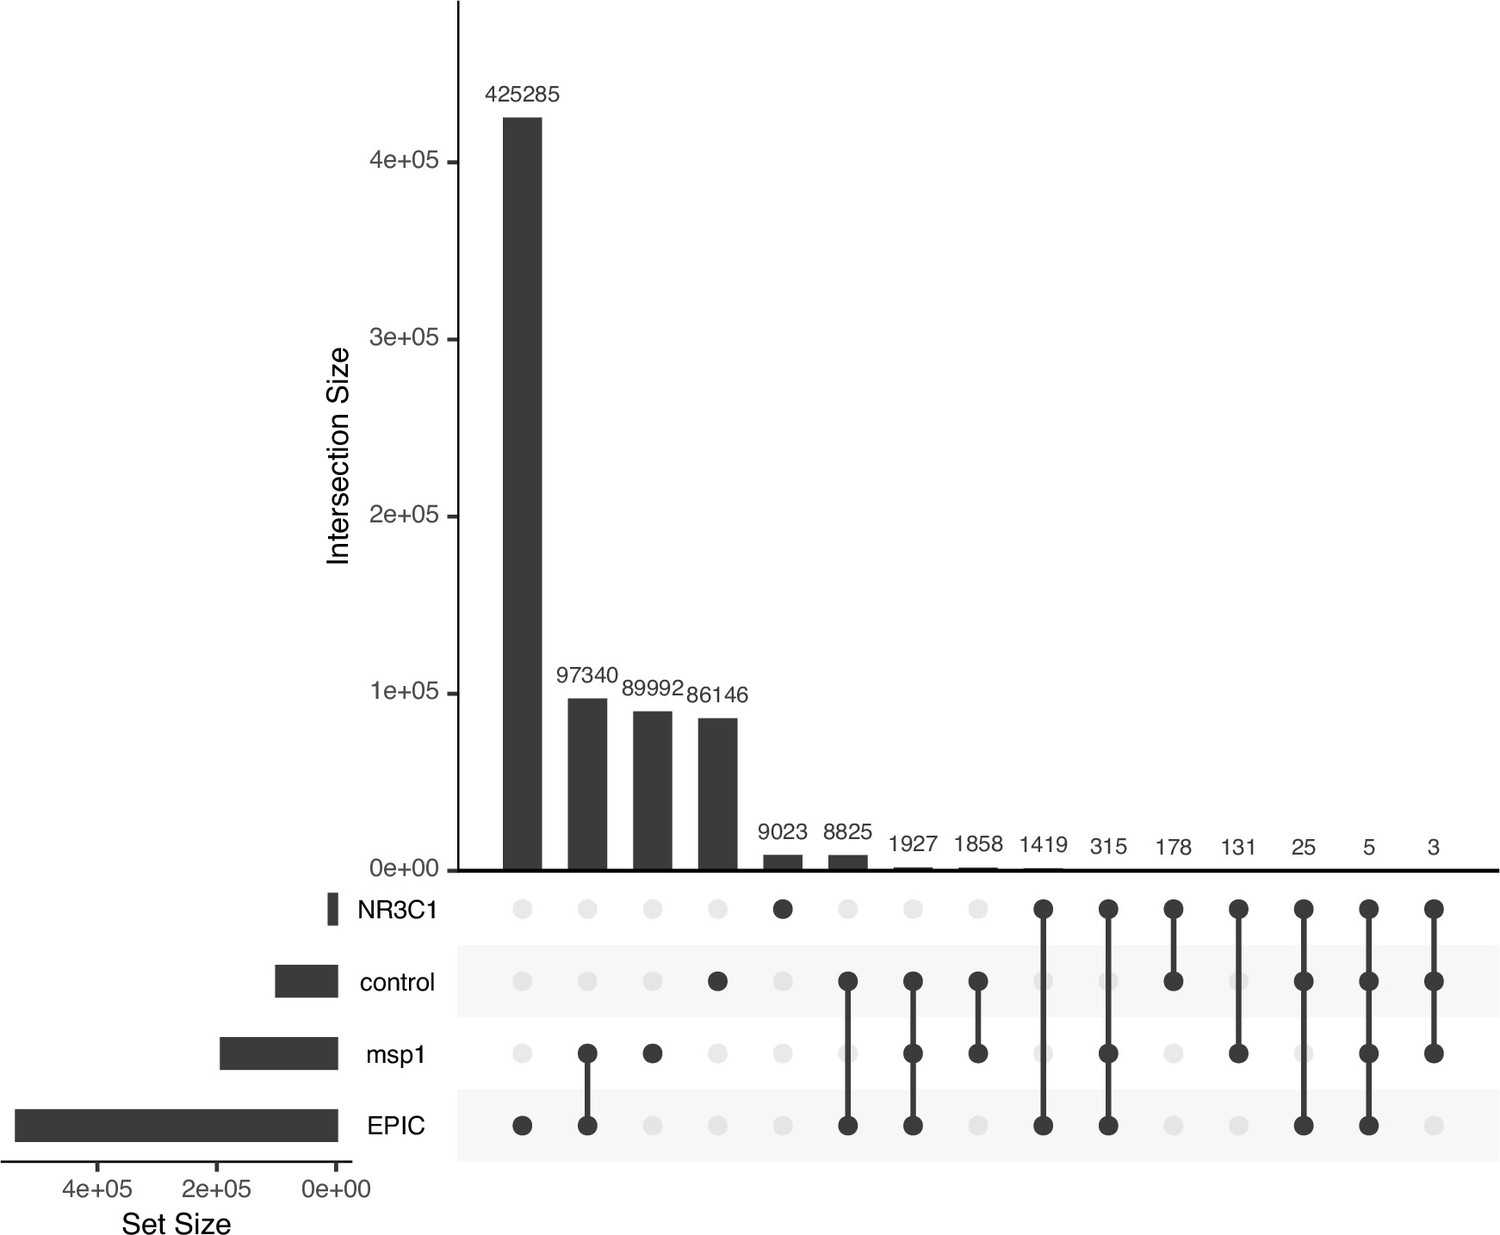
Overlap of target genomic regions with each other.
Upset plot showing the degree to which 600 bp non-overlapping genomic windows are shared between the four target genomic regions (EPIC CpGs, Msp1 CpG cut sites, the NR3C1 region, or control sites). Overlap occurs because a single 600 bp genomic window can simultaneously include EPIC CpGs, Msp1 CpG cut sites, the NR3C1 region, and/or control sites. This plot includes 722,472 unique windows, reflecting the set of windows containing at least 1 basepair of sequence in the target loci.
Figure 1—figure supplement 2

mSTARR-seq library diversity.
Comparison of diversity of unique mSTARR-seq DNA and RNA fragments from the library generated in this study (transfected into K562 cells) relative to the library published in Lea et al., 2018 (independently transfected into K562 cells). Each dot represents an experimental replicate (Lea DNA replicates n=12; Lea RNA n=12; current DNA replicates n=35; current RNA replicates n=35). Each box represents the interquartile range, with the median value depicted as a horizontal bar. Whiskers extend to the most extreme values within 1.5 x of the interquartile range.
Figure 1—figure supplement 3
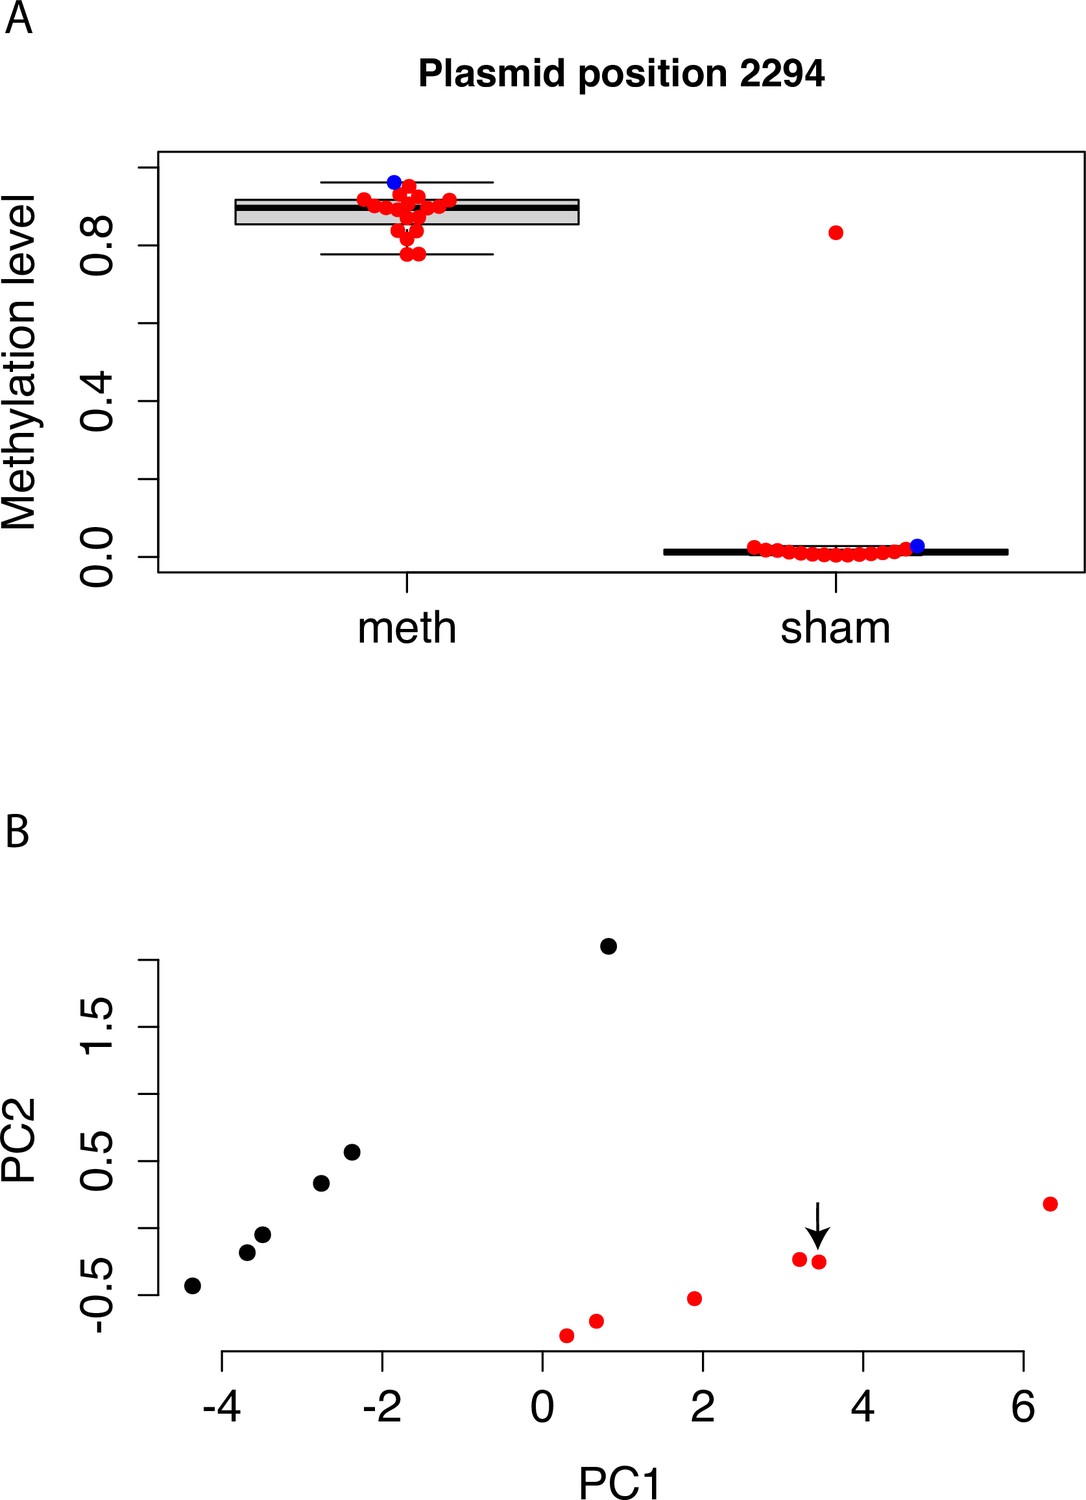
Methylation levels of mSTARR-seq DNA, pre- and post-transfection.
(A) Bisulfite sequencing shows that DNA methylation on the mSTARR-seq plasmid is maintained until the end of the experiment (i.e. 48 hr after transfection), with significantly higher methylation levels in the replicates from the methyltransferase reaction relative to the replicates from the sham methyltransferase reaction (mean methylated = 0.885 [n=17], mean unmethylated = 0.066 [n=15]; unpaired t-test: t=–14.66, df=15.124, p=2.39 x 10⁻¹⁰). Each dot represents an experimental replicate. Red dots indicate post-transfection DNA samples; the single blue dot per condition indicates pre-transfection DNA methylation levels. Methylation estimates are based on the CpG at the position 2294, which is located in the plasmid region used for Gibson assembly. We assessed methylation of this CpG, rather than across CpGs genome-wide, because the genomic coverage of our bisulfite sequencing data across replicates was too variable to perform reliable site-by-site analysis of DNA methylation levels before and after the 48 hr experiment. One sample from the dex sham reaction, L31395, shows an unexpectedly high level of methylation, which appears to be due to an error during generation of the bisulfite sequencing library (e.g. mislabeled tube or poor bisulfite conversion), and not the experimental replicate of cells itself, as the mSTARR-seq RNA library (L31244) from the same replicate clusters with the unmethylated sham replicates as expected (panel B). (B) The first two principal components summarizing overall counts of mSTARR-seq reads for the dex-treated RNA samples (i.e. the raw readout of overall regulatory activity). Each dot represents an experimental replicate, with red and black indicating sham and methylated replicates, respectively. Overall regulatory activity of sample L31244 (indicated by arrow) clusters with the sham replicates as expected, suggesting that this replicate was indeed transfected with sham-treated mSTARR-seq DNA.
Figure 1—figure supplement 4
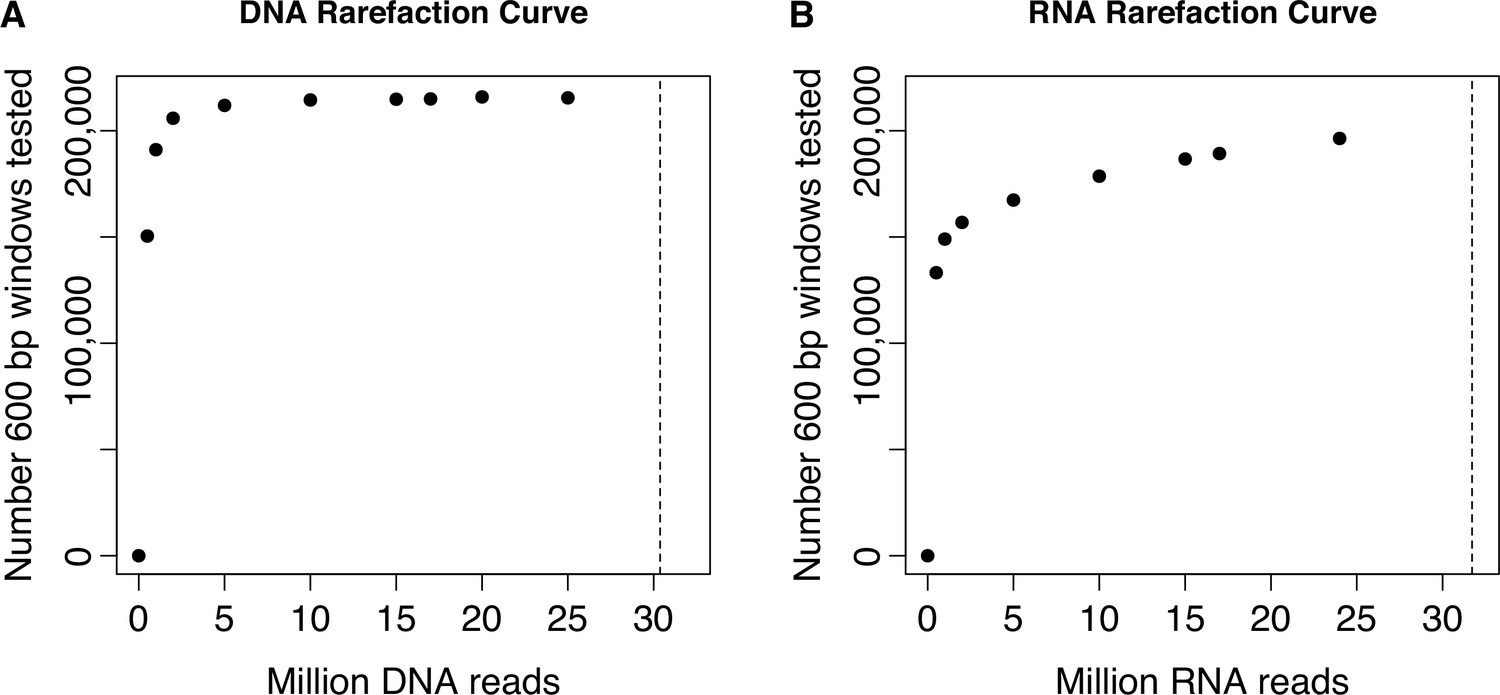
Rarefaction curve showing total number of windows formally tested for regulatory activity, as a function of number of reads sequenced per DNA or RNA replicate.
Sequencing reads from the (A) DNA replicates or (B) RNA replicates of the baseline dataset were rarefied to the values shown on the x-axis before running the data processing steps and applying the filtering criteria described in the Materials and Methods for the full data set. Dashed vertical lines represent the mean number of sequenced reads per DNA replicate (mean [SD]=30.375 million [3.335 million]) or RNA replicate (mean [SD]=31.712 million [8.194 million]) in the full baseline dataset. These analyses show that our sequencing effort saturated the number of formally analyzable windows based on either our criteria for inclusion based on DNA library sequencing depth or RNA library sequencing depth.
Figure 1—figure supplement 5

Overlap of regulatory activity across datasets.
Regulatory regions (in either the unmethylated sham condition, the methylated condition, or both) identified via mSTARR-seq in this study significantly overlap with: K562 regulatory regions (in either the unmethylated sham or methylated condition, or both) from a previously generated mSTARR-seq dataset reanalyzed with our pipeline (Lea et al., 2018) (log2(OR) [95% CI]=6.212 [6.086, 6.440], p<1.0 x 10–300); regulatory regions (in either the unmethylated sham or methylated condition, or both) from an mSTARR-seq experiment in HepG2 liver cells (log2(OR) [95% CI]=3.534 [3.381, 3.684], p=5.21 x 10–307); and regulatory regions from a conventional STARR-seq experiment (i.e. an unmethylated condition) in A549 lung epithelial cells (Johnson et al., 2018) (log2(OR) [95% CI]=2.451 [2.442, 2.461], p<1.0 x 10–300). Bars represent 95% confidence intervals.
Figure 1—figure supplement 6
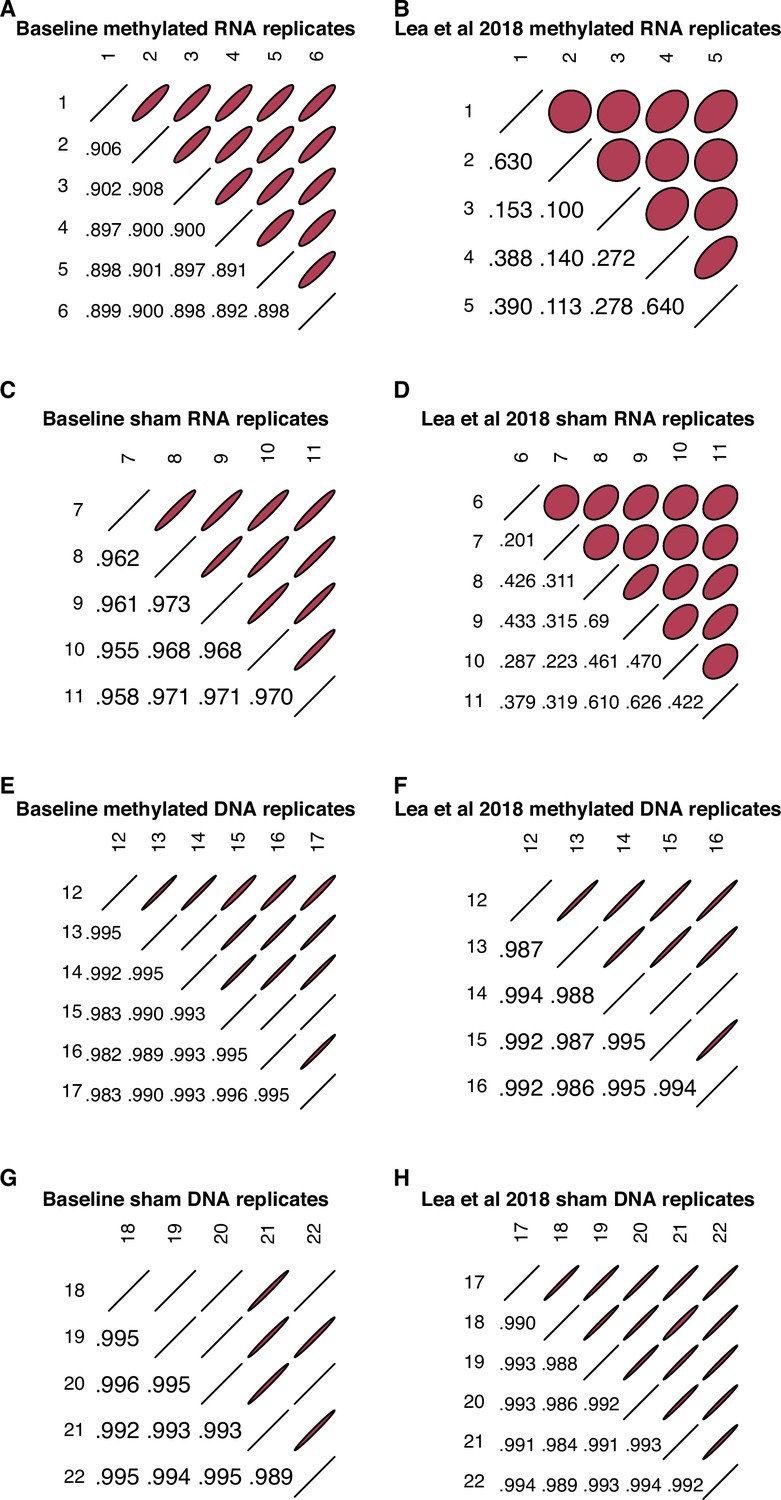
Correlations between RNA and DNA replicates.
Pearson correlations (r) of raw counts between RNA replicates (A–D) and between DNA replicates (E–H) within the windows we formally analyzed for enhancer activity in the baseline dataset reported here and in Lea et al., 2018, following a uniform data processing pipeline. All replicate pairs (both RNA and DNA, in both sham and methylated conditions) in the baseline dataset show correlations ≥0.89, demonstrating replicate reproducibility comparable to other STARR-seq studies (e.g. Klein et al., 2020). For RNA libraries, replicates in the baseline dataset are more correlated than in the Lea et al., 2018 dataset (RNA replicates: baseline mean r=0.926; Lea et al., 2018 mean r=0.347), although DNA replicates show similar inter-replicate consistency (baseline mean r=0.992; Lea et al., 2018 mean r=0.991).
Figure 1—figure supplement 7
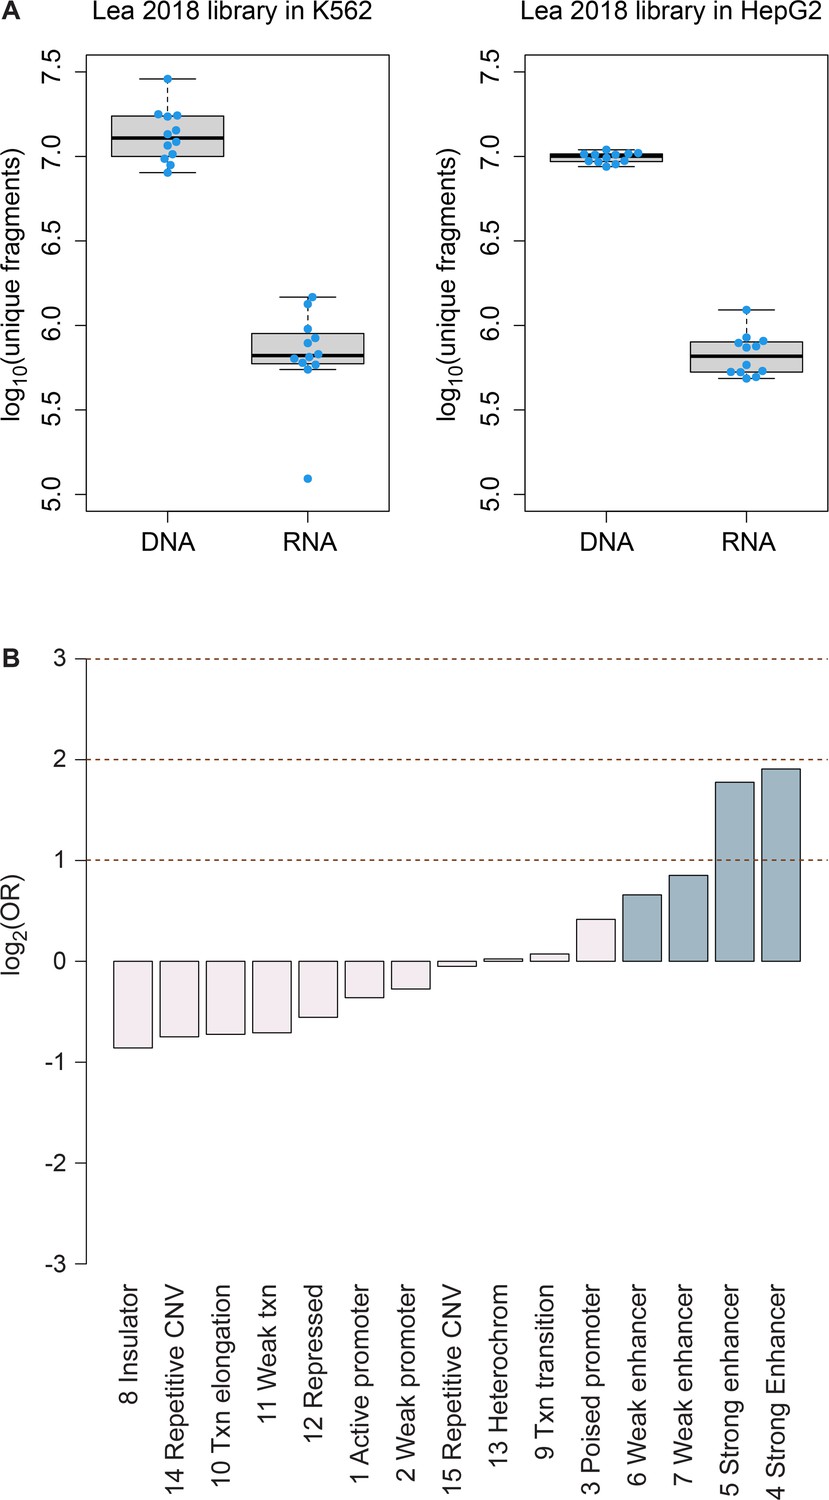
Library diversity and regions of regulatory activity in HepG2 cells.
(A) Comparison of diversity of unique mSTARR-seq DNA and RNA fragments from the library published in Lea et al., 2018 (transfected into K562 cells) versus the same library transfected into HepG2 cells in this study. Each dot represents an experimental replicate (n=12 replicates for each box). Each box represents the interquartile range, with the median value depicted as a horizontal bar. Whiskers extend to the most extreme values within 1.5 x of the interquartile range. (B) mSTARR-seq regulatory activity in HepG2 cells is strongly enriched in ENCODE-defined enhancers (indicated in blue) and some classes of promoters, and depleted in repressed and repetitive states.
Figure 1—figure supplement 8
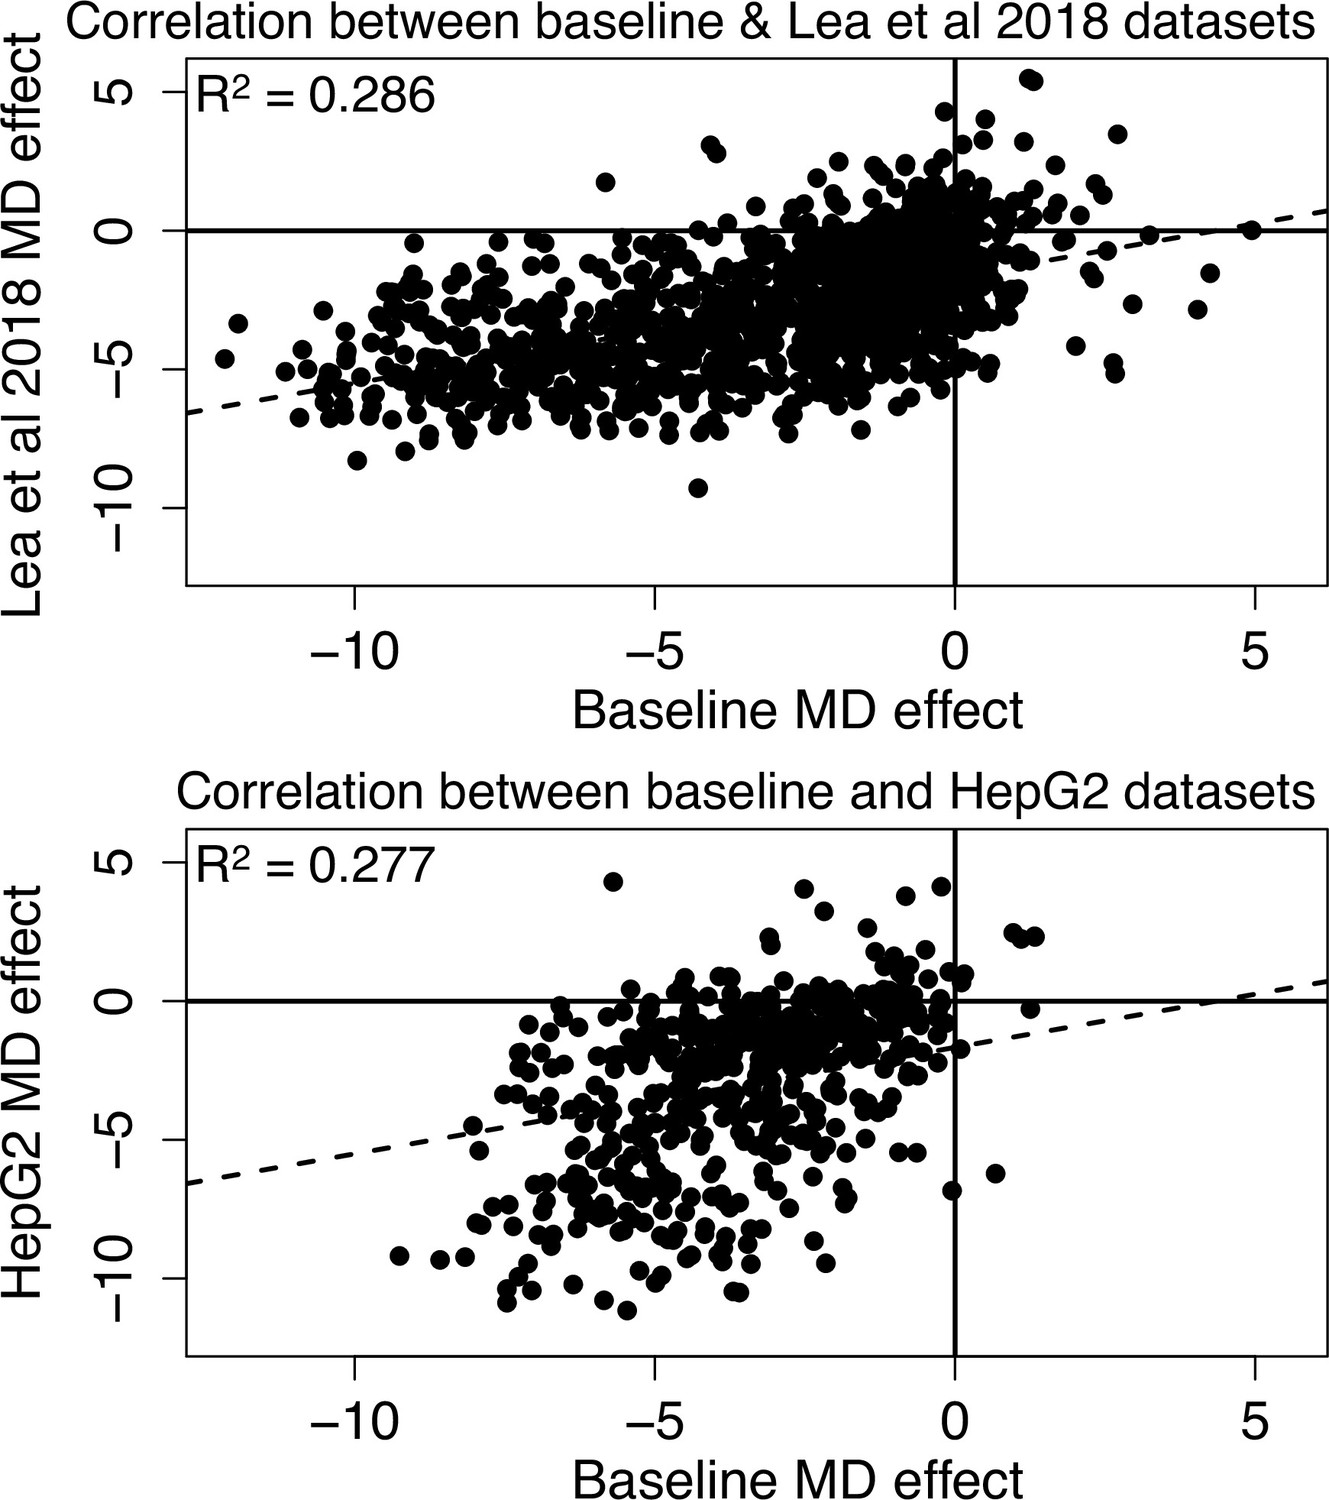
Methylation-dependent regulatory activity across datasets.
Effects of methylation on regulatory activity estimated in this study in the baseline dataset are consistent with methylation effects in K562s estimated from a previously generated mSTARR-seq dataset (Lea et al., 2018) and with methylation effects estimated in HepG2 liver cells (Lea et al., 2018: Pearson’s r=0.534 for 1250 windows with FDR <1% in both data sets, R2=0.286, p=3.19 x 10–93; HepG2: Pearson’s r=0.526 for 511 windows with FDR <1% in both data sets, R2=0.277, p=8.87 x 10–38). Each dot represents a 600 bp regulatory window identified, in either the sham or methylated states, in both datasets (FDR <1%; note that not all regulatory windows show significant methylation dependence [MD]). Dashed lines are the best fit lines. In all cases, negative effect sizes correspond to reduced activity in the methylated condition and positive effect sizes correspond to increased activity in the methylated condition.
Figure 1—figure supplement 9

RNA to DNA ratios in the methylated and unmethylated replicates in the baseline dataset.
Mean RNA (in counts per million) to DNA ratios for methylated replicates (x-axis) versus unmethylated replicates (y-axis). A constant of 0.5 was added to the initial raw counts to ensure no denominator values were 0. Each dot represents a 600 bp window that was formally tested for enhancer activity (A), exhibited significant regulatory activity (B), or exhibited significant methylation-dependent regulatory activity (C) in the baseline dataset. Solid diagonal lines represent y=x, and dashed lines represent the best fit lines. As expected, 600 bp windows tend to show higher RNA to DNA ratios in the unmethylated condition relative to the methylated condition.
Figure 1—figure supplement 10

Histograms of RNA to DNA ratios in the baseline dataset.
The x-axis represents the log2(mean RNA [in counts per million] to DNA ratios) for the baseline dataset. A constant of 0.5 was added to the initial raw counts to prevent 0 from being in the denominator. Lower values on the x-axis indicate windows showing lower regulatory activity. N=3721 regulatory windows; N=1768 MD regulatory windows.
Figure 1—figure supplement 11
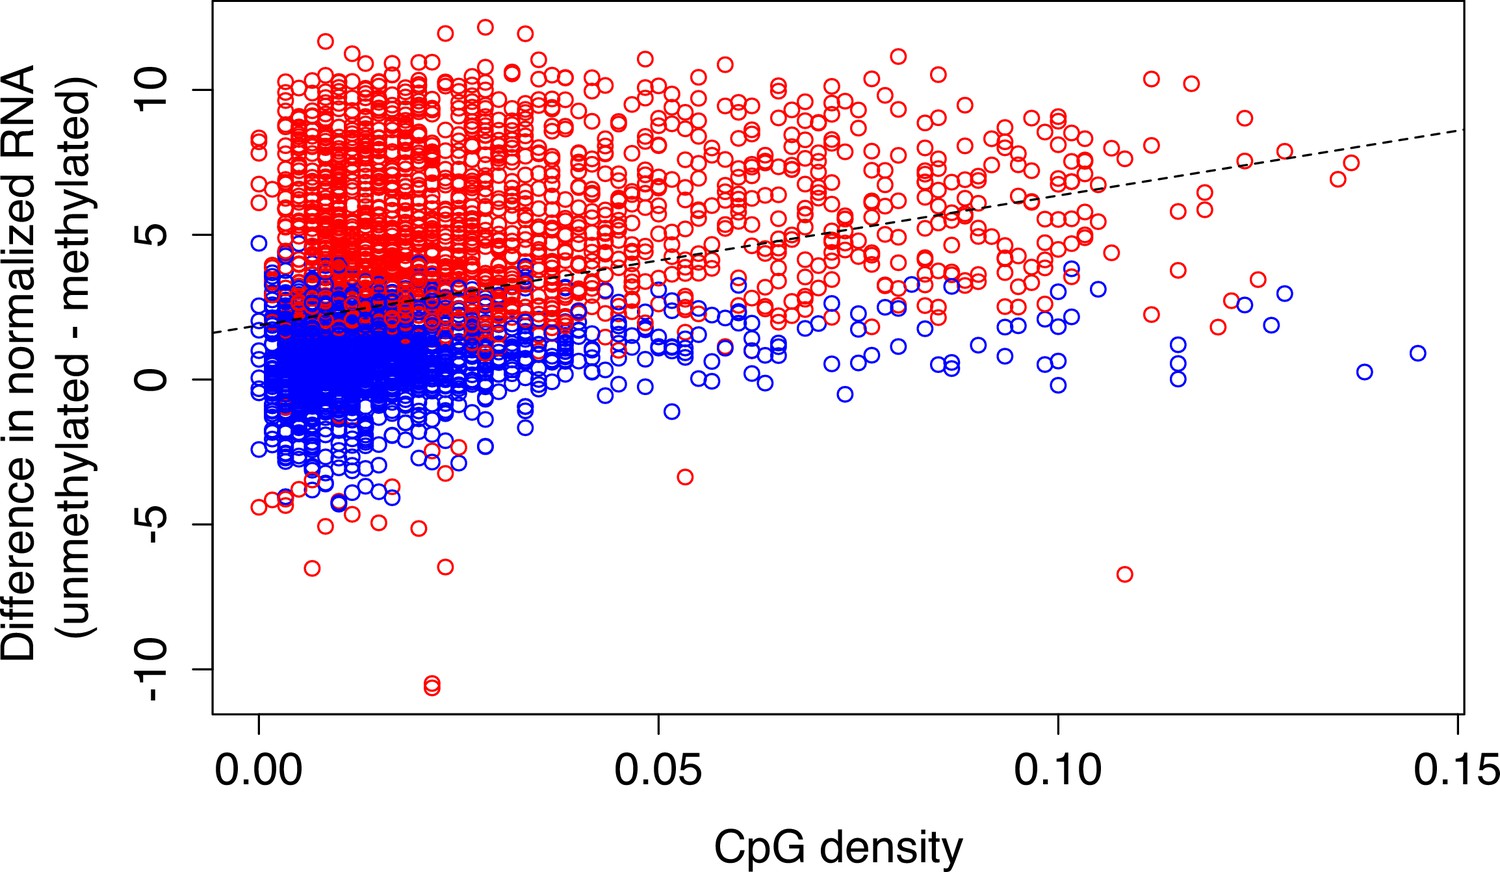
Relationship between CpG density and methylation-dependent regulatory activity.
CpG-dense mSTARR-seq regulatory regions are more likely to be repressed by DNA methylation (positive y-axis value; Spearman’s rho=0.370, p=9.865 x 10–121; n=3,721 regions with mSTARR-seq regulatory activity). Each dot represents a 600 bp window that showed significant regulatory activity (FDR <1%). Red and blue dots represent regulatory windows where methylation-dependent activity was or was not detected, respectively. The dashed line represents the best fit line.
Figure 2 with 4 supplements
DNA methylation-environment interactions reveal methylation-dependent responses to IFNA and dexamethasone challenge.
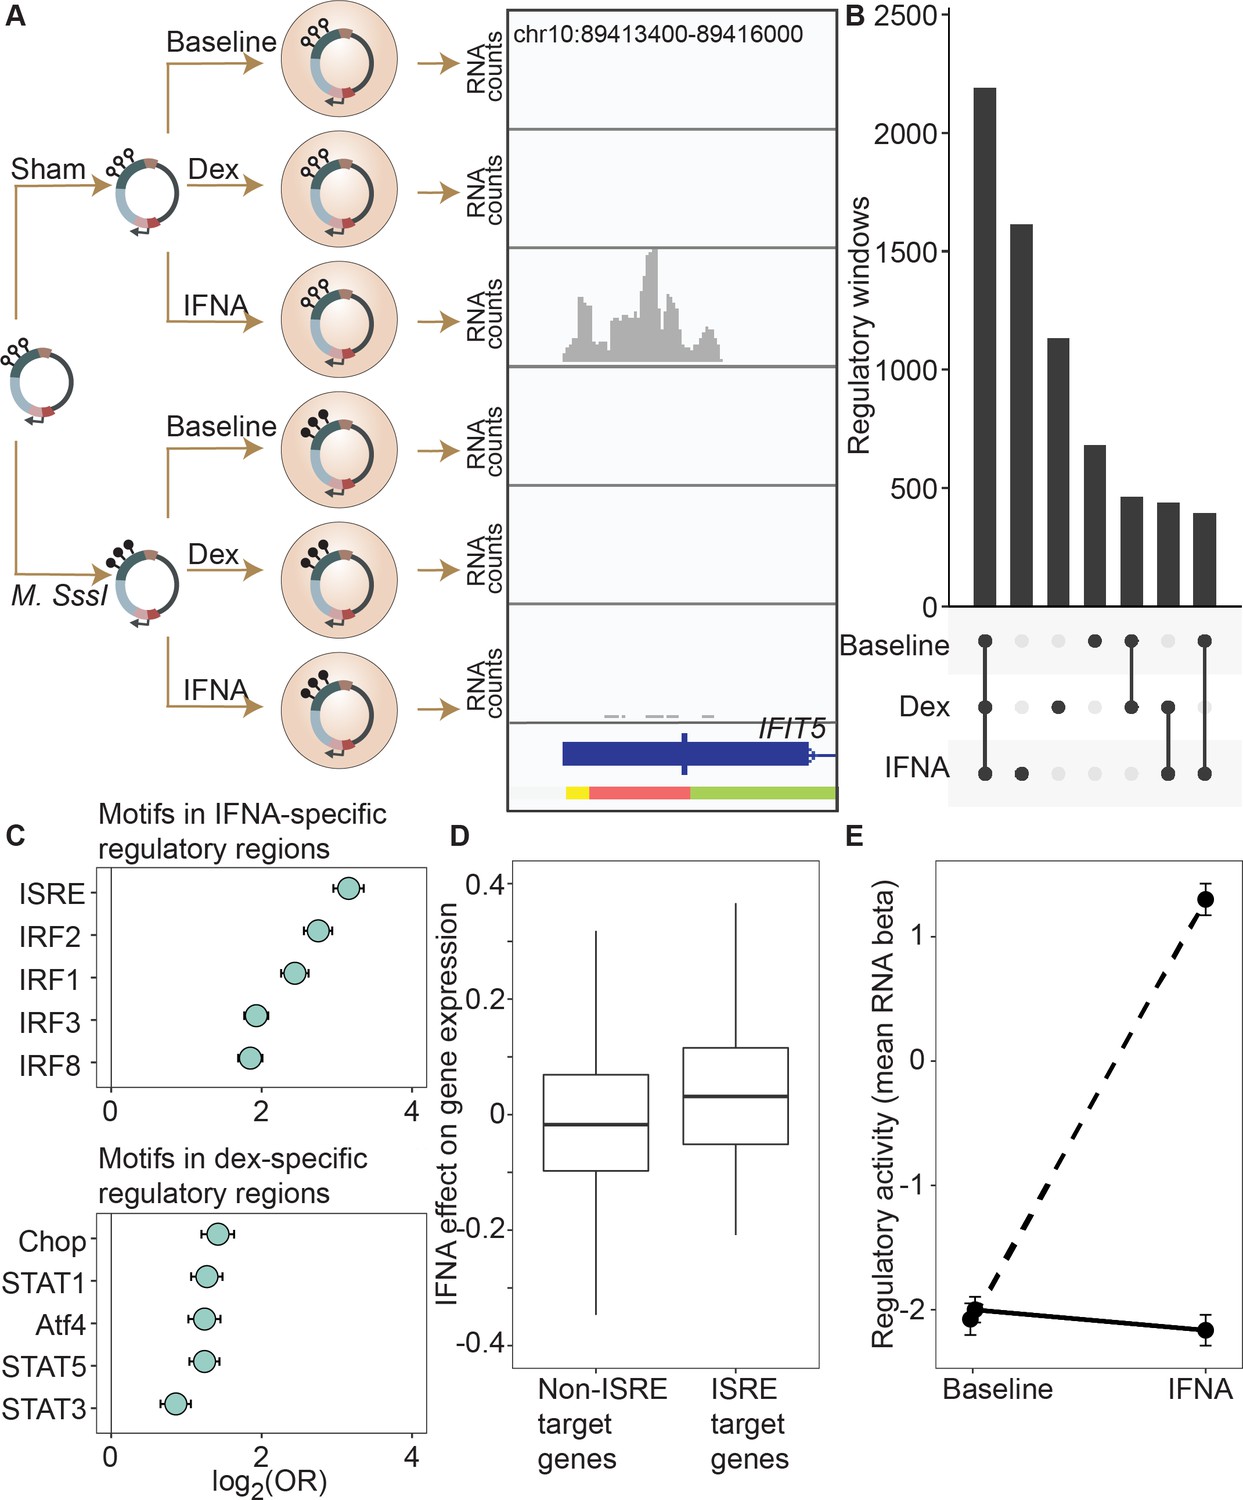
(A) Full mSTARR-seq design across DNA methylation and challenge conditions (see Figure 2—figure supplements 1 and 2 for filtering and overlap of the datasets, and Supplementary files 3, 10 and 11 for effect sizes). An example of a DNA methylation-environment interaction is shown overlapping the interferon-induced gene IFIT5 and an ENCODE-annotated weak promoter (pink denotes weak promoter, yellow denotes heterochromatin, and green denotes weak transcription; the endogenous IFIT5 gene expression response to IFNA in our experiment is shown in Figure 2—figure supplement 4). Three consecutive 600 bp windows have interaction FDR <1 x 10⁻⁴ in this region. Panels depict non-normalized, raw read pileups for mSTARR-seq RNA replicates, with all y-axis maximums set to 14,000. No methylation-dependent activity is detectable in the baseline condition because this enhancer element is inactive. Upon IFNA stimulation, only unmethylated enhancer elements are capable of responding. (B) Upset plot showing shared and unique mSTARR-seq identified enhancer elements across conditions. While many elements are shared, 3426 are unique to a single condition (FET log-odds results for magnitude of overlap are shown in Figure 2—figure supplement 3). (C) Top five most enriched transcription factor binding motifs in IFNA- and dex-specific mSTARR-seq enhancers, compared to all windows tested. Whiskers show the 95% CI. See Supplementary files 12 and 13 for all enrichment results. (D) Genes targeted by ISRE enhancers (ISRE enhancers identified from ENCODE ChIP-seq data; gene targets identified from enhancer-gene linkages from EnhancerAtlas 2.0: Gao et al., 2016) that are also identified as IFNA condition-specific mSTARR-seq enhancers (n=119) show stronger K562 endogenous gene expression responses to IFNA stimulation than non-ISRE targets (n=10557; unpaired t-test: t=3.58, df = 118.36, p=5.01 x 10⁻⁴; Supplementary file 16). Each box represents the interquartile range, with the median value depicted as a horizontal bar. Whiskers extend to the most extreme values within 1.5 x of the interquartile range. (E) mSTARR-seq regulatory activity for windows containing ISRE targets (n=1,005 windows) interacts strongly with exposure to IFNA. These windows are capable of mounting a strong response to IFNA stimulation when unmethylated (dashed line; paired t-test: t=23.02, df = 1004, p=1.78 x 10–94) but not when methylated (solid line; paired t-test: t=–1.74, df = 1004, p=0.082). Dots show the mean beta corresponding to enrichment of RNA reads versus DNA reads across windows; whiskers show the standard error. Because y-axis values correspond to model estimates, they can be positive (i.e. more mSTARR-seq RNA reads than input DNA reads) or negative values (i.e. fewer mSTARR-seq RNA reads than mSTARR-Seq input DNA reads, indicating no regulatory activity).
Figure 2—figure supplement 1

Filtering results across datasets.
Each of the five datasets began with 5,051,776 600 bp genomic windows. For each of the five datasets, we reduced the dataset to windows that had nonzero counts in at least three DNA samples in the methylated condition and three DNA samples in the unmethylated condition (i.e. 6 DNA samples total; ‘DNA filter’). We then reduced the dataset to windows that had nonzero counts in at least three RNA samples in either the methylated or unmethylated condition (‘RNA filter’). Finally, we retained only windows that showed high repeatability across DNA samples, following Lea et al., 2018 (‘DNA repeatability’). Numbers correspond to million windows that passed or failed each filter for which the arrow points to. Note that one mSTARR RNA-seq sample in the baseline condition [sample ID L31250] was removed from further analysis because it had an unusually high proportion of zero counts in the testable windows; we therefore also removed the corresponding paired DNA sample prior to analysis. See Supplementary file 9 for the precise window numbers corresponding to the plots.
Figure 2—figure supplement 2
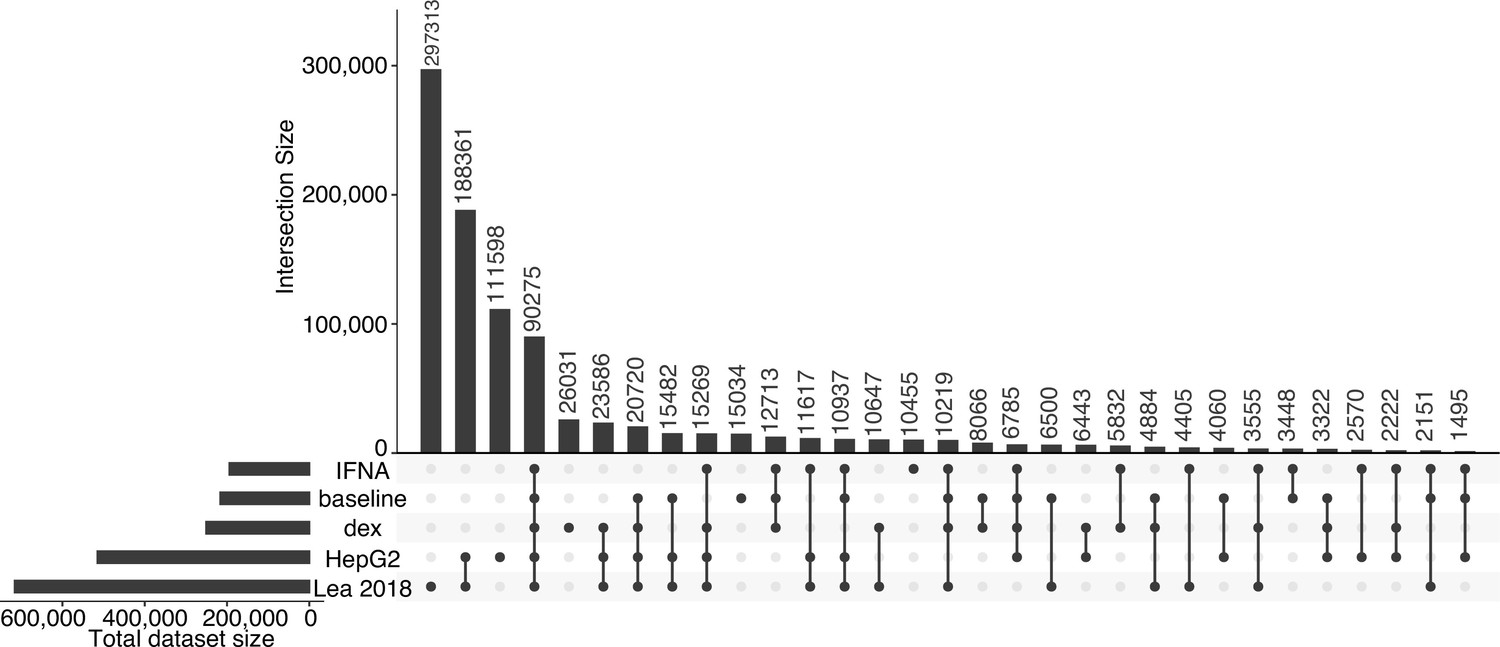
Overlap of tested genomic windows across datasets.
Upset plots showing the degree to which 600 bp non-overlapping genomic windows are shared between five datasets (baseline null, IFNA, dex, HepG2, and Lea et al., 2018; all datasets were analyzed following the same pipeline). Note that the same input library was used in Lea et al., 2018 and the HepG2 experiment, which differs from the library used here for baseline, dex, and IFNA experiments.
Figure 2—figure supplement 3

Overlap of regulatory activity and effects of methylation across environmental conditions.
(A) Regulatory regions in the baseline condition are highly likely to retain regulatory activity upon challenge with IFNA or dex (IFNA log2(OR) [95% CI]=8.639 [8.499, 8.812], p<1.0 x 10–300; dex log2(OR) [95% CI]=9.640 [9.483, 9.776], p<1.0 x 10–300). Regulatory regions also significantly overlap between IFNA- and dex-challenged cells (log2(OR) [95% CI]=8.554 [8.420, 8.698], p<1.0 x 10–300). (B) Regulatory windows identified in two environmental conditions tend to share significant effects of DNA methylation on regulatory activity (i.e. interaction effects between methylation and regulatory activity) across the two environmental conditions (baseline and IFNA log2(OR) [95% CI]=6.345 [5.673, 7.102], p<7.33 x 10–239; baseline and dex log2(OR) [95% CI]=5.982 [5.599, 6.384], p<1.0 x 10–300; IFNA and dex log2(OR) [95% CI]=5.576 [5.123, 6.055], p<4.70 x 10–266). Whiskers show the 95% CI.
Figure 2—figure supplement 4

IFIT5 endogenous gene expression is responsive to IFNA stimulation.
Tracks show non-normalized, raw read pile-ups of endogenous IFIT5 (ENSG00000152778) gene expression in either the unmethylated (open circle) or methylated (filled circle) condition, with all y-axis maximums set to 100. The replicates for endogenous gene expression shown here are the same replicates used for measuring regulatory activity shown in Figure 2A. IFIT5 is only detectably expressed after IFNA stimulation (note that the difference in peak heights between the IFNA-stimulated unmethylated and methylated conditions is because the plot shows raw reads; there is no effect of methylation treatment on endogenous IFIT5 gene expression after normalization for library size: P=0.489).
Figure 3 with 1 supplement
DNA methylation in mSTARR-seq enhancers predicts in vivo gene expression in macrophages.
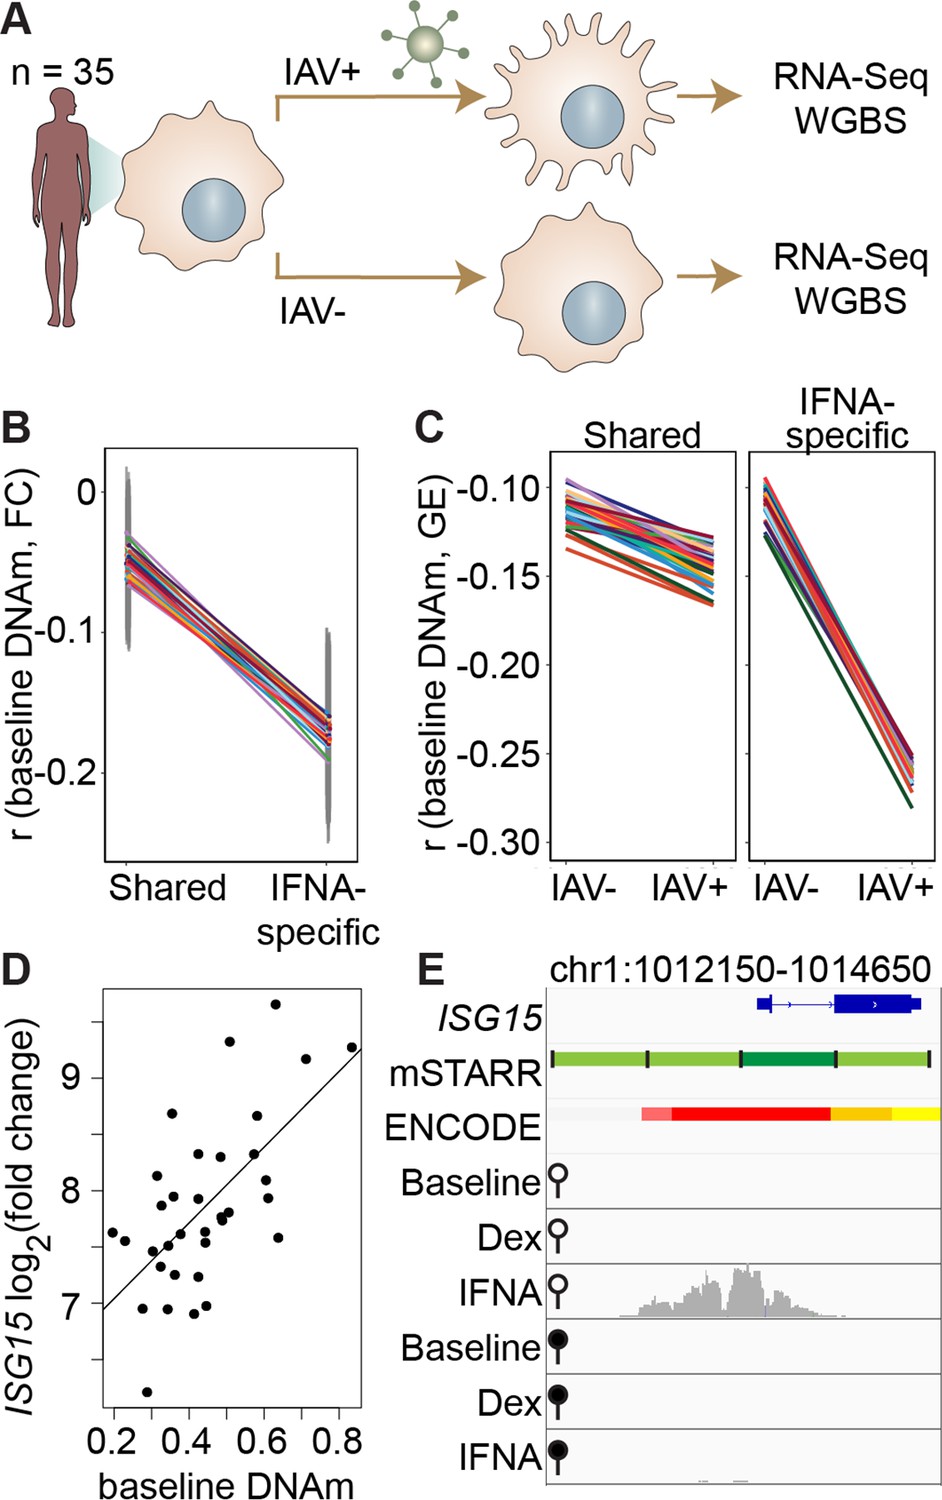
(A) Study design of the in vivo experiment, in which matched macrophage samples from 35 individuals were either left non-infected or infected with influenza A virus (IAV) for 24 hours and processed for RNA-seq and whole genome bisulfite sequencing (WGBS; Aracena et al., 2024). (B) Within individuals, DNA methylation (DNAm) levels at mSTARR-seq enhancers in non-infected cells are negatively correlated with the nearest genes’ transcriptional responses to IAV, but only in mSTARR-seq enhancers that were specific to the IFNA condition (IFNA-specific enhancers: n=1033, mean Pearson’s r=–0.170 ± 0.009 s.d., all Bonferroni-corrected p<2 x 10⁻⁵; shared enhancers: n=1736, mean Pearson’s r=–0.049 ± 0.01 s.d., all Bonferroni-corrected p>0.1). Each colored line represents an individual, and vertical gray lines represent 95% confidence intervals (see Supplementary file 17 for full results). (C) The average within-individual correlation (r) between DNA methylation and gene expression (GE) is 2.44 times as large after infection (r=–0.261 ± 0.006) than at baseline (r=–0.106 ± 0.008) in IFNA-specific mSTARR-seq enhancers (right panel), but much less affected by infection at mSTARR-seq enhancers that are shared across conditions (left panel). Within each panel, each colored line represents an individual for the same set of enhancers (see Supplementary file 18 for full results), without and with IAV infection. (D) Across individuals, the ISG15 transcriptional response to IAV is significantly correlated with average DNAm at the mSTARR-seq enhancer chr1:1013400–1014000 in non-infected cells (R2=0.381, p=6.05 x 10⁻⁵, q=0.084). Each dot represents an individual (see Supplementary file 19 for full results and Figure 3—figure supplement 1 for condition-specific results). (E) The mSTARR-seq enhancer predictive of ISG15 response to IAV (dark green bar) is located in the active promoter of ISG15 (as defined by ENCODE The ENCODE Project Consortium, 2012; red denotes active promoter, pink denotes weak promoter, orange denotes strong enhancer, yellow denotes weak enhancer). Three adjacent, methylation-dependent, IFNA-specific mSTARR-seq enhancers were identified (light green), but do not significantly predict ISG15 response to IAV (q>10%). The bottom 6 tracks depict non-normalized, raw read pileups for mSTARR-seq RNA replicates in either the unmethylated (open circle) or methylated (filled circle) condition, with all y-axis maximums set to 20,000.
Figure 3—figure supplement 1
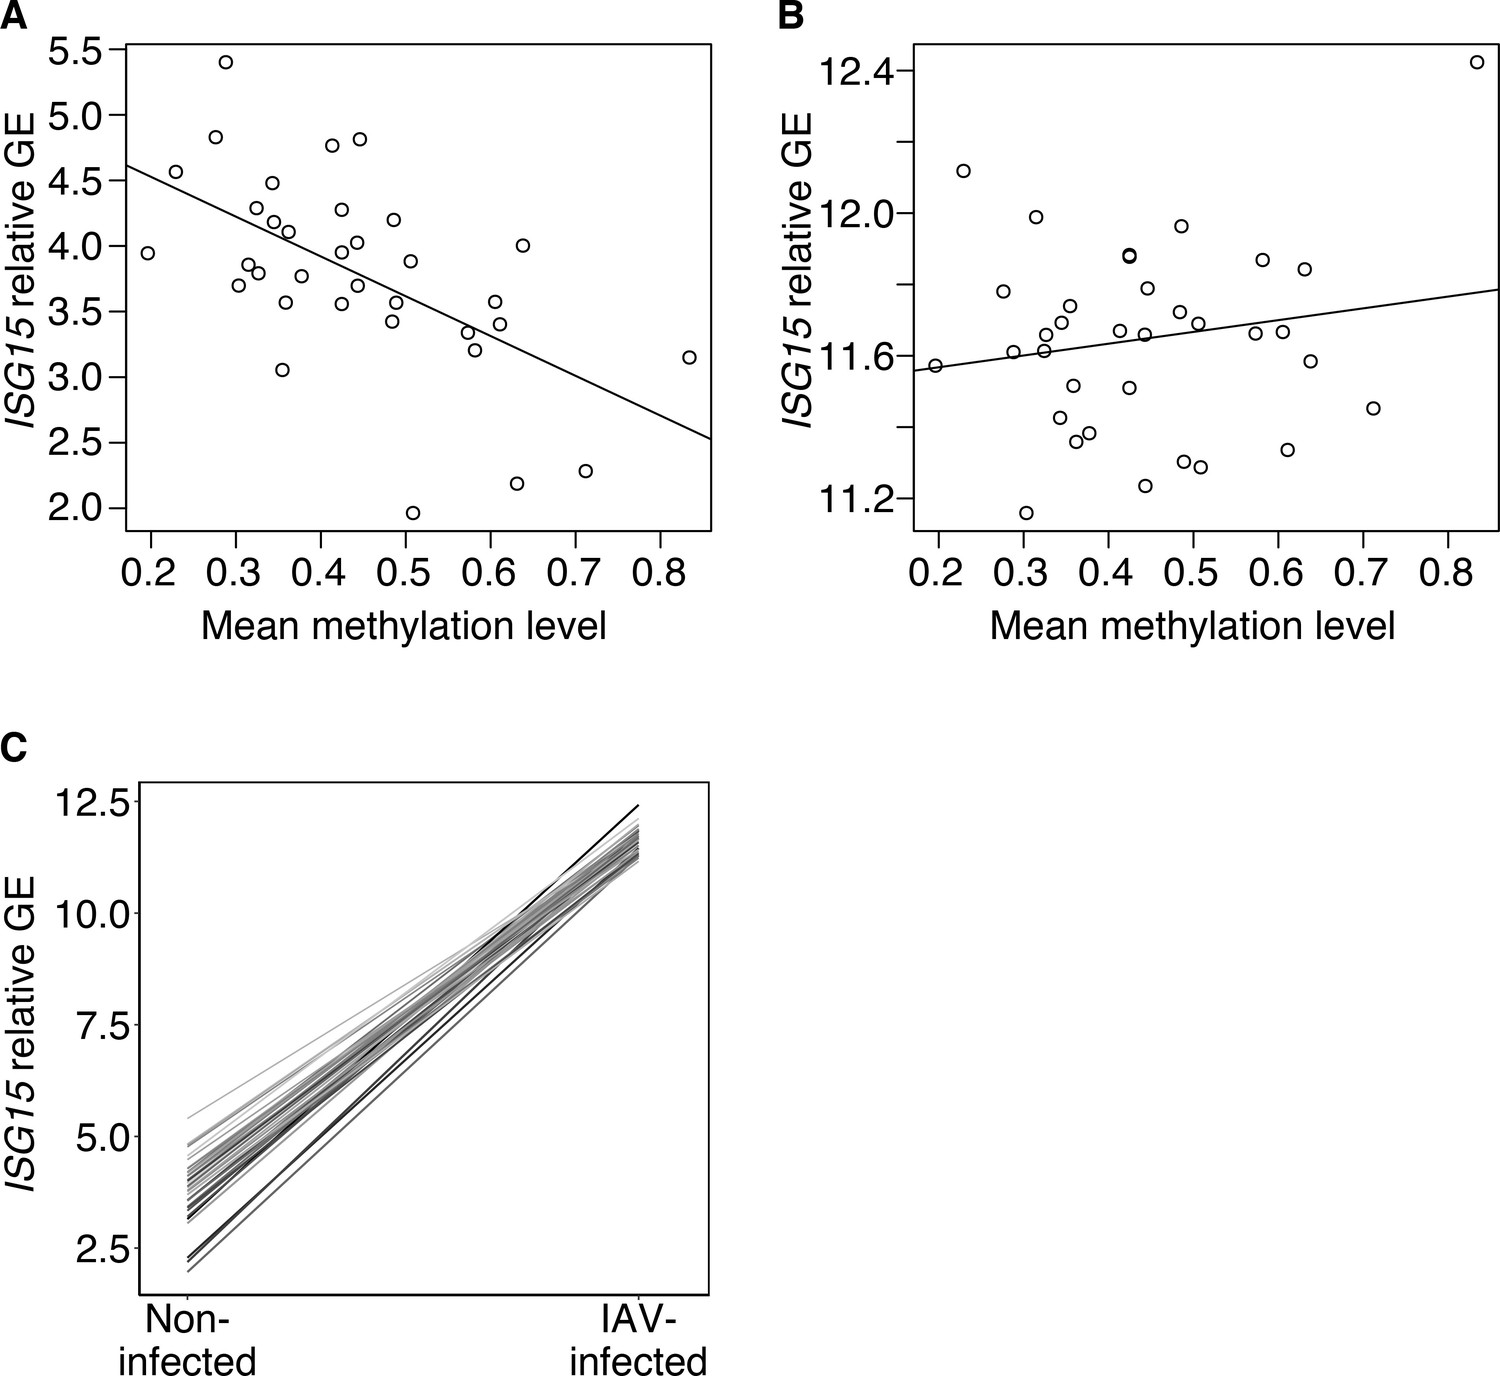
Across individuals, methylation in the mSTARR-seq annotated enhancer chr1:1013400–1014000 predicts the ISG15 gene expression response to flu.
(A) Across individuals, average methylation within the mSTARR-seq annotated enhancer chr1:1013400–1014000 in non-infected baseline macrophages significantly predicts ISG15 gene expression (GE) in the non-infected condition (R2=0.324, p=2.66 x 10⁻⁴), but (B) not in the IAV-infected condition (R2=0.001, p=0.316). Each dot represents an individual. Relative GE is log(CPM) after regressing out the effects of sequencing batch and age. (C) Individuals with relatively low methylation in the mSTARR-seq chr1:1013400–1014000 enhancer (indicated by lighter line color) in the baseline, non-infected condition tend to have higher ISG15 gene expression in the non-infected condition, ultimately resulting in a shallower ISG15 transcriptional response to IAV infection (as indicated by slope of the line). Each line represents an individual.
Figure 4 with 1 supplement
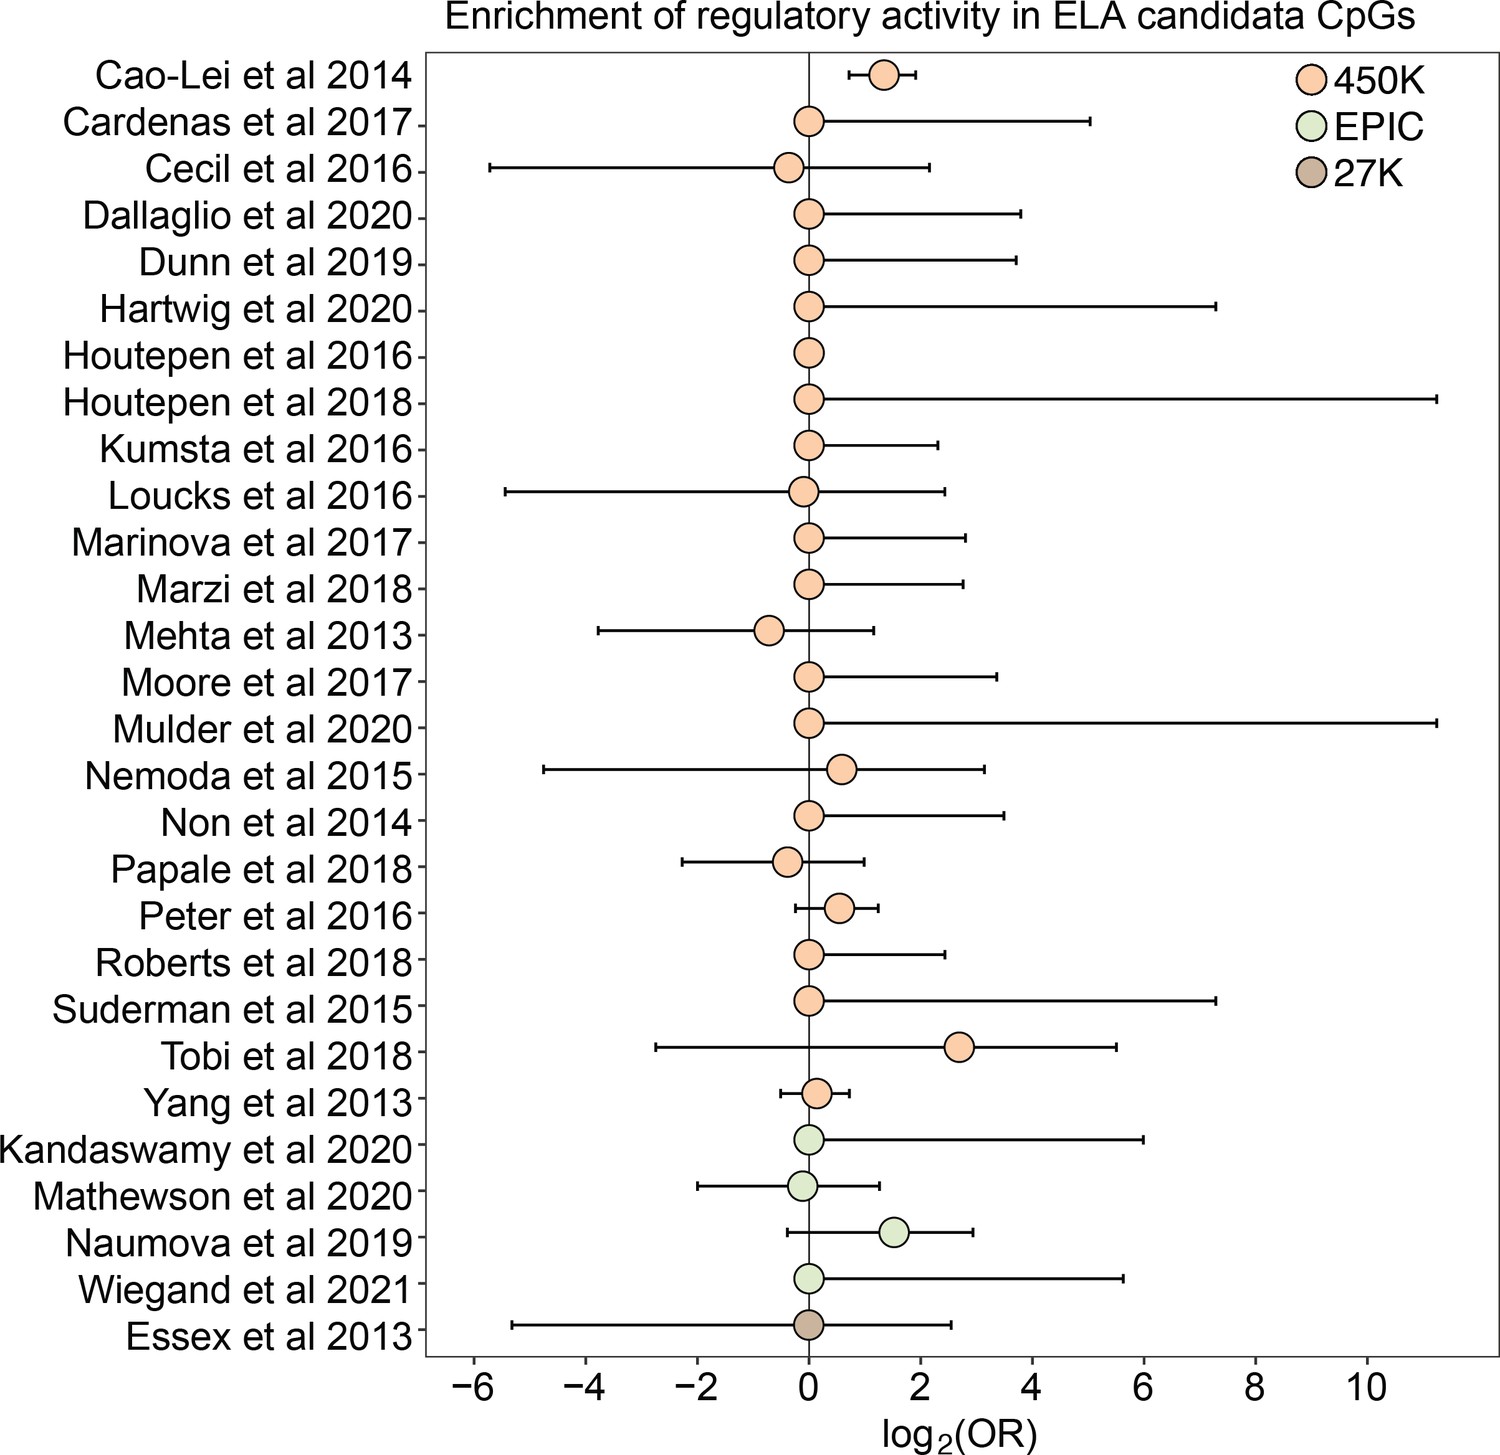
Early life adversity-associated CpG sites are not enriched for mSTARR-seq regulatory activity.
Log2-tranformed odds ratios from Fisher’s Exact Tests for enrichment relative to the background set of sites on each array platform, for 27 studies of early life adversity-DNA methylation level correlations (see Supplementary file 20 for full FET results). Whiskers show standard error. Only Cao-Lei et al., 2014 shows significant enrichment for regulatory activity (log2(OR) [95% CI]=1.343 [0.715, 1.909], p=3.39 x 10⁻⁵), but these sites are not more likely to exhibit methylation-dependent activity than expected by chance (log2(OR) [95% CI]=0.884 [-0.338, 2.130], p=0.16). For details on the source tissue and measures of ELA, see Figure 4—figure supplement 1.
Figure 4—figure supplement 1
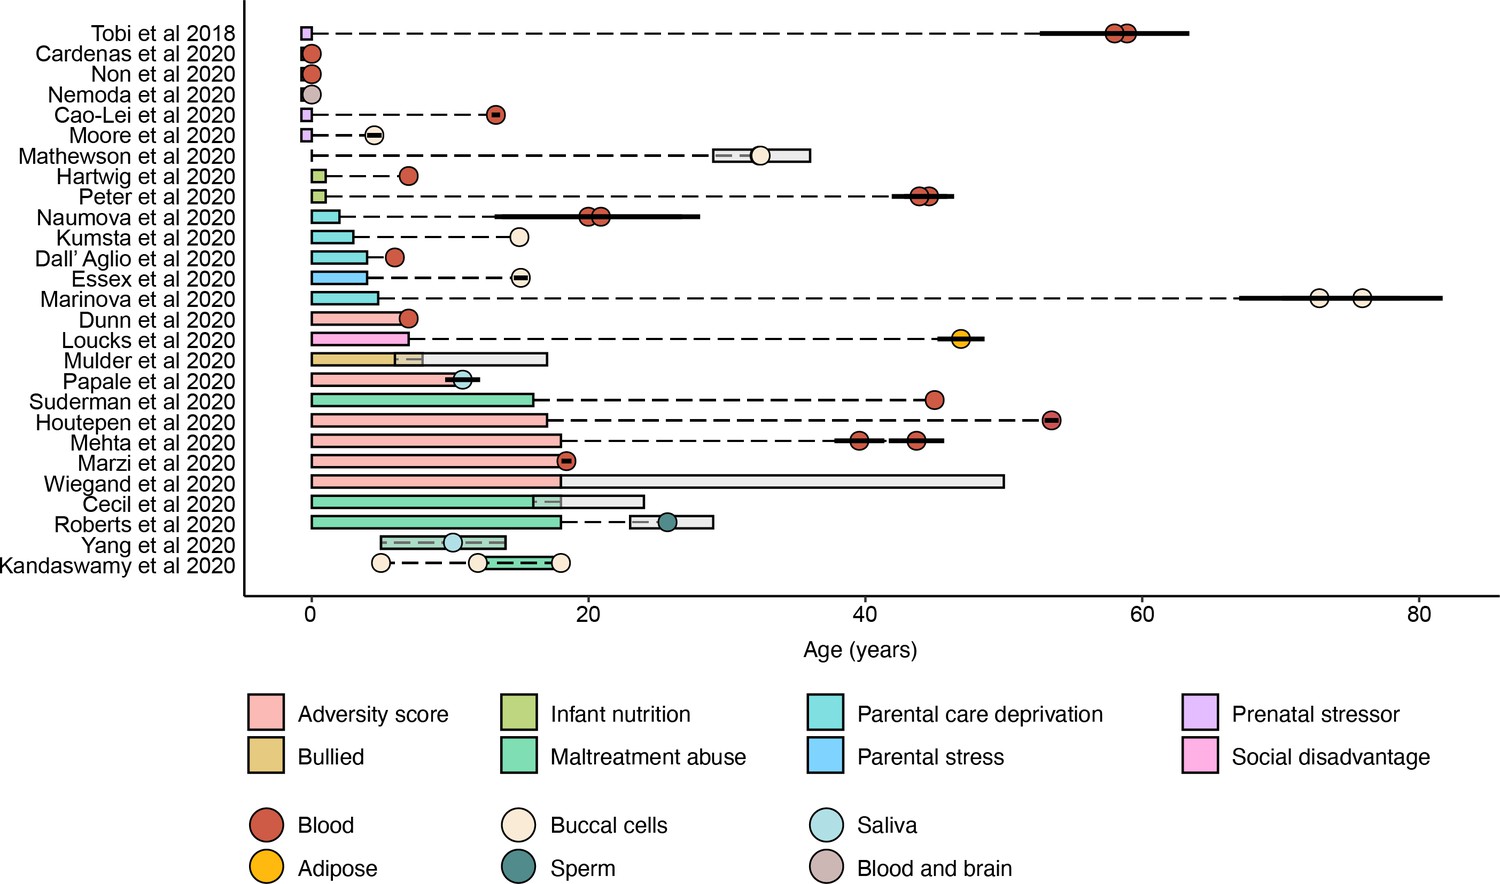
Summary of early-life adversity (ELA) studies.
Colored rectangles indicate ranges of age at adversity. Circles represent mean ages at sample collection and are colored according to the tissue type used to measure methylation levels. Ranges and standard errors of ages at sample collection, when reported, are indicated by gray rectangles and horizontal black solid lines, respectively. See Supplementary file 20 for results of Fisher’s exact tests assessing enrichment of ELA-associated CpGs for regulatory activity.
Tables
Key resources table
| Reagent type (species) or resource | Designation | Source or reference | Identifiers | Additional information |
|---|---|---|---|---|
| Commercial assay or kit | SeqCap EZ Prime Choice XL Probes | Roche | Cat # 08247528001 | |
| Commercial assay or kit | SeqCap EZ Reagent Kit Plus | Roche | Cat # 06953247001 | |
| Cell line (human) | K562 | ATCC | ATCC CCL-243 | |
| Cell line (human) | HepG2 | ATCC | Cat # HB-8065 | |
| Recombinant DNA reagent | pmSTARRseq1 | Addgene | Plasmid #96945 | |
| Peptide, recombinant protein | IFNA-2b | ThermoFisher Scientific | Cat # 111051 | |
| Chemical compound, drug | dexamethasone | Sigma-Aldrich | Cat # D4902 | |
| Other | GT115 strain chemically competent E. coli cells | Invivogen | ChemiComp GT115 | GT115 E. coli cells were initially purchased from Invivogen, and a custom electrocompetent version of the strain was prepared by Intact Genomics. |
| Other | GT115 strain electrically competent E. coli cells | Intact Genomics | Custom order to grow Invivogen’s ChemiComp GT115 strain and prepare cells for electroporation | |
| Software, algorithm | R Project for Statistical Computing | R Project for Statistical Computing | RRID:SCR_001905 | |
| Software, algorithm | LIMMA | LIMMA | RRID:SCR_010943 | |
| Software, algorithm | HOMER | HOMER | RRID:SCR_010881 | |
| Software, algorithm | Trim Galore | Trim Galore | RRID:SCR_011847 | |
| Software, algorithm | cutadapt | cutadapt | RRID:SCR_011841 | |
| Software, algorithm | HTSeq | HTSeq | RRID:SCR_005514 | |
| Software, algorithm | bedtools | bedtools | RRID:SCR_006646 | |
| Software, algorithm | edgeR | edgeR | RRID:SCR_012802 | |
| Software, algorithm | sva package | sva package | RRID:SCR_012836 |
Additional files
-
Supplementary file 1
Table summarizing the K562 mSTARR-seq DNA and RNA libraries generated in this study.
- https://cdn.elifesciences.org/articles/89371/elife-89371-supp1-v1.xlsx
-
Supplementary file 2
Table providing sequencing depth and CpG composition statistics for the target regions (EPIC array, RRBS, NR3C1, and control) in the baseline dataset.
- https://cdn.elifesciences.org/articles/89371/elife-89371-supp2-v1.xlsx
-
Supplementary file 3
Table of results from the model testing for methylation-dependent regulatory activity in K562 cells at baseline.
- https://cdn.elifesciences.org/articles/89371/elife-89371-supp3-v1.xlsx
-
Supplementary file 4
Table of enrichment results of mSTARR-seq regulatory regions for ENCODE-defined chromosome states.
- https://cdn.elifesciences.org/articles/89371/elife-89371-supp4-v1.xlsx
-
Supplementary file 5
Table providing sequencing depth and CpG composition statistics for the baseline dataset and Lea et al., 2018 dataset.
- https://cdn.elifesciences.org/articles/89371/elife-89371-supp5-v1.xlsx
-
Supplementary file 6
Table of results from the model testing for methylation-dependent regulatory activity in K562 cells at baseline condition using the dataset from Lea et al., 2018.
- https://cdn.elifesciences.org/articles/89371/elife-89371-supp6-v1.zip
-
Supplementary file 7
Table of results from the model testing for methylation-dependent regulatory activity in HepG2 cells at baseline.
- https://cdn.elifesciences.org/articles/89371/elife-89371-supp7-v1.xlsx
-
Supplementary file 8
Table of enrichment results of transcription factor binding motifs for regulatory windows with higher activity in the methylated relative to the sham condition.
- https://cdn.elifesciences.org/articles/89371/elife-89371-supp8-v1.xlsx
-
Supplementary file 9
Table providing the number of 600 bp windows passing each filter for the baseline, IFNA, dex, and HepG2 datasets.
- https://cdn.elifesciences.org/articles/89371/elife-89371-supp9-v1.xlsx
-
Supplementary file 10
Table of results from the model testing for methylation-dependent regulatory activity in K562 cells stimulated with IFNA.
- https://cdn.elifesciences.org/articles/89371/elife-89371-supp10-v1.xlsx
-
Supplementary file 11
Table of results from the model testing for methylation-dependent regulatory activity in K562 cells stimulated with dex.
- https://cdn.elifesciences.org/articles/89371/elife-89371-supp11-v1.xlsx
-
Supplementary file 12
Table of enrichment results of transcription factor binding motifs for regulatory windows specific to the IFNA treatment (<1% FDR in IFNA and >1% FDR in baseline and Dex).
- https://cdn.elifesciences.org/articles/89371/elife-89371-supp12-v1.xlsx
-
Supplementary file 13
Table of enrichment results of transcription factor binding motifs for regulatory windows specific to the Dex treatment (<1% FDR in Dex and >1% FDR in baseline and IFNA).
- https://cdn.elifesciences.org/articles/89371/elife-89371-supp13-v1.xlsx
-
Supplementary file 14
Table of enrichment results of transcription factor binding motifs for regulatory windows specific to the IFNA treatment (<1% FDR in IFNA and >10% FDR in baseline and Dex).
- https://cdn.elifesciences.org/articles/89371/elife-89371-supp14-v1.xlsx
-
Supplementary file 15
Table of enrichment results of transcription factor binding motifs for regulatory windows specific to the Dex treatment (<1% FDR in Dex and >10% FDR in baseline and IFNA).
- https://cdn.elifesciences.org/articles/89371/elife-89371-supp15-v1.xlsx
-
Supplementary file 16
Table of results from the model testing for the K562 endogenous gene expression response to IFNA.
- https://cdn.elifesciences.org/articles/89371/elife-89371-supp16-v1.xlsx
-
Supplementary file 17
Table of Pearson’s correlation results, within individuals, between mSTARR-seq enhancer DNA methylation in non-infected macrophages and transcriptional response of nearest genes upon IAV infection.
- https://cdn.elifesciences.org/articles/89371/elife-89371-supp17-v1.xlsx
-
Supplementary file 18
Table of Pearson’s correlation results, within individuals, between mSTARR-seq enhancer DNA methylation in non-infected macrophages and gene expression level in non-infected or IAV-infected macrophages.
- https://cdn.elifesciences.org/articles/89371/elife-89371-supp18-v1.xlsx
-
Supplementary file 19
Table of Pearson’s correlation results, across individuals, between mSTARR-seq enhancer DNA methylation in non-infected macrophages and transcriptional response of nearest genes upon IAV infection.
- https://cdn.elifesciences.org/articles/89371/elife-89371-supp19-v1.xlsx
-
Supplementary file 20
Table of enrichment results of regulatory activity in early-life adversity associated CpGs relative to regulatory activity in all CpGs on the associated Illumina array.
- https://cdn.elifesciences.org/articles/89371/elife-89371-supp20-v1.xlsx
-
Supplementary file 21
Library diversity of replicate transformations using the ENCODE Project’s PCR bottleneck coefficient (PBC).
- https://cdn.elifesciences.org/articles/89371/elife-89371-supp21-v1.xlsx
-
MDAR checklist
- https://cdn.elifesciences.org/articles/89371/elife-89371-mdarchecklist1-v1.pdf
Download links
A two-part list of links to download the article, or parts of the article, in various formats.
Downloads (link to download the article as PDF)
Open citations (links to open the citations from this article in various online reference manager services)
Cite this article (links to download the citations from this article in formats compatible with various reference manager tools)
DNA methylation-environment interactions in the human genome
eLife 12:RP89371.
https://doi.org/10.7554/eLife.89371.3


