Convergence, plasticity, and tissue residence of regulatory T cell response via TCR repertoire prism
- Institute of Translational Medicine, Pirogov Russian National Research Medical University, Russian Federation
- Genomics of Adaptive Immunity Department, Shemyakin and Ovchinnikov Institute of Bioorganic Chemistry, Russian Federation
- Howard Hughes Medical Institute and Immunology Program, Sloan Kettering Institute and Ludwig Center at Memorial Sloan Kettering Cancer Center, United States
- Central European Institute of Technology, Czech Republic
- Abu Dhabi Stem Cells Center, United Arab Emirates
Figures
Figure 1
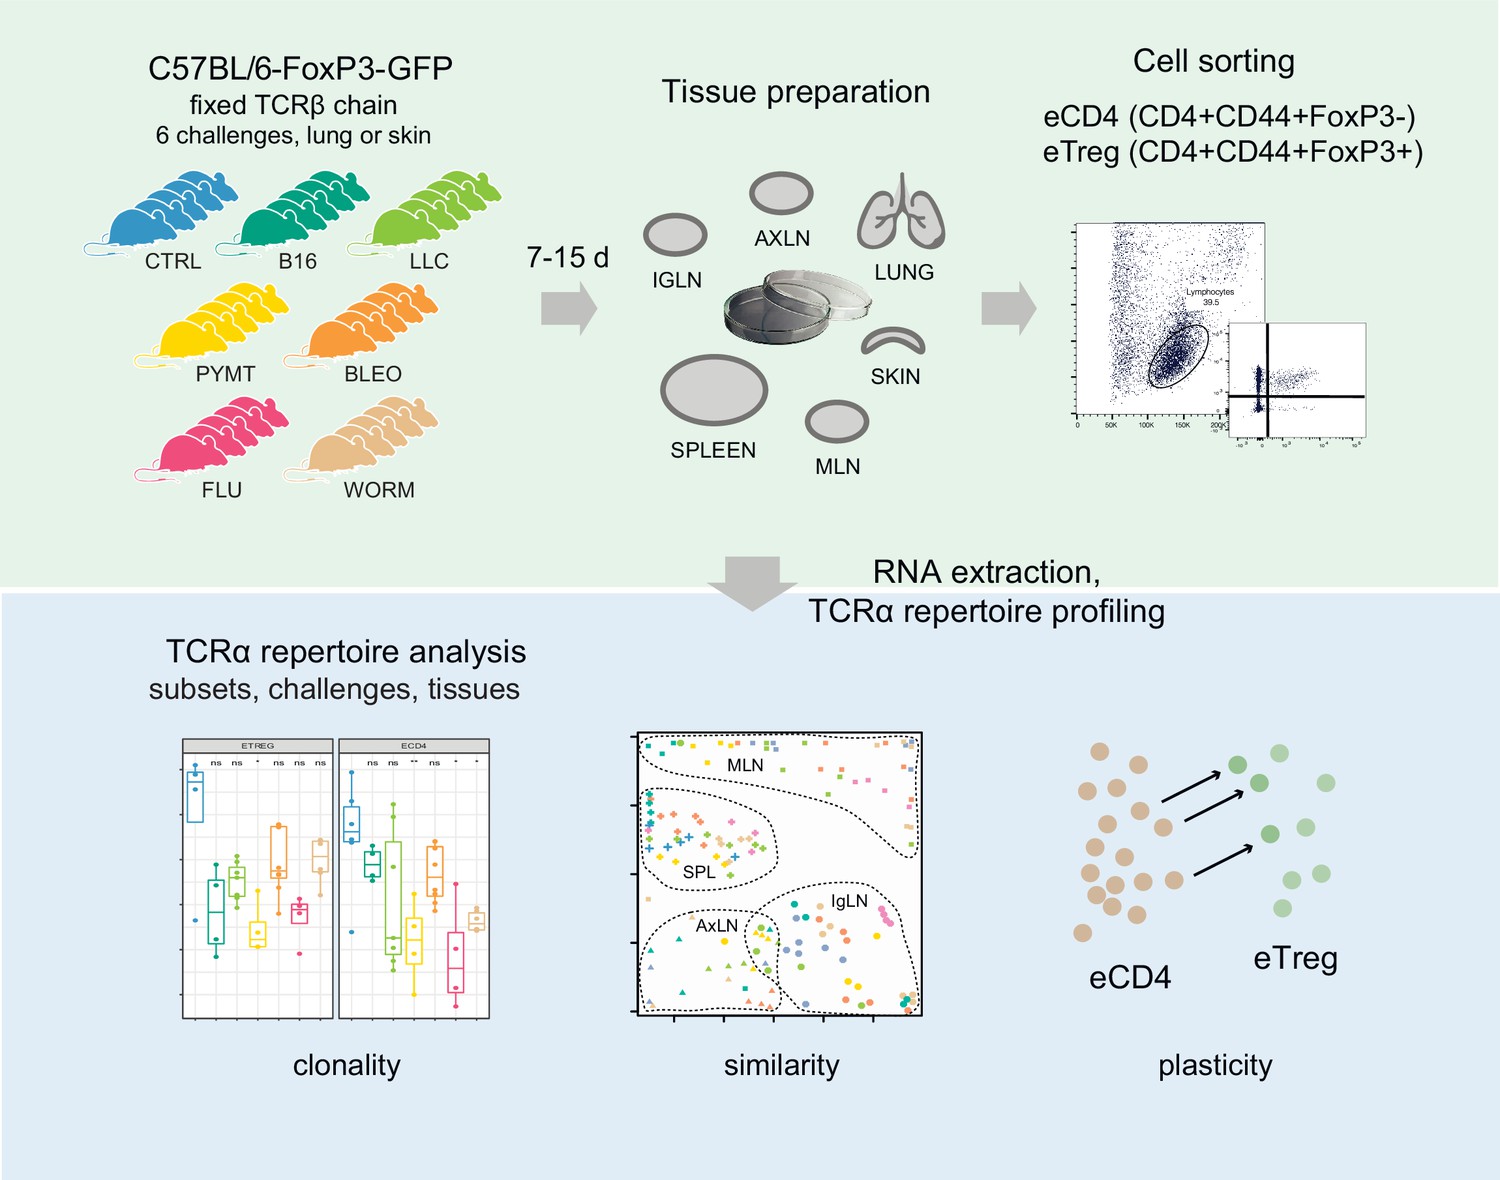
Study design.
Figure 2
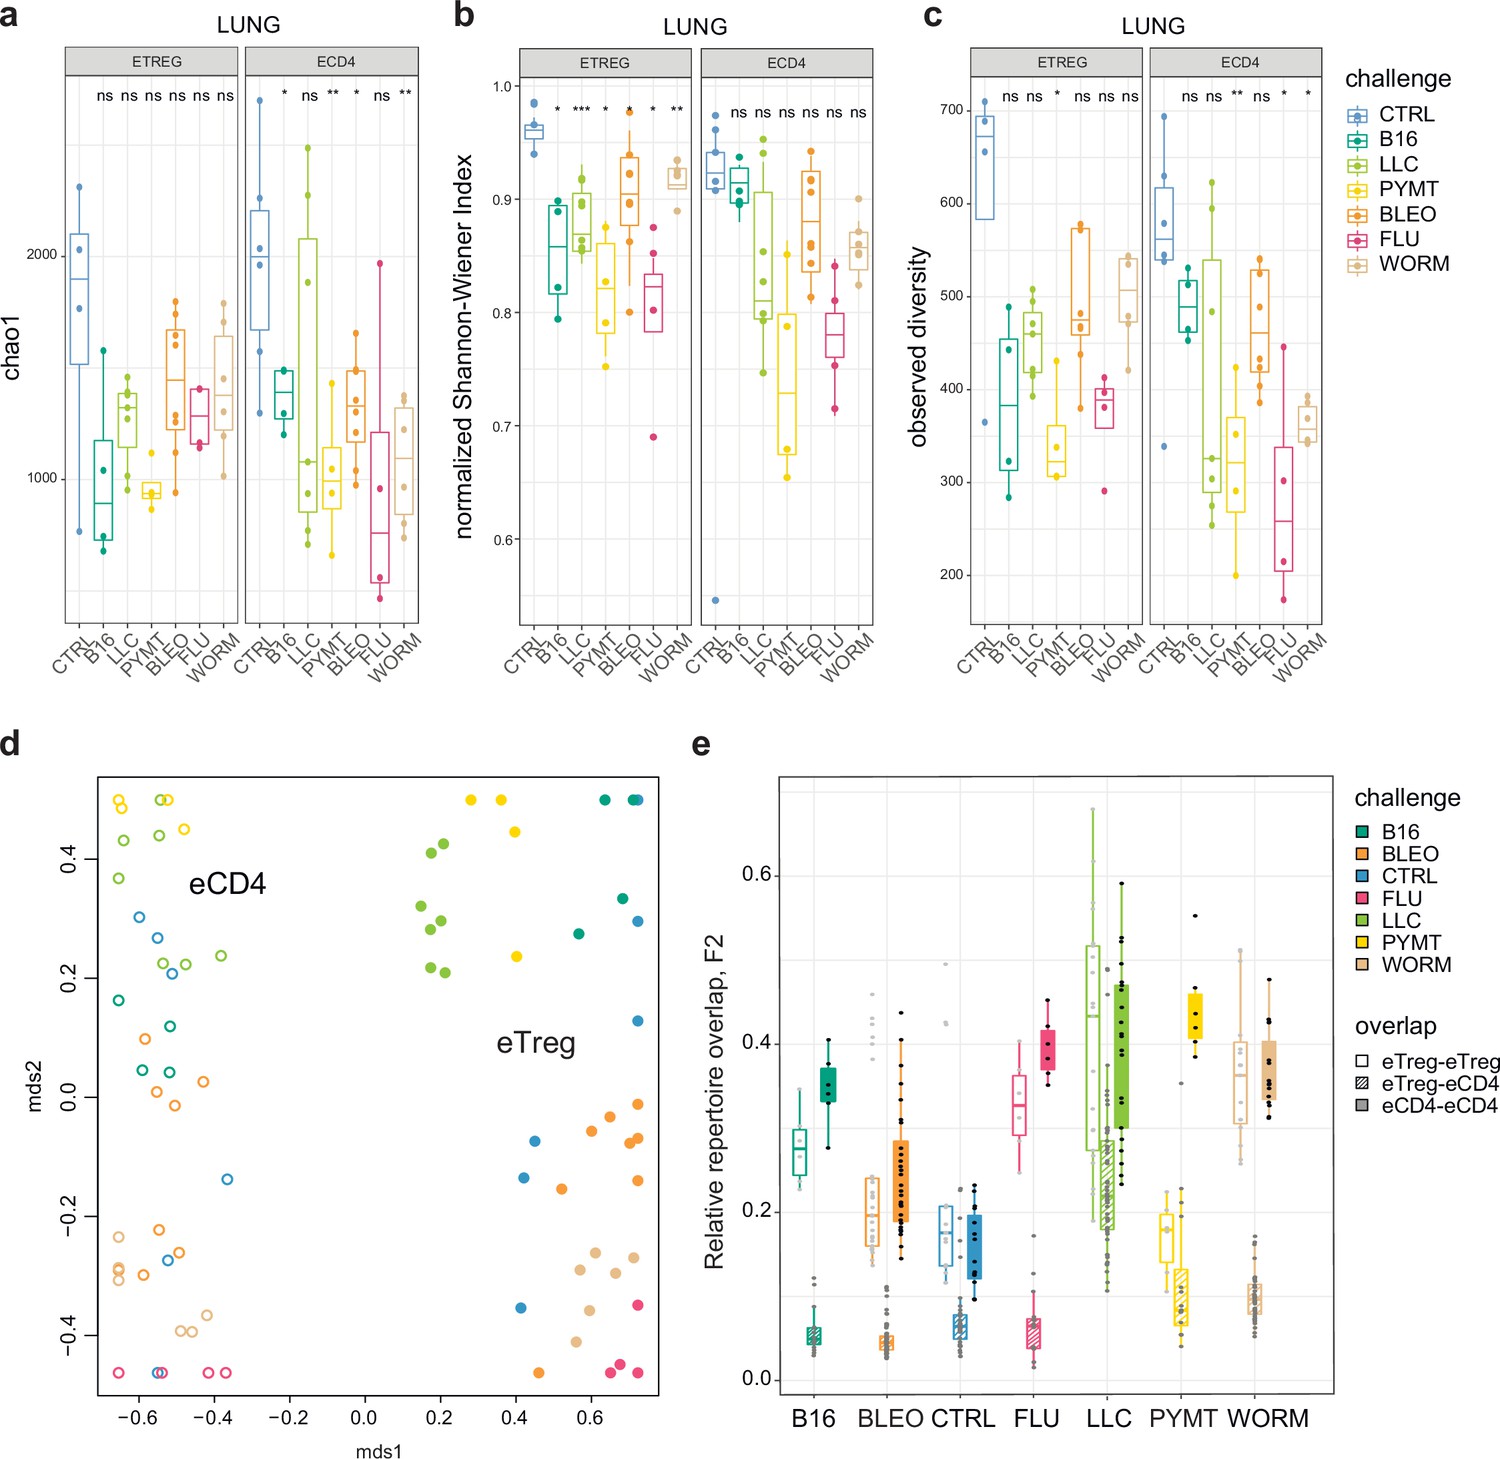
Clonality, diversity, and overlap of eTreg and eCD4 subsets.
(a-c). Clonality and diversity of lung eTreg and eCD4 subsets in response to distinct antigenic challenges. We calculated the (a) Chao1 estimator, (b) normalized Shannon-Wiener index, and (c) observed diversity for each TCRα repertoire obtained from each CD4+ T-cell subset from each animal (3 < n < 7) with different antigenic challenges. p-values are shown as: *p<0.05, **p<0.01, ***p<0.001, and ****p<0.0001, based on parametric t-test for each group versus control. (d) Relative overlap between amino acid-defined lung TCRα CDR3 repertoires, visualized as a VDJtools MDS plot. Euclidean distance between points reflects the distance between repertoires. Data were normalized to the top 1000 most frequent clonotypes and weighted by clonotype frequency (F2 metric in VDJtools). Clonotypes were matched on the basis of identical TRAV gene segments and identical TCRα CDR3 sequences. The closer the two circles are, the higher the overall frequency of shared clonotypes. Node colors correspond to the challenge antigen. Filled circles are lung eTreg, open circles are lung eCD4 cells. (e) The same F2 metrics as in (d), are shown separately for each challenge and for eTreg-eTreg, eTreg-eCD4, and eCD4-eCD4 repertoire overlap. For both (d) and (e), mice were analyzed in an all-versus-all fashion, irrespective of whether eTreg and eCD4 subsets were obtained from the same or distinct mice. Boxplots show minimum value, the 25th percentile, the median, the 75th percentile and the maximum value.
Figure 3 with 2 supplements
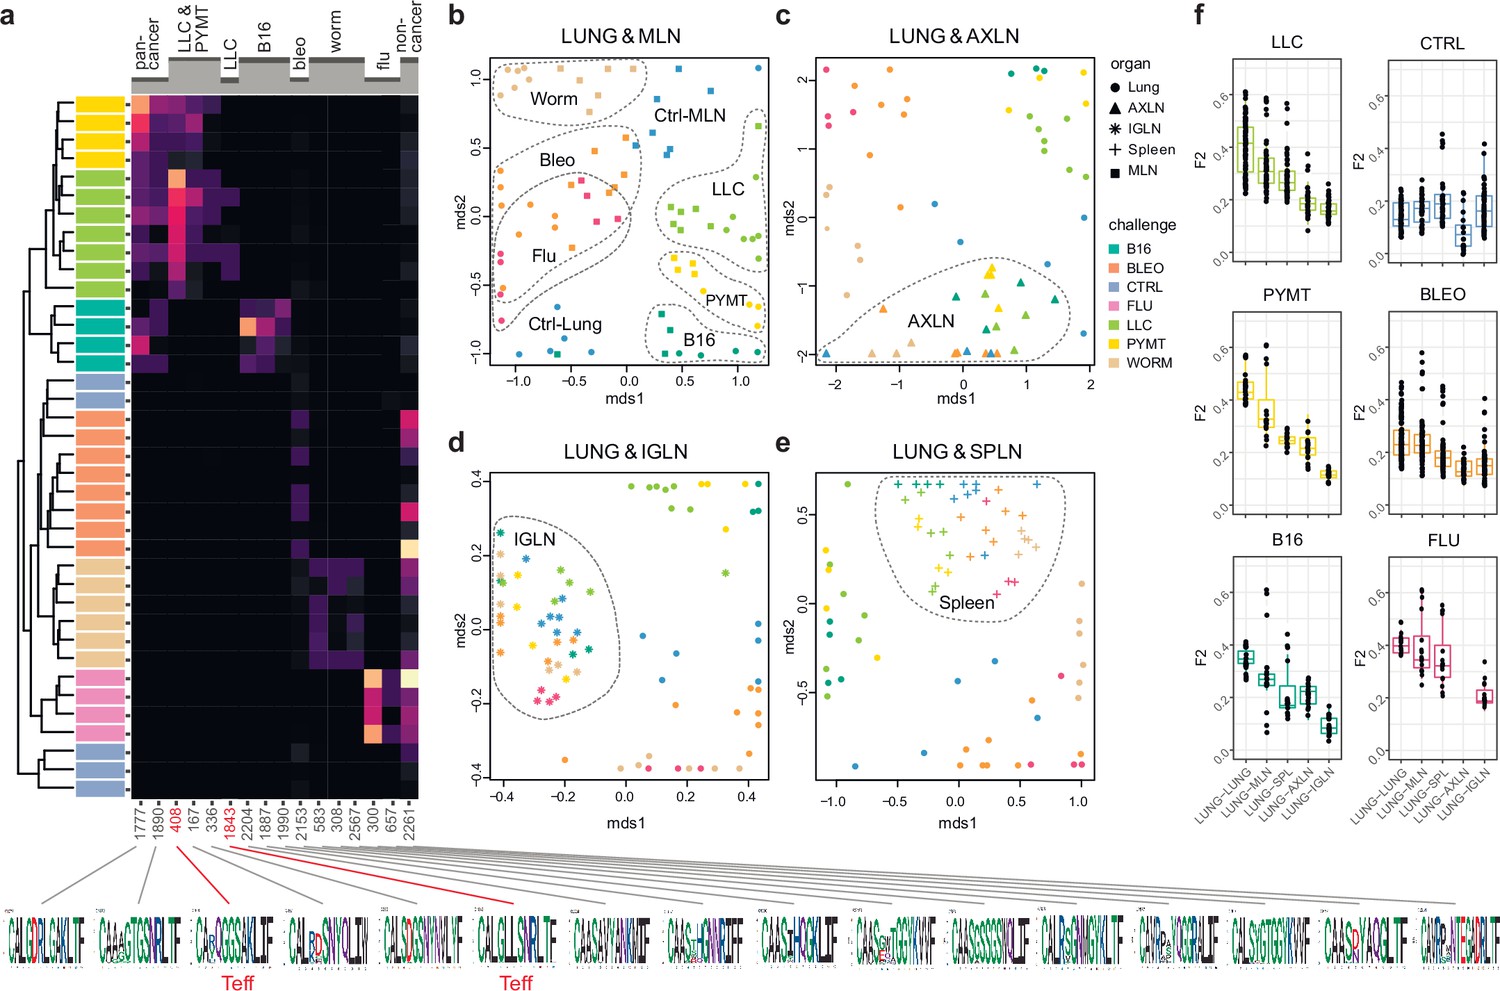
eTreg TCR repertoire in various tissues following antigen challenge in the lung.
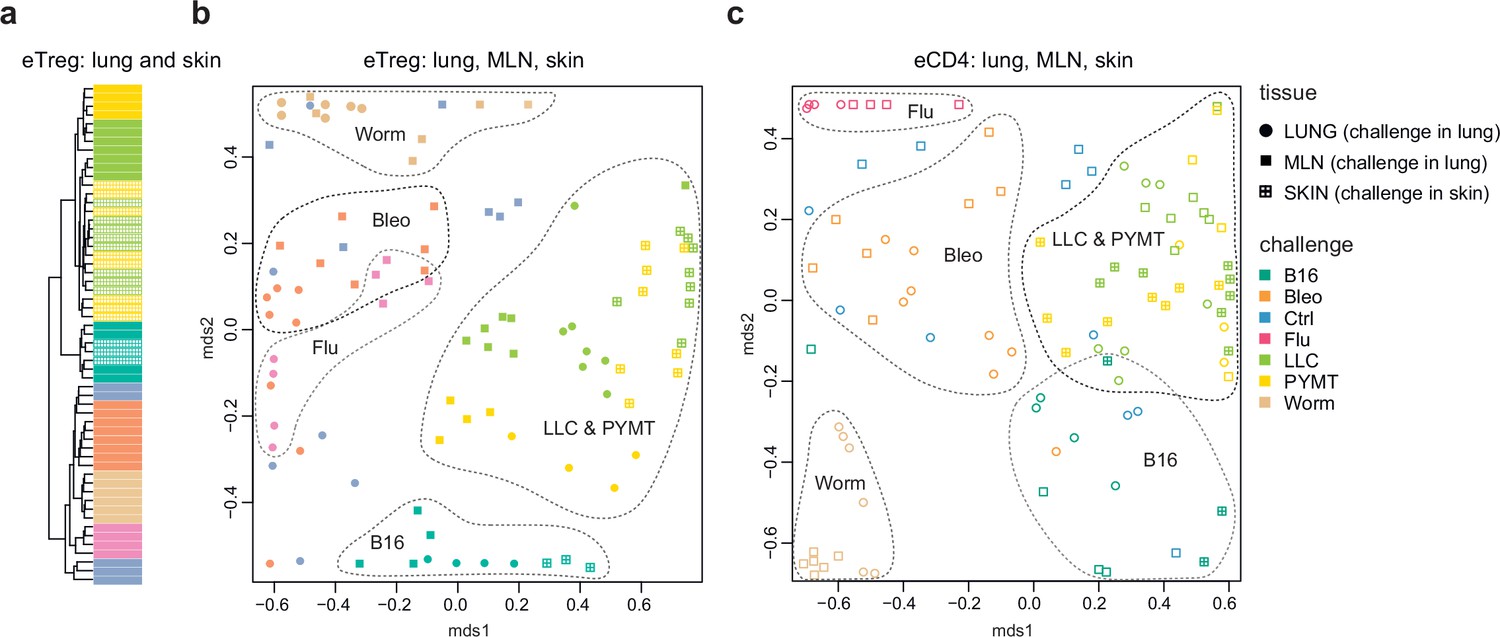
Relative overlap between amino acid-defined eTreg TCRα CDR3 repertoires visualized using VDJtools. Data were normalized to the top 1000 most frequent clonotypes and weighted by clonotype frequency (F2 metric). Clonotypes were matched on the basis of identical TRAV gene segments and identical TCRα CDR3 sequences. (a) Dendrogram of Lung eTreg TCRα CDR3 repertoires, where branch length shows the distance between repertoires. Heatmap at right shows the distribution of selected TCRα CDR3 clusters associated with specific challenges. Corresponding TCRα CDR3 logos are shown at the bottom; clusters also observed in corresponding eCD4 samples are indicated in red. (b–e) MDS plots comparing repertoires between pairs of tissues, where the Euclidean distance between points reflects the distance between repertoires. Overlap is shown for (b) lung versus mediastinal lymph node (MLN), (c) lung versus axillary (AXLN), (d) lung versus intraglandular (IGLN), and (e) lung versus spleen. The closer the two samples are, the higher the overall frequency of shared clonotypes. Node colors correspond to different challenges. Mice were analyzed in an all-versus-all fashion, irrespective of whether tissues were obtained from the same or distinct mice. Circles: lung. Squares: MLN. Triangles: AXLN. Snowflakes: IGLN. Crosses: spleen. (f) Graphs show eTreg F2 repertoire overlap between lung tissue from different animals, and between lungs and other tissues of all animals. Boxplots show minimum value, the 25th percentile, the median, the 75th percentile and the maximum value.
Figure 3—figure supplement 1
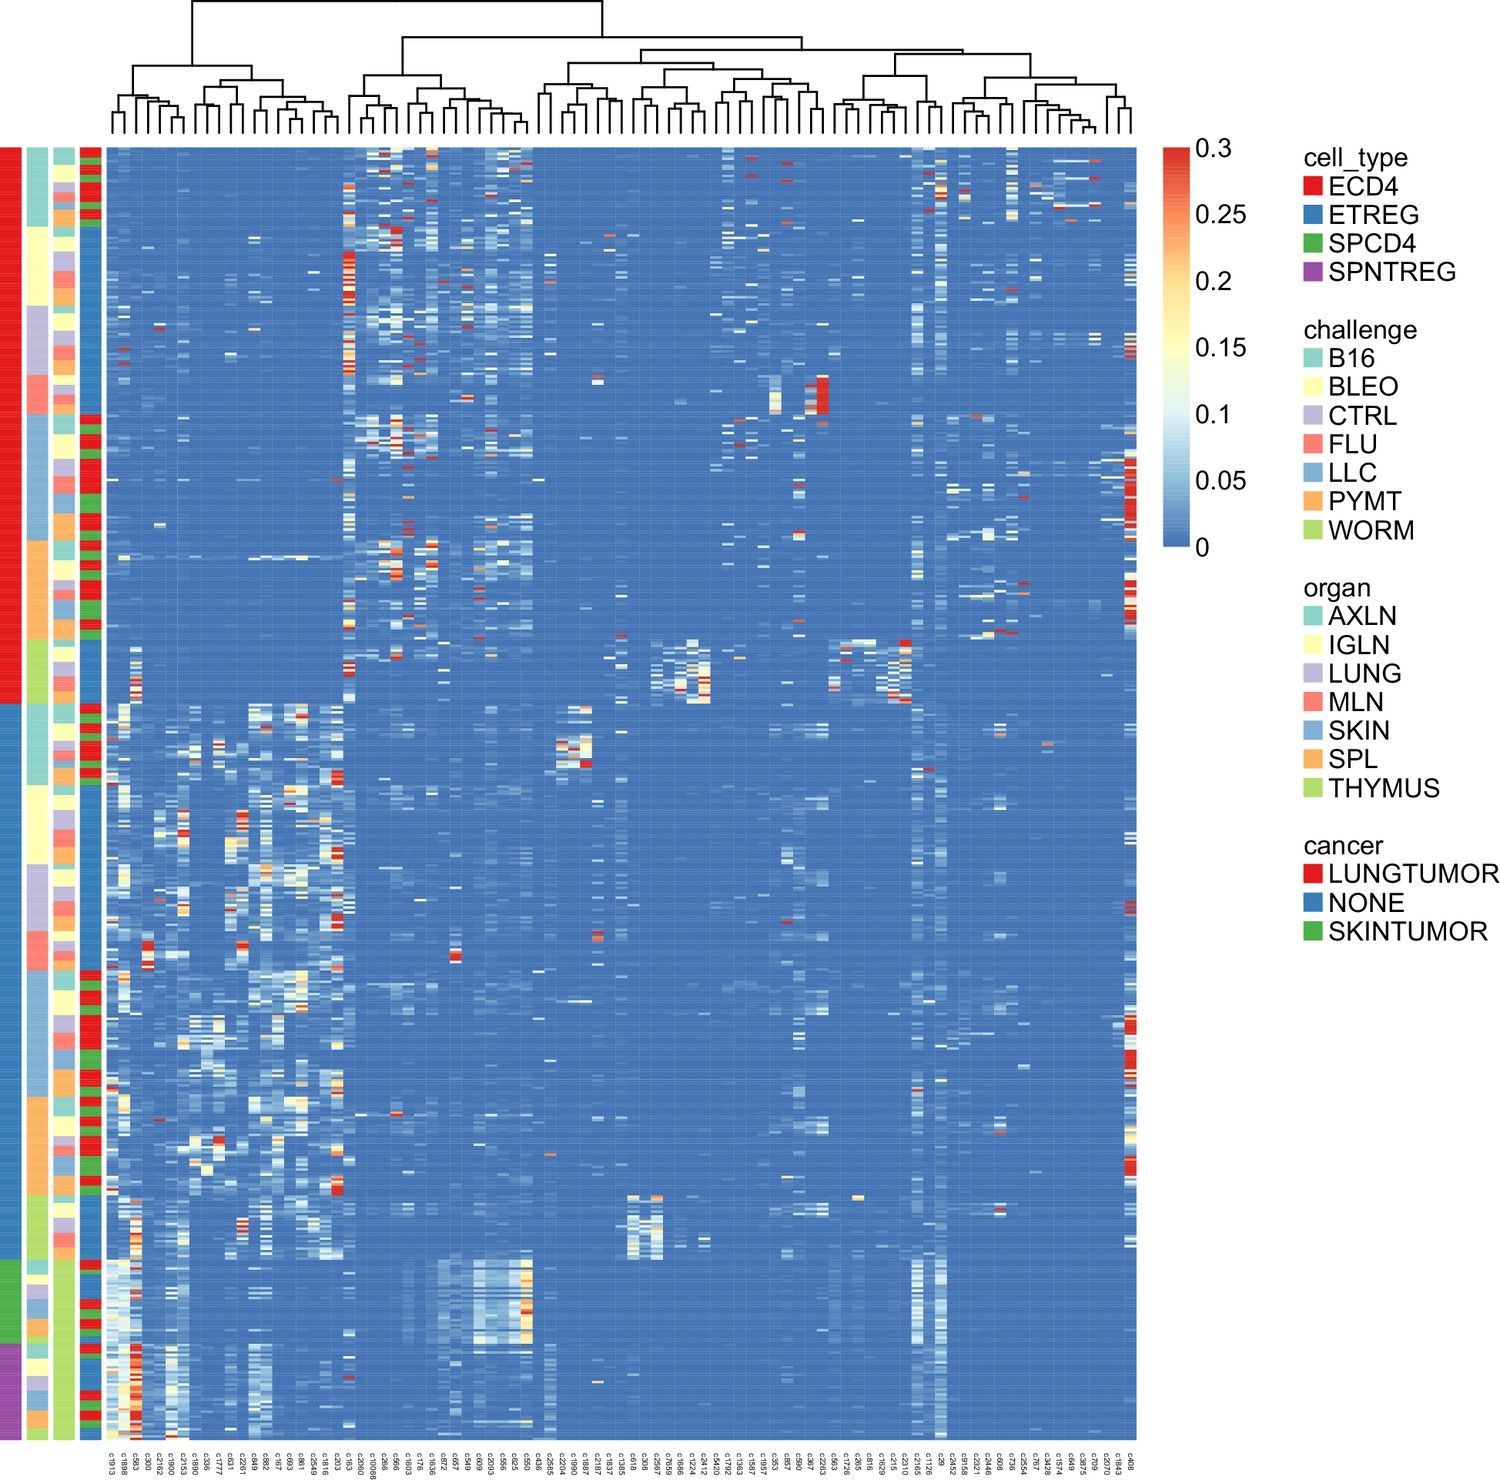
TCRα CDR3 clusters behavior in response to different antigenic challenges.
In this TCR homology cluster expression matrix, each column corresponds to a TCR sequence homology cluster (i.e. group of TCR clonotypes having similar TCRα CDR3 sequences) and each row corresponds to a particular condition (e.g. tissue type, antigenic challenge, etc). The color of each cell highlights the overall (sum of frequency across all clonotypes) expression of each cluster in a given condition. Rows are sorted by cell type, challenge, organ, and cancer type as highlighted by the colored bands at left; columns are sorted according to hierarchical clustering of TCR cluster expression.
Figure 3—figure supplement 2
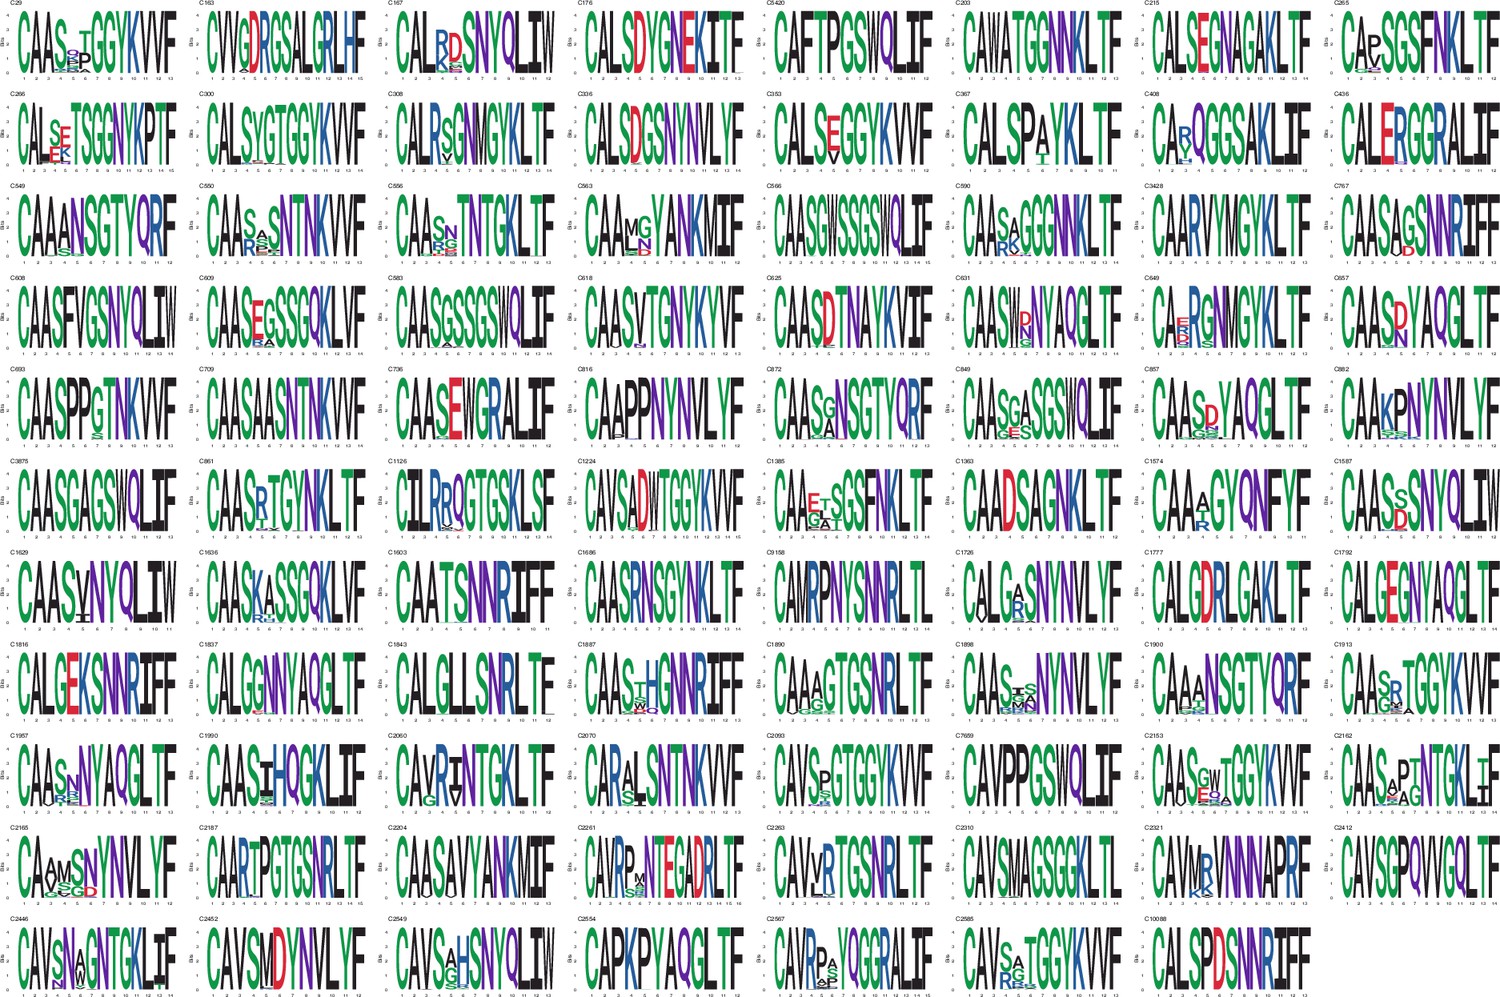
TCRα CDR3 cluster motifs.
Figure 4
Convergence of eTreg and eCD4 TCR response in distinct tissues.
(a,b) Relative overlap between amino acid-defined lung and mediastinal lymph node (MLN) (upon lung challenge) and skin (upon skin challenge) eTreg TCRα CDR3 repertoires as visualized using VDJtools. Data were normalized to the top 1000 most frequent clonotypes and weighted by clonotype frequency (F2 metric in VDJtools). Clonotypes were matched on the basis of identical TRAV gene segments and identical TCRα CDR3 sequences. (a) Dendrogram branch length shows the distance between repertoires. (b) Euclidean distance between points on the MDS plot reflects the distance between repertoires. The closer the two samples are, the higher the overall frequency of shared clonotypes. Mice were analyzed in an all-versus-all fashion, irrespective of whether tissues were obtained from the same or distinct mice. Node colors correspond to different challenges. Circles: lung. Crossed squares: skin. (c) Relative overlap between amino acid-defined lung and MLN (upon lung challenge) and skin (upon skin challenge) eCD4 TCRα CDR3 repertoires.
Figure 5
Estimated eCD4 to eTreg conversion.
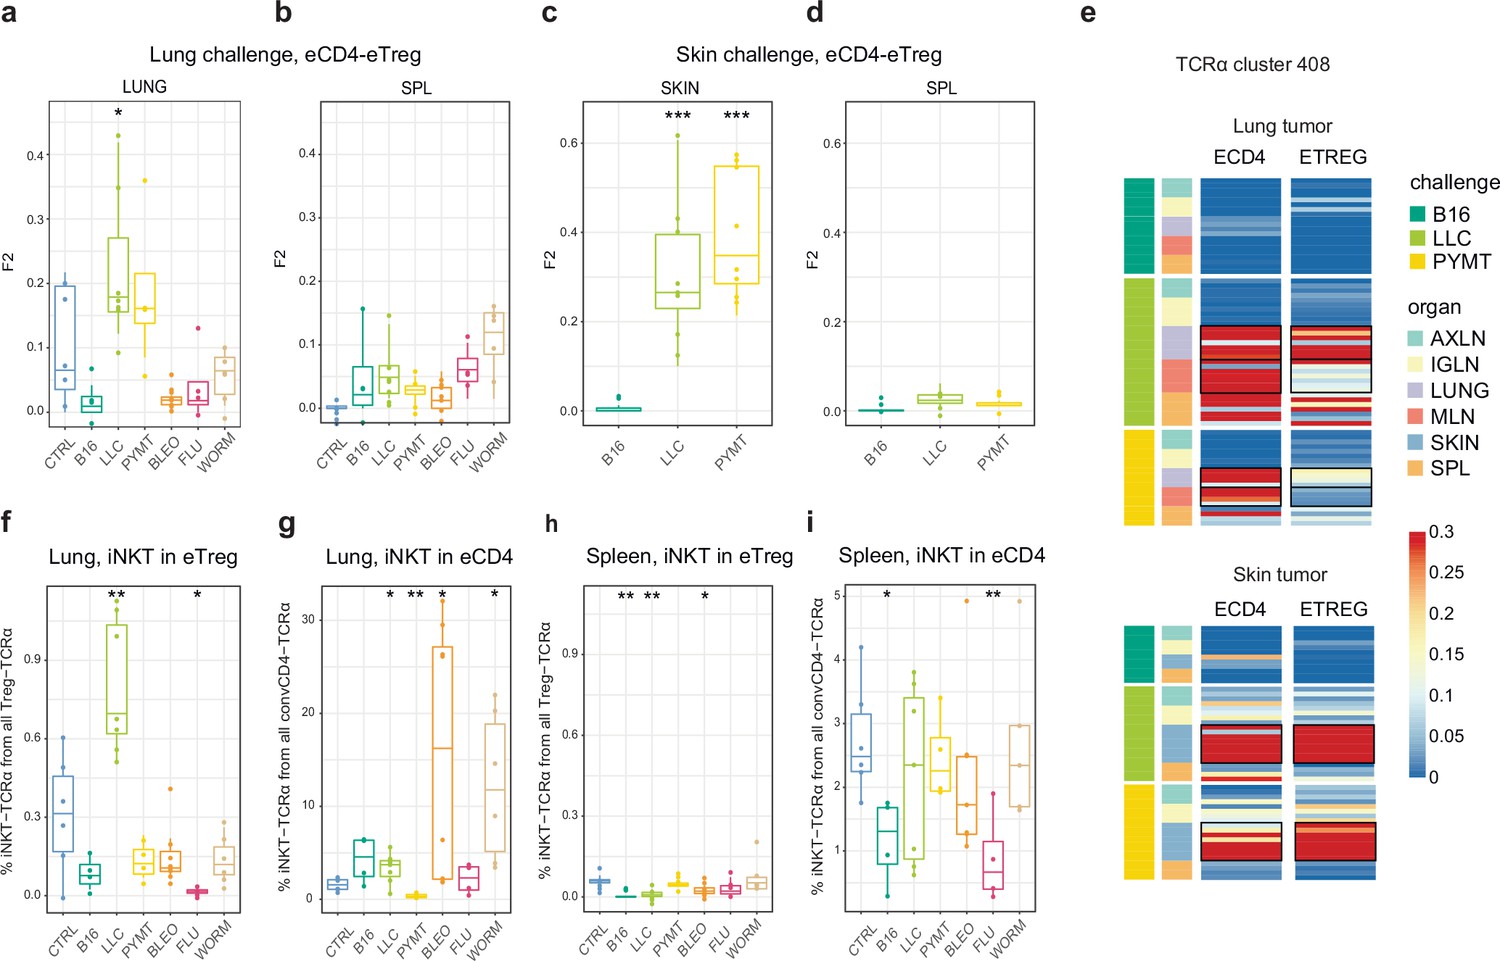
(a–d) Relative overlap between eTreg and eCD4 nucleotide-defined TCRα CDR3 repertoires upon lung (a, b) and skin (c, d) challenges. Overlaps are shown for the same organ (a, c) and spleen (c, d) Data were normalized to the 100 most frequent nucleotide CDR3 clonotypes and overlap was weighted by clonotype frequency (F2 metric). Clonotypes were matched on the basis of identical TRAV and TRAJ gene segments and identical TCRα CDR3 nucleotide sequences. Overlap was analyzed separately for each challenge for eTreg and eCD4 subsets obtained from the same mice, 3 < n < 8. The closer the two samples are, the higher the F2 metric, which reflects the overall frequency of shared clonotypes. (e) Distribution of T cell receptor (TCR) cluster 408 in eTreg and eCD4 repertoires upon tumor challenge in lung and skin. (f) Treg-iNKT proportion of eTreg cells in lung upon lung challenge. (g) Innate natural killer T cell (iNKT) proportion of eCD4 cells in the lung upon lung challenge. (h) Treg-iNKT proportion of eTreg cells in spleen upon lung challenge. (i) iNKT proportion of eCD4 cells in the spleen upon lung challenge. p-values are shown as: *p<0.05, **p<0.01, ***p<0.001, and ****p<0.0001 based on parametric t-test for each group versus control. Boxplots show minimum value, the 25th percentile, the median, the 75th percentile and the maximum value.
Figure 6
Lymphatic tissue-resident eTreg and eCD4 cells.
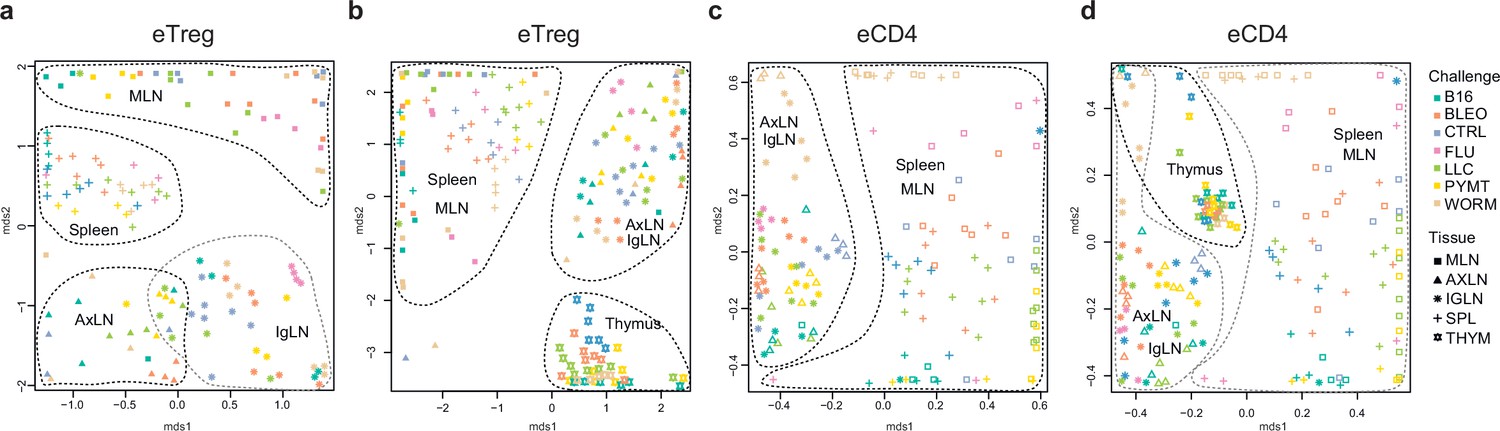
(a–d) MDS plots showing the relative overlap between amino acid-defined eTreg TCRα CDR3 repertoires as visualized using VDJtools. Repertoire overlaps are shown for (a) eTreg in mediastinal lymph node (MLN), spleen, axillary (AXLN), and intraglandular (IgLN); (b) eTreg in MLN, spleen, AXLN, IgLN, and thymus; (c) eCD4 in MLN, spleen, AXLN, and IgLN; and (d) eCD4 in MLN, spleen, AXLN, IgLN, and thymus. Data were normalized to the top 1000 most frequent clonotypes and weighted by clonotype frequency (F2 metric). Clonotypes were matched on the basis of identical TRAV gene segments and identical TCRα CDR3 sequences. Euclidean distance between points reflects the distance between repertoires; the closer two samples are, the higher is the overall frequency of shared clonotypes. Mice were analyzed in an all-versus-all fashion, irrespective of whether the tissues were obtained from the same or distinct mice. Node colors correspond to the different challenges. Squares: MLN. Triangles: AXLN. Snowflakes: IGLN. Crosses: spleen. Stars: thymus.
Additional files
-
Supplementary file 1
Mouse groups metadata.
- https://cdn.elifesciences.org/articles/89382/elife-89382-supp1-v1.xlsx
-
Supplementary file 2
Sample metadata.
- https://cdn.elifesciences.org/articles/89382/elife-89382-supp2-v1.xlsx
-
Supplementary file 3
eCD4 versus eTreg sample pairing.
- https://cdn.elifesciences.org/articles/89382/elife-89382-supp3-v1.xlsx
-
Supplementary file 4
TCR clusters.
- https://cdn.elifesciences.org/articles/89382/elife-89382-supp4-v1.txt
-
Supplementary file 5
TCR cluster frequency.
- https://cdn.elifesciences.org/articles/89382/elife-89382-supp5-v1.txt
-
MDAR checklist
- https://cdn.elifesciences.org/articles/89382/elife-89382-mdarchecklist1-v1.docx
Download links
A two-part list of links to download the article, or parts of the article, in various formats.
Downloads (link to download the article as PDF)
Open citations (links to open the citations from this article in various online reference manager services)
Cite this article (links to download the citations from this article in formats compatible with various reference manager tools)
Convergence, plasticity, and tissue residence of regulatory T cell response via TCR repertoire prism
eLife 12:RP89382.
https://doi.org/10.7554/eLife.89382.3


