Integrative analysis of DNA replication origins and ORC-/MCM-binding sites in human cells reveals a lack of overlap
- Center for Public Health Genomics, University of Virginia School of Medicine, United States
- Department of Biochemistry and Molecular Genetics, University of Virginia School of Medicine, United States
- Department of Genetics, University of Alabama at Birmingham, United States
- Department of Public Health Sciences, University of Virginia, United States
Figures
Figure 1 with 2 supplements
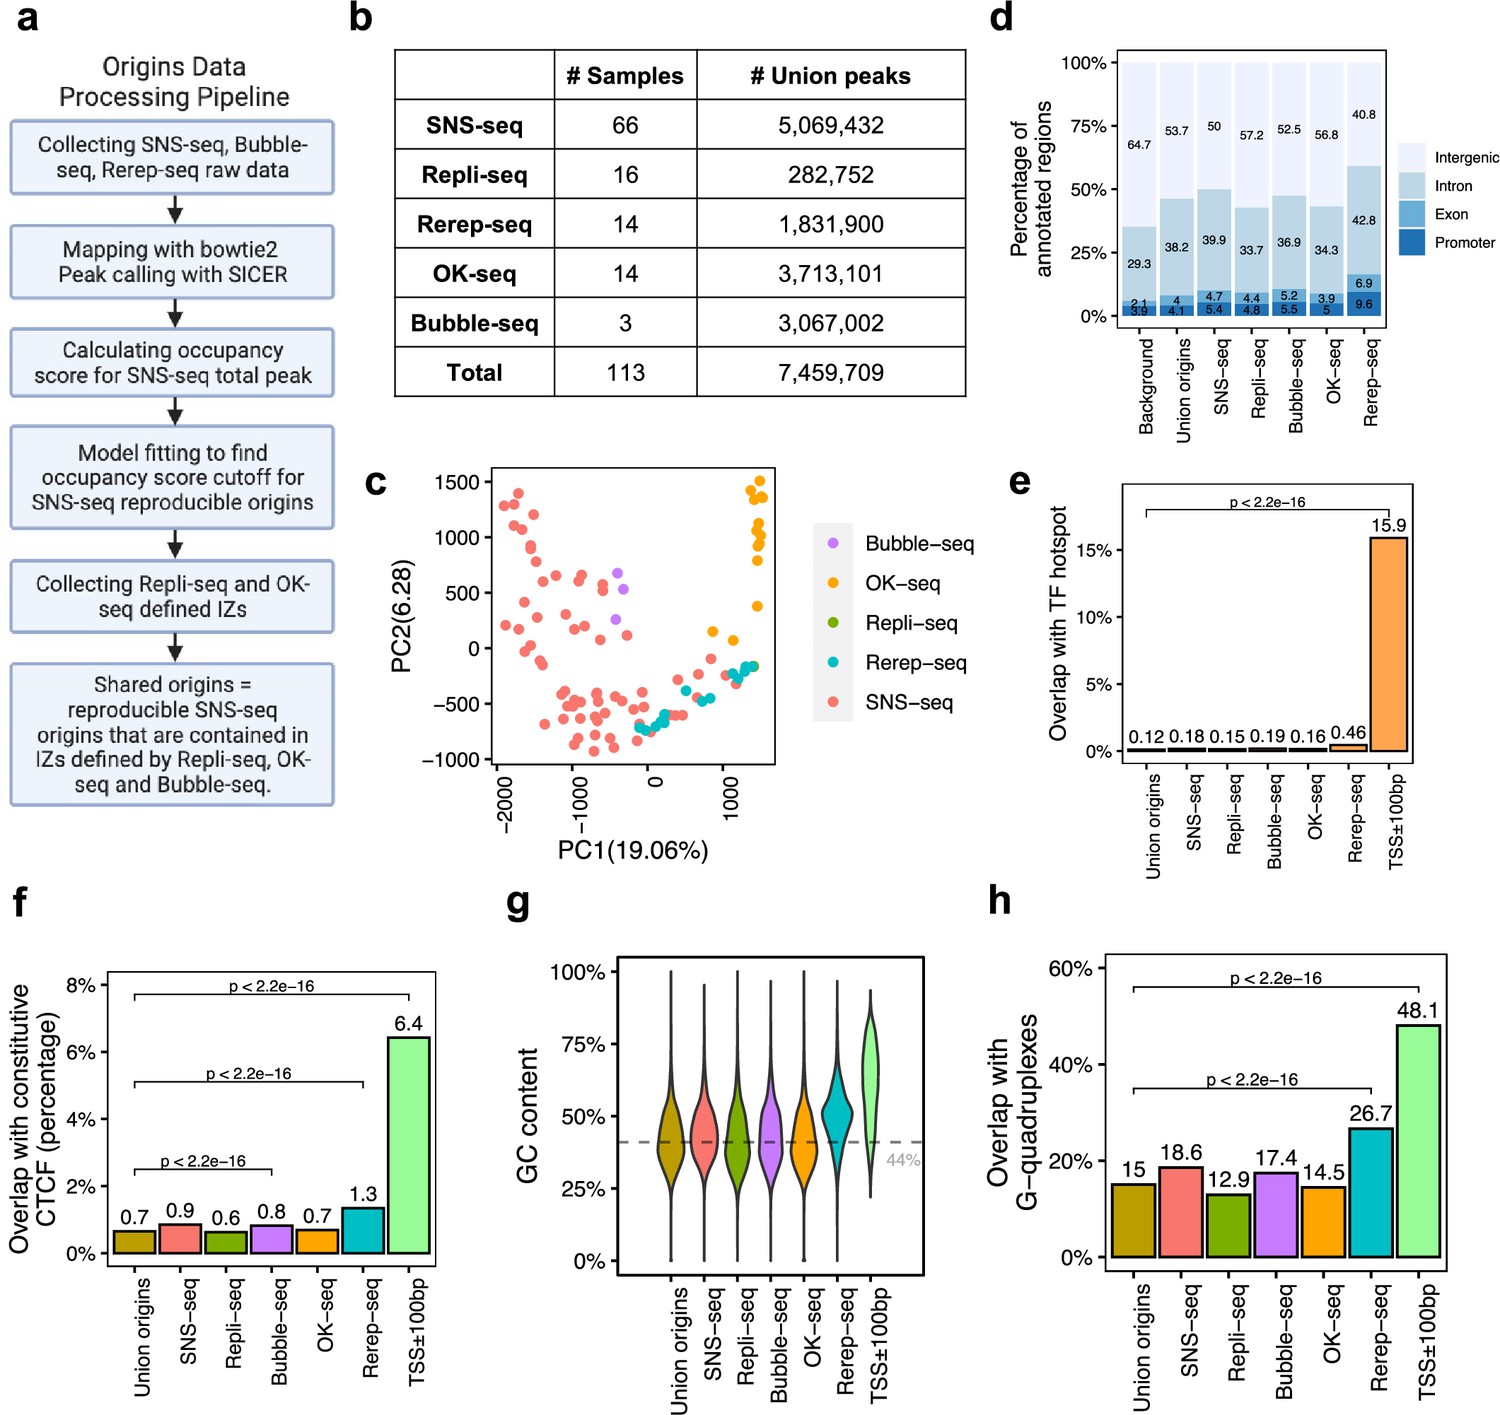
A total of 7,459,709 origins defined by four types of techniques show different genomic features.
(a) Data processing pipeline. A total of 113 publicly available profiles of origins are processed following the pipeline. (b) Number of samples collected for each technique. In total, 7,459,709 union origins were identified. (c) Principal component analysis (PCA) shows the clustering of origin datasets from different techniques. (d) Genomic annotation (transcription start sites [TSS], exon, intron, and intergenic regions) of different groups of origins. Background is the percentage of each annotation on the whole genome. (e) Overlap with TF hotspots for different groups of origins and promoters. (f) Overlap with constitutive CTCF-binding sites for different groups of origins and promoters. (g) GC content of different groups of origins and promoters. Gray line marks the average GC content of the human genome. (h) G-quadruplex overlapping rates of different groups of origins and promoters.
Figure 1—figure supplement 1
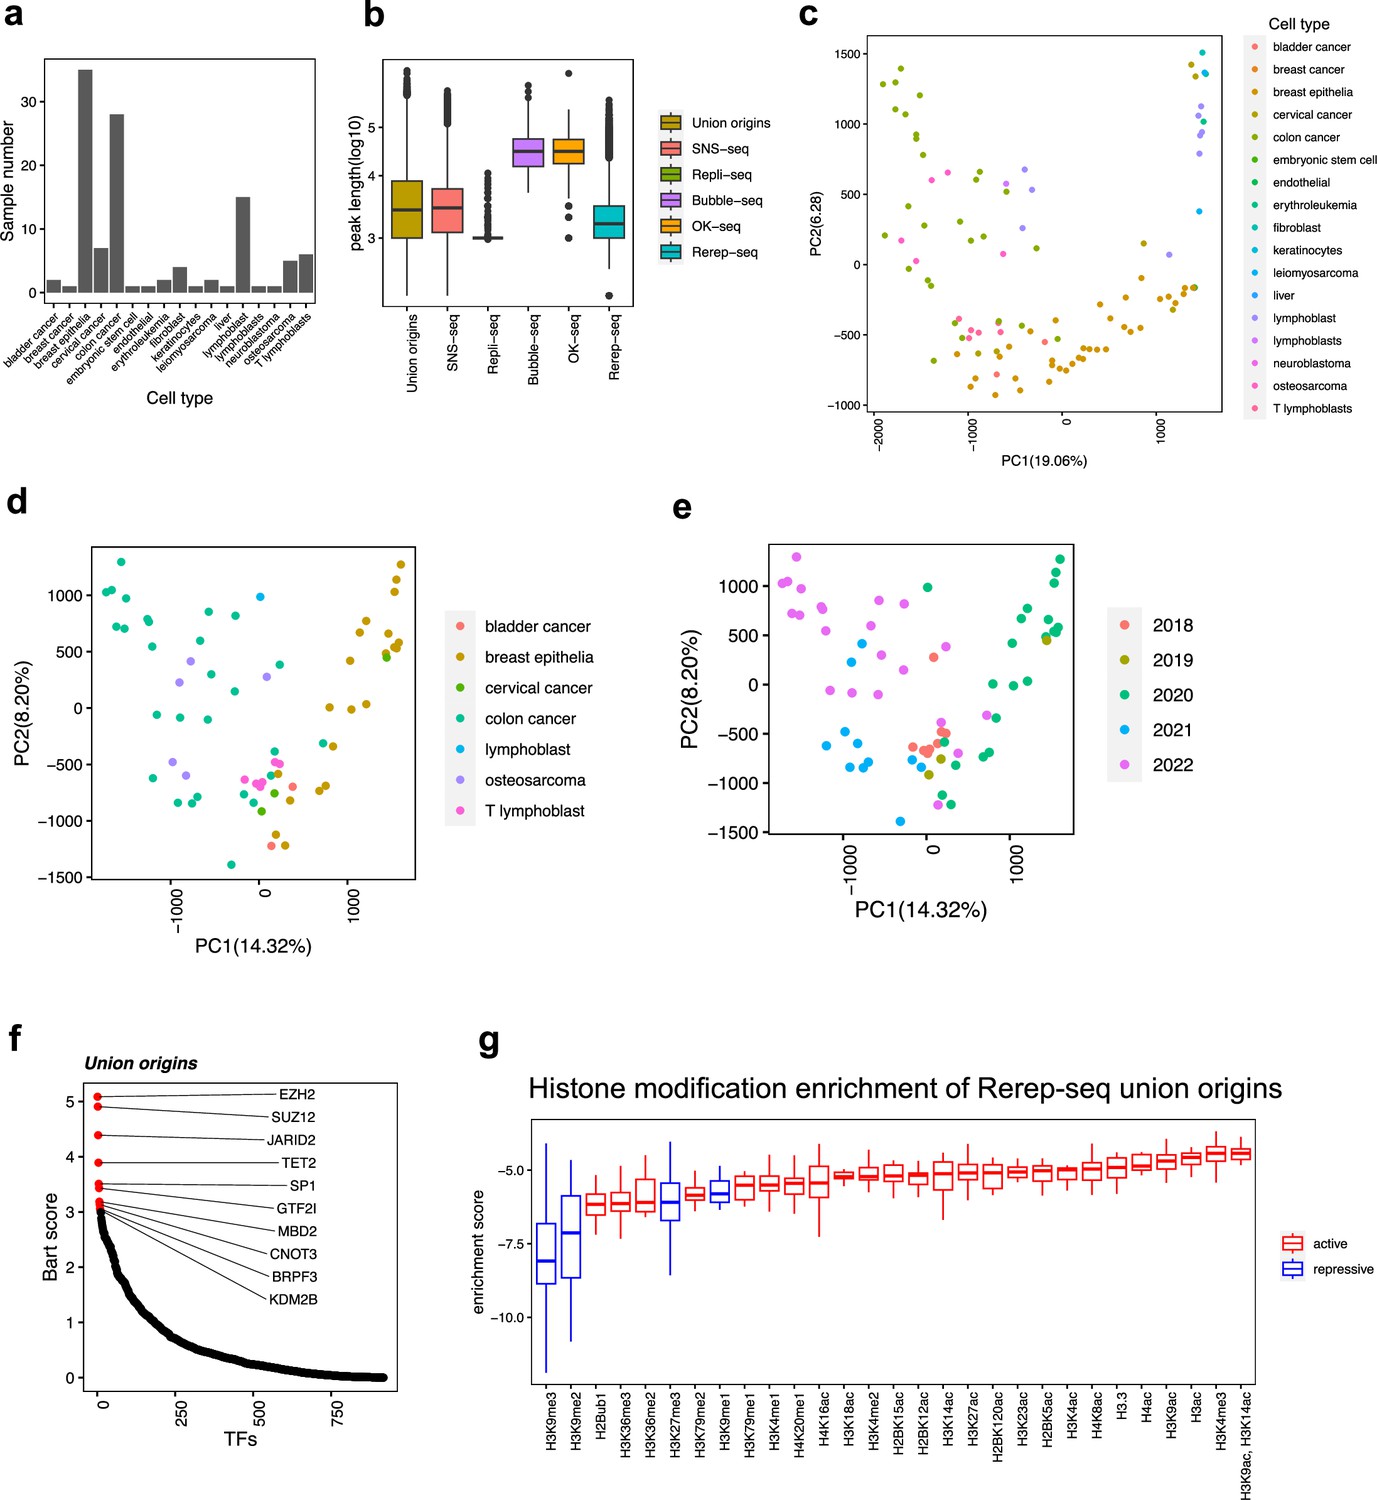
Distribution of origins defined by four types of techniques.
(a) For each cell type, how many samples we have collected. (b) Distribution of peak length of origins from each technique. (c) Principal component analysis (PCA) results of all samples, marked by cell types. (d) PCA results of short nascent strand-seq (SNS-seq) samples, marked by cell types. (e) PCA results of SNS-seq samples, marked by the year of the data uploaded. (f) BART2 results of union origins. (g) Enrichment of histone marks at re-replicated union origins using total union origins as control.
Figure 1—figure supplement 2
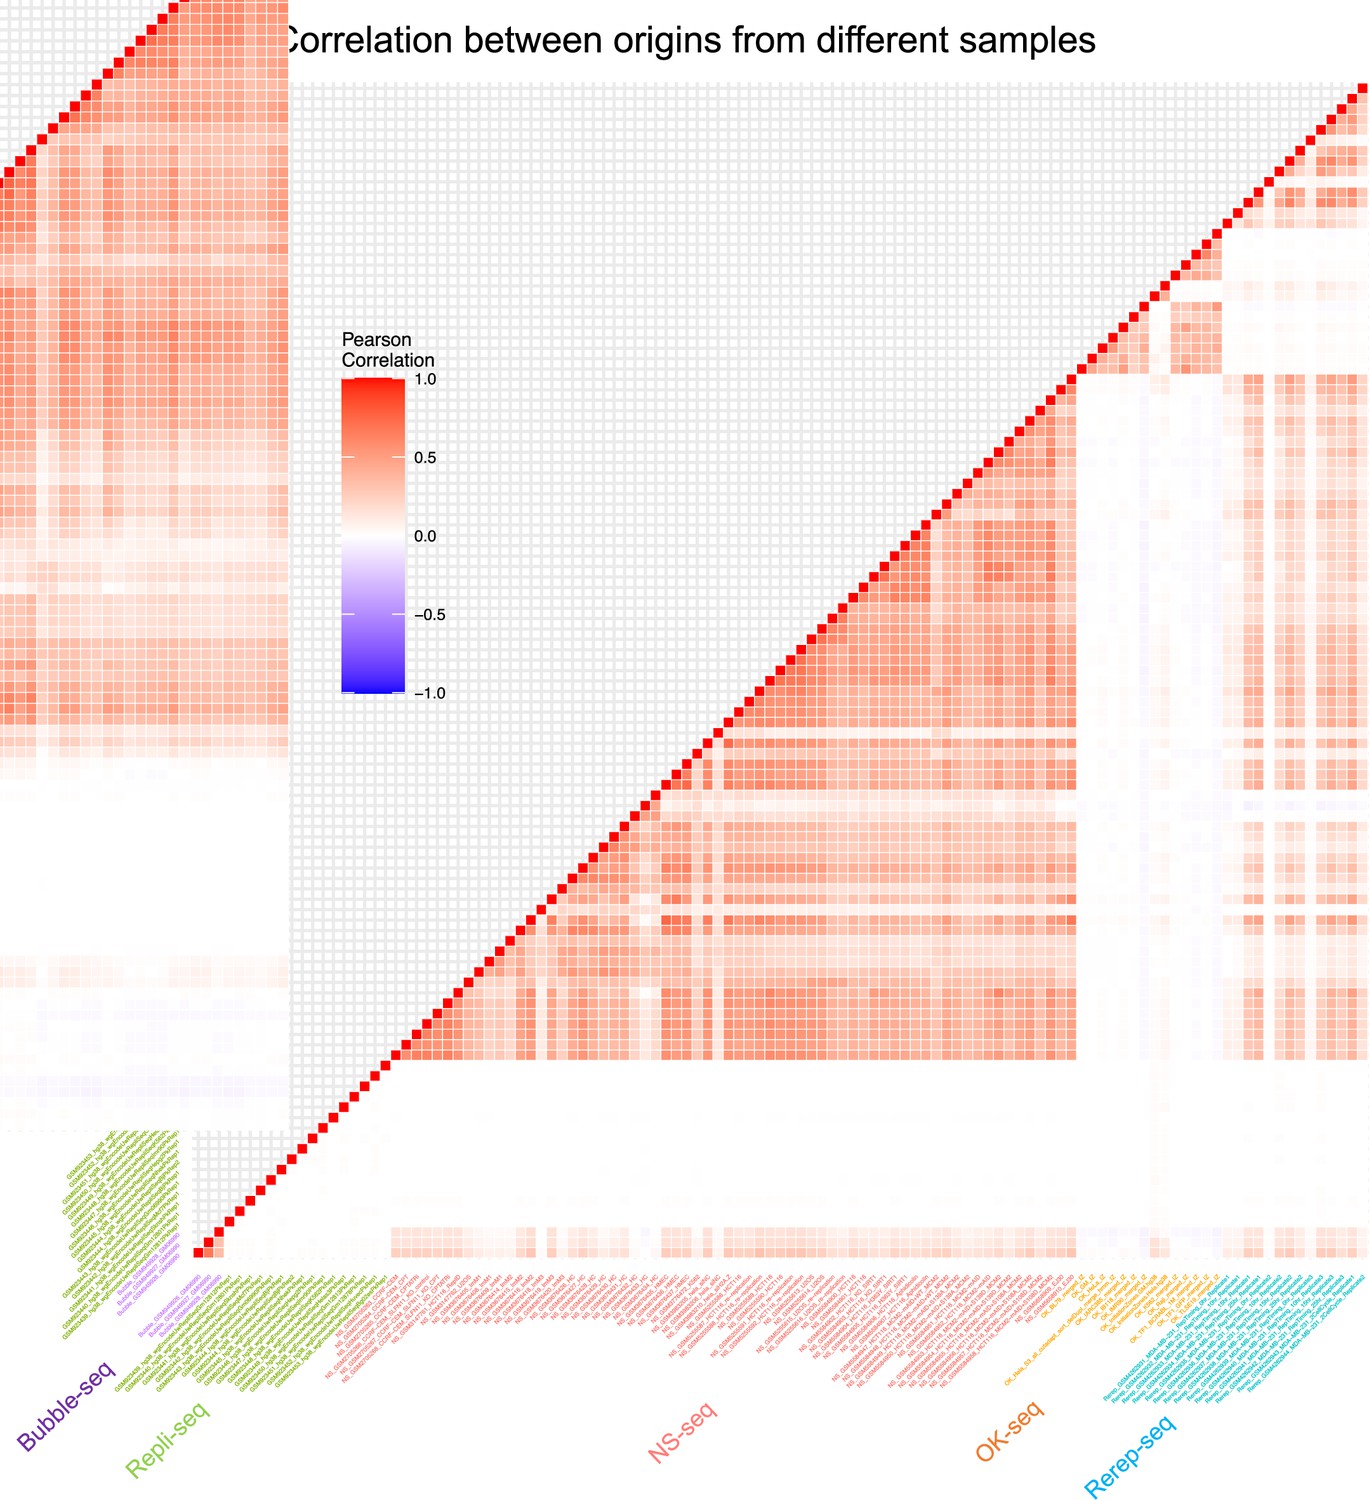
Correlation between origins from different samples.
Pairwise correlation of samples from different techniques.
Figure 2 with 2 supplements
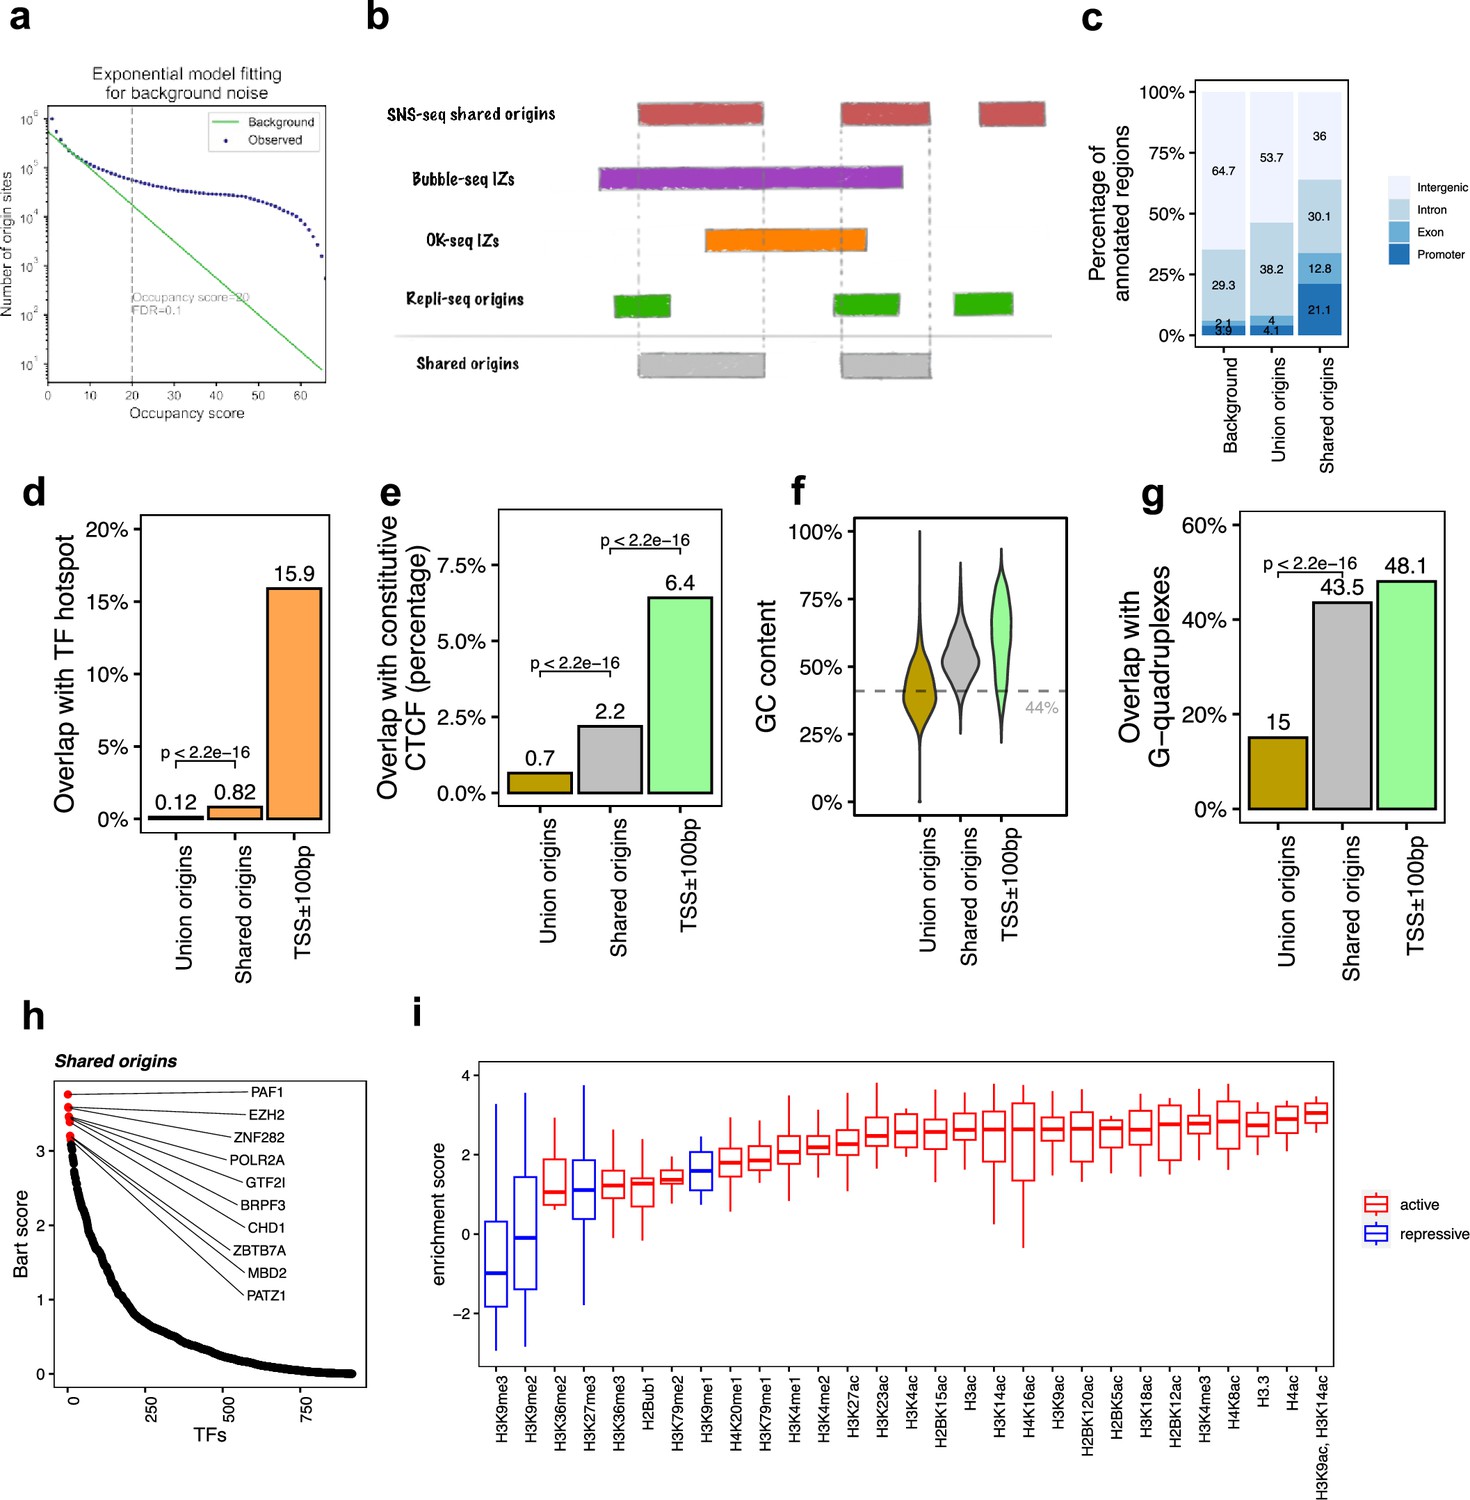
The shared origins are enriched with certain transcription factors and active histone marks.
(a) Short nascent strand-seq (SNS-seq) origin-fitting distribution to an exponential model shows an occupancy score ≥20 is selected for reproducible SNS-seq origins. (b) Conceptual model of how the shared origins are determined. Any SNS-seq shared origin that overlaps with Bubble-seq initiation zone (IZ), Okazaki-seq (OK-seq) IZ, and Repli-seq origin together is considered as an origin identified by all four techniques (shared origins). (c) Genomic annotation of union origins and shared origins. (d) Overlap with TF hotspots of union origins and shared origins. (e) Overlap with constitutive CTCF-binding sites of union origins and shared origins. (f) GC content of union origins and shared origins. (g) G-quadruplex overlapping rates of union origins and shared origins. (h) BART prediction of TFs associated with shared origins. (i) Enrichment of histone marks at shared origins using all union origins as control.
Figure 2—figure supplement 1

Background model for the identification of the shared origins.
(a) Conceptual model of how occupancy score is defined to represent the number of samples that each origin occurs. (b) Distribution of occupancy score of short nascent strand-seq (SNS-seq) union origins (300 bp).
Figure 2—figure supplement 2
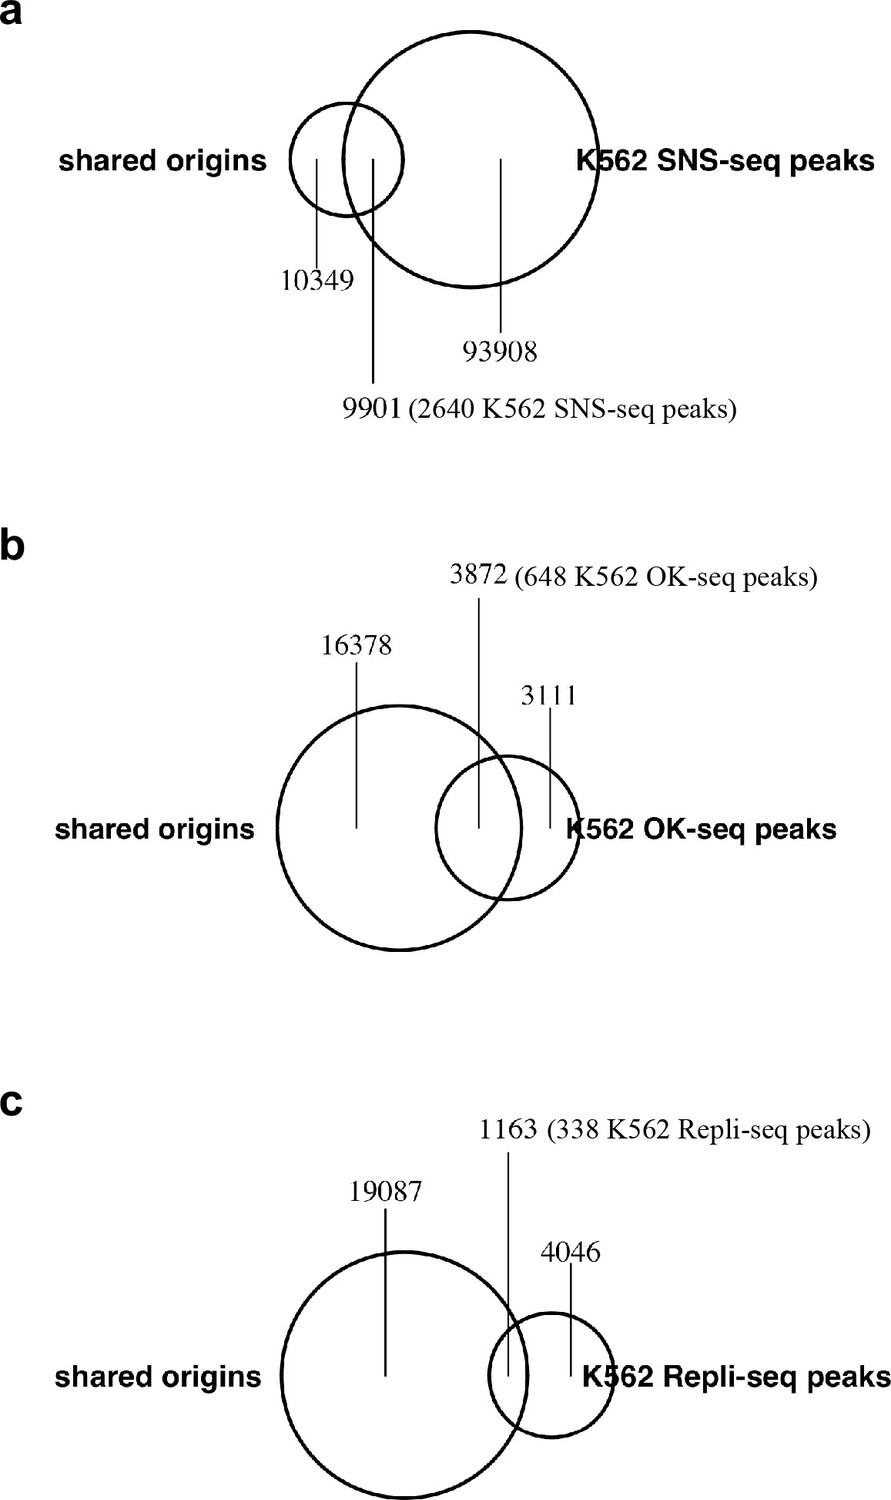
Origins/IZs defined by different techniques: (a) SNS-seq, (b) OK-seq and (c) Repli-seq in K562 cell line and their overlap with the shared origins.
Shared origins are defined from all samples. The number of shared origins covered by each file is calculated and marked in the figure.
Numbers in the parentheses are the number of peaks in the other dataset that overlap with the shared origins.
Figure 3 with 1 supplement
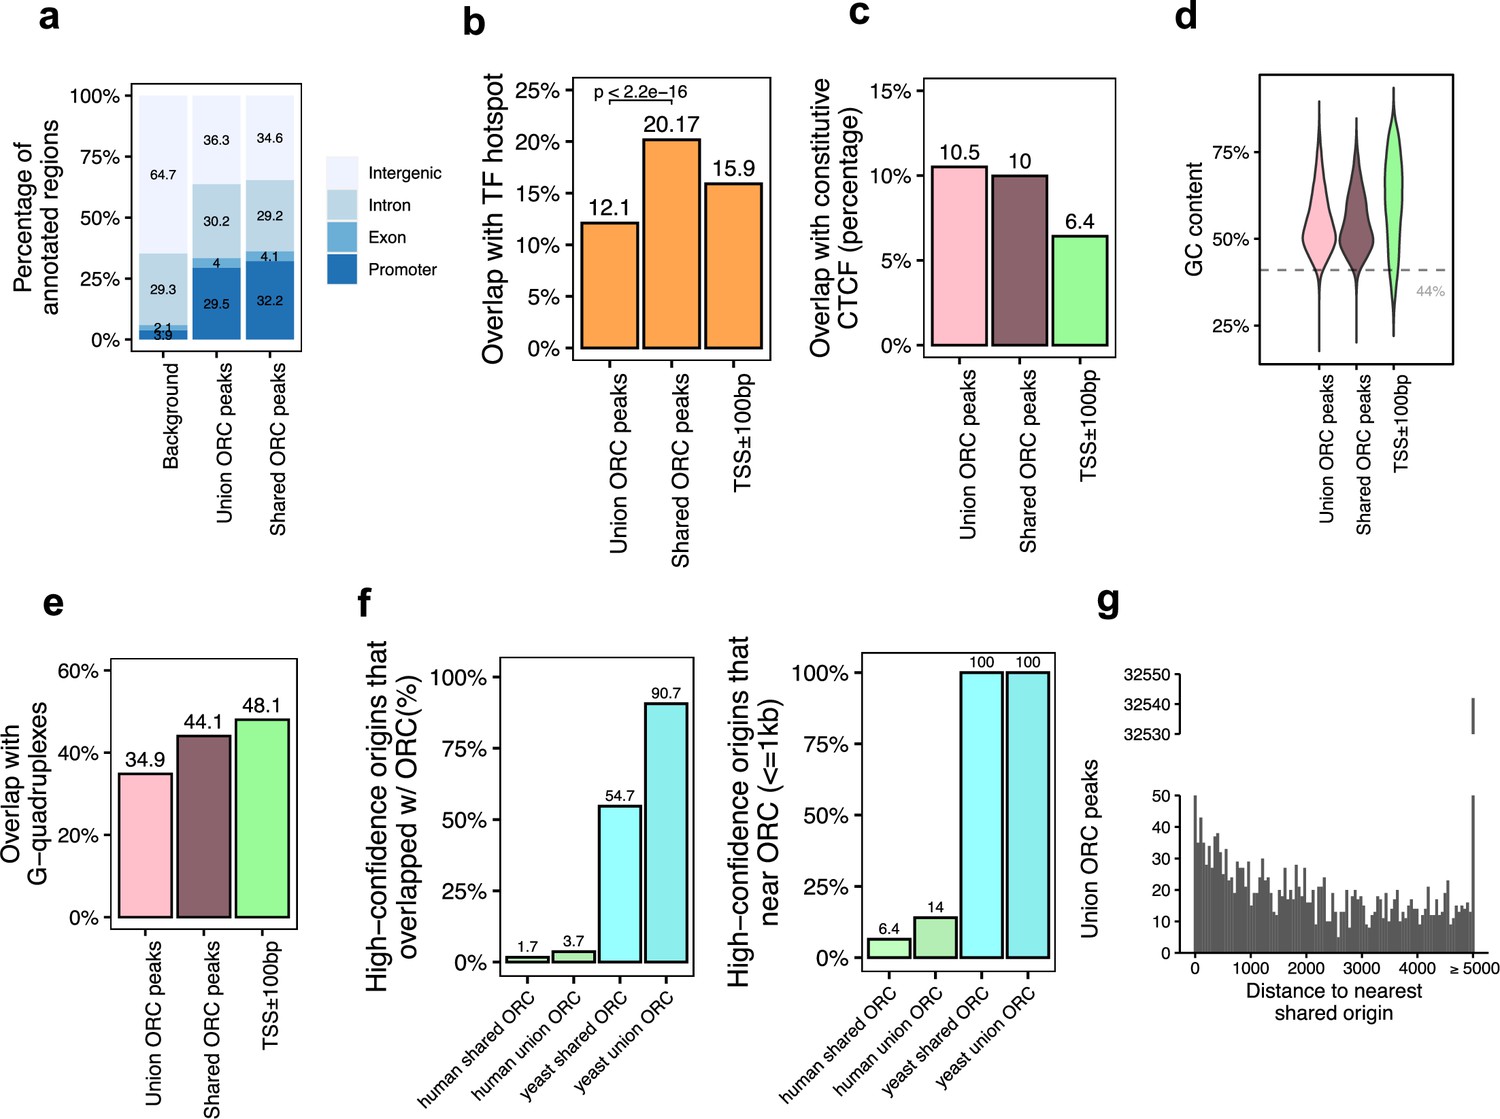
Genomic features of the shared origin recognition complex (ORC)-binding sites and their co-localization with the shared origins.
(a) Genomic annotation of union ORC and shared ORC-binding sites. (b) Overlap with TF hotspot of union ORC and shared ORC-binding sites. (c) Overlap with constitutive CTCF-binding sites of union ORC and shared ORC-binding sites. (d) GC content of union ORC and shared ORC-binding sites. (e) Overlap with G-quadruplex of union ORC and shared ORC-binding sites. (f) The percentage of high-confidence origins (shared origins in humans and confirmed origins in yeast) that overlapped with (left) or are proximate to (≤1 kb) (right) two types of ORC-binding sites (union or shared). (g) Distribution of the distance between ORC-binding sites and the nearest shared origin.
Figure 3—figure supplement 1
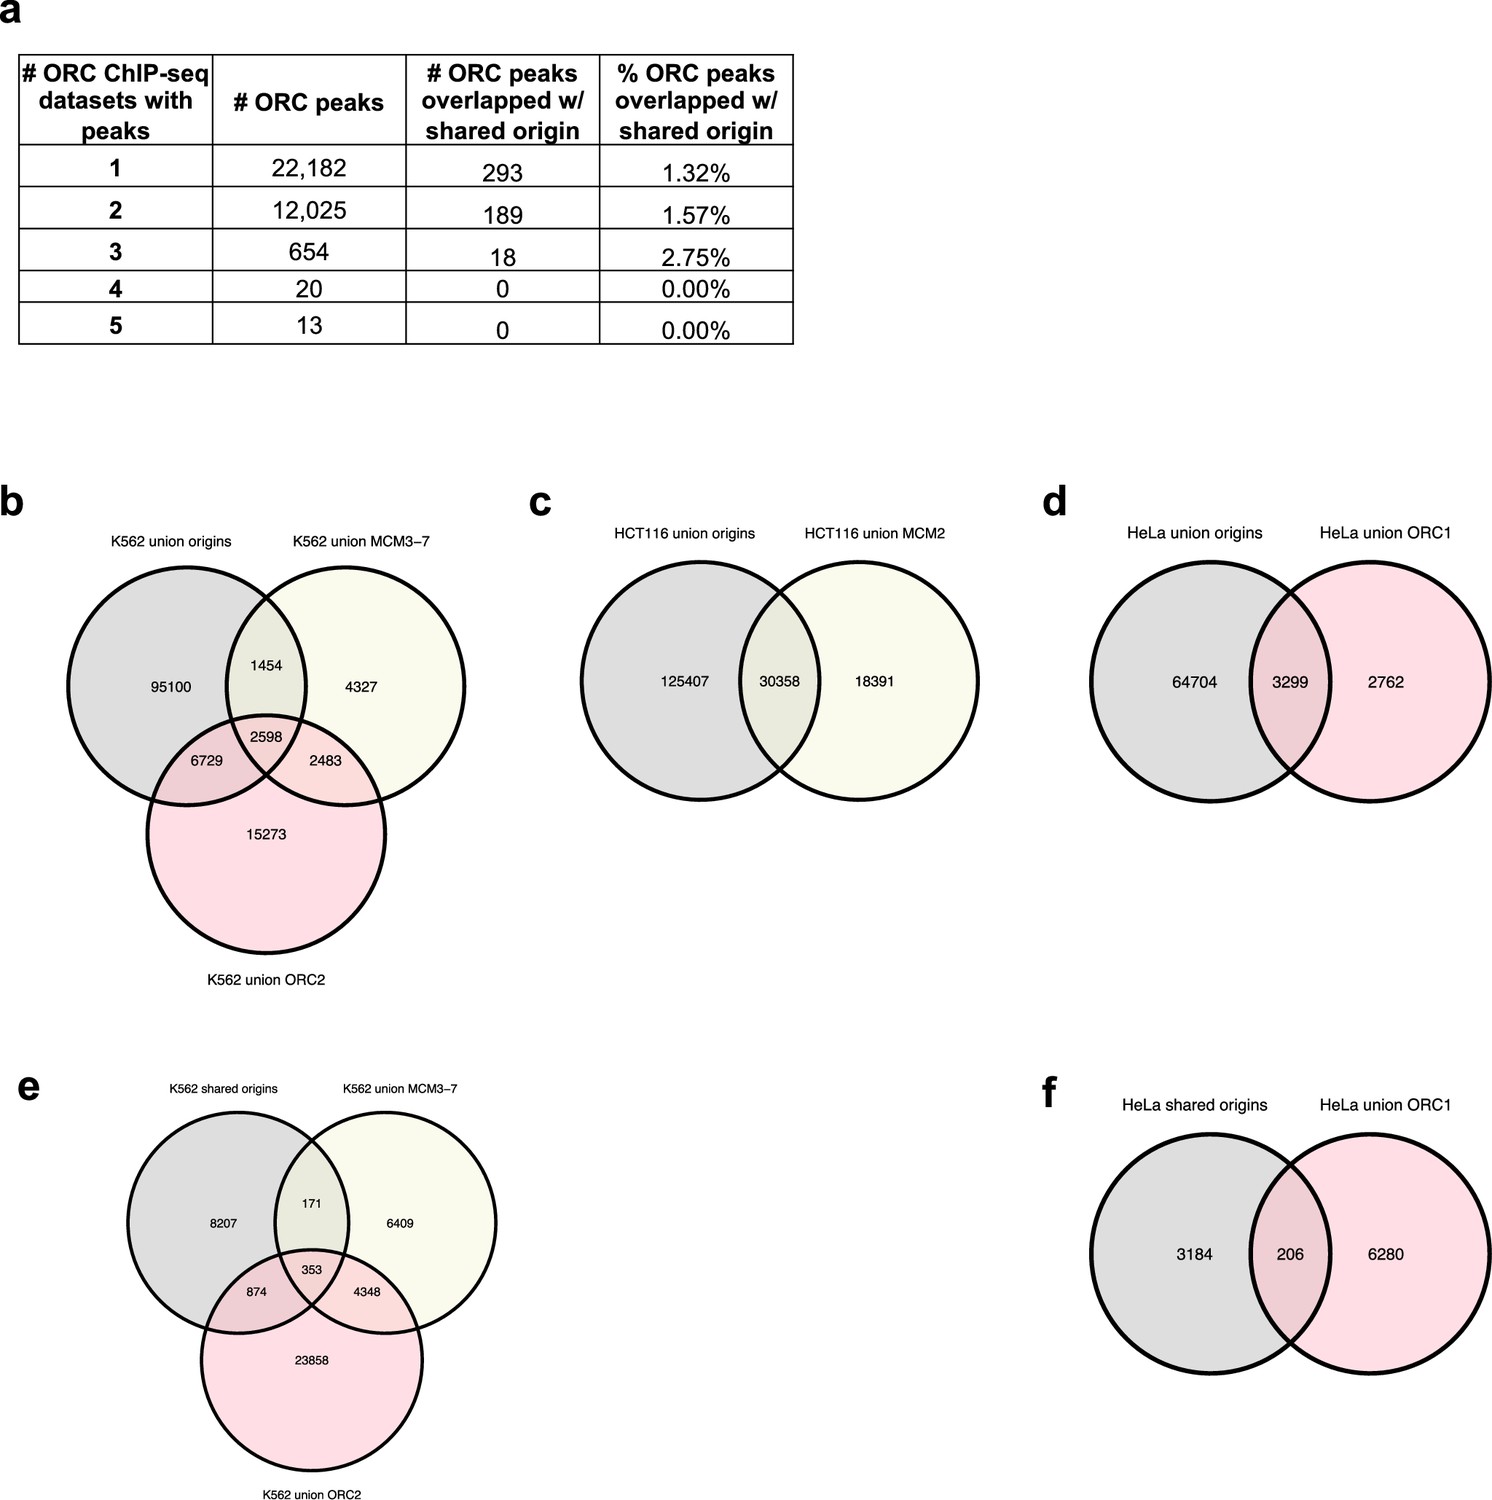
Analysis of overlap between the shared origin recognition complex (ORC)-binding sites and origins.
(a) A total of 12,712 ORC-binding sites in the human genome were shared by at least two ORC ChIP-seq datasets. The overlapping rates with the shared origins are provided. (b) Overlapping of union origins, MCM3-7, and ORC2 in K562 cell line. (c) Overlapping of union origins and MCM2 in HCT116 cell line. (d) Overlapping of union origins and ORC1 in HeLa cell line. (e) Overlapping of shared origins seen in K562 cells with ORC and MCM-binding sites in K562 cells. Shared origins seen in K562 cells were generated from short nascent strand-seq (SNS-seq) files that overlapped with K562 initiation zones (IZs) (defined by Okazaki-seq [OK-seq] and Repli-seq). (f) Overlapping of shared origins seen in HeLa cells with ORC-binding sites in HeLa cells. The shared origins seen in HeLa cells were generated from three HeLa derived SNS-seq samples using the intersected peaks from NS_GSM3983205_hela_siNC.bed, NS_GSM3983206_hela_siNC.bed, NS_GSM3983210_hela_siH2A.Z.bed.
Figure 4
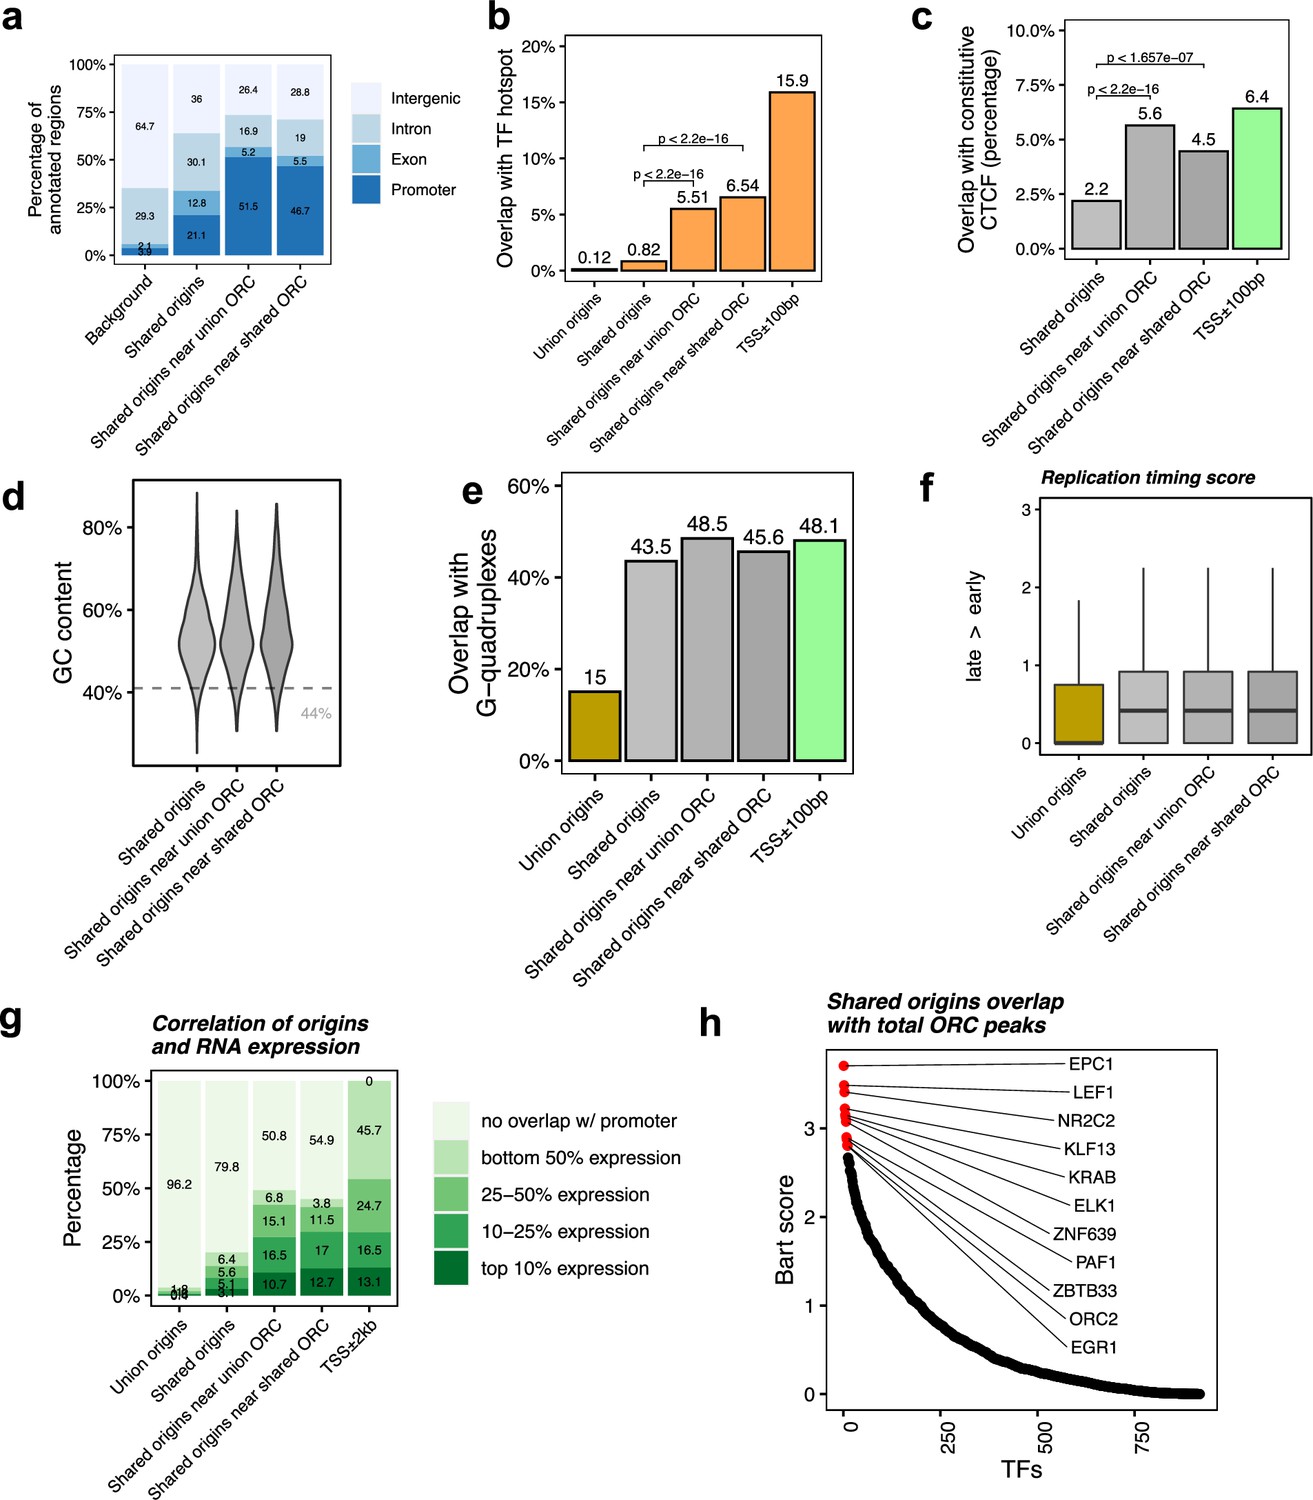
Shared origins near shared origin recognition complex (ORC)-binding sites are more correlated with active transcription.
(a) Genomic annotation of shared origins and shared origins near (≤1 kb) the ORC-binding sites. (b) Overlap with TF hotspots of shared origins and shared origins near the ORC-binding sites. (c) Overlap with constitutive CTCF-binding sites of shared origins and shared origins near the ORC-binding sites. (d) GC content of shared origins and shared origins near the ORC-binding sites. (e) Overlap with G-quadruplex sites of shared origins and shared origins near the ORC-binding sites. (f) Y-axis: replication timing score from Navarro Gonzalez et al., 2021 for the indicated classes of origins. (g) Annotation of expression level of genes that overlapped with different groups of origins. (h) BART prediction of TFs associated with the highest confidence origins.
Figure 5 with 4 supplements
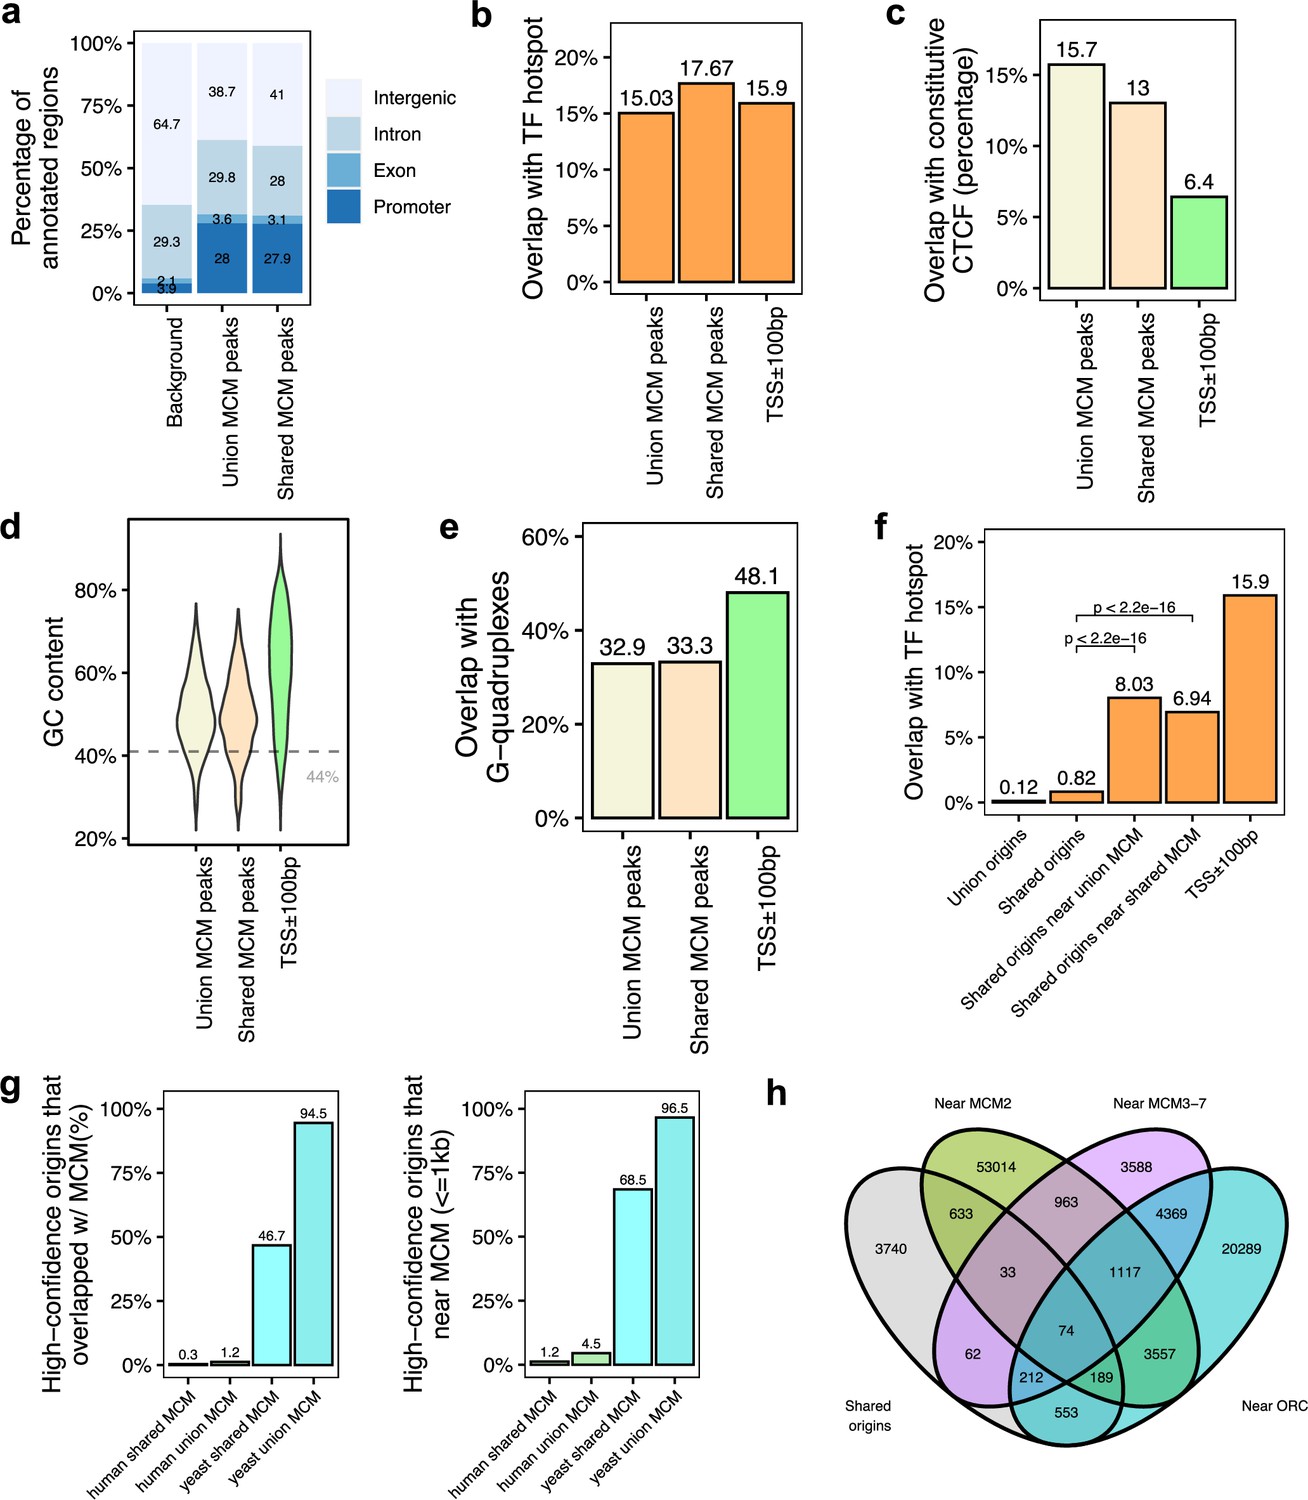
Genomic features of the shared minichromosome maintenance complex (MCM)-binding sites and their co-localization with the shared origins.
(a) Genomic annotation of union MCM and shared MCM-binding sites. (b) Overlap with TF hotspot of union MCM and shared MCM-binding sites. (c) Overlap with constitutive CTCF-binding rates of union MCM and shared MCM-binding sites. (d) GC content of union MCM and shared MCM-binding sites. (e) Overlap with G-quadruplex of union MCM and shared MCM-binding sites. (f) Overlap with TF hotspots of shared origins and shared origins near the MCM-binding sites. (g) The percentage of high-confidence origins (shared origins in humans and confirmed origins in yeast) that overlapped with (left) or are proximate to (≤1 kb) (right) two types of MCM-binding sites (union or shared). (h) Venn diagram of the shared origins that are near the ORC-, MCM2-, or MCM3-7-binding sites.
Figure 5—figure supplement 1

Analyses of a few selected origin sets suggested by the reviewers.
Figure 5—figure supplement 2
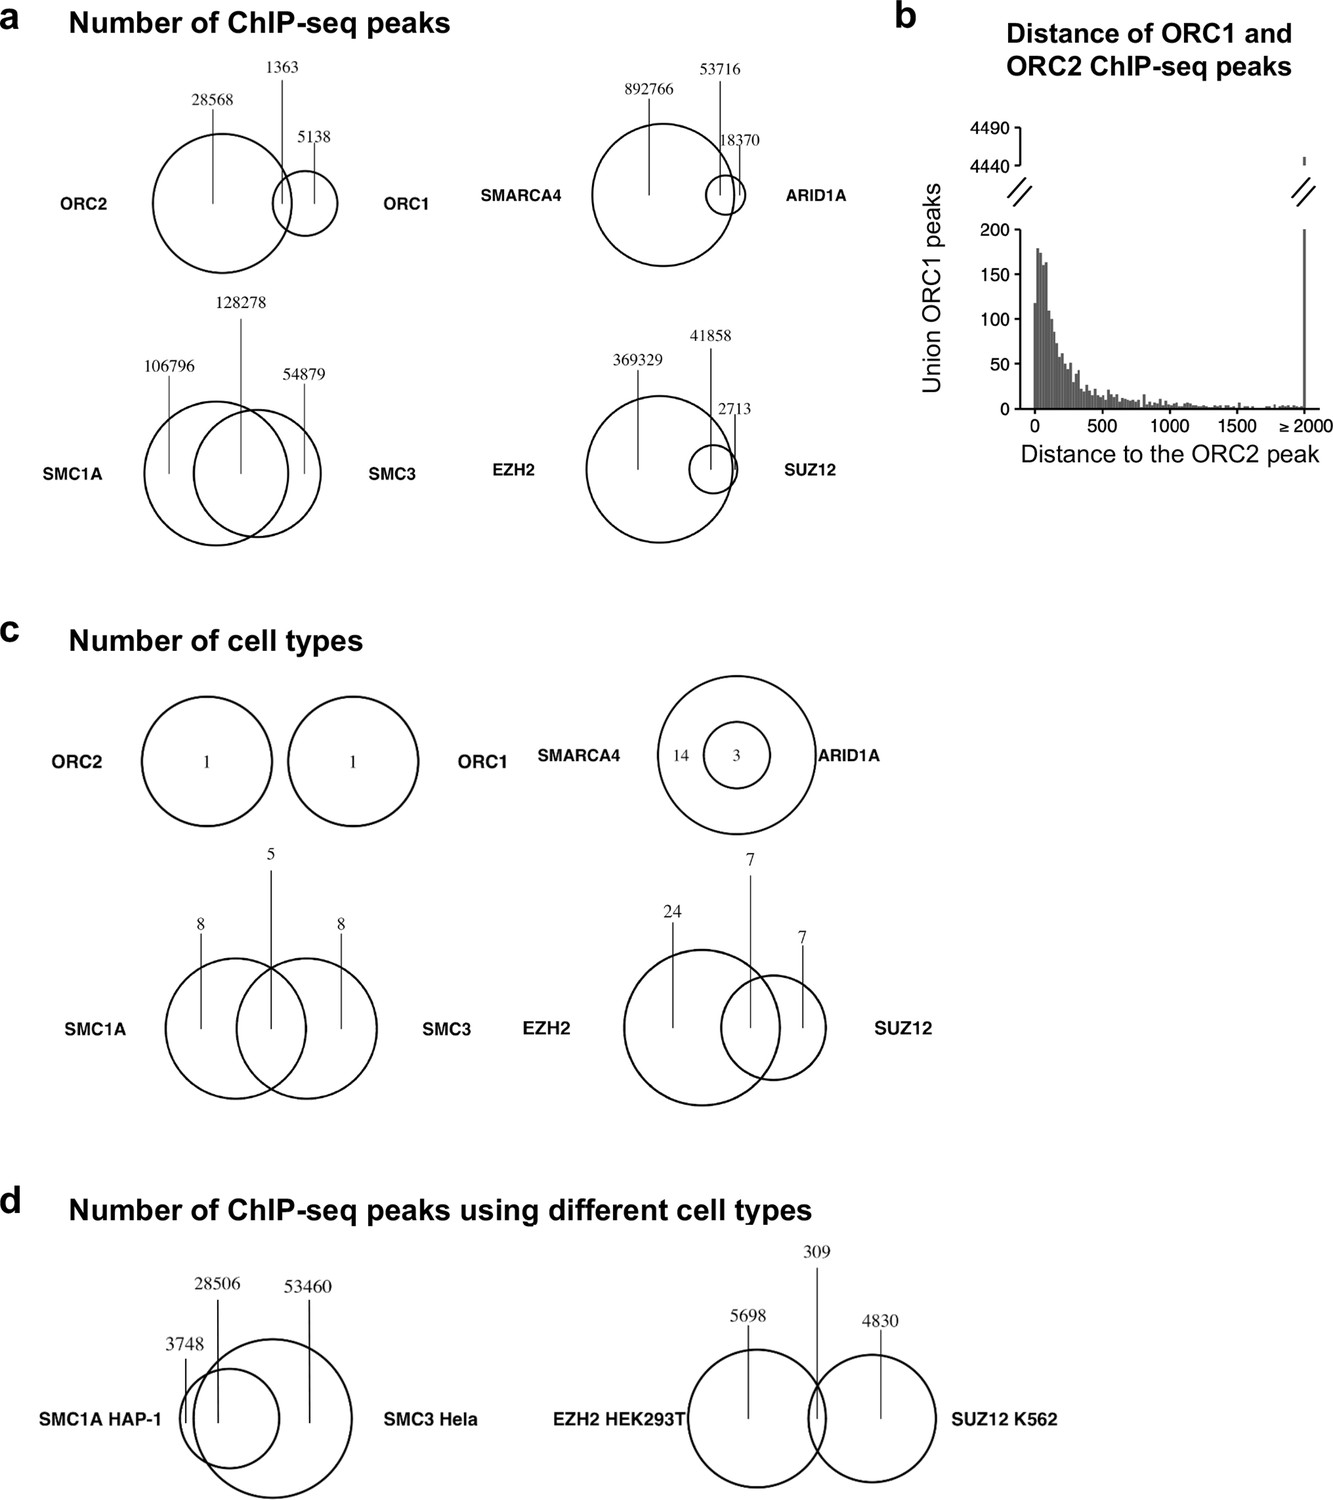
Origin recognition complex (ORC) subunits do not co-bind to DNA as much as expected.
Figure 5—figure supplement 3

Shared origins overlap with phosphorylated MCM2.
(a) Percentage of shared origins that overlap with phosphorylated MCM2-binding sites. (b) Percentage of shared origins that are near phosphorylated MCM2-binding sites.
Figure 5—figure supplement 4

Selecting fewer but even more reproducible origins with more stringent cutoff to determine their overlap with the origin recognition complex (ORC) and minichromosome maintenance complex (MCM)-binding sites.
(a) The percentage of high-confidence origins (defined by the cutoff of occupancy score indicated on the X-axis) that overlapped with the union or shared ORC-binding sites. (b) Similar to (a), except the percentage of origins that are near (<1 kb) the ORC-binding sites. (c) Similar to (a) except the percentage of origins that overlap with the union or shared MCM-binding sites. (d) Similar to (c), except the percentage of origins near (<1 kb) the MCM-binding sites.
Figure 6
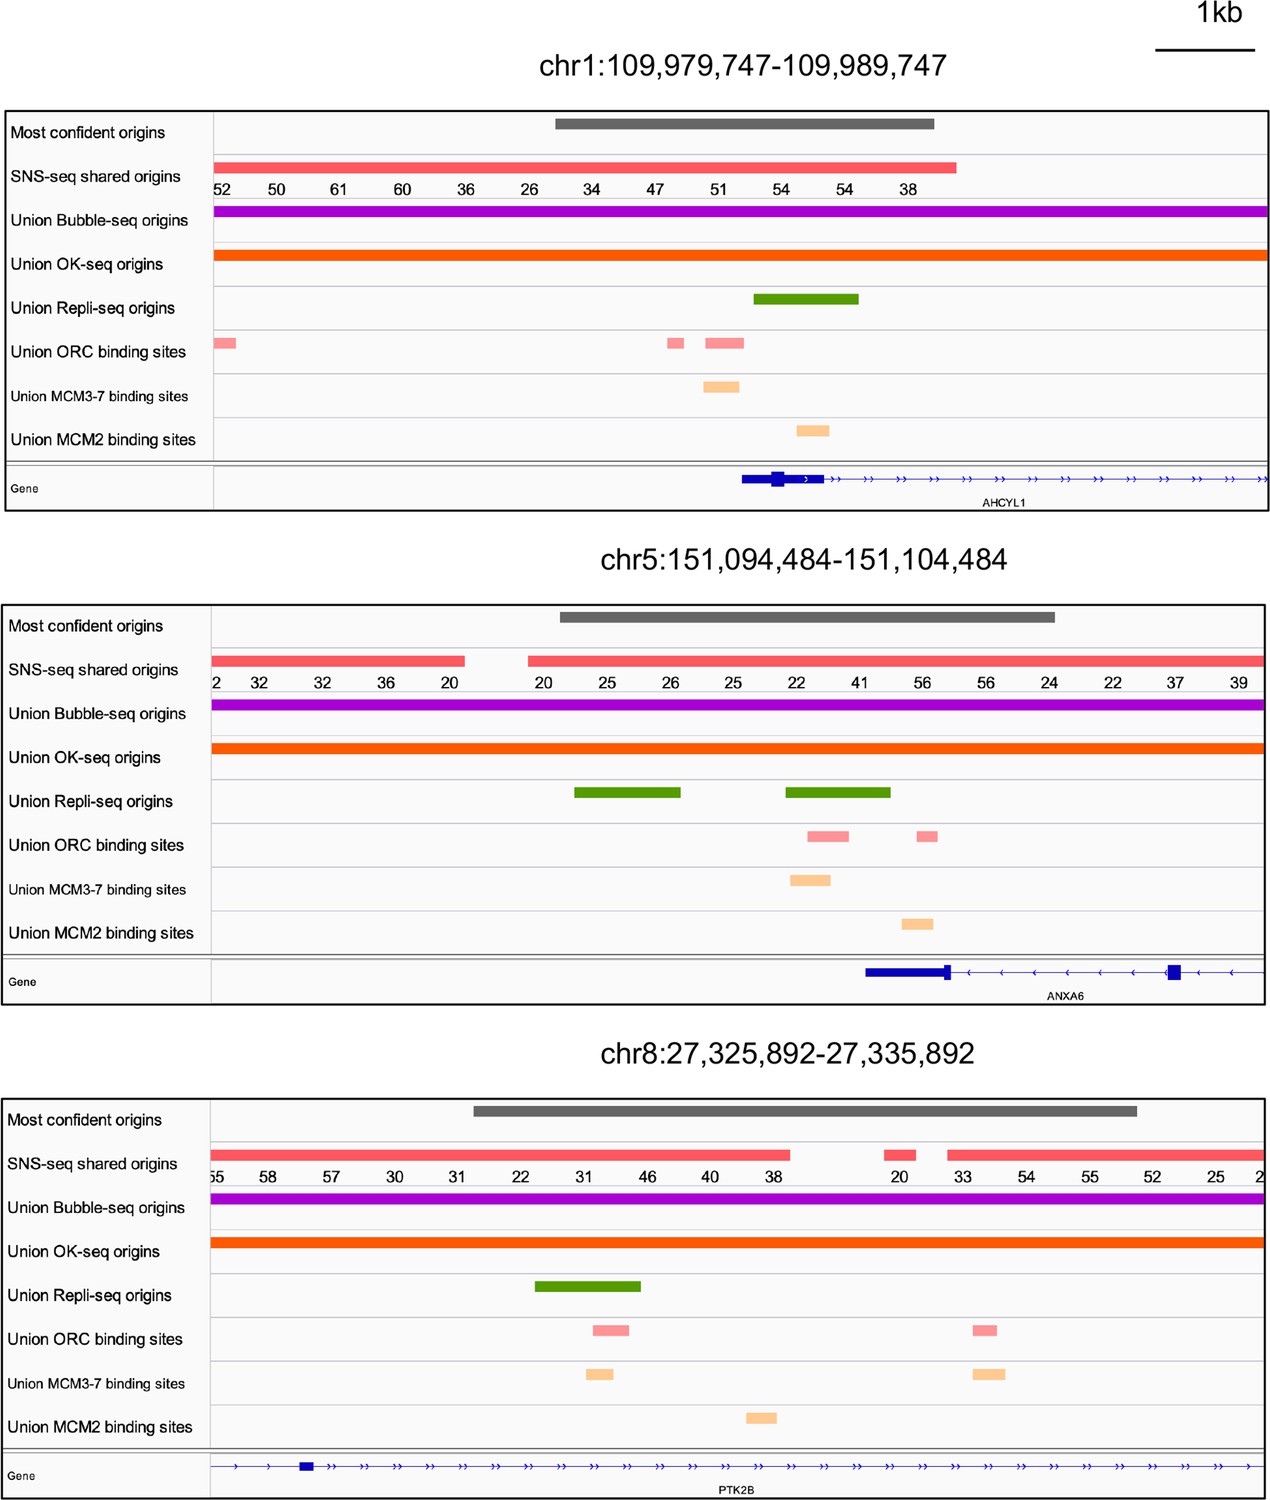
Genome browser screenshots for 3 of the 74 origins from Figure 5h.
The numbers below the short nascent strand-seq (SNS-seq) shared origins track are the occupancy score of the origins along the length of the indicated track.
Tables
Table 1
Overlap of origins, transcription start sites (TSS), and origin recognition complex (ORC)-binding sites with the indicated features.
Summary of data to show the number of origins of different types, extent of overlap of each with different genomic features, and comparison with TSS (or promoters).
| % overlap with | ||||||
|---|---|---|---|---|---|---|
| Number | Promoter | TF hotspot | CTCF | GC content | G quad | |
| Union origins | 7,459,709 | 4.1 | 0.1 | 0.7 | 41.3333 | 15 |
| Shared origins | 20,250 | 21.1 | 0.82 | 2.2 | 53 | 43.5 |
| Shared origins with shared ORC | 1300 | 46.7 | 6.54 | 4.5 | 54 | 45.6 |
| TSS ±-100 | 26,237 | 100 | 15.9 | 6.4 | 61.5 | 48.1 |
| Shared ORC | 12,712 | 32.2 | 20.7 | 10 | 53.1 | 44.1 |
Table 2
Permutation test of overlap of shared origins or promoters (transcription start sites) with the region around promoters, shared origin recognition complex peaks (in more than two datasets), R-loops, G-quadruplexes, and CTCF-binding sites.
Fold enrichment of the observed overlap relative to the mean overlap seen with 1000 randomizations of set A is indicated together with the p-values of the enrichment. Permutation test to ascertain the significance of the overlaps reported in this article relative to random expectation.
| Set_A | Set_B | #Set_A | #Set_B | Observed overlap | # Random iterations | Mean random overlap | Obs/random fold enrichment | p-Value |
|---|---|---|---|---|---|---|---|---|
| Origins | 4k±promoters | 20,250 | 26,237 | 4275 | 1000 | 649 | 6.6 | <0.001 |
| Origins | ORC_peaks | 20,250 | 12,712 | 347 | 1000 | 54 | 6.4 | <0.001 |
| Origins | R-loop_zones | 20,250 | 59,176 | 2607 | 1000 | 299 | 8.7 | <0.001 |
| Origins | G-quadruplex | 20,250 | 1,444,095 | 8818 | 1000 | 2529 | 3.5 | <0.001 |
| Origins | CTCF_sites | 20,250 | 22,097 | 443 | 1000 | 104 | 4.3 | <0.001 |
| Promoters | ORC_peaks | 26,237 | 12,712 | 4832 | 1000 | 454 | 10.6 | <0.001 |
| Promoters | R-loop_zones | 26,237 | 59,176 | 10,068 | 1000 | 1404 | 7.2 | <0.001 |
| Promoters | G-quadruplex | 26,237 | 1,444,095 | 21,809 | 1000 | 17,242 | 1.3 | <0.001 |
| Promoters | CTCF_sites | 20,250 | 22,097 | 3644 | 1000 | 813 | 4.5 | <0.001 |
Additional files
-
Supplementary file 1
Collected public data.
The original reference for each dataset can be found on the GEO page for each dataset. (a) Metadata of collected public Origin data. (b) Sample number of each cell type. (c) Metadata of collected public ORC ChIP-seq data. (d) Metadata of collected public MCM ChIP-seq data. (e) Metadata of collected public ORC and MCM ChIP-seq data in yeast.
- https://cdn.elifesciences.org/articles/89548/elife-89548-supp1-v1.xlsx
-
Supplementary file 2
Parameters of model for SNS-seq.
Parameters of exponential model for SNS-seq origins.
- https://cdn.elifesciences.org/articles/89548/elife-89548-supp2-v1.xlsx
-
Supplementary file 3
Union and shared ORC-binding sites.
(a) Union ORC ChIP-seq peaks, with coordinates and occupancy scores. (b) Shared ORC-binding sites (defined as union ORC ChIP-seq peaks with an occupancy score ≥ 2).
- https://cdn.elifesciences.org/articles/89548/elife-89548-supp3-v1.xlsx
-
Supplementary file 4
Highest confidence origins.
(a) Coordinates of union ORC ChIP-seq-binding sites with shared origins in 1 kb region. (b) Coordinates of shared origins with shared ORC-binding sites in 1 kb region. (c) Coordinates of shared origins with union ORC-binding sites in 1 kb region.
- https://cdn.elifesciences.org/articles/89548/elife-89548-supp4-v1.xlsx
-
Supplementary file 5
Seventy-four most confident origins.
Coordinates of 74 origins that were reproducibly identified by multiple methods (shared origins, near shared ORC-binding sites, overlapping with MCM3-7-binding sites, and MCM2-binding sites).
- https://cdn.elifesciences.org/articles/89548/elife-89548-supp5-v1.xlsx
-
MDAR checklist
- https://cdn.elifesciences.org/articles/89548/elife-89548-mdarchecklist1-v1.docx
Download links
A two-part list of links to download the article, or parts of the article, in various formats.
Downloads (link to download the article as PDF)
Open citations (links to open the citations from this article in various online reference manager services)
Cite this article (links to download the citations from this article in formats compatible with various reference manager tools)
Integrative analysis of DNA replication origins and ORC-/MCM-binding sites in human cells reveals a lack of overlap
eLife 12:RP89548.
https://doi.org/10.7554/eLife.89548.4


