Rab7-dependent regulation of goblet cell protein CLCA1 modulates gastrointestinal homeostasis
- Laboratory of Gut Inflammation and Infection Biology, Regional Centre for Biotechnology, India
- Departmnet of Bioscience and Biotechnology, Banasthali Vidyapith, India
- Department of Gastroenterology, All India Institute of Medical Sciences, India
- Department of Immunology, Weizmann Institute of Science, Israel
- Gene Lay Institute of Immunology and Inflammation, Brigham and Women’s Hospital, Massachusetts General Hospital and Harvard Medical School, United States
- Department of Anatomy, All India Institute of Medical Sciences, India
- Vaccine and Infectious Disease Research Center, Translational Health Science and Technology Institute, India
Figures
Figure 1 with 1 supplement
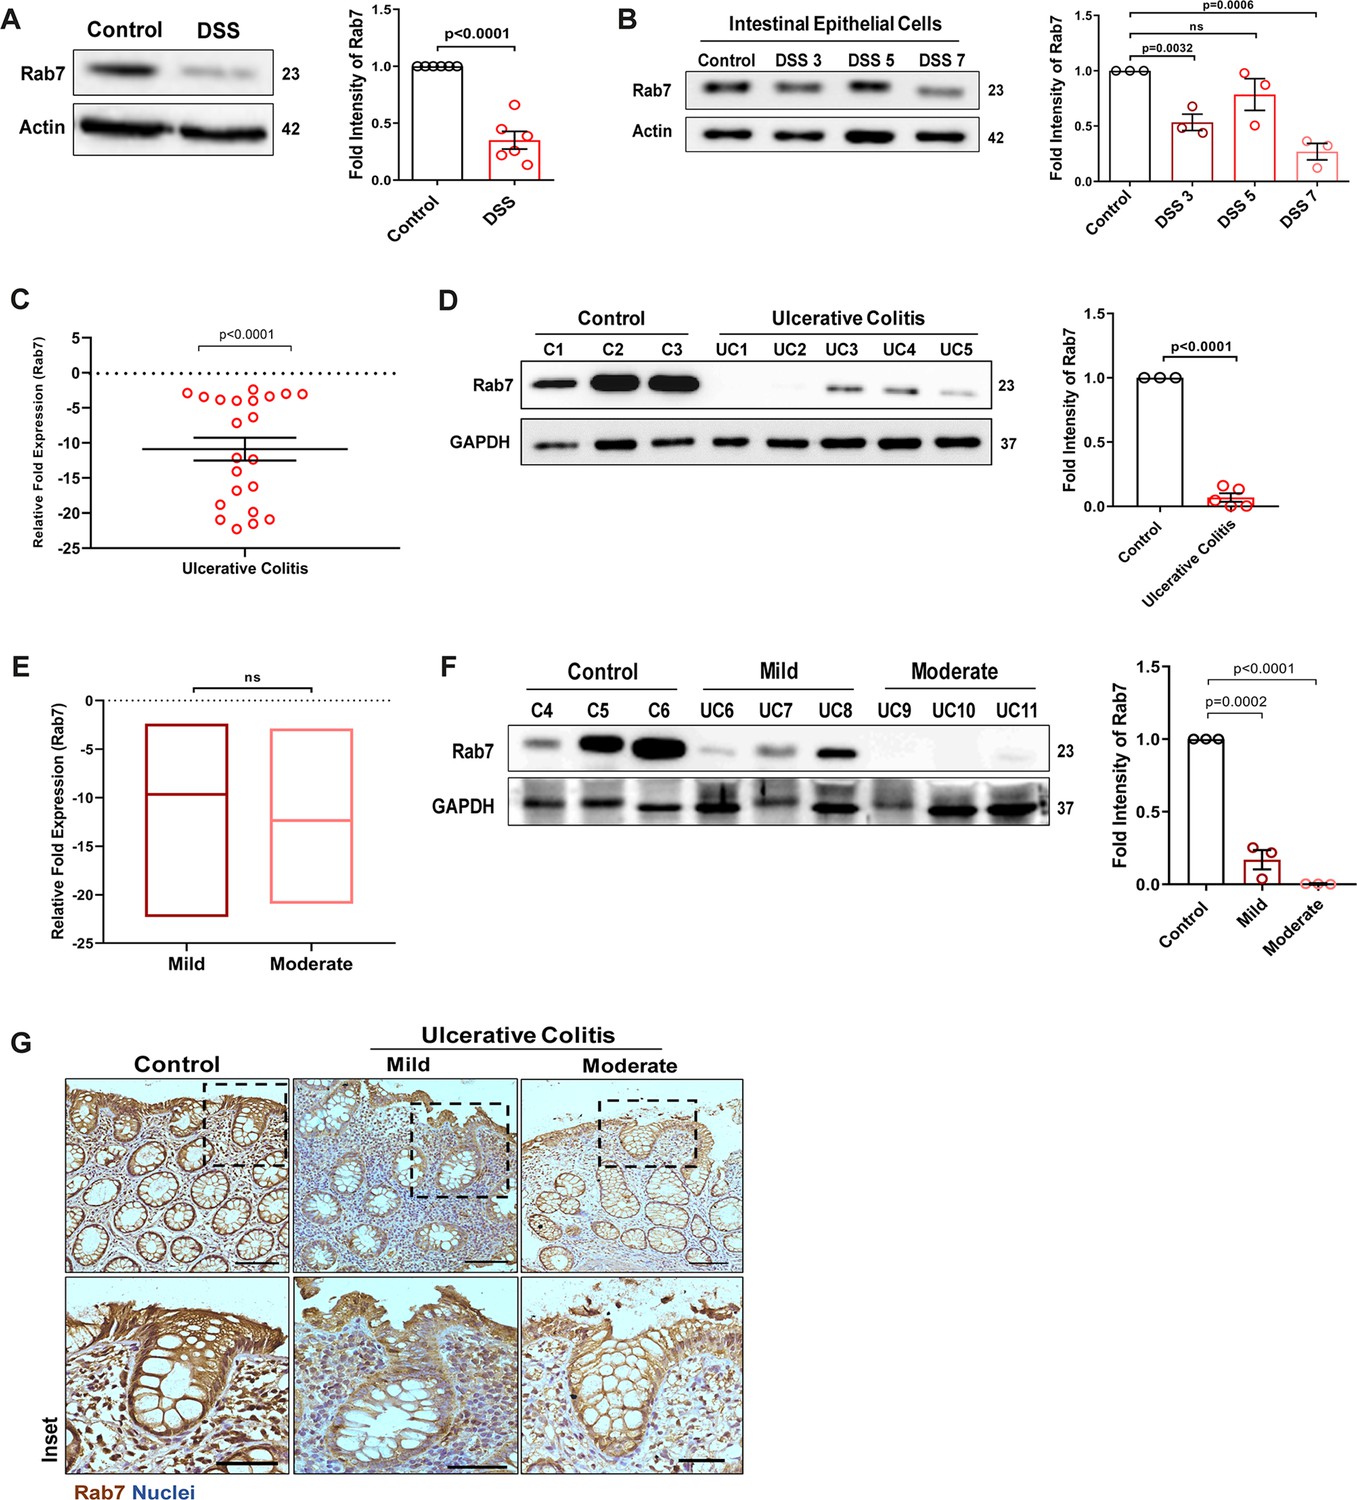
Small GTPase Rab7 shows altered expression during murine and human colitis correlative of disease severity.
‘(A) Rab7 expression analyzed in whole colon tissue of healthy and dextran sulfate sodium (DSS)-treated mice. Graph represents densitometric analysis showing fold intensity of Rab7 expression calculated by normalizing to loading control (β actin). (B) Dynamics of Rab7 expression in intestinal epithelial cells isolated from the intestines of healthy and DSS-treated mice for different time durations. Corresponding graph shows densitometry analysis of Rab7 expression normalized to loading control (β actin). (C) RT-PCR analysis of relative fold expression of Rab7 gene in human UC patient colonic biopsies (n = 22) relative to average control values (n = 22). HPRT was used for normalization. (D) Immunoblotting of Rab7 protein in human ulcerative colitis (UC) (n = 5) and control (n = 3) biopsy samples. GAPDH was used as loading control. Graph shows densitometry analysis of Rab7 expression relative to control. (E) RT-PCR analysis of Rab7 gene expression variation with disease severity. (F) Immunoblot showing Rab7 protein expression dynamics of mild (n = 3) and moderate (n = 3) UC patient samples relative to controls (n = 3). Graph represents densitometric analysis showing fold intensity of Rab7 expression calculated by normalizing to loading control (GAPDH). (G) Immunohistochemistry images of colon biopsies from control (n = 3), UC mild (n = 3), and UC moderate (n = 3) patients stained for Rab7 (brown color) (Scale bar = 100 µm). Inset shows zoomed areas of the image (scale bar = 50 µm). Each dot represents (A, B) one mouse or (C, D, and F) one human. Error bars represent mean + SEM. Statistical analysis by Student’s t-test. ns = nonsignificant.
-
Figure 1—source data 1
Original files for the western blot analysis in Figure 1 (anti-Rab7, anti-actin and anti-GAPDH).
- https://cdn.elifesciences.org/articles/89776/elife-89776-fig1-data1-v1.zip
Figure 1—figure supplement 1
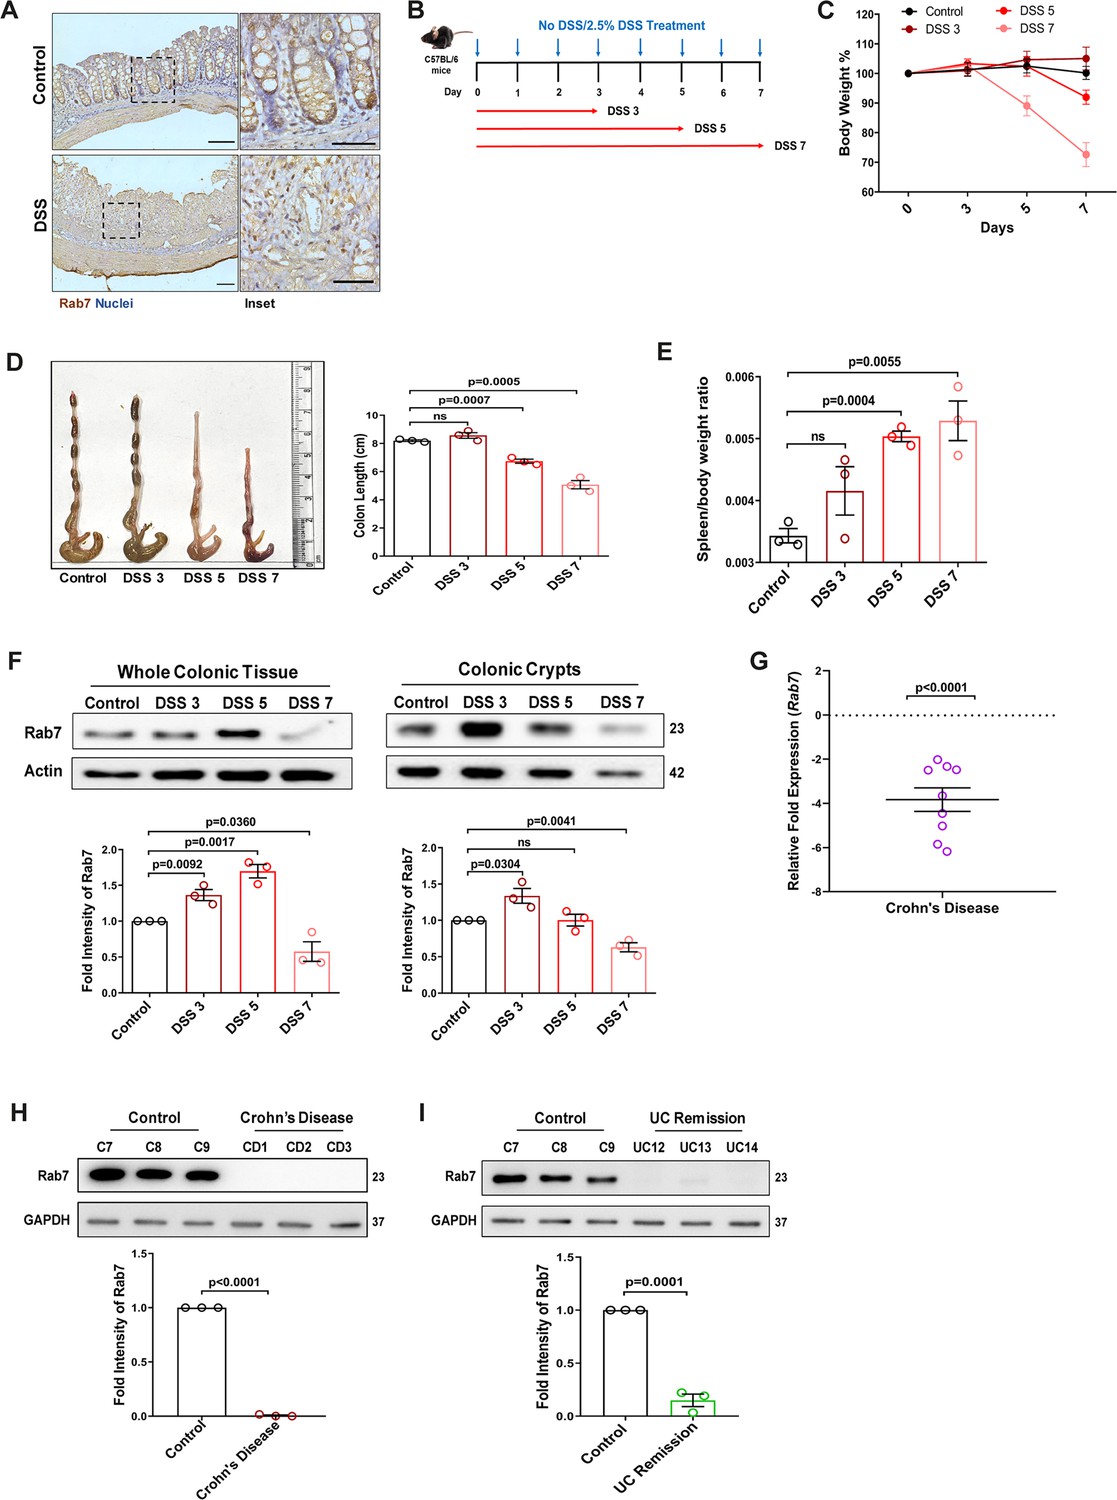
Rab7 expression in various states of murine and human colitis.
(A) Immunohistochemistry images of Rab7 staining (brown color) in distal colon sections of healthy and dextran sulfate sodium (DSS)-treated mice (scale bar = 100 µm). Inset shows zoomed areas of the image (scale bar = 50 µm). (B) Schematic representation of DSS treatment to mice for different time durations. (C) Graph represents body weight percent of mice in different groups. (D) Gross morphology of colon and caeca. Graph shows colon length quantification. (E) Spleen to body weight ratio indicating increased splenomegaly and inflammation. (F) Dynamics of Rab7 expression in whole tissue and crypts isolated from the intestines of healthy and DSS-treated mice for different time durations. Corresponding graph shows densitometry analysis of Rab7 expression normalized to loading control (β actin). (G) A pilot study of Rab7 expression in Crohn’s disease (CD) patients. RT-PCR analysis of relative fold expression of Rab7 gene in human CD patient colonic biopsies (n = 9) relative to average control values (n = 10). HPRT was used for normalization. (H) Immunoblotting of Rab7 protein in CD (n = 3) and control (n = 3) biopsy samples. GAPDH was used as loading control. (I) Immunoblotting of Rab7 protein in human UC remission (n = 3) and control (n = 3) biopsy samples. GAPDH was used as loading control. Each dot represents (D, E) one mouse or (F–H) one human. Error bars represent mean + SEM. Statistical analysis by Student’s t-test. ns = nonsignificant.
-
Figure 1—figure supplement 1—source data 1
Original files for the western blot analysis in Figure 1—figure supplement 1 (anti-Rab7, anti-actin, and anti-GAPDH).
- https://cdn.elifesciences.org/articles/89776/elife-89776-fig1-figsupp1-data1-v1.zip
Figure 2 with 1 supplement
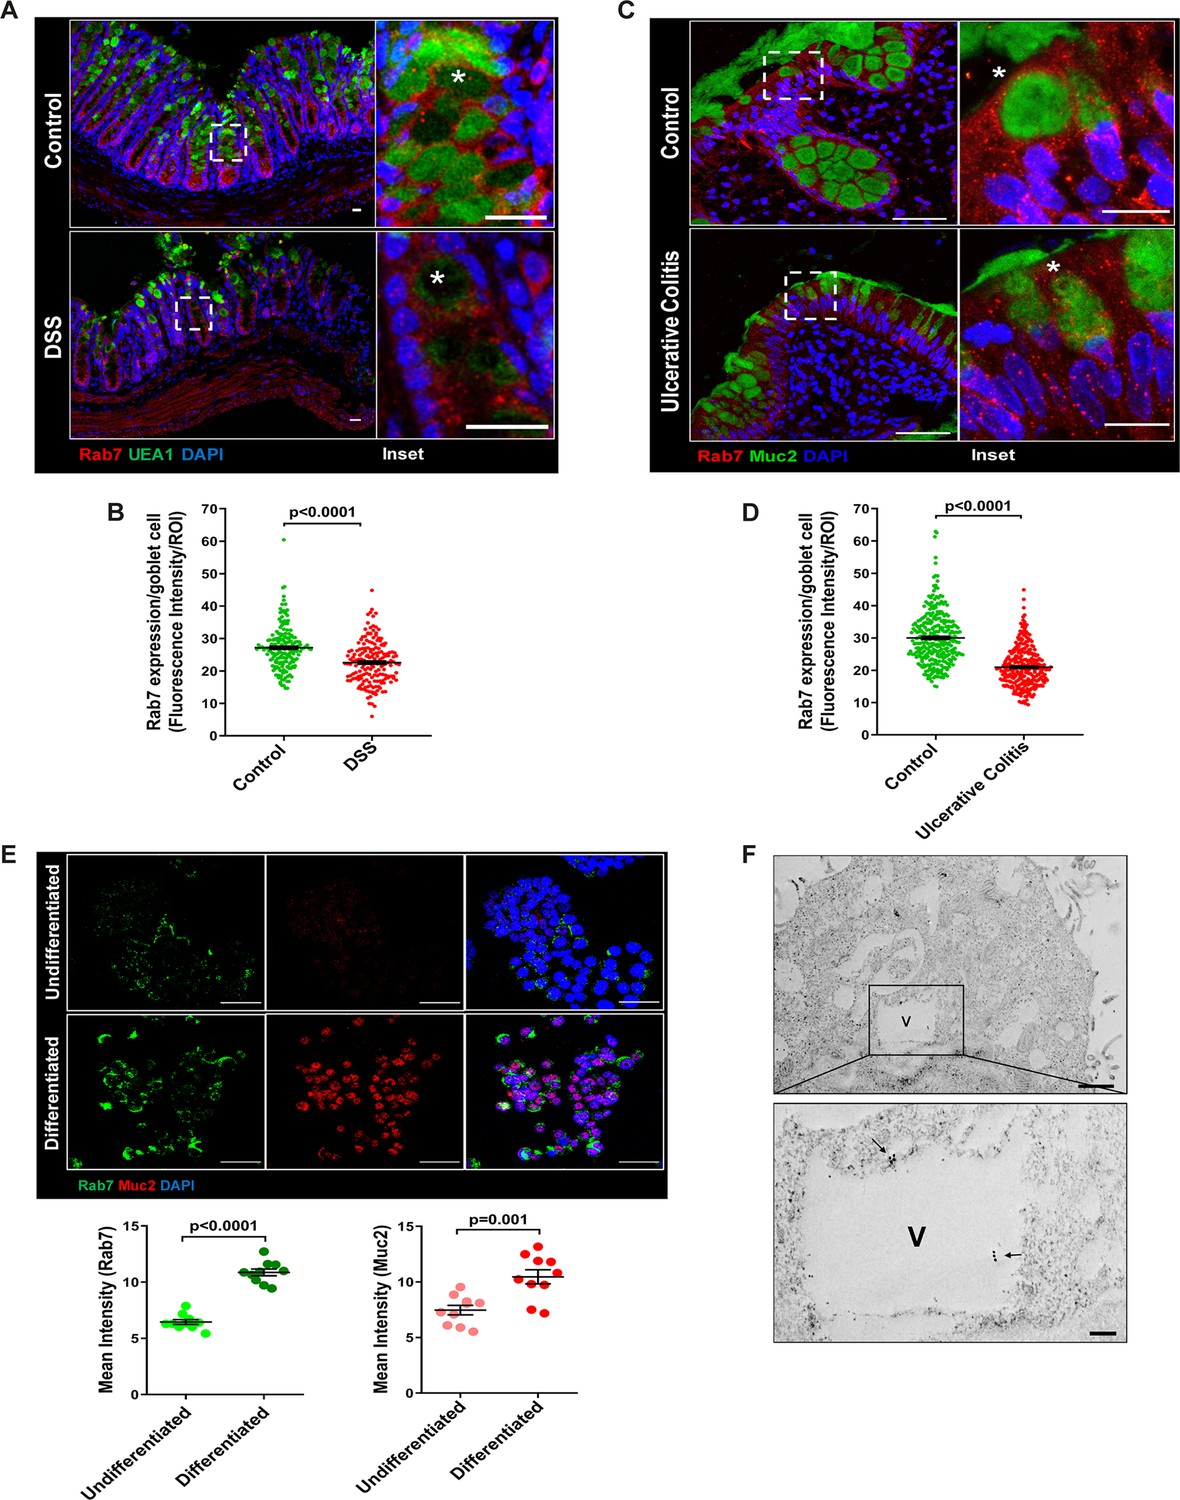
Goblet cells of intestine display dominant expression of Rab7.
(A, B) Confocal imaging of healthy and dextran sulfate sodium (DSS)-treated mice (7 d) colon sections showing Rab7 (red) expression within goblet cells (UEA1-FITC) marked with asterisk. Inset shows zoomed areas of the image (scale bar = 20 µm). Graph shows Rab7 fluorescence intensity within UEA1 positive goblet cells measured within region of interest (ROI). 20 goblet cells were selected randomly from three different fields of each mouse (n = 3). (C, D) Representative co-immunofluorescence images of human ulcerative colitis (UC) and control colon biopsy sections stained for Rab7 (red) and Muc2 (green) for goblet cells (marked with asterisk) (scale bar = 50 µm). Inset shows zoomed areas of the image (scale bar = 20 µm). Graph shows Rab7 fluorescence intensity within Muc2-positive goblet cells measured within ROI. 20 goblet cells were selected randomly from five different fields of each sample (n = 3). (E) Co-immunofluorescence of Rab7 (green) and Muc2 (red) in undifferentiated and differentiated HT-29 cells (scale bar = 50 µm). Graphs show Rab7 and Muc2 fluorescence intensity measured in 10 different fields of three independent experiments each. (F) Rab7 protein visualized in HT29-MTX-E12 cells by immune-EM. Arrows indicate presence of Rab7 on vacuoles of cells (scale bar = 1 µm). Inset showed zoomed area of image (scale bar = 200 nm). Error bars represent mean + SEM. Statistical analysis by Student’s t-test.
Figure 2—figure supplement 1

Expression of Rab7 in goblet cells of different types and regions of gastrointestinal tract.
(A) Immunohistochemistry images of staining of Rab7 in different regions of intestine: small intestine, proximal colon and distal colon; showing Rab7 expression in vacuolated cells (marked with asterisk) (n = 3). Scale bar = 50 µm. (B) Confocal images of mice distal colon stained with Rab7 (red) and goblet cell specific marker UEA1 (green) showing the presence of Rab7 in UEA1 positive cells (marked with asterisk) (n = 3). Scale bar = 100 µm. (C, D) Single-channel images of DAPI, UEA1/Muc2, and Rab7 staining shown in Figure 2A and C. (E) RT-PCR analysis of relative fold expression of Lgr5, Muc2, and Rab7 genes in differentiated HT29 cells relative to undifferentiated cells. HPRT was used for normalization. (F) Immunoblot showing Rab7 protein expression in differentiated HT29 cells relative to undifferentiated cells. Graph represents densitometric analysis of Rab7 expression calculated by normalizing to loading control (β actin). (G) TEM analysis of HT29-MTX-E12 cells showing presence of vacuoles (V) in the cytoplasm (Cy) along with nucleus (Nu) nucleolus (Ns) and mitochondrion (M). Each dot represents one individual experiment. Error bars represent mean + SEM. Statistical analysis by Student’s t-test. ns = nonsignificant.
-
Figure 2—figure supplement 1—source data 1
Original files for the western blot analysis in Figure 2—figure supplement 1F (anti-Rab7 and anti-actin).
- https://cdn.elifesciences.org/articles/89776/elife-89776-fig2-figsupp1-data1-v1.zip
Figure 3 with 1 supplement
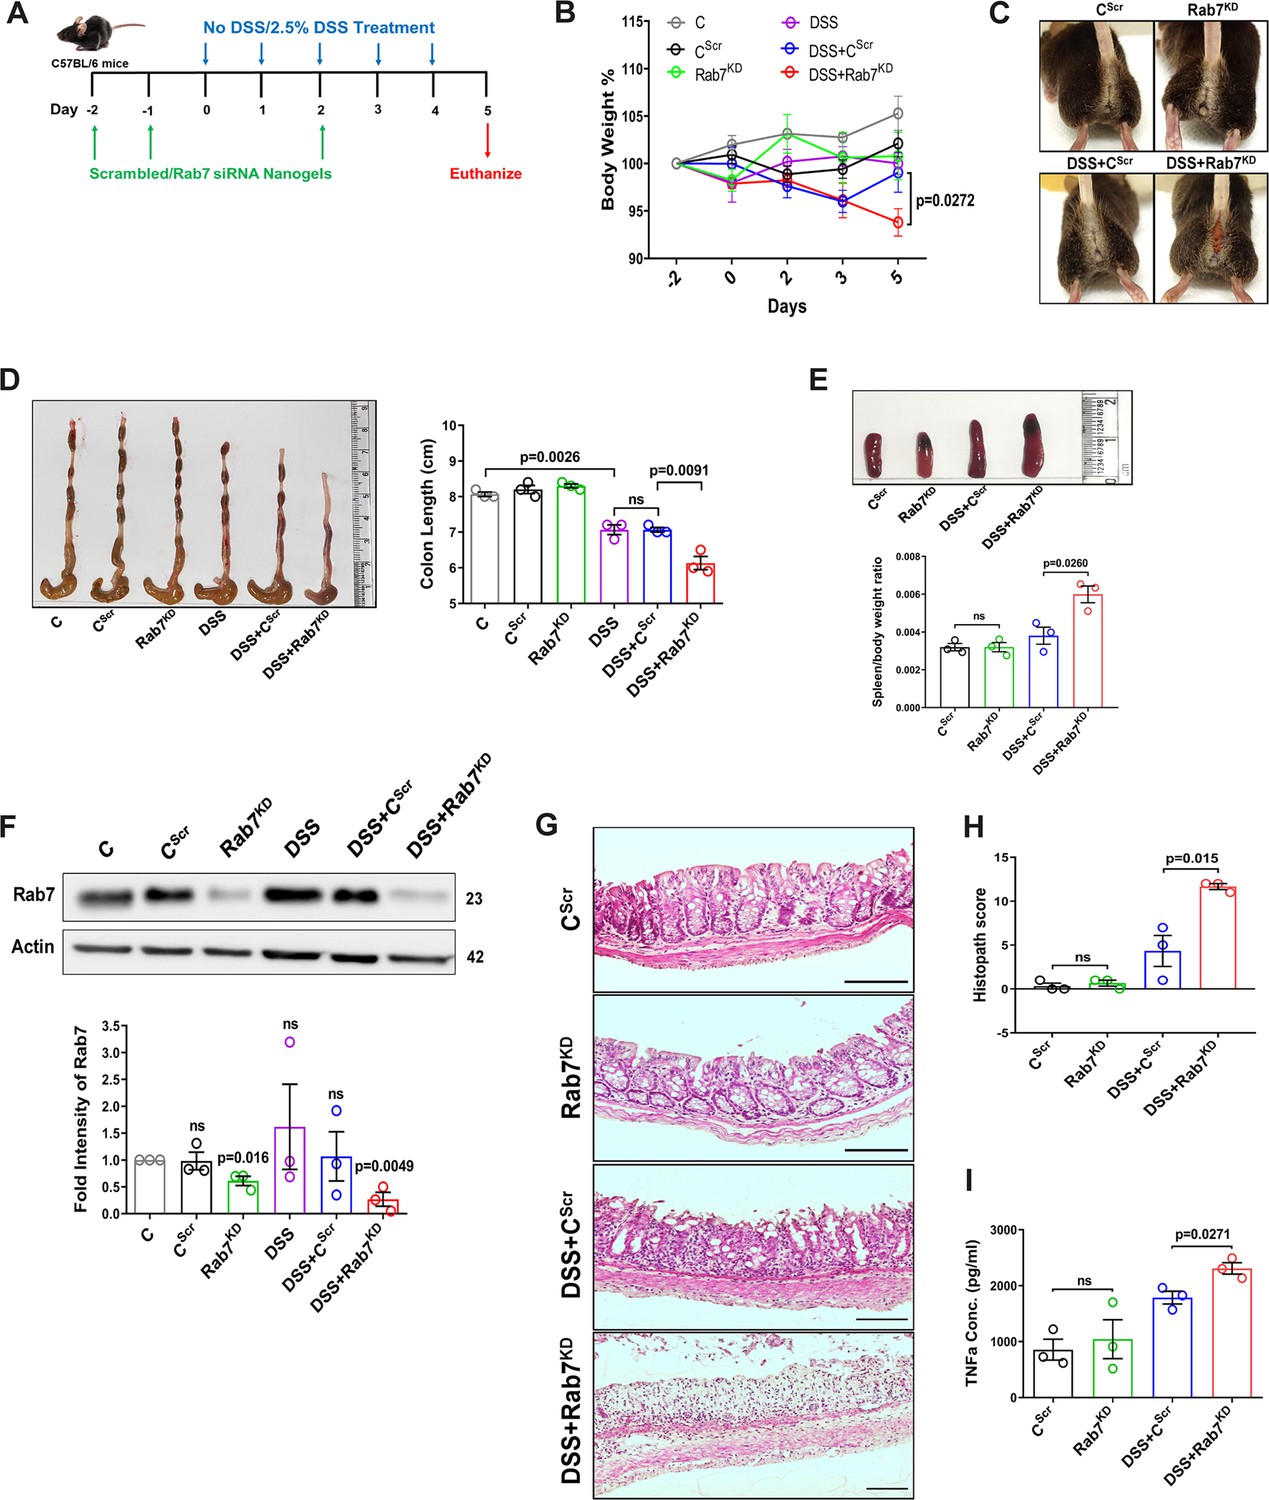
Downregulation of Rab7 aggravates inflammation upon external trigger.
(A) Schematic representation of the experimental plan for knockdown of Rab7 in C57Bl/6 mice showing different treatments (n = 3 mice per group). (B) Graph showing body weight percent. (C) Representative photographs demonstrating rectal bleeding in mice. (D) Gross morphology of colon and caeca. Graph shows colon length quantification. (E) Representative spleens of different treatment mice groups. Graph showing spleen to body weight ratio. (F) Rab7 protein expression in isolated intestinal epithelial cells from mice colon. Graph represents densitometric analysis showing fold intensity of Rab7 expression calculated by normalizing to loading control (β actin). Significance value of each group is relative to the untreated (C) group. (G, H) Hematoxylin and eosin staining of distal colon sections with histopathology scores showing increased characteristics of inflammation. (I) ELISA of TNFα from mucosal extracts of mice colon. Each dot represents one mouse. Error bars represent mean + SEM. Statistical analysis by (B) two-way ANOVA or Student’s t-test. ns = nonsignificant.
-
Figure 3—source data 1
Original files for the western blot analysis in Figure 3F (anti-Rab7 and anti-actin).
- https://cdn.elifesciences.org/articles/89776/elife-89776-fig3-data1-v1.zip
Figure 3—figure supplement 1
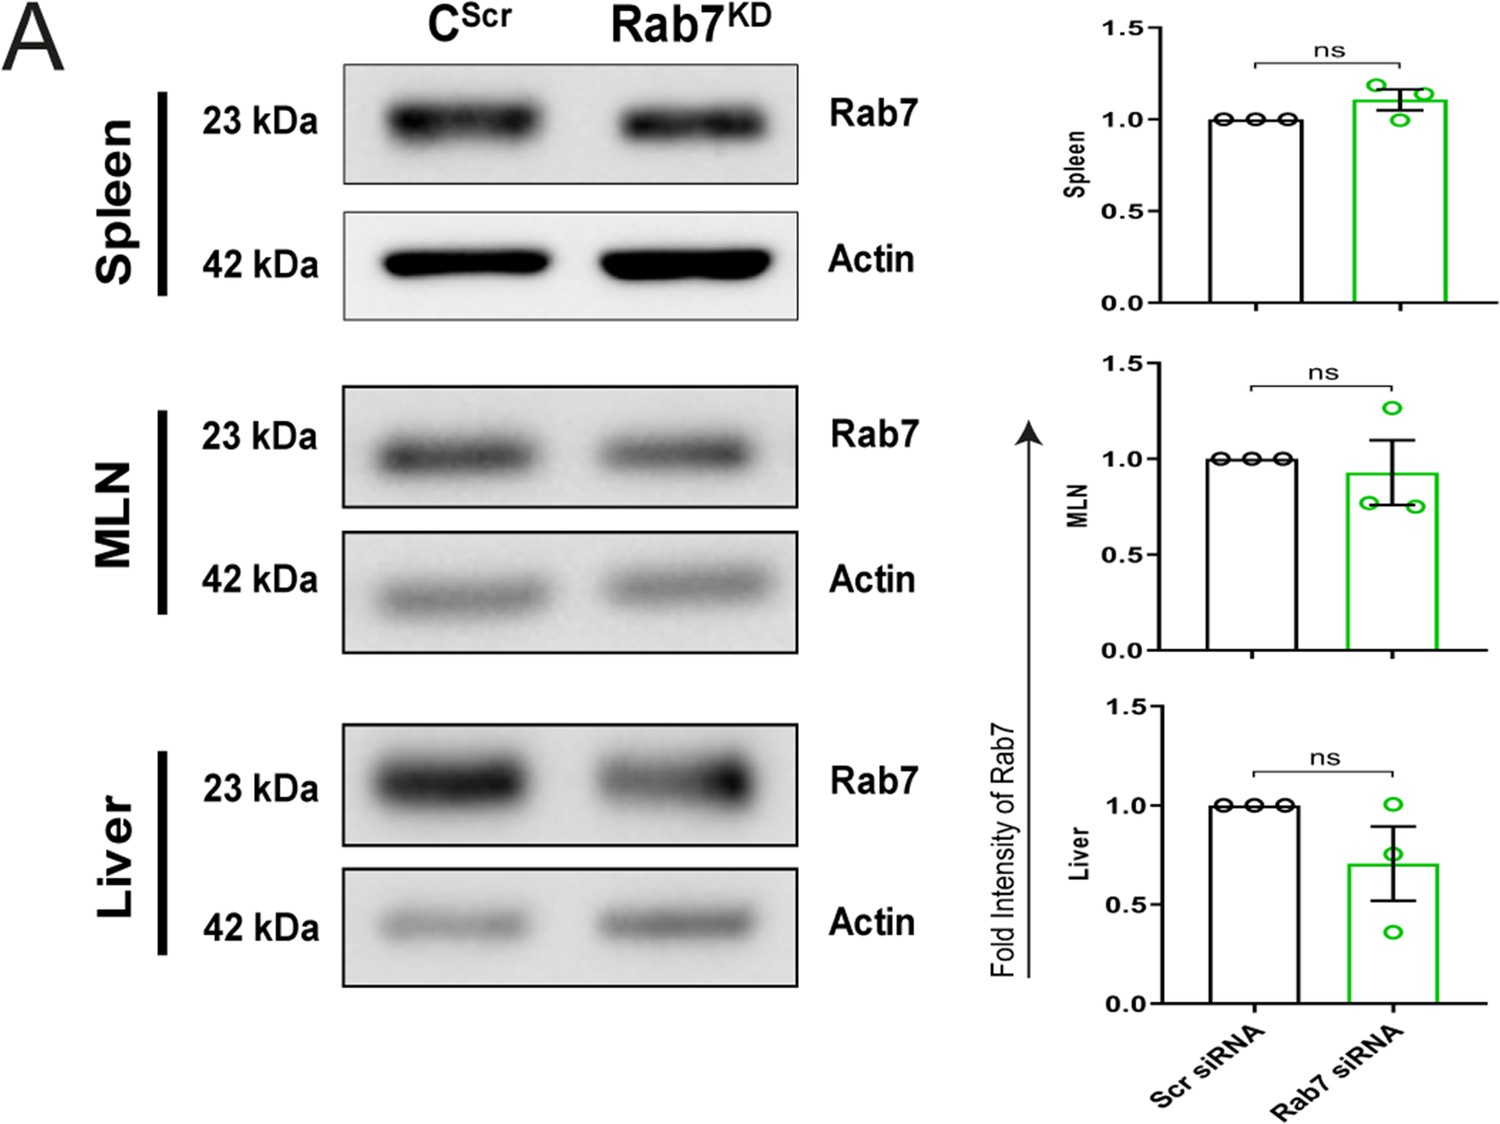
Rab7 knockdown in mice is specific to intestine.
(A) Rab7 protein expression in lysates of spleen, MLN, and liver collected from CScr and Rab7KD mice. Graph represents densitometric analysis showing fold intensity of Rab7 expression calculated by normalizing to loading control (β actin).
-
Figure 3—figure supplement 1—source data 1
Original files for the western blot analysis in Figure 3- figure supplement 1A (anti-Rab7 and anti-actin).
- https://cdn.elifesciences.org/articles/89776/elife-89776-fig3-figsupp1-data1-v1.zip
Figure 4 with 1 supplement
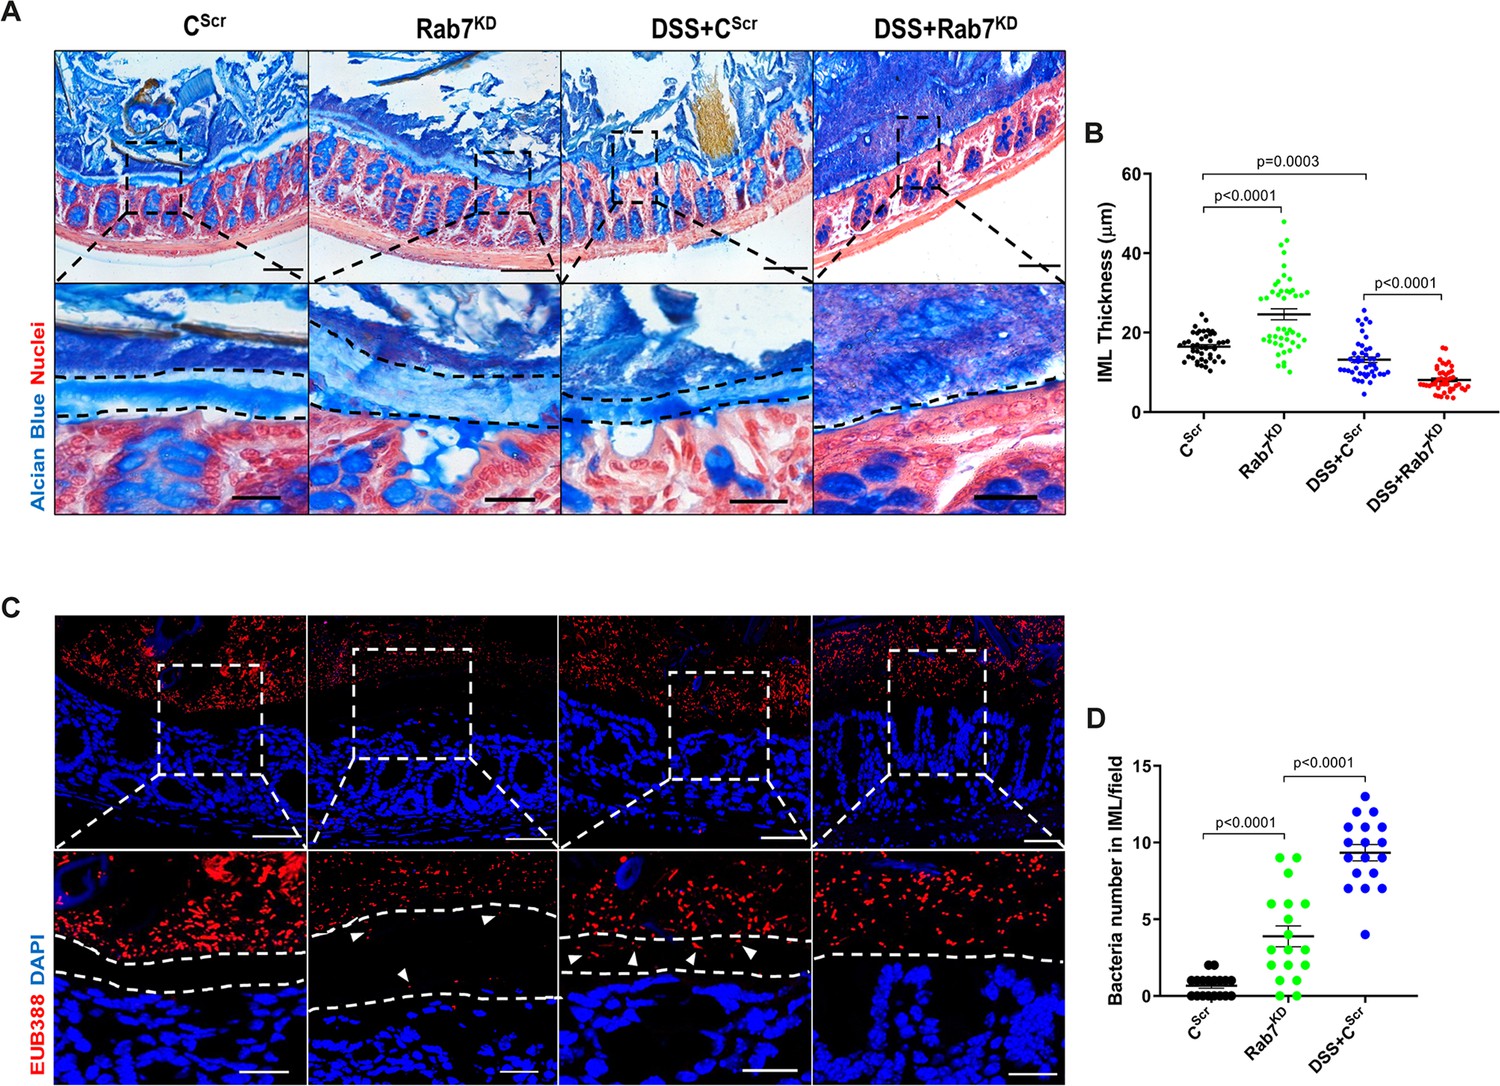
Rab7 downregulation in intestinal epithelium modulates mucus layer thickness and permeability.
(A–B) Alcian blue staining in mice distal colon sections displaying inner mucus layer (IML) (blue) marked with dotted lines and nuclei (red). Thickness of IML was measured using ImageJ software (15 measurements per section of each mice). Scale bar = 100 µm and 20 µm (inset). (C, D) Representative images of fluorescence in situ hybridization (FISH) staining for bacteria detection in mucus layer using general bacterial probe EUB338-Alexa Fluor 647 (red). Arrowheads demarcate the presence of bacteria in IML (dotted lines). Graph shows bacteria count detected in IML (six regions per section of each mouse). Scale bar = 100 µm and 20 µm (inset). Error bars represent mean + SEM. Statistical analysis by Student’s t-test.
Figure 4—figure supplement 1

Rab7 perturbation changes goblet cell number and Muc2 distribution.
(A, B) Alcian blue staining in sections of distal colon show mucus-filled goblet cells (blue) and nuclei (red). The number of goblet cells per crypt was counted manually (15–20 crypts per mouse). (C) Representative immunofluorescence images of HEK WT and HEK RAB7-/- cells stained for Muc2 (green), Phalloidin (red), and cell nuclei (blue) (scale bar = 10 µm). Each dot represents one mouse. Error bars represent mean + SEM. Statistical analysis by Student’s t-test. ns = nonsignificant.
Figure 5 with 1 supplement
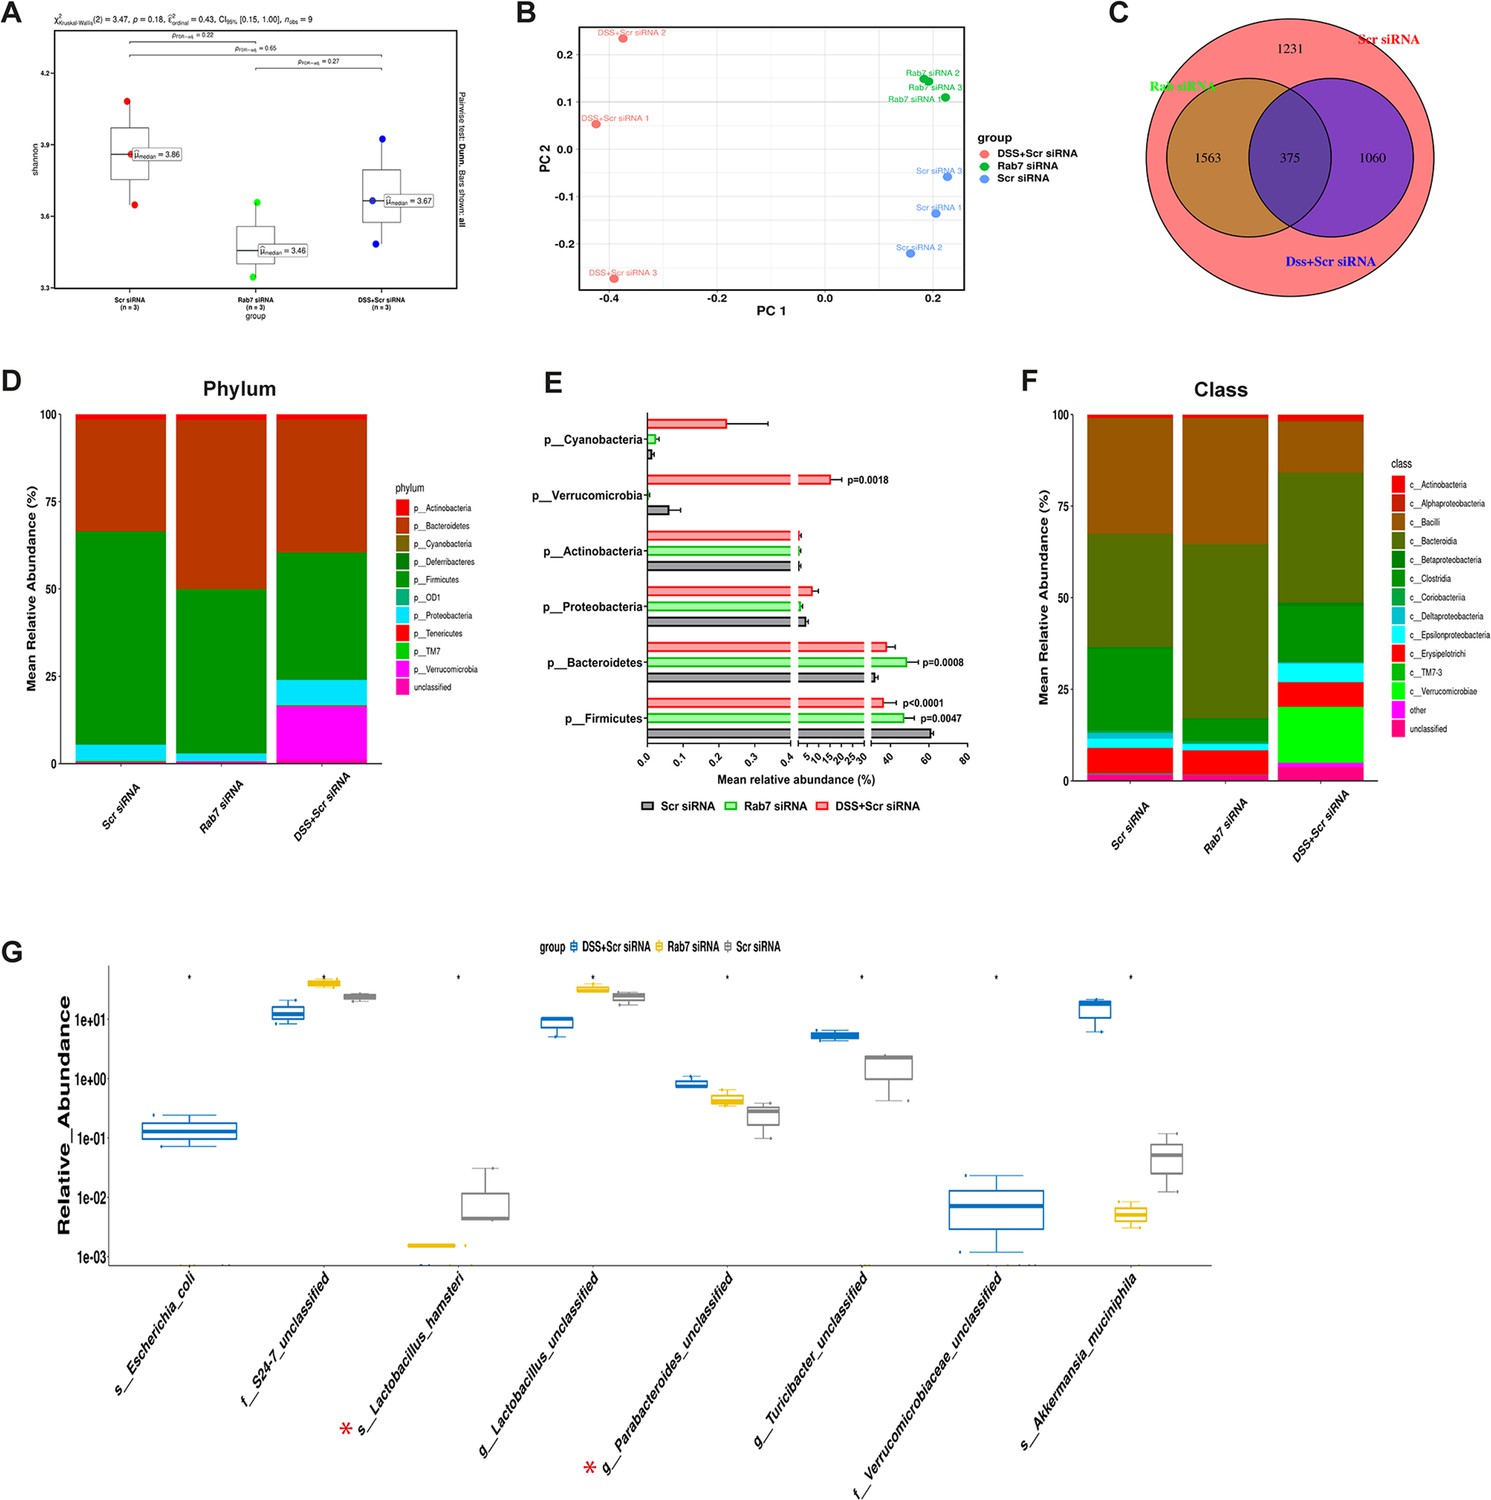
Gut microbiota in Rab7 knockdown mice is altered alike dextran sulfate sodium (DSS)-colitis mice.
Microbial composition of CScr (Scr siRNA), Rab7KD (Rab7 siRNA), and DSS+CScr (DSS+Scr siRNA) was analyzed by 16S metagenomic profiling. (A) Alpha diversity quantified as Shannon index. Significance was calculated using the Kruskal–Wallis test followed by the improved Benjamini–Hochberg procedure from false discovery rate (FDR) correction. (B) Principal coordinates (PCoA) plot calculated from distance matrices obtained from Bray–Curtis. (C) Venn diagram representation of shared and unique operational taxonomic units (OTUs) between groups. (D–F) Mean relative abundance of each taxon. Relative abundance of top 10 phylum (D) and class (F) of each group is depicted in the figure. Each bar represents the mean of the merged OTUs from three mice. Taxonomic lineages not included in top 10 were collapsed as ‘Others’, while the ones which have not been classified has been placed under the category of ‘unclassified’. Relative abundance (in %) of some important taxa showing significant differences between experimental groups (E). (G) Plot showing relative abundance of eight different taxa, identified with Kruskal–Wallis test. Each dot represents one mouse.
-
Figure 5—source data 1
Relative abundance of all bacterial identities (numerical source data).
- https://cdn.elifesciences.org/articles/89776/elife-89776-fig5-data1-v1.xlsx
Figure 5—figure supplement 1

Gut microbiota composition analysis of Rab7KD mice using 16S rRNA sequencing.
(A) Non-metric dimensional scaling (NMDS) calculated from distance matrices obtained from Bray–Curtis. (B) Heat map showing beta diversity index obtained from Bray–Curtis. (C) Mean relative abundance of top 10 order, family, genus, and species. (D) Heat map representing mean relative abundance of all species across different groups (blue represents low abundance, red represents more abundance).
Figure 6 with 1 supplement
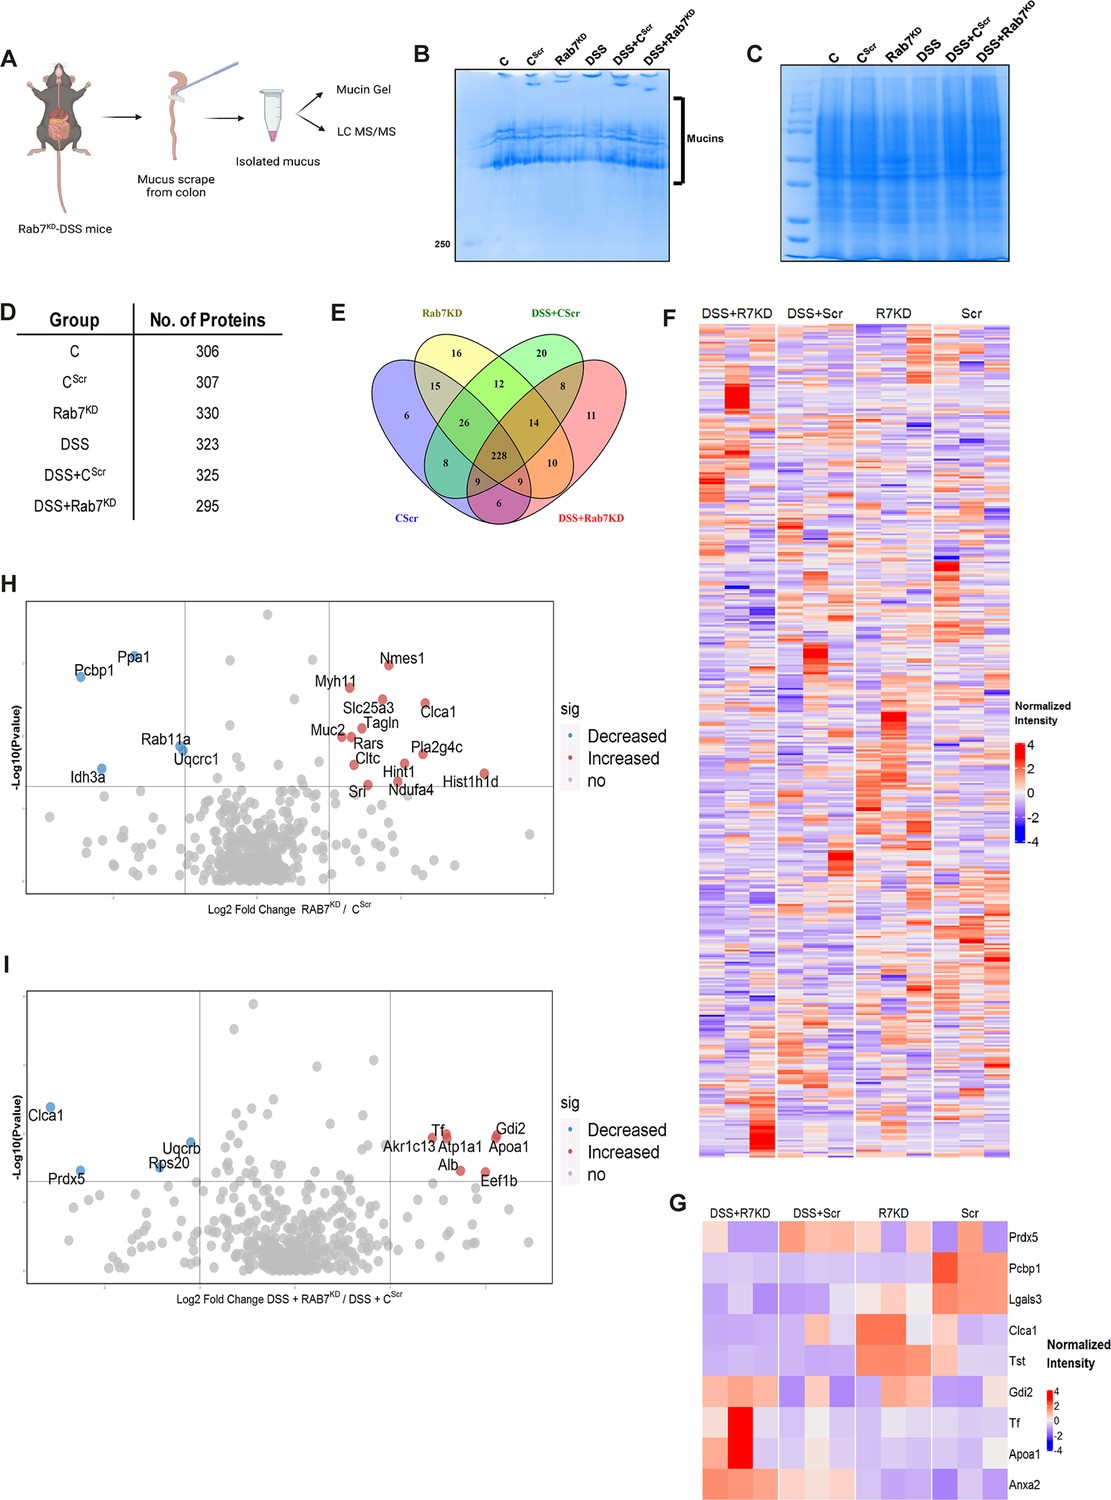
Rab7 perturbation alters mucus composition of colon.
(A) Schematic representing steps for mucus isolation from mice colon followed by sample preparation for total mucin measurement through mucin gels and mucus layer composition analysis using mass spectrometry (Created with BioRender.com and published using a CC BY-NC-ND license with permission). (B) Mucin gel showing the amount of total mucins (blue) stained with Alcian blue dye. (C–E) Coomassie staining of mucus samples isolated from different experimental groups. Table listing the total number of proteins identified in the mucus samples through mass spectrometry and Venn diagram displaying the number of individual proteins common and unique in different samples. (F, G) Heat maps of the proteins differentially expressed without false discovery rate (FDR) (F) and with FDR (G). (H, I) Volcano plots of proteome in mucus samples of different mice groups showing differential expression of proteins in Rab7KD mice versus CScr (H) and DSS+Rab7KD mice versus DSS control group (I).
© 2024, BioRender Inc. Figure 6 was created using BioRender, and is published under a CC BY-NC-ND license. Further reproductions must adhere to the terms of this license.
-
Figure 6—source data 1
List of all the proteins identified in different samples of mucus (numerical source data).
- https://cdn.elifesciences.org/articles/89776/elife-89776-fig6-data1-v1.csv
Figure 6—figure supplement 1
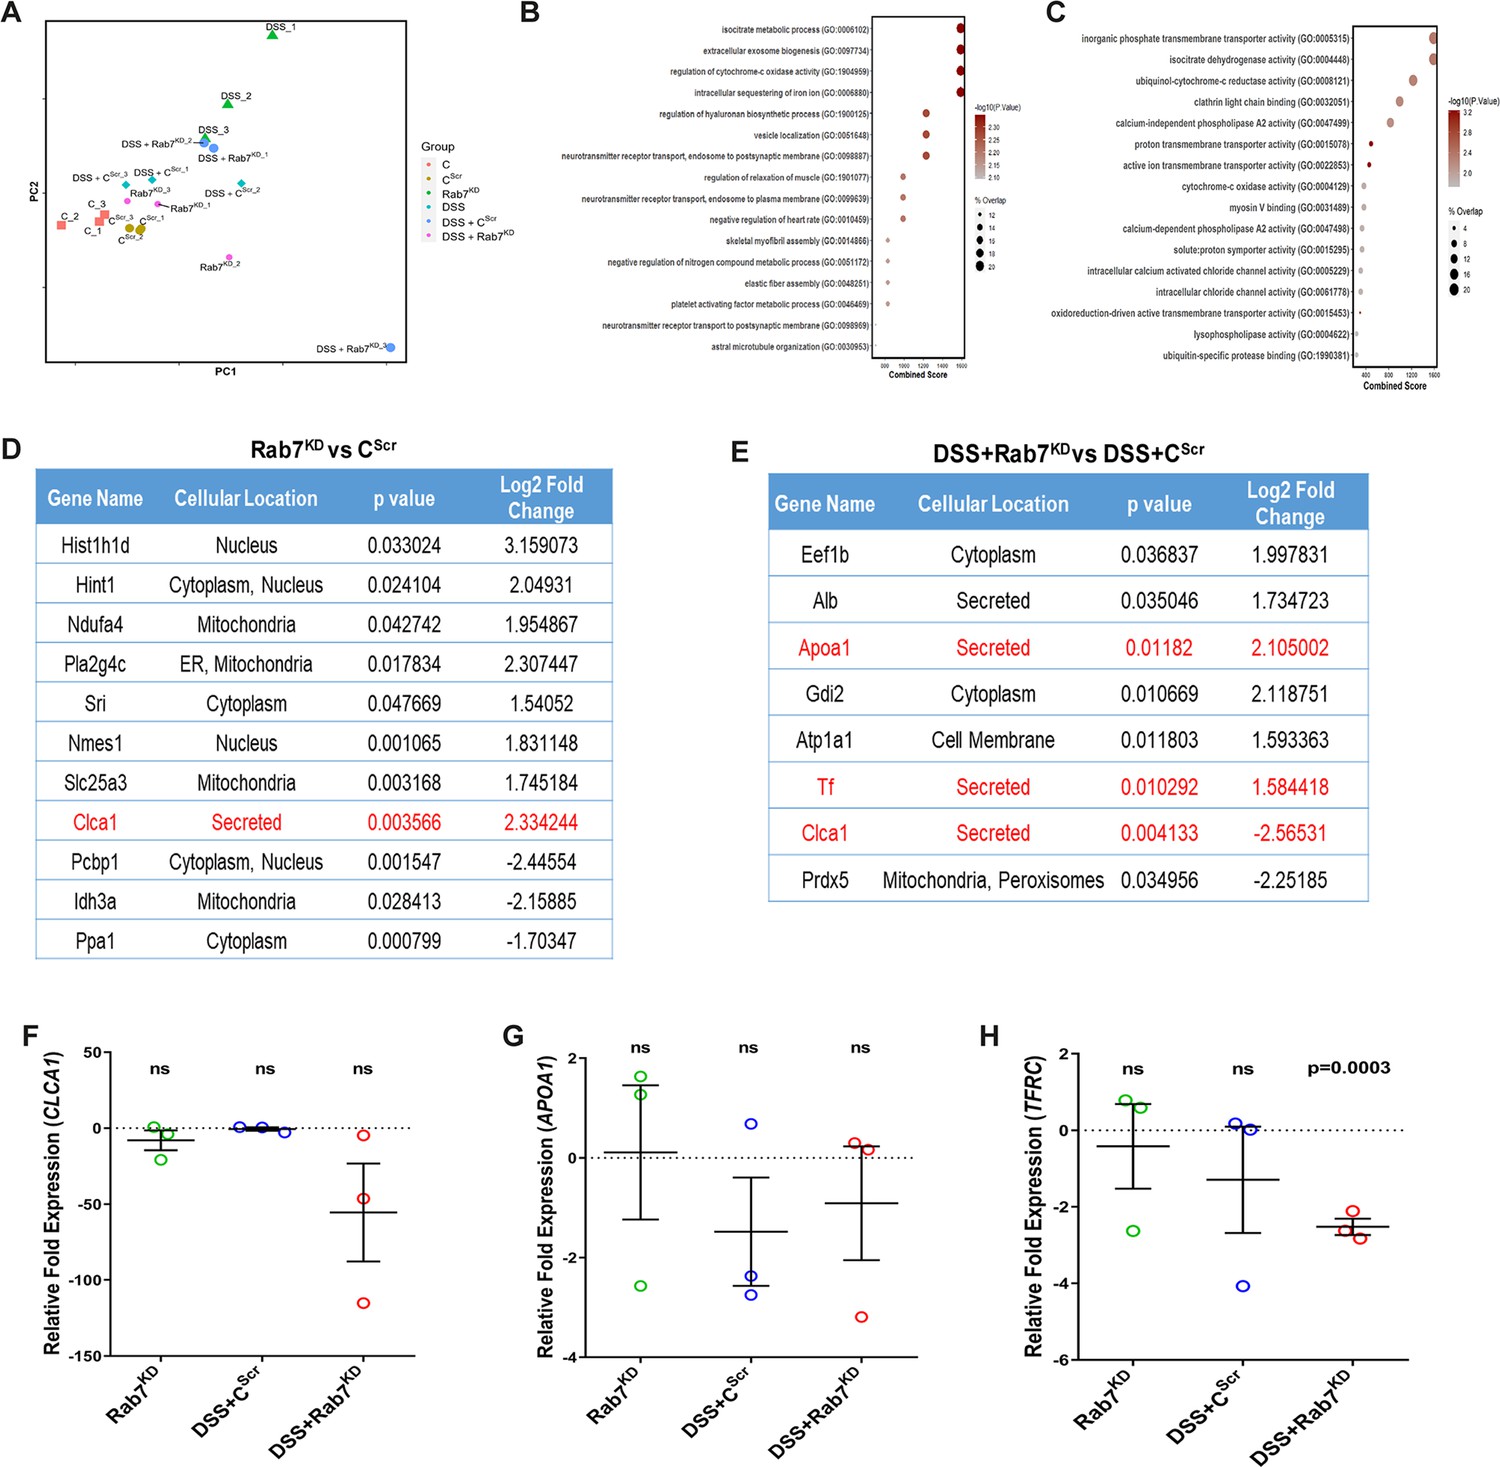
Mucus proteome analysis of Rab7KD mice.
(A) Principal component analysis (PCA) of different experimental groups. (B, C) Fold change of proteins enriched in the Rab7KD mice group compared to the CScr mice group based on Gene Ontology analysis of biological process (B) and molecular function (C). (D, E) Table summarizing fold change of differentially expressed proteins in the Rab7KD versus CScr mice group (D) and DSS+Rab7KD versus DSS+CScr-treated mice group (E). (F–H) Relative fold expression of CLCA1 (F), APOA1 (G), and TFRC (H) in Rab7KD, DSS+CScr and DSS+Rab7KD-treated mice relative to CScr mice (n = 3). HPRT was used for normalization. Each dot represents one mouse. Error bars represent mean + SEM. Statistical analysis by Student’s t-test. ns = nonsignificant.
Figure 7 with 1 supplement
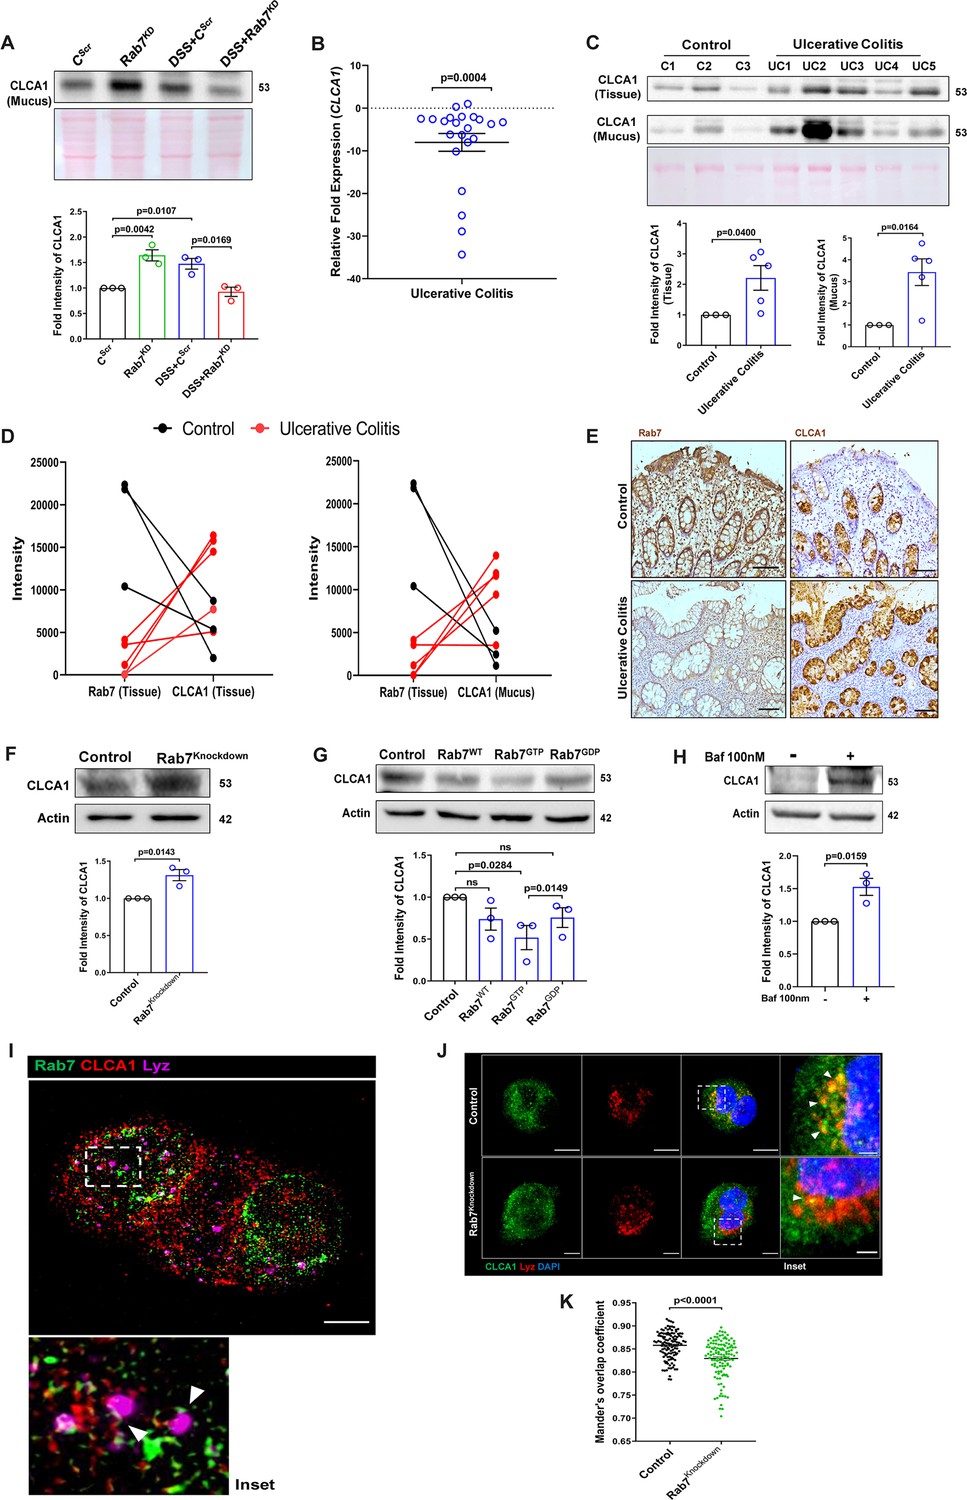
Rab7 mediates CLCA1 degradation via lysosomal pathway in goblet cells.
(A) CLCA1 expression in mucus samples of Rab7KD-DSS mice. Graph represents densitometric analysis showing fold intensity of CLCA1 expression. (B) RT-PCR analysis of relative fold expression of CLCA1 gene in human ulcerative colitis (UC) (n = 22) patient colonic biopsies relative to average control (n = 22) values. HPRT was used for normalization. (C) Immunoblotting of CLCA1 protein in human UC (n = 5) and control (n = 3) mucus and biopsy samples. Graphs represent densitometric analysis showing fold intensity of CLCA1 expression in mucus and tissue samples calculated by normalizing to loading control (GAPDH shown in Figure 1F). (D) Correlation graph showing expression of Rab7 and CLCA1 in mucus and tissue samples of human UC patients relative of controls plotted using fold change from immunoblots. (E) Representative immunohistochemistry images of Rab7 and CLCA1 staining (brown color) in human UC patient (n = 3) and control biopsy (n = 3) sections and cell nuclei (blue color) (scale bar = 100 µm). (F) CLCA1 protein expression in HT29-MTX-E12 cells transfected with either scrambled siRNA (control) or Rab7 siRNA (Rab7Knockdown). Graph represents densitometric analysis showing fold intensity of CLCA1 expression calculated by normalizing to loading control (β actin). (G) Immunoblot showing CLCA1 protein expression change in HT29-MTX-E12 cells overexpressed with EGFP empty vector (control), Rab7-GFP (Rab7WT), Rab7-GFP GTP locked form (Rab7GTP), and Rab7-GFP GDP locked form (Rab7GDP). Graph represents densitometric analysis showing fold intensity of CLCA1 expression calculated by normalizing to loading control (β actin). (H) Immunoblot showing CLCA1 protein expression after treatment of bafilomycin in HT29-MTX-E12 cells. Graph represents densitometric analysis showing fold intensity of CLCA1 expression calculated by normalizing to loading control (β actin). (I) Representative image of structured illumination microscopy showing images of HT29-MTX-E12 cells transfected with Rab7GTP (green) and stained with CLCA1 (red) using anti-CLCA1 antibody and lysosomes with LysoTracker Red DND-99 (magenta) (scale bar = 5 µm). Inset shows zoomed areas of colocalization marked with arrows. (J, K) Representative confocal images of HT29-MTX-E12 cells transfected with either scrambled siRNA (control) or Rab7 siRNA (Rab7Knockdown). Cells are stained with CLCA1 (green) using anti-CLCA1 antibody and lysosomes with LysoTracker Red DND-99 (red). Graph shows quantitation of colocalization between CLCA1 and lysosomes from images (n = 120) using Mander’s overlap coefficient (scale bar = 100 µm). Inset shows zoomed areas of the image with colocalization puncta (yellow) marked with arrows (scale bar = 50 µm). Each dot represents (A) one mouse or (B, C, E) one human or (F–H) one independent experiment. Error bars represent mean + SEM. Statistical analysis by (C) Welch’s t-test or (A, B, F–H, K) Student’s t-test. ns = nonsignificant.
-
Figure 7—source data 1
Original files for the western blot analysis in Figure 7 (anti-CLCA1 and 1023 anti-actin).
- https://cdn.elifesciences.org/articles/89776/elife-89776-fig7-data1-v1.zip
Figure 7—figure supplement 1
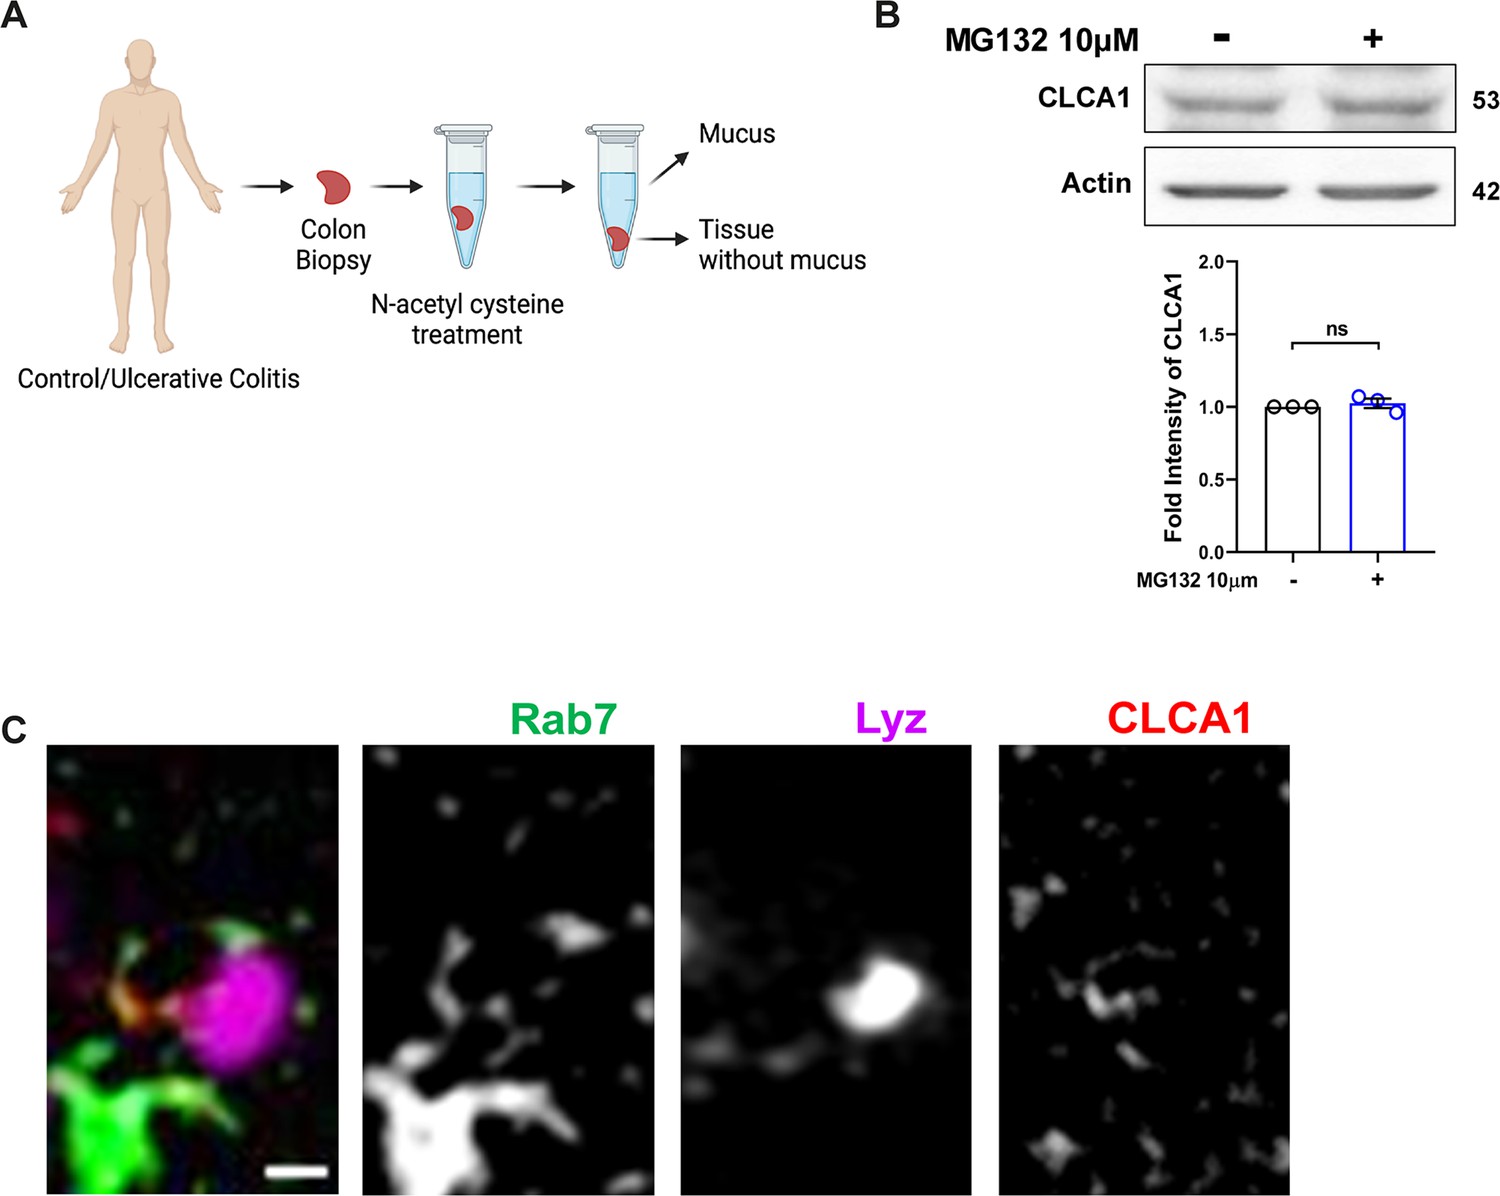
CLCA1 protein degrades via lysosomal degradation pathway.
(A) Schematic illustrating mucus isolation steps from human colon biopsy samples (created with BioRender.com and published using a CC BY-NC-ND license with permission). (B) Immunoblot showing CLCA1 protein expression after MG132 treatment. Graph represents densitometric analysis showing fold intensity of CLCA1 expression calculated by normalizing to loading control (β actin). (C) Representative zoomed-in SIM images of HT29-MTX-E12 cells showing Rab7, CLCA1, and lysosomes in grayscale. The left panel shows the merged image. Each dot represents one individual experiment. Error bars represent mean + SEM. Statistical analysis by Student’s t-test. ns = nonsignificant.
© 2024, BioRender Inc. Figure 7—figure supplement 1 was created using BioRender, and is published under a CC BY-NC-ND license. Further reproductions must adhere to the terms of this license.
-
Figure 7—figure supplement 1—source data 1
Original files for the western blot analysis in Figure 7—figure supplement 1B (anti-CLCA1 and anti-actin).
- https://cdn.elifesciences.org/articles/89776/elife-89776-fig7-figsupp1-data1-v1.zip
Figure 8
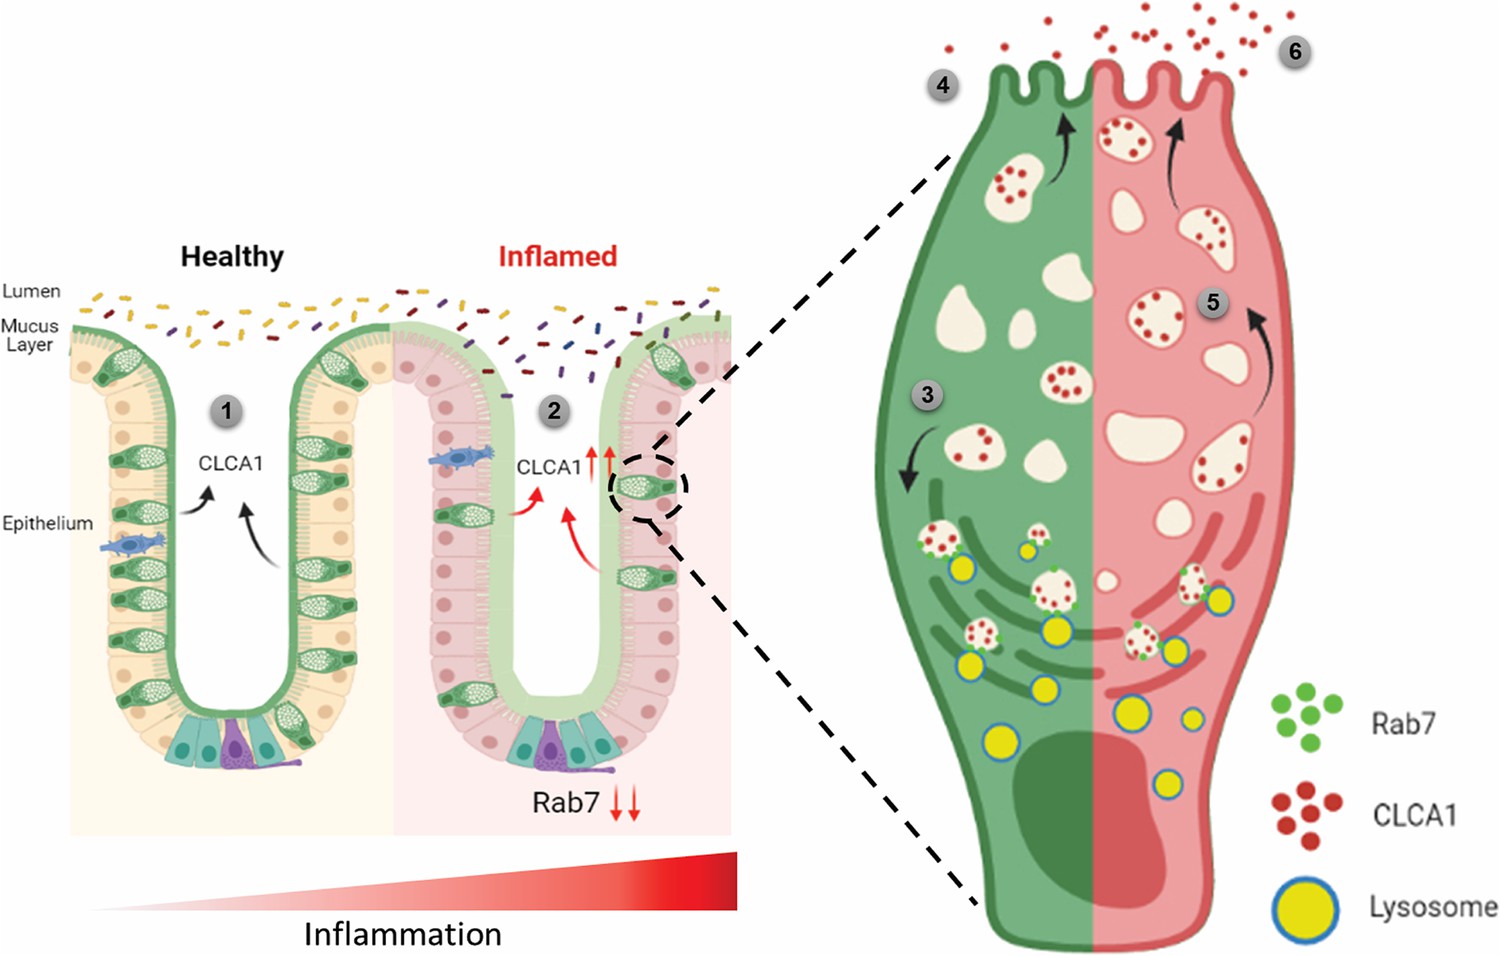
Rab7 maintains mucus layer dynamics in intestine by regulating degradation of CLCA1 protein via lysosomal fusion.
Healthy intestine inhabits lumen microbes well separated by mucus layer secreted by goblet cells along with CLCA1 protein in balanced levels (1). During colitis, Rab7 downregulates along with increased expression of CLCA1, resulting in diffused mucus layer penetrable to microbes (2). In a goblet cell, CLCA1-filled vacuoles destined for secretion are rerouted for degradation pathway by Rab7 and fuse with lysosomes (3), leading to a balanced release outside the cell (4). However, during inflammation the loss of Rab7 consequently impedes CLCA1 degradation (5), fostering its increased secretion from the cell (6) (created with BioRender.com and published using a CC BY-NC-ND license with permission).
© 2024, BioRender Inc. Figure 8 was created using BioRender, and is published under a CC BY-NC-ND license. Further reproductions must adhere to the terms of this license.
Author response image 1
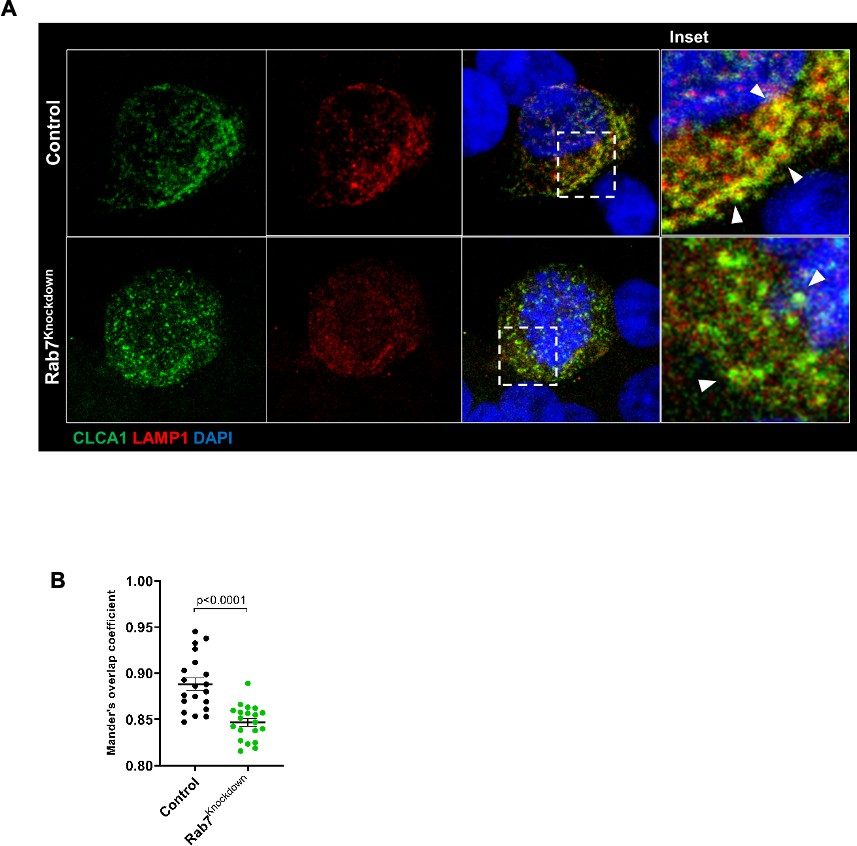
(A) Representative confocal images of HT29-MTX-E12 cells transfected with either scrambled siRNA (control) or Rab7 siRNA (Rab7Knockdown).
Cells are stained with CLCA1 (green) using antiCLCA1 antibody and lysosomes with LAMP1. (B) Graph shows quantitation of colocalization between CLCA1 and LAMP1 from images (n = 20) using Mander’s overlap coefficient. Inset shows zoomed areas of the image with colocalization puncta (yellow) marked with arrows.
Tables
Key resources table
| Reagent type (species) or resource | Designation | Source or reference | Identifiers | Additional information |
|---|---|---|---|---|
| Cell line (human) | HT29 | ECACC | Lot. 9K003 | |
| Cell line (human) | HT29-MTX-E12 (human) | ECACC | Lot. 8K206 | |
| Cell line (human) | HEK293T Rab7-/- (human) | This paper | This is a new reagent (details in ‘Material and methods’) | |
| Transfected construct (human) | pSNMUC2-MG plasmid | Prof. Gunnar Hansson Godl et al., 2002 | ||
| Antibody | Anti-Rab7a (rabbit polyclonal) | Sigma-Aldrich | Cat# R4779 | WB: 1:5000 IHC: 1:400 (indirect) IF: 1:400 (indirect) IEM: 1:1000 |
| Antibody | Anti-Rab7a (mouse monoclonal) | CST | Cat# 95746 | IP: 1:50 IF: 1:400 |
| Antibody | Anti-CLCA1 (rabbit monoclonal) | Abcam | Cat# ab180851 | WB: 1:5000-1:20,000 IHC: 1:100 IF: 1:100 |
| Antibody | Anti-Muc2 (mouse monoclonal) | Santa Cruz | Cat# sc-515032 | IF: 1:200 |
| Antibody | Anti-GAPDH (mouse monoclonal) | Invitrogen | Cat# 39-8600; RRID:AB_2533438 | WB: 1:2000 |
| Antibody | Anti-β-Actin (rabbit polyclonal) | CST | Cat# 4970S | WB: 1:20,000 |
| Antibody | Anti-rabbit HRP (mouse monoclonal) | Jackson ImmunoResearch Laboratories | Cat# 211-032-171; RRID:AB_2339149 | WB: 1:20,000 |
| Antibody | Anti-mouse HRP (goat polyclonal) | Invitrogen | Cat# 31430; RRID:AB_228307 | WB: 1:5000 |
| Antibody | Biotin SP anti-rabbit antibody (goat polyclonal) | Jackson ImmunoResearch Laboratories | Cat# 111-065-003; RRID:AB_2337959 | IF: 1:500 |
| Antibody | Anti-rabbit Alexa Flour 488 (goat polyclonal) | Jackson ImmunoResearch Laboratories | Cat# 111-545-003; RRID:AB_2338046 | IF: 1:400 |
| Antibody | Anti-mouse Alexa Flour 488 (goat polyclonal) | Jackson ImmunoResearch Laboratories | Cat# 115-545-003; RRID:AB_2338840 | IF: 1:400 |
| Antibody | Anti-rabbit Cy5 (goat polyclonal) | Jackson ImmunoResearch Laboratories | Cat# 111-175-144; RRID:AB_2338013 | IF: 1:400 |
| Antibody | Anti-mouse Cy5 (goat polyclonal) | Jackson ImmunoResearch Laboratories | Cat# 111-175-146; RRID:AB_2338713 | IF: 1:400 |
| Antibody | 18 nm Colloidal Gold-AffinityPure Anti-Rabbit (goat polyclonal) | Jackson ImmunoResearch Laboratories | Cat# 111-215-144; RRID:AB_2338017 | IEM: 1:50 |
| Recombinant DNA reagent | pSpCas9(BB)-2A-Puro | addgene | 62988 | |
| Sequence-based reagent | ON-TARGETplus Smart Pool Mouse Rab7a siRNA | Dharmacon | L-040859-02-0005 | |
| Sequence-based reagent | ON-TARGETplus Smart Pool Human Rab7a siRNA | Dharmacon | 010388-00-0005 | |
| Sequence-based reagent | ON-TARGETplus Non-targeting Control Pool | Dharmacon | D-001810-10-20 | |
| Sequence-based reagent | EUB338-Alexa Fluor 647 GCT GCC TCC CGT AGG AGT | IDT | ||
| Peptide, recombinant protein | Streptavidin Cy2 | Jackson ImmunoResearch Laboratories | 16220084 | |
| Peptide, recombinant protein | UEA1-FITC | Vector Laboratories | Cat# FL-1061 | IF: 1:400 |
| Peptide, recombinant protein | Phalloidin-594 | Invitrogen | Cat# A12381 | IF: 1:400 |
| Commercial assay or kit | Mouse TNFα ELISA kit | R&D Systems | DY410-05 | |
| Chemical compound, drug | Dextran sodium sulfate | MP Biomedicals | 160110 | |
| Chemical compound, drug | Bafilomycin A1 Ready Made Solution | Sigma-Aldrich | SML1661 | |
| Chemical compound, drug | MG-132 Ready Made Solution | Sigma-Aldrich | M7449 | |
| Other | Gentle cell dissociation reagent | Stemcell Technologies | 100-0485 | For crypt isolation from mice colon (‘Materials and methods’) |
| Other | Alcian Blue Solution | B8438 | Sigma-Aldrich | For staining mucin gels and mice colon histology (‘Materials and methods’) |
Additional files
-
Supplementary file 1
List of patient clinical parameters.
- https://cdn.elifesciences.org/articles/89776/elife-89776-supp1-v1.docx
-
Supplementary file 2
List of qRT-PCR primers.
- https://cdn.elifesciences.org/articles/89776/elife-89776-supp2-v1.docx
-
MDAR checklist
- https://cdn.elifesciences.org/articles/89776/elife-89776-mdarchecklist1-v1.docx
Download links
A two-part list of links to download the article, or parts of the article, in various formats.
Downloads (link to download the article as PDF)
Open citations (links to open the citations from this article in various online reference manager services)
Cite this article (links to download the citations from this article in formats compatible with various reference manager tools)
Rab7-dependent regulation of goblet cell protein CLCA1 modulates gastrointestinal homeostasis
eLife 12:RP89776.
https://doi.org/10.7554/eLife.89776.3


