High-resolution kinetics of herbivore-induced plant volatile transfer reveal clocked response patterns in neighboring plants
- Institute of Plant Sciences, University of Bern, Switzerland
- Neuchâtel Platform of Analytical Chemistry, Faculty of Science, University of Neuchâtel, Switzerland
Figures
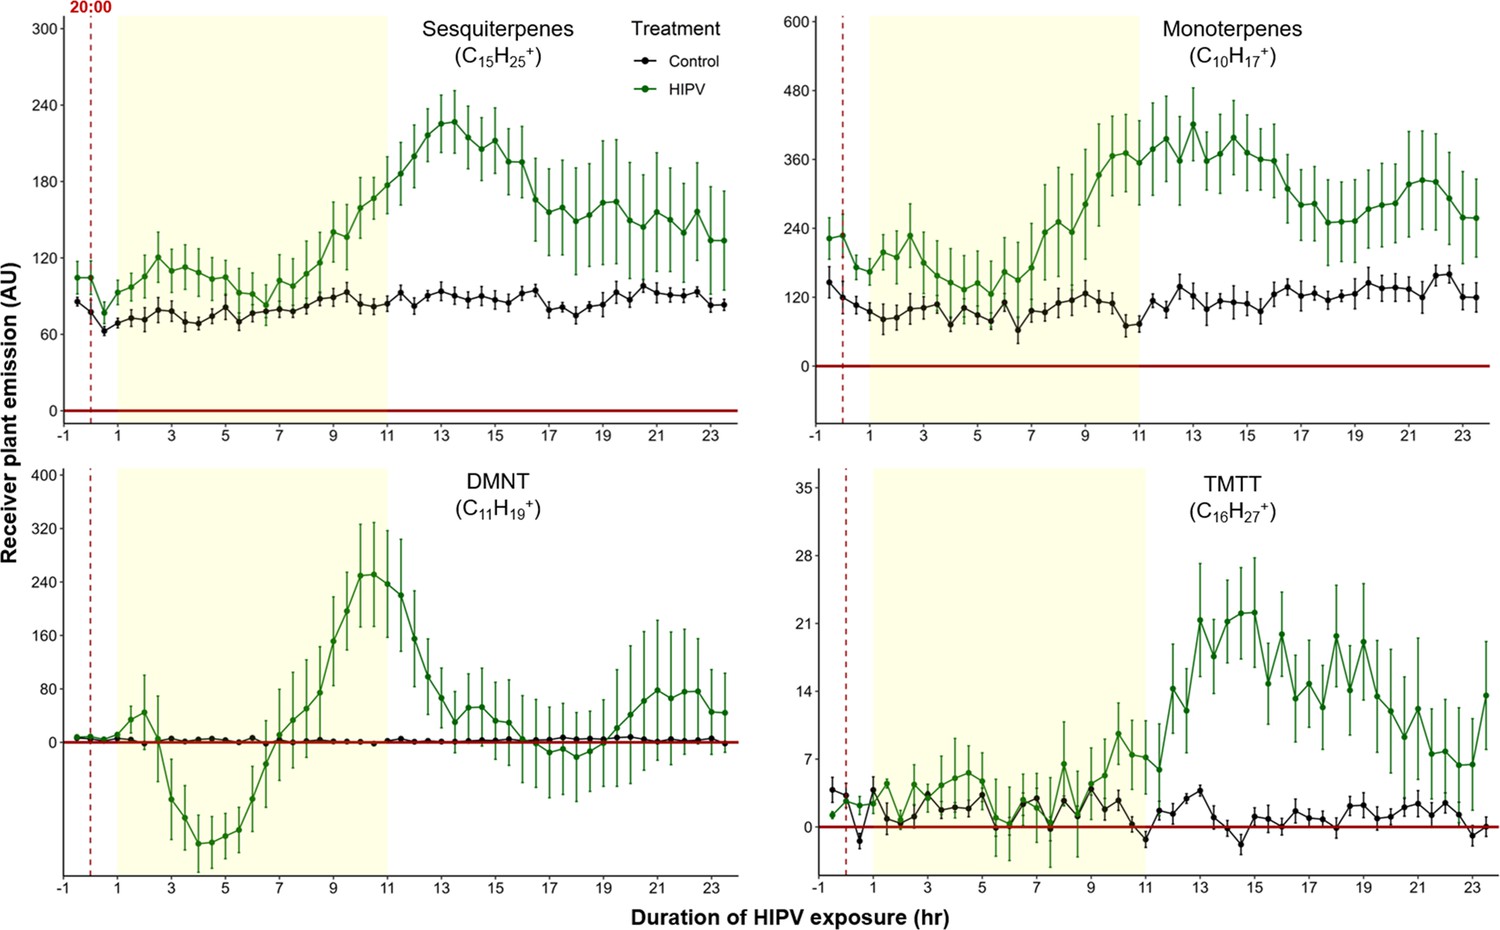
Figure 1
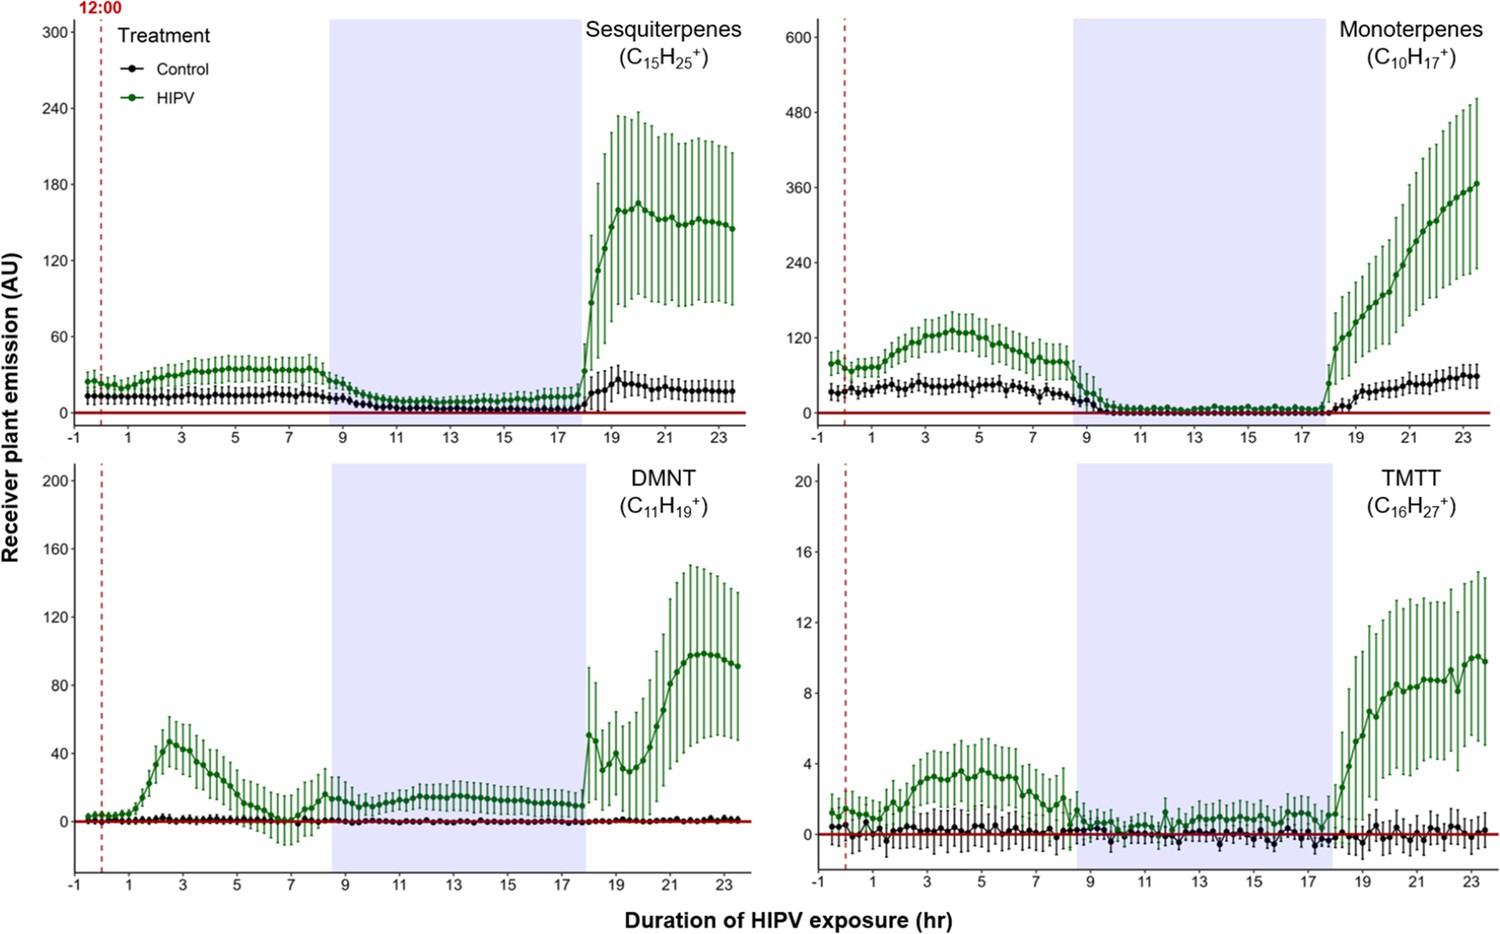
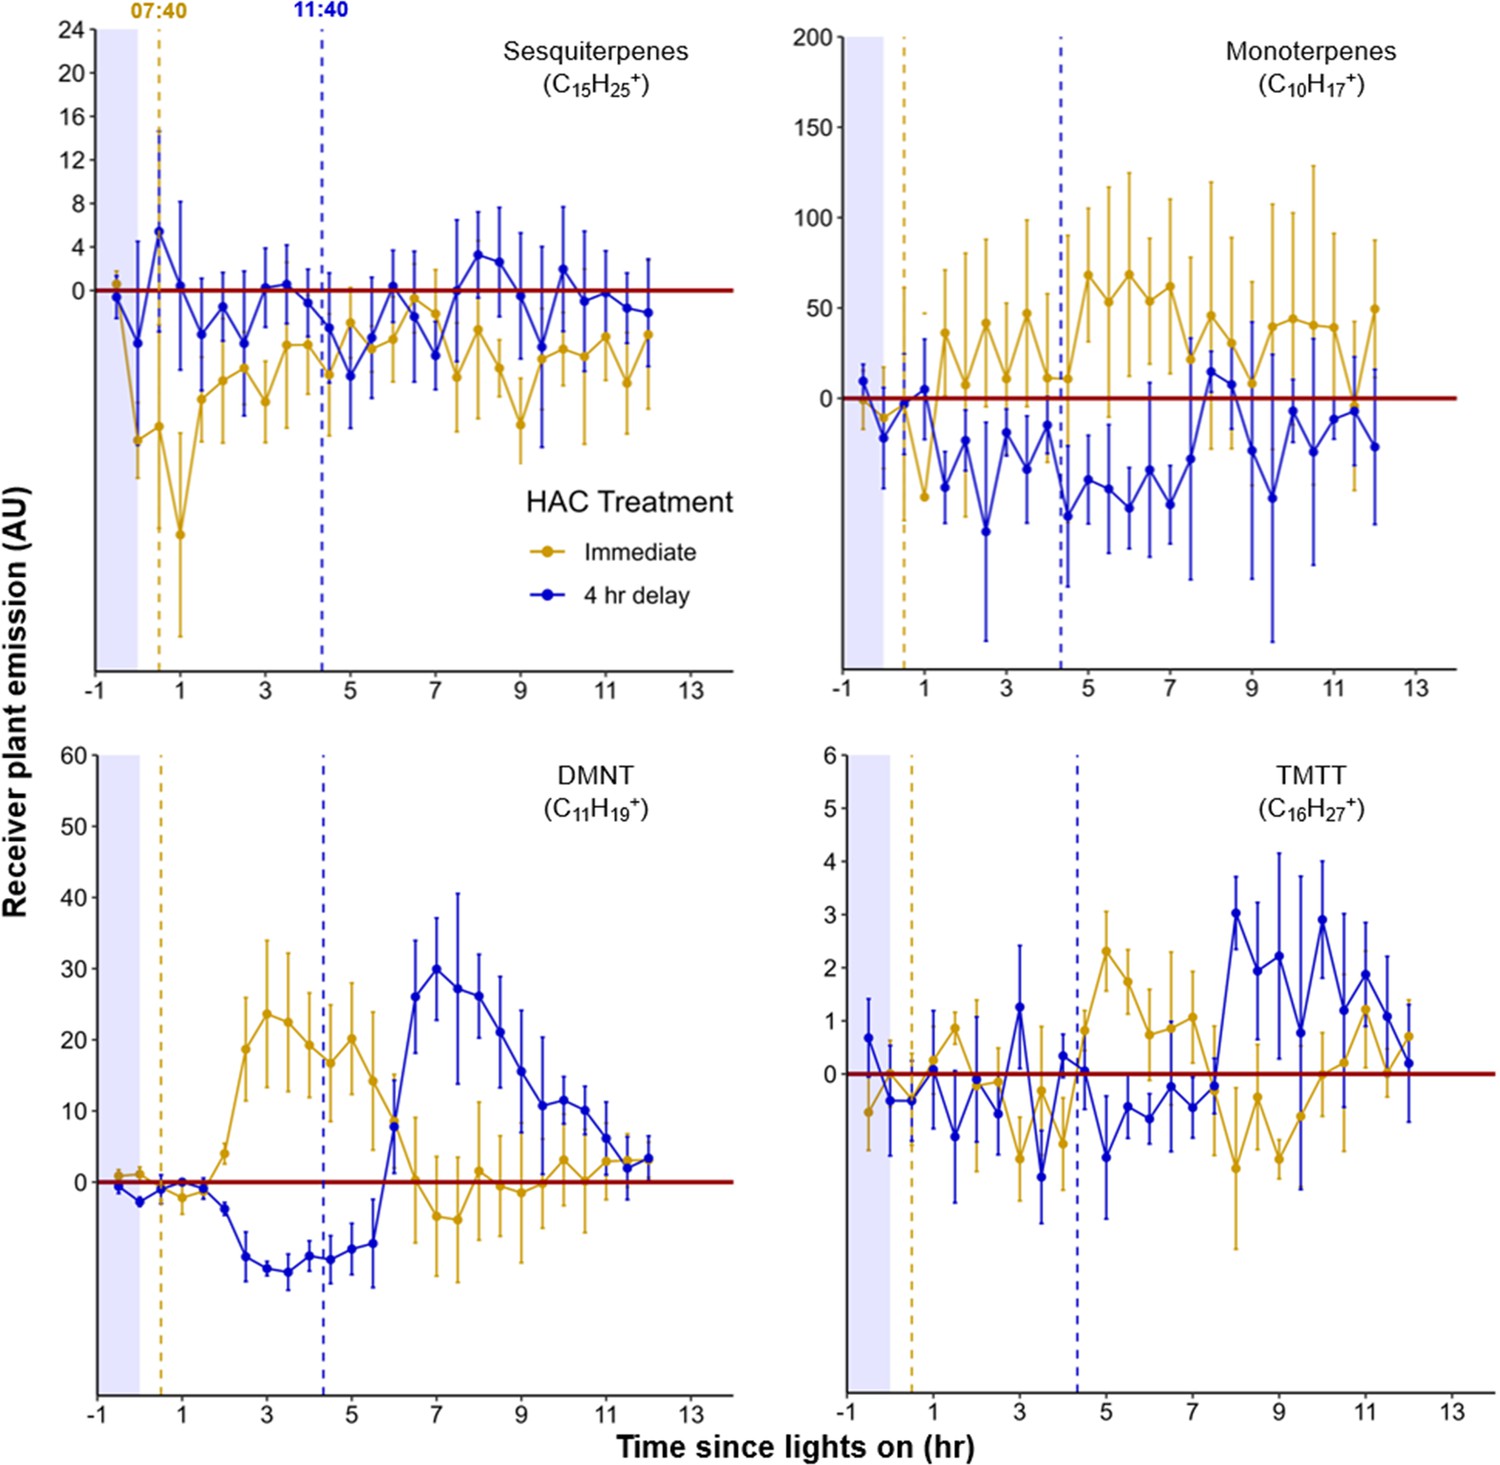
Delayed burst in induced volatile emissions in plants exposed to volatiles of a herbivore-attacked neighbor.
Emission kinetics of herbivore-induced plant volatile (HIPV)-induced terpenes in undamaged receiver plants are shown. Dark green points represent mean emission of herbivore-damaged sender plants connected to undamaged receiver plants, with the emissions from damaged sender plants only subtracted. Black points represent undamaged sender plants connected to undamaged receiver plants, with the emissions from undamaged sender plants only subtracted. Blue rectangles represent the night (dark phase). Abbreviations: DMNT, 4,8-dimethylnona-1,3,7-triene; TMTT, 4,8,12-trimethyltrideca-1,3,7,11-tetraene. Error bars = SE. n=8–10. Compounds were identified based on their molecular weight+1, as all compounds were protonated. Sesquiterpenes: m/z=205.20; monoterpenes: m/z=137.13; DMNT: m/z=151.15; TMTT: m/z=219.21.
Figure 2
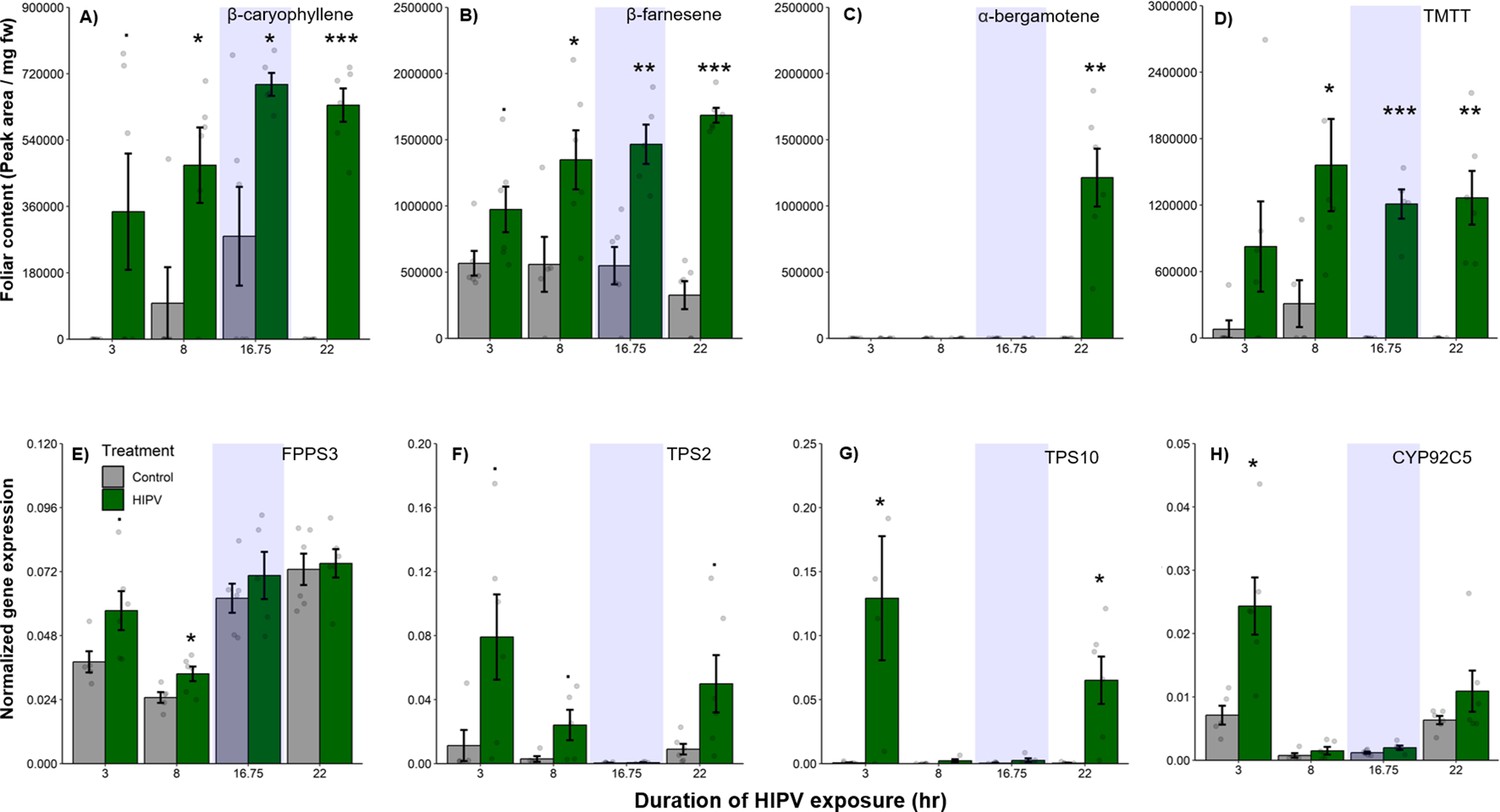
The delayed burst in terpene emission is not explained by terpene overaccumulation during the night.
Accumulation of terpenes and induction of terpene biosynthesis genes in receiver plants was measured over time. (A–D) Internal foliar pools of terpenes in receiver plants. (E–H) Expression of terpene biosynthesis genes in receiver plants. Dark green bars represent receiver plants exposed to herbivore-induced plant volatiles (HIPVs) and light gray bars represent receiver plants connected to undamaged sender plants. Blue rectangles represent the night (dark phase). Abbreviations: TMTT, 4,8,12-trimethyltrideca-1,3,7,11-tetraene; FPPS3, farnesene pyrophosphate synthase 3; TPS2, terpene synthase 2; TPS10, terpene synthase 10; CYP92C5, dimethylnonatriene/trimethyltetradecatetraene synthase. = p<0.1, *=p<0.05, **=p<0.01, ***=p<0.001 as determined by a Welch’s two-sample t-test. Bars = mean ± SE. n=4–6.
Figure 3
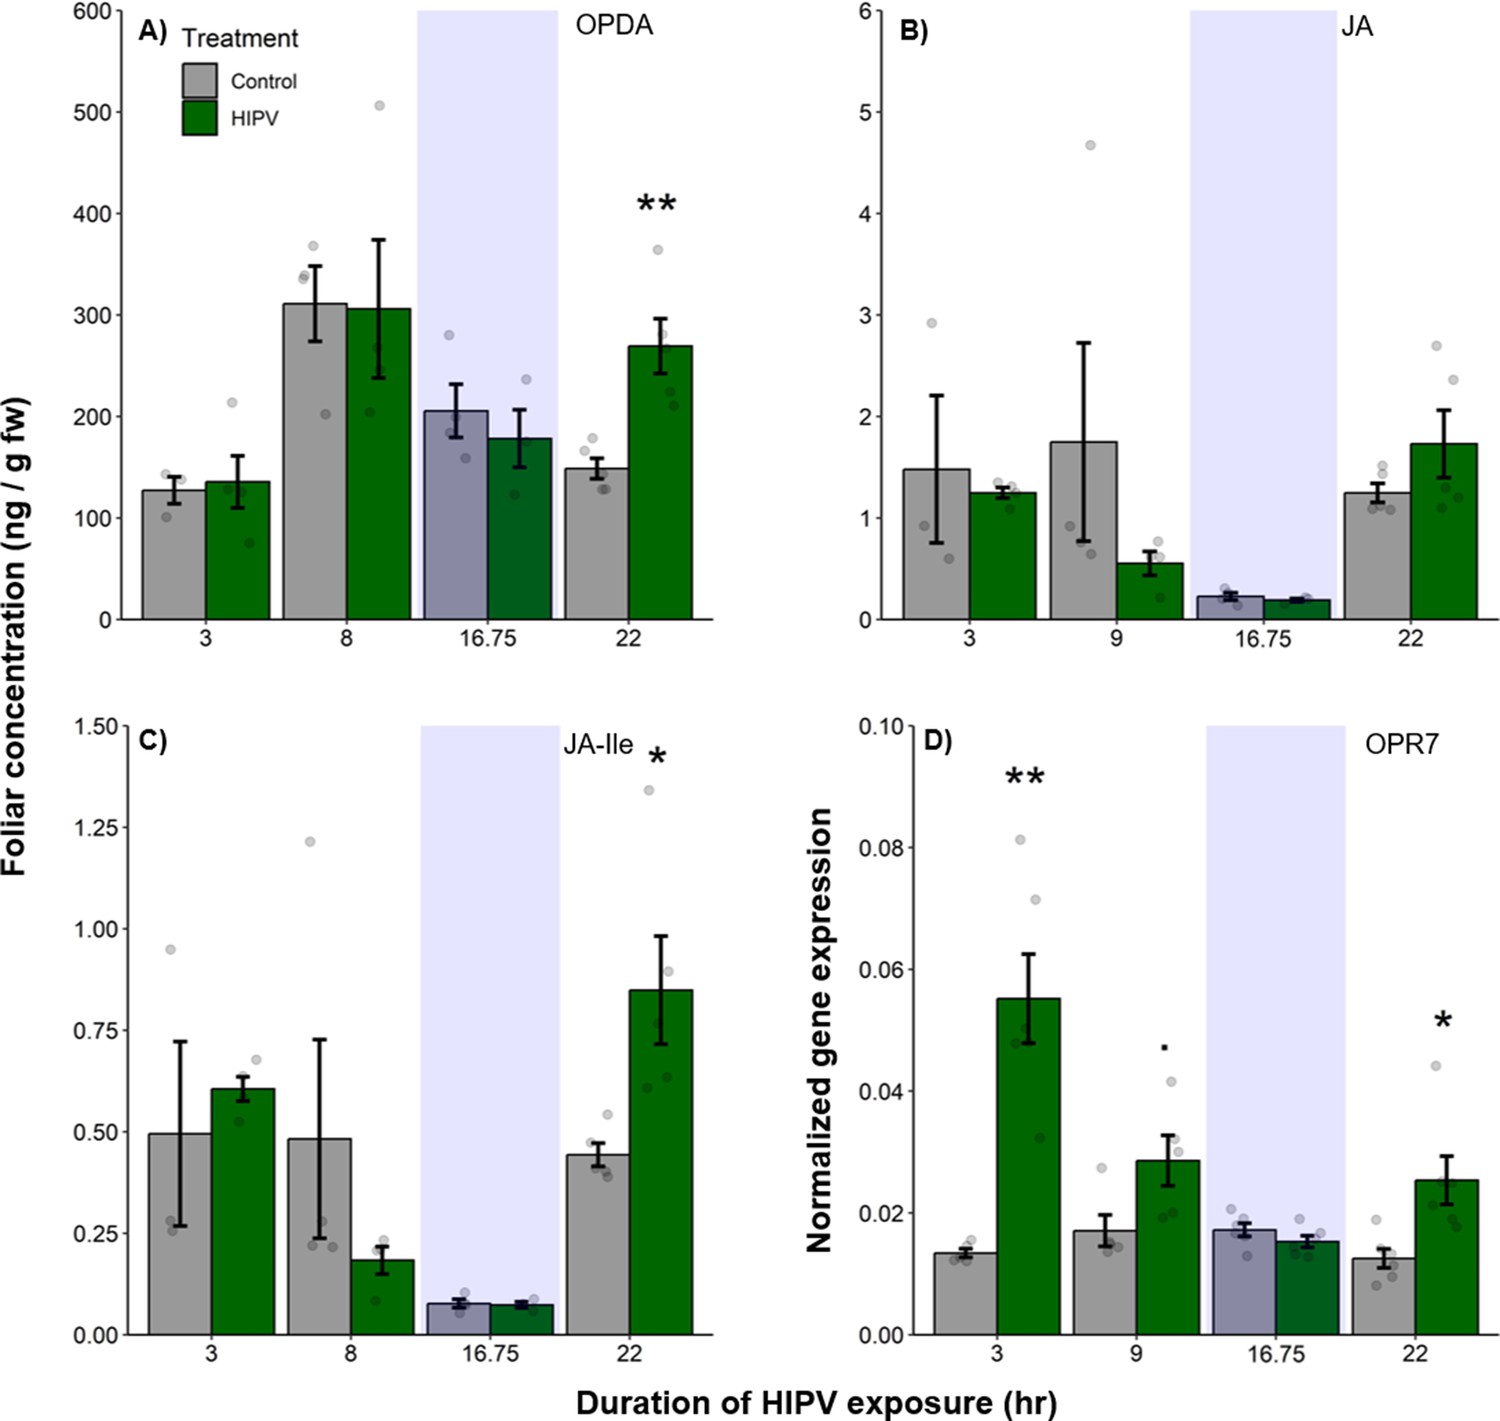
The delayed burst in terpene emission is associated with clocked jasmonate production.
Foliar jasmonate concentrations (A–C) and jasmonate biosynthesis (OPR7; D) in receiver plants over time are shown. Dark green bars represent receiver plants exposed to herbivore-induced plant volatiles (HIPVs) and light gray bars represent receiver plants connected to undamaged sender plants. Blue rectangles represent the night (dark phase). Abbreviations: OPDA, 12-oxophytodienoic acid; JA, jasmonic acid; JA-Ile, jasmonic acid-isoleucine; OPR7, oxo-phytodienoate reductase 7. = p<0.1, *=p<0.05, **=p<0.01, ***=p<0.001 as determined by a Welch’s two-sample t-test. Bars = mean ± SE. n=3–6.
Figure 4 with 1 supplement
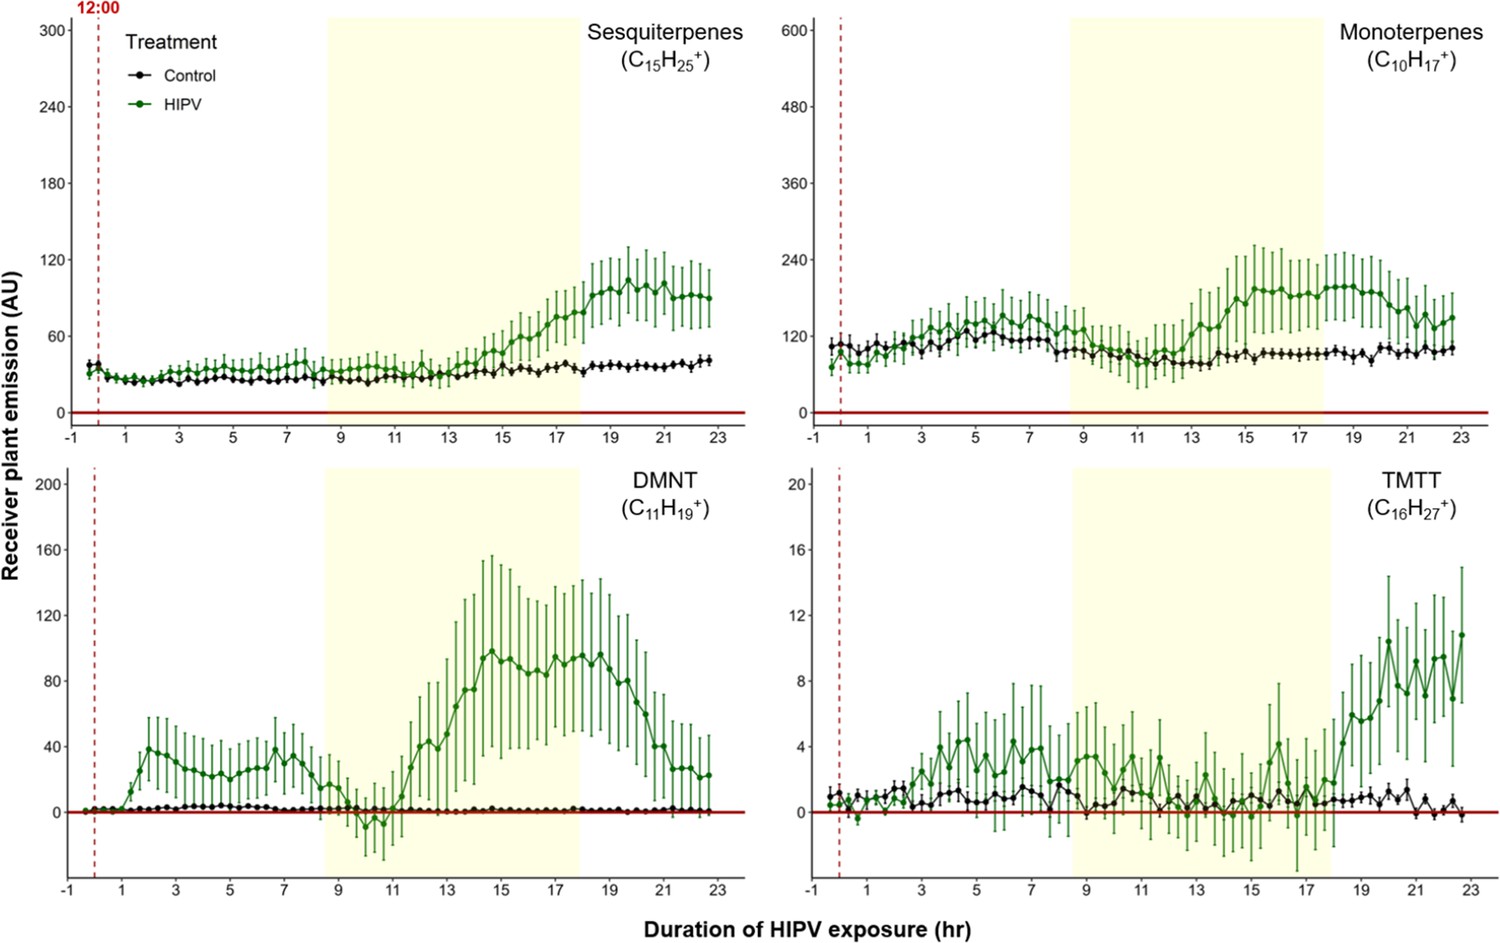
The delayed volatile burst is conserved under continuous light.
Emission kinetics of herbivore-induced plant volatile (HIPV)-induced terpenes in undamaged receiver plants under continuous light are shown. Plants were grown under normal light conditions. Lights were left on continuously following the start of the treatment. Dark green points represent the mean emission of herbivore damaged sender plants connected to undamaged receiver plants with the emissions from damaged sender plants only subtracted. Black points represent undamaged sender plants connected to undamaged receiver plants, with the emissions from undamaged sender plants only subtracted. Yellow rectangles represent when the lights would typically be turned off. Abbreviations: DMNT, 4,8-dimethylnona-1,3,7-triene; TMTT, 4,8,12-trimethyltrideca-1,3,7,11-tetraene. Error bars = SE. n=8–10. Compounds were identified based on their molecular weight+1, as all compounds were protonated. Sesquiterpenes: m/z=205.20; monoterpenes: m/z=137.13; DMNT: m/z=151.15; TMTT: m/z=219.21.
Figure 4—figure supplement 1
The delayed volatile burst is conserved under continuous light, regardless of the time of day.
Emission kinetics of herbivore-induced plant volatile (HIPV)-induced terpenes in undamaged receiver plants under continuous light are shown. Herbivory on sender plants ca. 1 hr before lights would typically be turned off (around 20:00 hr). Plants were grown under normal light conditions. Lights were left on continuously following the start of the treatment. Dark green points represent the mean emission of herbivore damaged sender plants connected to undamaged receiver plants with the emissions from damaged sender plants only subtracted. Black points represent undamaged sender plants connected to undamaged receiver plants, with the emissions from undamaged sender plants only subtracted. Yellow rectangles represent when the lights would typically be turned off. Abbreviations: DMNT, 4,8-dimethylnona-1,3,7-triene; TMTT, 4,8,12-trimethyltrideca-1,3,7,11-tetraene. Error bars = SE. n=6. Compounds were identified based on their molecular weight+1, as all compounds were protonated. Sesquiterpenes: m/z=205.20; monoterpenes: m/z=137.13; DMNT: m/z=151.15; TMTT: m/z=219.21.
Figure 5
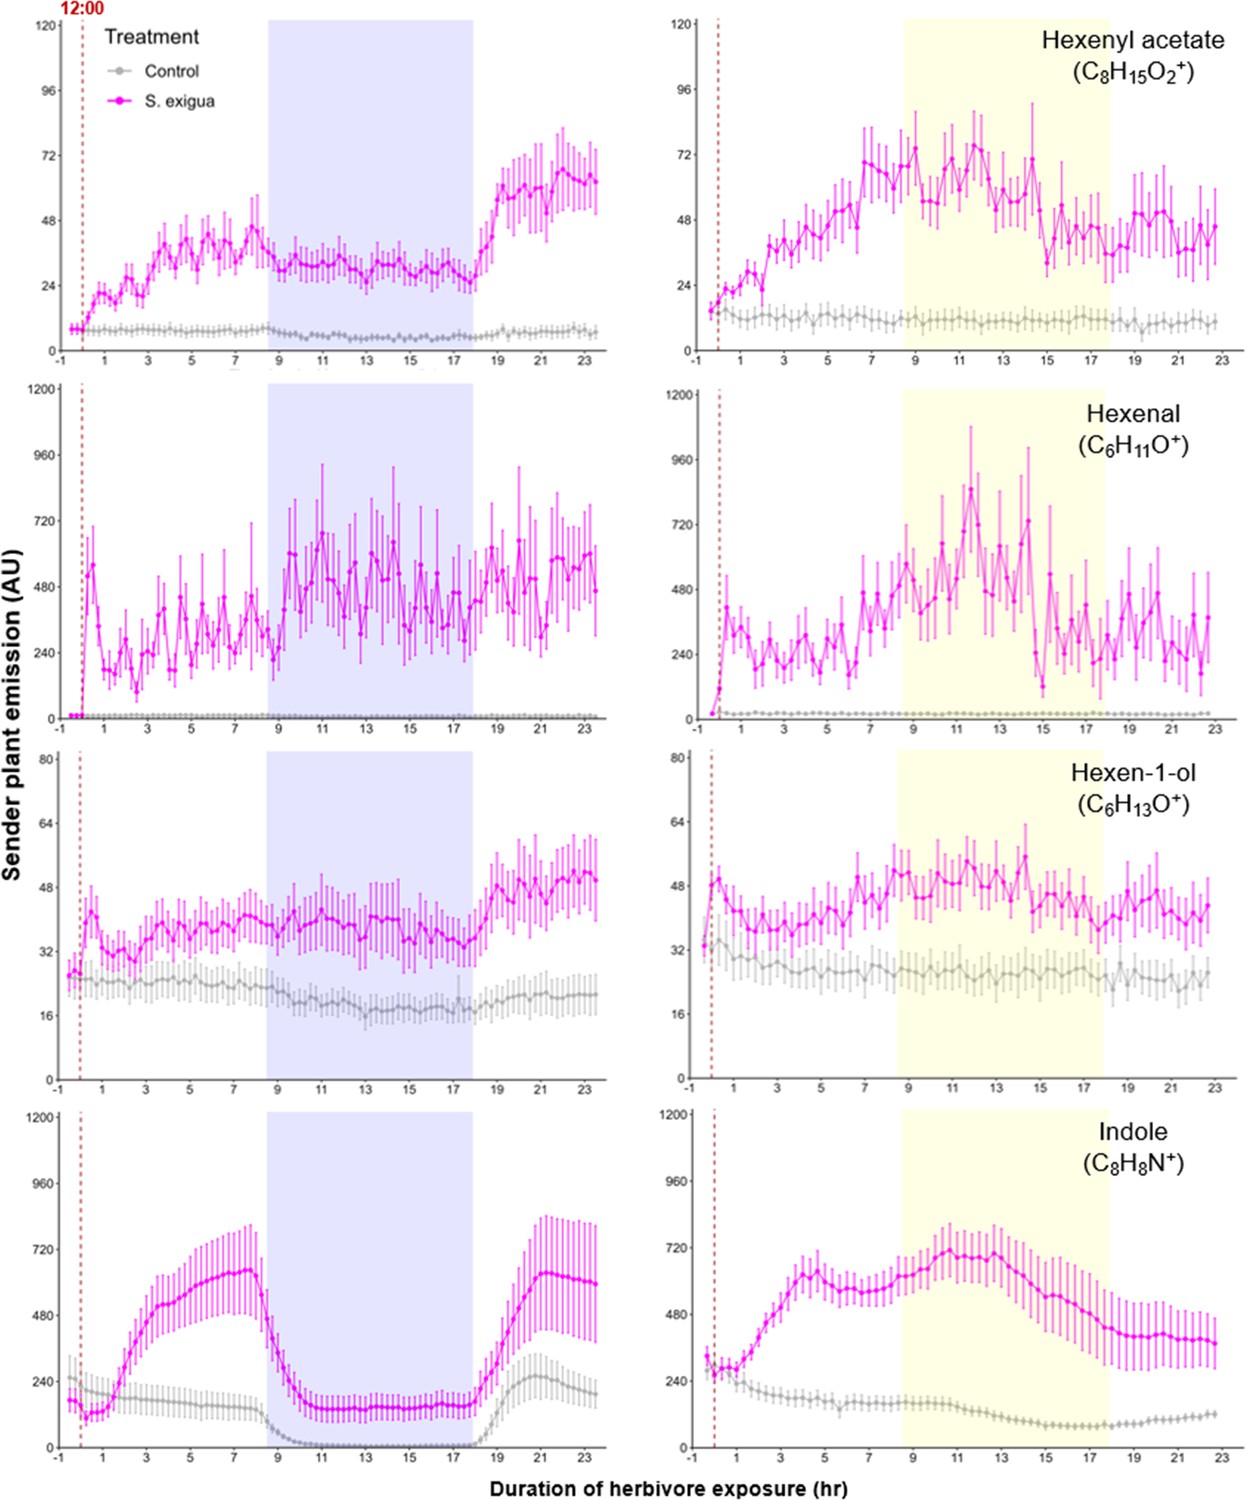
Green leaf volatile (GLV) and indole emissions in S. exigua-damaged plants.
Pink points represent the mean emission of herbivore-damaged sender plants. Gray points represent mean emissions of undamaged sender plants. Blue rectangles represent the night (dark phase). Yellow rectangles represent when the lights would typically be turned off. Continuous light-exposed plants were grown under normal light conditions, however lights were left on continuously following the start of the treatment. Error bars = SE. n=8–10. Compounds were identified based on their molecular weight+1, as all compounds were protonated. Sesquiterpenes: m/z=205.20; monoterpenes: m/z=137.13; DMNT: m/z=151.15; TMTT: m/z=219.21.
Figure 6
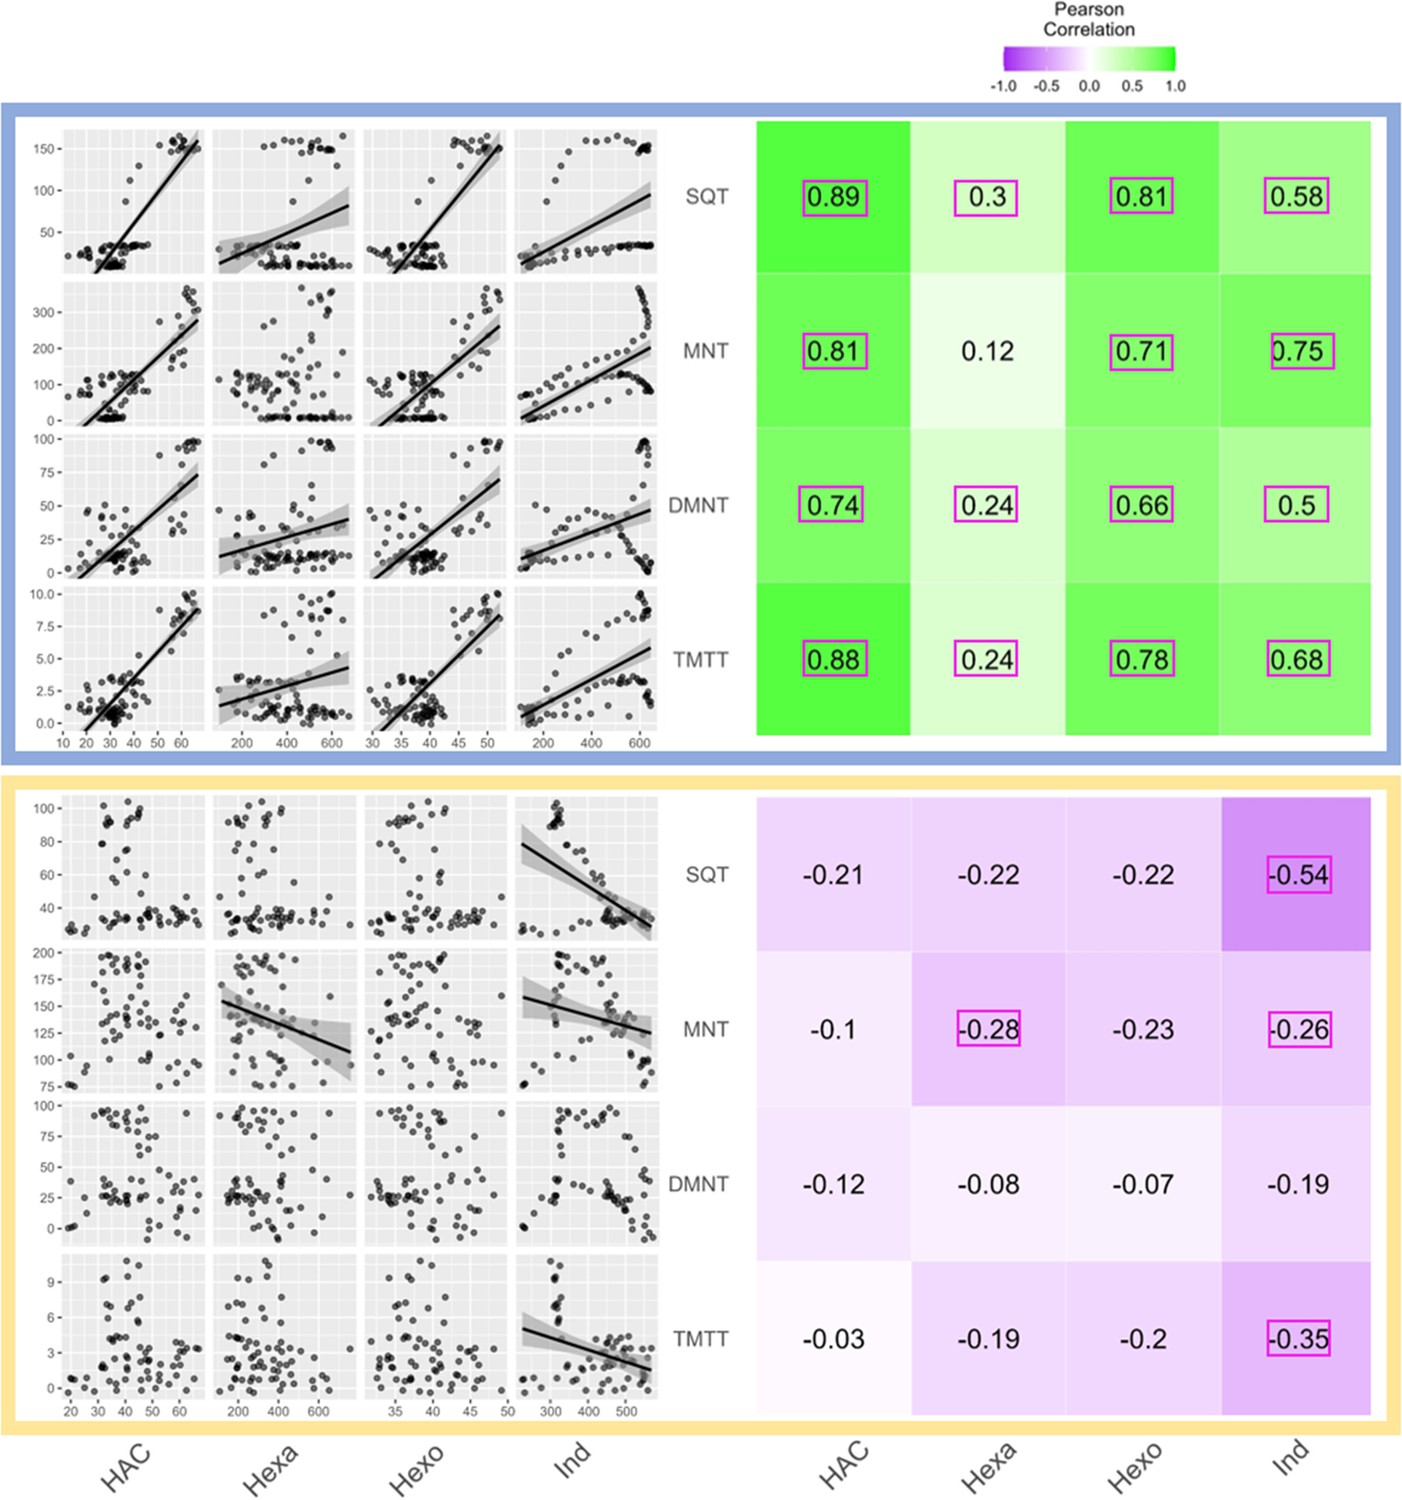
Receiver plant terpene emissions are tightly correlated with bioactive sender plant signals under normal light conditions.
The left panels depict scatter plot correlation matrices of bioactive volatile emissions from damaged sender plants and terpene emissions from herbivore-induced plant volatile (HIPV)-exposed receiver plants. Only data from the first measurement following the addition of herbivores to sender plants are included. Upper scatter plot (blue box) shows correlations under normal light conditions and lower scatter plot (yellow box) depicts correlations under continuous light. For continuous light-exposed plants, lights were left on continuously following the start of the treatment. Each black point represents the mean value of all individuals at a given time point after herbivory began. Regression curves are only shown for significant relationships (p<0.05). Panels on the right-hand side depict heat maps based on the value of Pearson’s correlation coefficient between two given compounds. Numbers in the center of each square are Pearson’s correlation coefficient. Correlation coefficients contained in a pink rectangles indicate a significant correlation (p<0.05). (Z)-3-hexenyl acetate (HAC), hexenal (Hexa), hexen-1-ol (Hexo), and indole (Ind) were from sender plants, and sesquiterpenes (SQT), monoterpenes (MNT), 4,8-dimethylnona-1,3,7-triene (DMNT), and 4,8,12-trimethyltrideca-1,3,7,11-tetraene (TMTT) were from receiver plants.
Figure 7 with 2 supplements
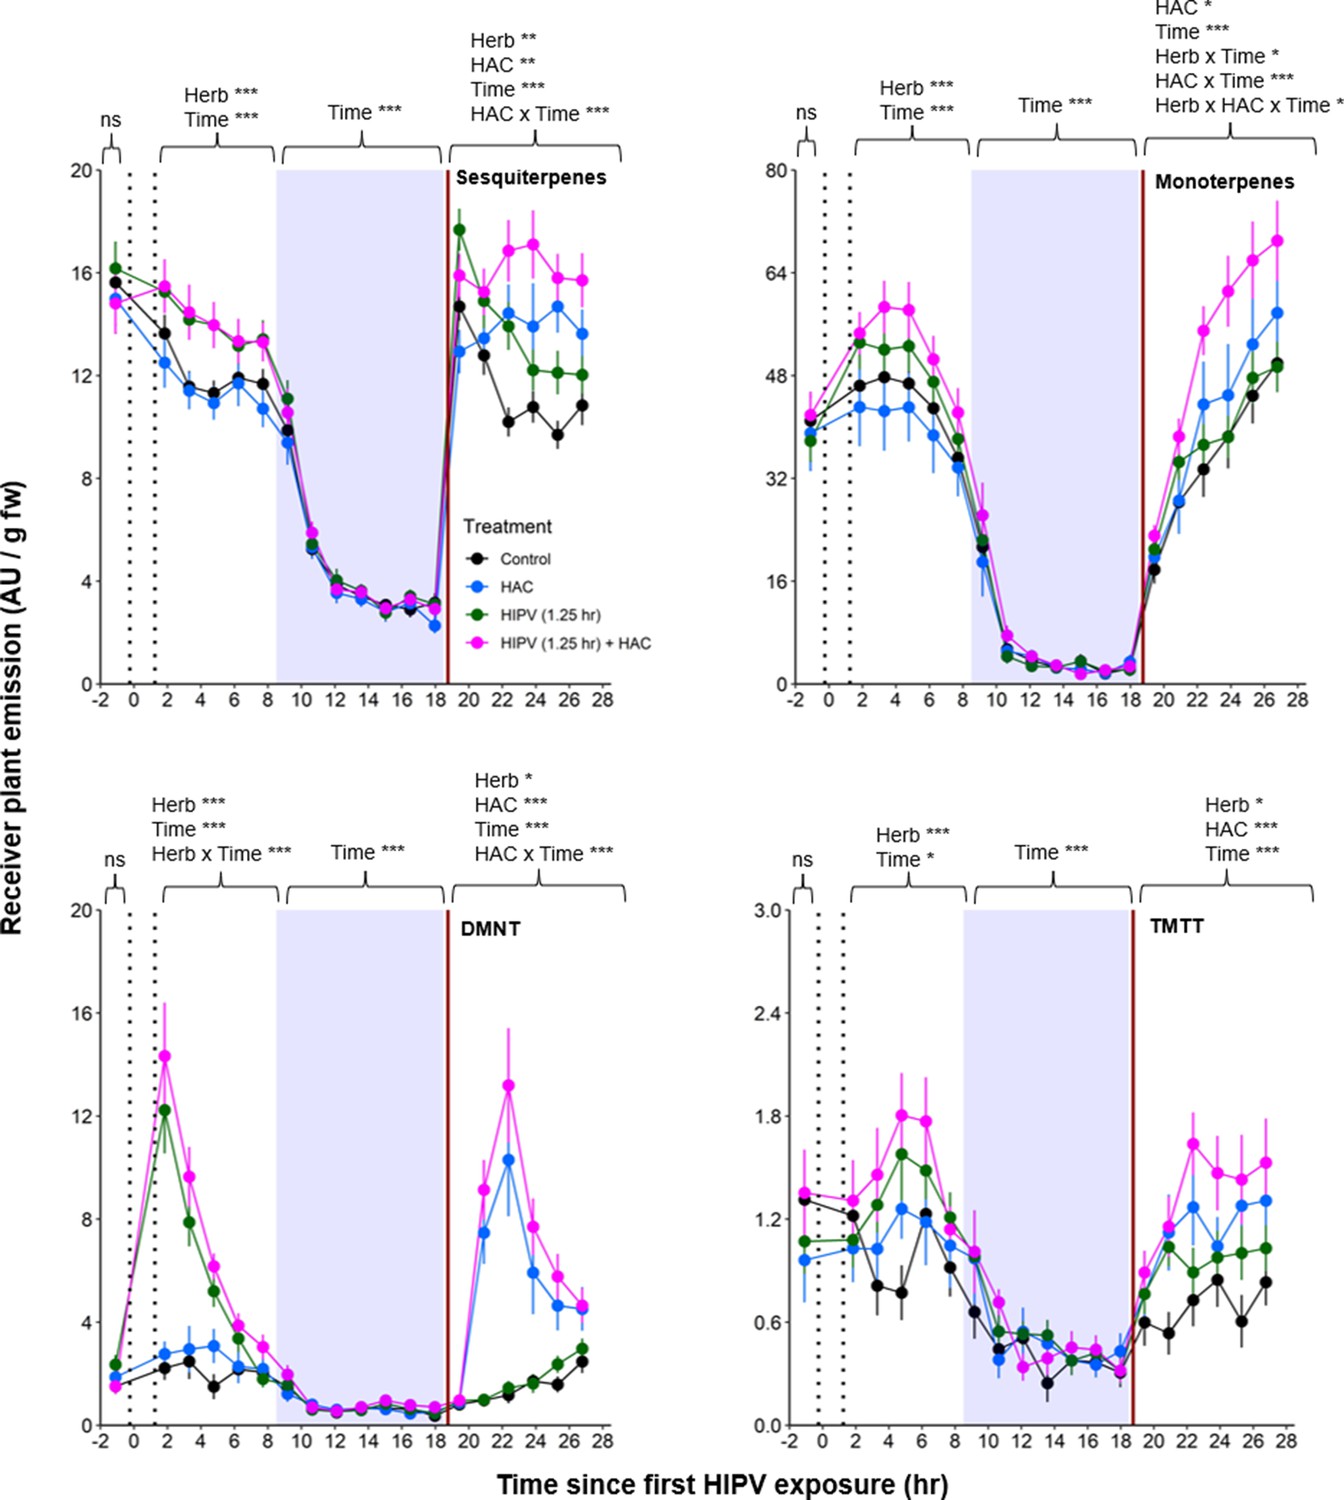
The combination of volatile priming and sender emission kinetics can explain the delayed terpene burst in receiver plants.
Sender plants were connected to receiver plants 30 min prior to herbivore exposure on sender plants and left connected for 1.25 hr following exposure (time between perforated vertical lines). After 1.25 hr, chambers were disconnected and measurements were collected from receiver plant chambers only. The following day, after light was restored, plants were treated with (Z)-3-hexenyl acetate (HAC) dispensers to simulate bioactive signals (indicated by red solid vertical line). Blue rectangles represent the night (dark phase). *=p<0.05, **=p<0.01, ***=p<0.001 as determined by aligned rank transformed nonparametric factorial repeated measures ANOVA. Abbreviations: HIPV, herbivore-induced plant volatile; DMNT, 4,8-dimethylnona-1,3,7-triene; TMTT, 4,8,12-trimethyltrideca-1,3,7,11-tetraene. Colored points represent mean emissions standardized by fresh weight (fw). Error bars = SE. n=12–16. Compounds were identified based on their molecular weight+1, as all compounds were protonated. Sesquiterpenes: m/z=205.20; monoterpenes: m/z=137.13; DMNT: m/z=151.15; TMTT: m/z=219.21.
Figure 7—figure supplement 1
Maize seedlings respond consistently to green leaf volatiles (GLVs) throughout the day.
Figure 7—figure supplement 2
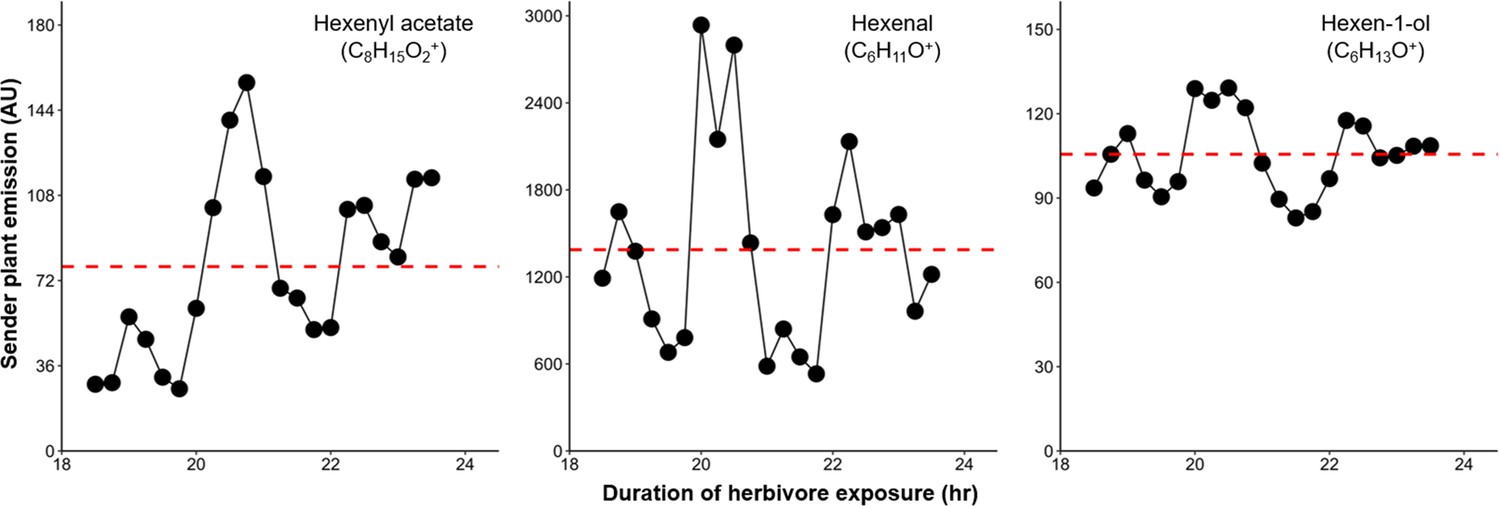
Green leaf volatile (GLV) emission from herbivore-damaged maize seedlings is highly variable over time.
Representative GLV emissions from a single attacked plant on the second day of herbivory (18–24 hr of exposure to herbivore-induced plant volatiles [HIPVs]) are shown in black. The perforated red horizontal line represents the average across all time points presented. Compounds were identified based on their molecular weight+1, as all compounds were protonated. Sesquiterpenes: m/z=205.20; monoterpenes: m/z=137.13; DMNT: m/z=151.15; TMTT: m/z=219.21.
Figure 8
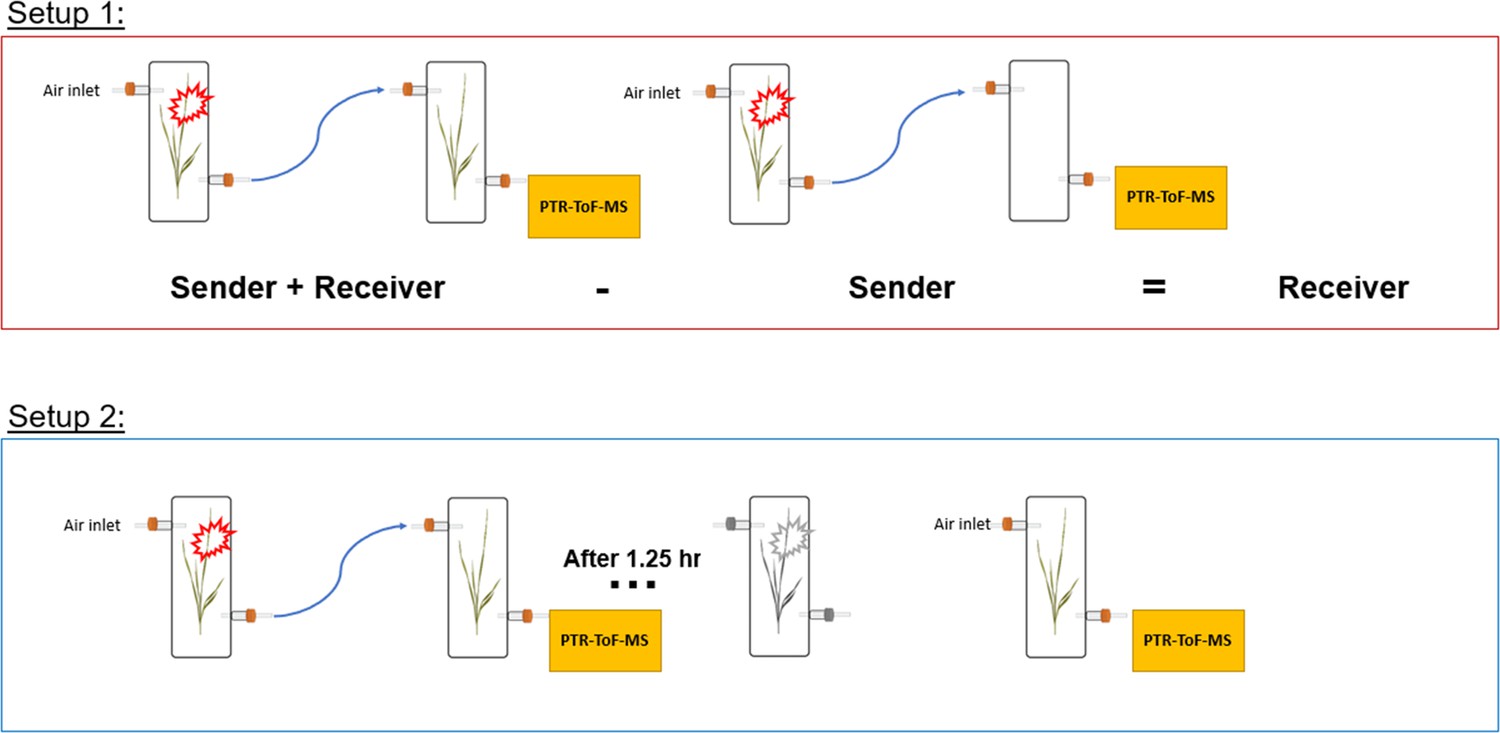
Experimental setup schemes for volatile profiling.
Tables
Table 1
Welch’s two-sample t-test results comparing foliar terpene pools, biosynthesis genes, and phytohormone levels between herbivore-induced plant volatile (HIPV)-exposed and control receiver plants.
Bold values: p<0.05, underlined values: p<0.1. Abbreviations: β-car, β-caryophyllene; β-farn, β-farnesene; α-berg, α-bergamotene; TMTT, 4,8,12-trimethyltrideca-1,3,7,11-tetraene; FPPS3, farnesene pyrophosphate synthase 3; TPS2, terpene synthase 2; TPS10, terpene synthase 10; CYP92C5, dimethylnonatriene/trimethyltetradecatetraene synthase; OPDA, 12-oxophytodienoic acid; JA, jasmonic acid; JA-Ile, jasmonic acid-isoleucine; OPR7, oxo-phytodienoate reductase 7.
| Time | ||||||||||||
|---|---|---|---|---|---|---|---|---|---|---|---|---|
| Response | 3 hr | 8 hr | 16.75 hr | 22 hr | ||||||||
| t | p | df | t | p | df | t | p | df | t | p | df | |
| β-car | –2.20 | 0.08 | 5 | –2.65 | 0.03 | 9 | –3.00 | 0.03 | 6 | –14.05 | <0.001 | 5 |
| β-farn | –2.08 | 0.07 | 8 | –2.60 | 0.03 | 9 | –4.47 | 0.002 | 9 | –11.38 | <0.001 | 8 |
| α-berg | - | - | - | - | - | - | - | - | - | –5.56 | 0.003 | 5 |
| TMTT | –1.80 | 0.13 | 5 | –2.68 | 0.03 | 7 | –9.18 | <0.001 | 4 | –5.23 | 0.003 | 5 |
| FPPS3 | –2.31 | 0.05 | 8 | –2.62 | 0.03 | 9 | –0.82 | 0.44 | 7 | –0.28 | 0.78 | 10 |
| TPS2 | –2.39 | 0.05 | 6 | –2.19 | 0.09 | 4 | –0.62 | 0.55 | 8 | –2.24 | 0.07 | 5 |
| TPS10 | –2.65 | 0.05 | 5 | –1.97 | 0.12 | 4 | –1.34 | 0.25 | 4 | –3.50 | 0.02 | 5 |
| CYP92C5 | –3.62 | 0.01 | 6 | –1.11 | 0.30 | 8 | –1.94 | 0.11 | 5 | –1.38 | 0.22 | 5 |
| OPDA | –0.26 | 0.80 | 4 | 0.07 | 0.95 | 5 | 0.65 | 0.55 | 4 | –4.18 | 0.008 | 5 |
| JA | 0.32 | 0.78 | 2 | 1.22 | 0.31 | 3 | 0.91 | 0.41 | 4 | –1.40 | 0.22 | 5 |
| JA-Ile | –0.48 | 0.68 | 2 | 1.21 | 0.31 | 3 | 0.24 | 0.82 | 5 | –2.98 | 0.04 | 4 |
| OPR7 | –5.70 | 0.002 | 5 | –2.36 | 0.05 | 7 | 1.32 | 0.22 | 10 | –3.01 | 0.02 | 7 |
Table 2
Aligned rank transformed nonparametric factorial repeated measures ANOVA results from data presented in Figure 7.
Bold values: p<0.05 and underlined values: p<0.1. Abbreviations: HAC, (Z)-3-hexenyl acetate; SQT, sesquiterpenes; MNT, monoterpenes; DMNT, 4,8-dimethylnona-1,3,7-triene; TMTT, 4,8,12-trimethyltrideca-1,3,7,11-tetraene.
| Herb | HAC | Time | Herb × HAC | Herb × Time | HAC × Time | Herb × HAC × Time | |||||||||||||||
|---|---|---|---|---|---|---|---|---|---|---|---|---|---|---|---|---|---|---|---|---|---|
| F | p | df | F | p | df | F | p | df | F | p | df | F | p | df | F | p | df | F | p | df | |
| SQT | |||||||||||||||||||||
| Base | 0.22 | 0.64 | 1,54 | 0.23 | 0.62 | 1,54 | NA | NA | NA | 0.05 | 0.82 | 1,54 | NA | NA | NA | NA | NA | NA | NA | NA | NA |
| D1 | 13.8 | <0.001 | 1,54 | 0.40 | 0.53 | 1,54 | 8.03 | <0.001 | 4,216 | 0.30 | 0.59 | 1,54 | 1.85 | 0.12 | 4,216 | 0.10 | 0.98 | 4,216 | 0.23 | 0.92 | 4,216 |
| Dark | 2.15 | 0.15 | 1,54 | 0.17 | 0.69 | 1,54 | 118 | <0.001 | 6,324 | 0.28 | 0.60 | 1,54 | 1.65 | 0.13 | 6,324 | 1.06 | 0.39 | 6,324 | 0.83 | 0.55 | 6,324 |
| D2 | 8.39 | 0.005 | 1,54 | 8.69 | 0.005 | 1,54 | 12.8 | <0.001 | 5,270 | 0.002 | 0.97 | 1,54 | 1.22 | 0.30 | 5,270 | 23.9 | <0.001 | 5,270 | 0.93 | 0.46 | 2,570 |
| MNT | |||||||||||||||||||||
| Base | 0.05 | 0.82 | 1,54 | 0.01 | 0.94 | 1,54 | NA | NA | NA | 1.33 | 0.25 | 1,54 | NA | NA | NA | NA | NA | NA | NA | NA | NA |
| D1 | 7.84 | 0.007 | 1,54 | 0.02 | 0.88 | 1,54 | 36.5 | <0.001 | 4,216 | 2.03 | 0.16 | 1,54 | 1.17 | 0.32 | 4,216 | 0.47 | 0.76 | 4,216 | 0.83 | 0.51 | 4,216 |
| Dark | 2.75 | 0.10 | 1,54 | 1.41 | 0.24 | 1,54 | 28.1 | <0.001 | 6,324 | 2.62 | 0.11 | 1,54 | 1.04 | 0.40 | 6,324 | 1.04 | 0.40 | 6,324 | 1.02 | 0.41 | 6,324 |
| D2 | 4.82 | 0.03 | 1,54 | 5.73 | 0.02 | 1,54 | 197 | <0.001 | 5,270 | 1.68 | 0.20 | 1,54 | 2.57 | 0.03 | 5,270 | 9.90 | <0.001 | 5,270 | 2.82 | 0.02 | 5,270 |
| DMNT | |||||||||||||||||||||
| Base | 0.60 | 0.44 | 1,54 | 0.91 | 0.34 | 1,54 | NA | NA | NA | 3.52 | 0.07 | 1,54 | NA | NA | NA | NA | NA | NA | NA | NA | NA |
| D1 | 66.3 | <0.001 | 1,54 | 2.55 | 0.12 | 1,54 | 81.4 | <0.001 | 4,216 | 0.69 | 0.41 | 1,54 | 65.1 | <0.001 | 4,216 | 0.62 | 0.65 | 4,216 | 1.10 | 0.36 | 4,216 |
| Dark | 2.34 | 0.13 | 1,54 | 0.45 | 0.50 | 1,54 | 10.7 | <0.001 | 6,324 | 0.51 | 0.48 | 1,54 | 1.05 | 0.40 | 6,324 | 0.20 | 0.98 | 6,324 | 0.30 | 0.94 | 6,324 |
| D2 | 7.01 | 0.01 | 1,54 | 155 | <0.001 | 1,54 | 52.4 | <0.001 | 5,270 | 3.67 | 0.06 | 1,54 | 1.74 | 0.13 | 5,270 | 54.6 | <0.001 | 5,270 | 2.09 | 0.07 | 5,270 |
| TMTT | |||||||||||||||||||||
| Base | 0.12 | 0.73 | 1,54 | 0 | 0.99 | 1,54 | NA | NA | NA | 2.23 | 0.14 | 1,54 | NA | NA | NA | NA | NA | NA | NA | NA | NA |
| D1 | 8.91 | 0.004 | 1,54 | 0.67 | 0.42 | 1,54 | 3.05 | 0.02 | 4,216 | 0.01 | 0.92 | 1,54 | 1.43 | 0.23 | 4,216 | 0.58 | 0.68 | 4,216 | 0.43 | 0.79 | 4,216 |
| Dark | 2.68 | 0.11 | 1,54 | 0.33 | 0.57 | 1,54 | 7.67 | <0.001 | 6,324 | 1.43 | 0.24 | 1,54 | 1.22 | 0.30 | 6,324 | 0.46 | 0.84 | 6,324 | 2.00 | 0.07 | 6,324 |
| D2 | 5.83 | 0.02 | 1,54 | 15.2 | <0.001 | 1,54 | 5.28 | <0.001 | 5,270 | 0.01 | 0.93 | 1,54 | 0.35 | 0.88 | 5,270 | 1.69 | 0.14 | 5,270 | 1.03 | 0.40 | 5,270 |
Additional files
-
Supplementary file 1
Primers used in this study.
- https://cdn.elifesciences.org/articles/89855/elife-89855-supp1-v1.docx
-
MDAR checklist
- https://cdn.elifesciences.org/articles/89855/elife-89855-mdarchecklist1-v1.docx
-
Source data 1
Source data used to produce all figures and tables included in the main and supplemental text.
- https://cdn.elifesciences.org/articles/89855/elife-89855-data1-v1.xlsx
Download links
A two-part list of links to download the article, or parts of the article, in various formats.
Downloads (link to download the article as PDF)
Open citations (links to open the citations from this article in various online reference manager services)
Cite this article (links to download the citations from this article in formats compatible with various reference manager tools)
High-resolution kinetics of herbivore-induced plant volatile transfer reveal clocked response patterns in neighboring plants
eLife 12:RP89855.
https://doi.org/10.7554/eLife.89855.3


