Assessing drug safety by identifying the axis of arrhythmia in cardiomyocyte electrophysiology
- Victor Chang Cardiac Research Institute, Australia
- School of Clinical Medicine, Faculty of Medicine and Health, University of New South Wales, Australia
- Victor Chang Cardiac Research Institute Innovation Centre, Australia
Figures
Figure 1
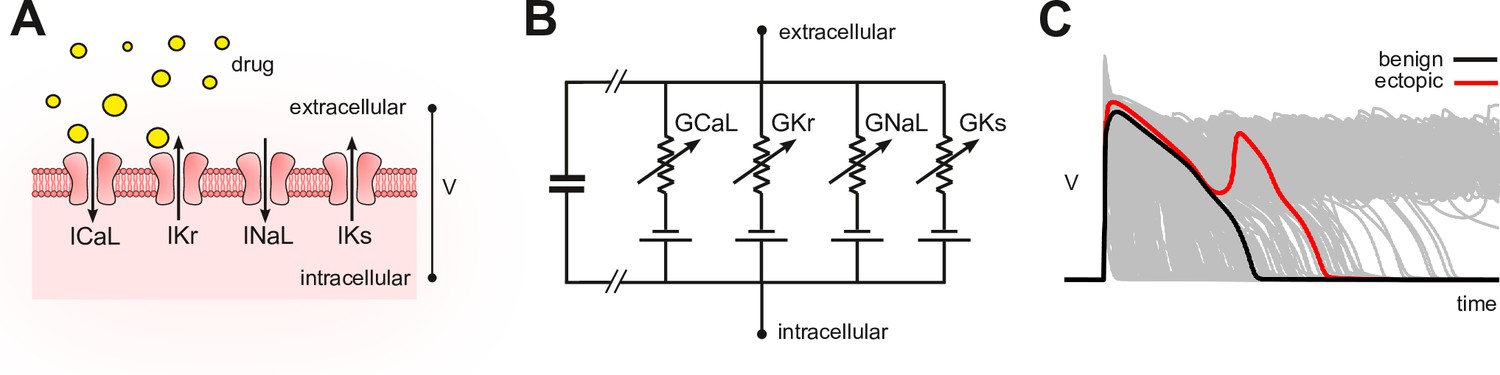
Conceptual framework.
(A) Drugs simultaneously block multiple species of ion channels to differing degrees. The principal ion currents implicated in drug-induced Torsades des Pointes are , and . (B) Simplified circuit diagram of cardiomyocyte electrophysiology. Drug blockade is simulated by attenuating the ionic conductances . Those parameters are also varied randomly to mimic individual differences in electrophysiology. (C) Simulated action potentials of phenotypically diverse cardiomyocytes. Early after-depolarizations (red) are biomarkers for Torsades des Pointes. Conventional in silico assays simulate the effect of drugs on cardiomyocytes on a case-by-case basis. Our method inverts the procedure by simulating cardiomyocytes in the absence of drugs and then inferring how drugs would behave.
Figure 2
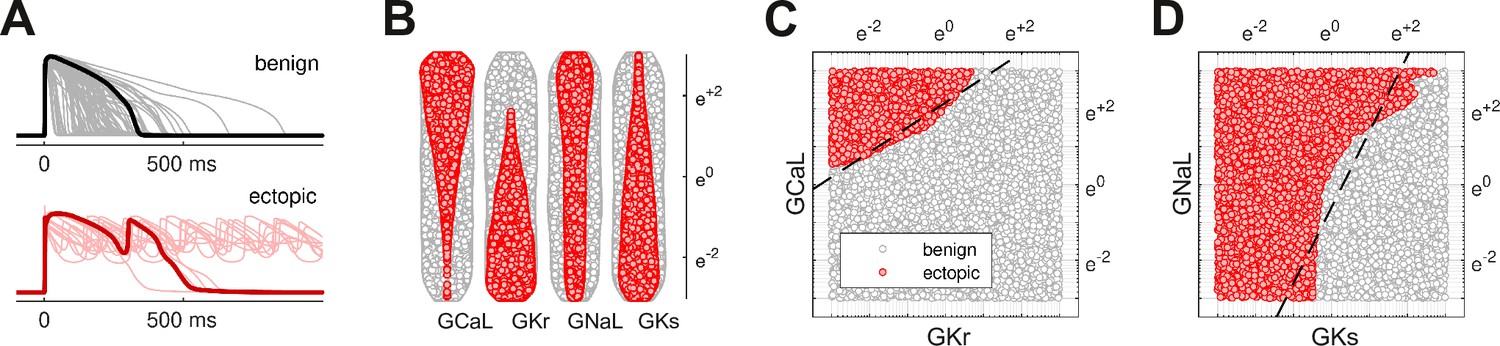
Benign versus ectopic cardiac phenotypes.
(A) Simulated action potentials for cardiomyocytes with randomly scaled conductance parameters , , , and . Myocytes that exhibited early after-depolarizations were classified as ectopic (red). Those that did not were classified as benign (gray). (B) Swarm plots of the conductance scalars on a logarithmic scale. Color indicates the classification of the myocyte (benign versus ectopic). (C) Two-dimensional slice of parameter space showing the relationship between ectopic and benign phenotypes in versus . The dashed line is the statistical decision boundary. and were fixed at unity . (D) Two-dimensional slice showing versus . In this case and .
Figure 3
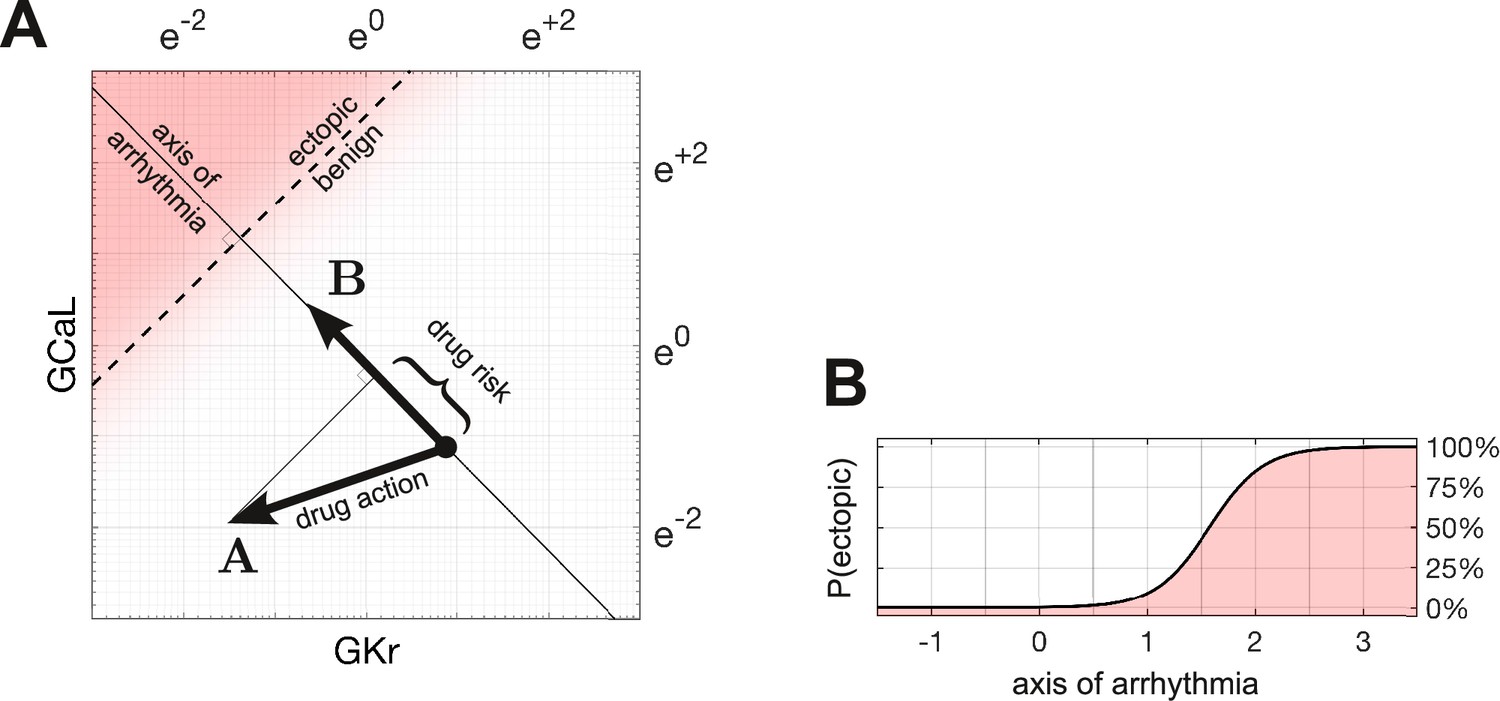
Quantifying drug risk with the axis of arrhythmia.
(A) The axis of arrhythmia runs orthogonally to the decision boundary. As such, it describes the shortest pathway to ectopy for any cardiomyocyte. The basis vector of the axis is labeled . The action of the drug is labeled . The arrhythmogenic component of the drug is obtained by projecting vector onto vector . The length of the projection is our measure of drug risk. (B) The probability of ectopy along the axis of arrhythmia. The origin corresponds to the baseline cardiomyocyte. The distance from the origin corresponds to the risk score. Distance is measured in log units, using the same scale as panel A.
Figure 4 with 1 supplement
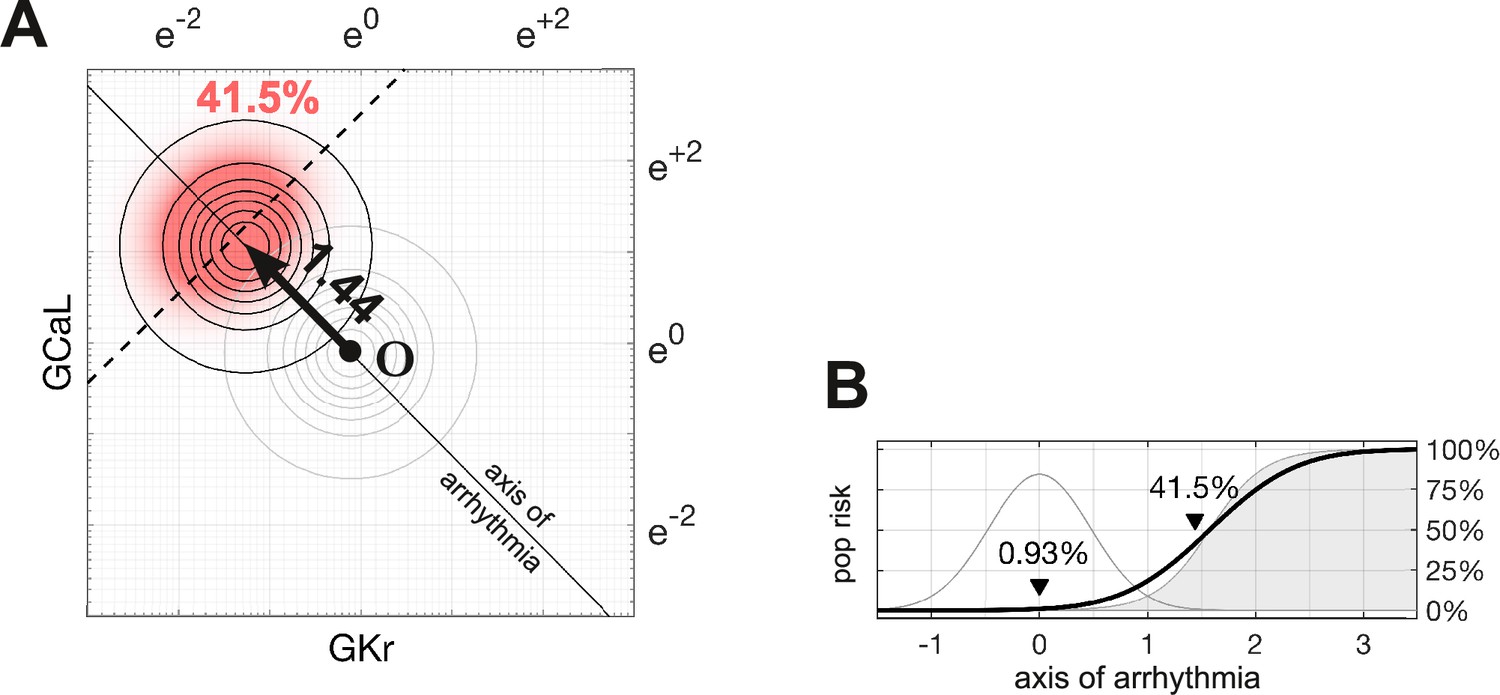
Susceptibility to a drug in the natural population.
(A) Natural variation in ion channel conductivity is represented by a symmetric Gaussian density function centered at point . In this example, a 10-fold dose of Ibutilide shifts the population by 1.44 units toward the ectopic region. The proportion of ectopic myocytes in the drugged population is 41.5% (red). (B) The relationship between the drug risk score and ectopy in the natural population. The drug risk score corresponds to position on the axis of arrhythmia. The shaded region is the a priori probability of ectopy along that axis (reproduced from Figure 3B). The Gaussian profile (thin gray line) is the natural population density centered at zero. The proportion of myocytes that are ectopic (heavy black line) is 0.93% at baseline. That proportion rises as the drug shifts the population density toward the decision boundary.
Figure 4—video 1
An animated version of this figure showing how the population density shifts as the risk score increases.
Figure 5
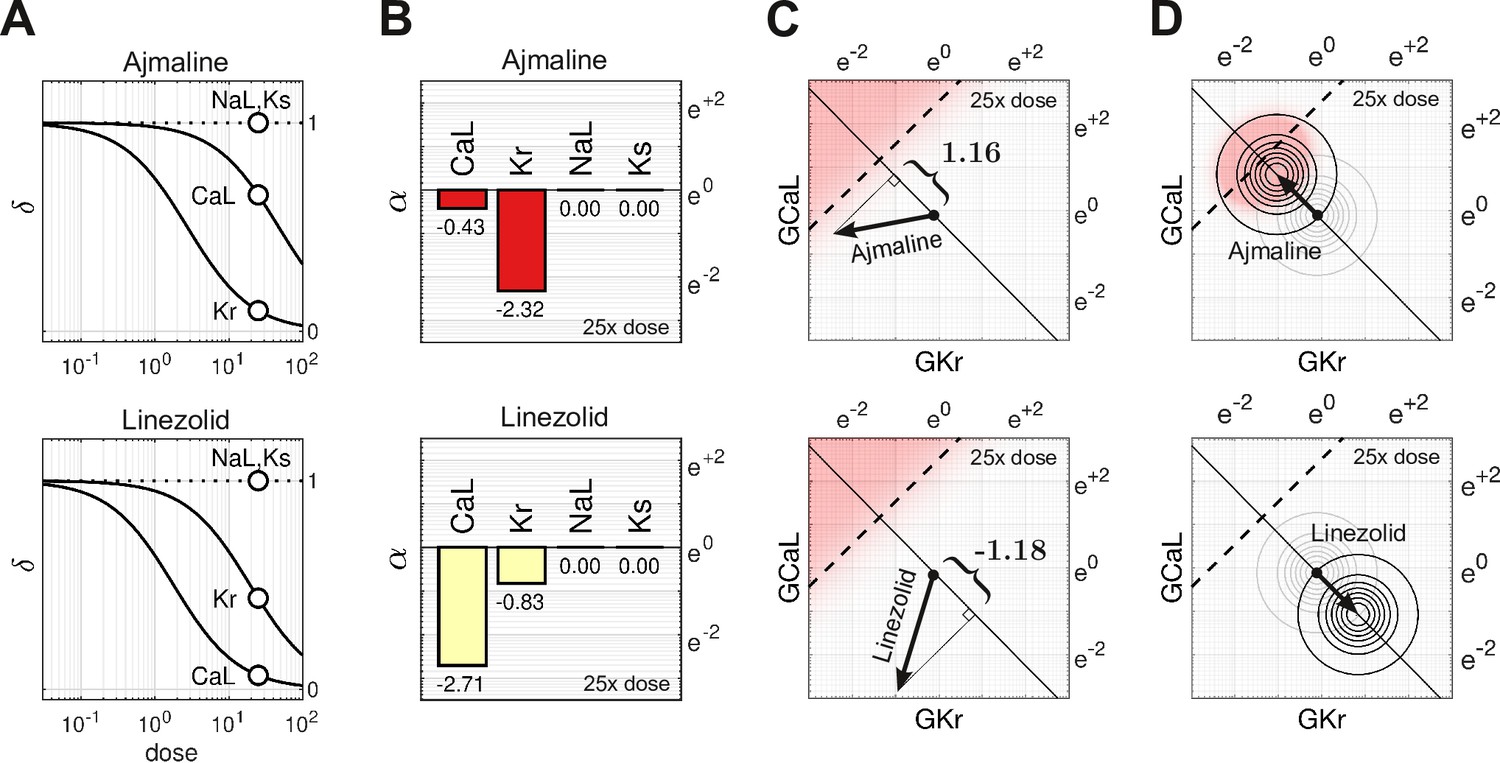
Cases of Ajmaline and Linezolid.
(A) Drug-response profiles of , and relative to the therapeutic dose. Open circles highlight 25× therapeutic dose. For Ajmaline, and at 25× dose. For Linezolid, and at 25× dose. Data for and were not available, so those channels were assumed to be unaffected by the drugs in both cases and (B) The blocking action of Ajmaline and Linezolid at 25× dose. By definition, . (C) The corresponding risk scores for Ajmaline and Linezolid at that dose. (D) The drug-induced shifts of the natural population density along the axis of arrhythmia. The proportion of myocytes that are ectopic with 25× dose of Ajmaline is 26% (red), compared to only 0.0095% for Linezolid.
Figure 6
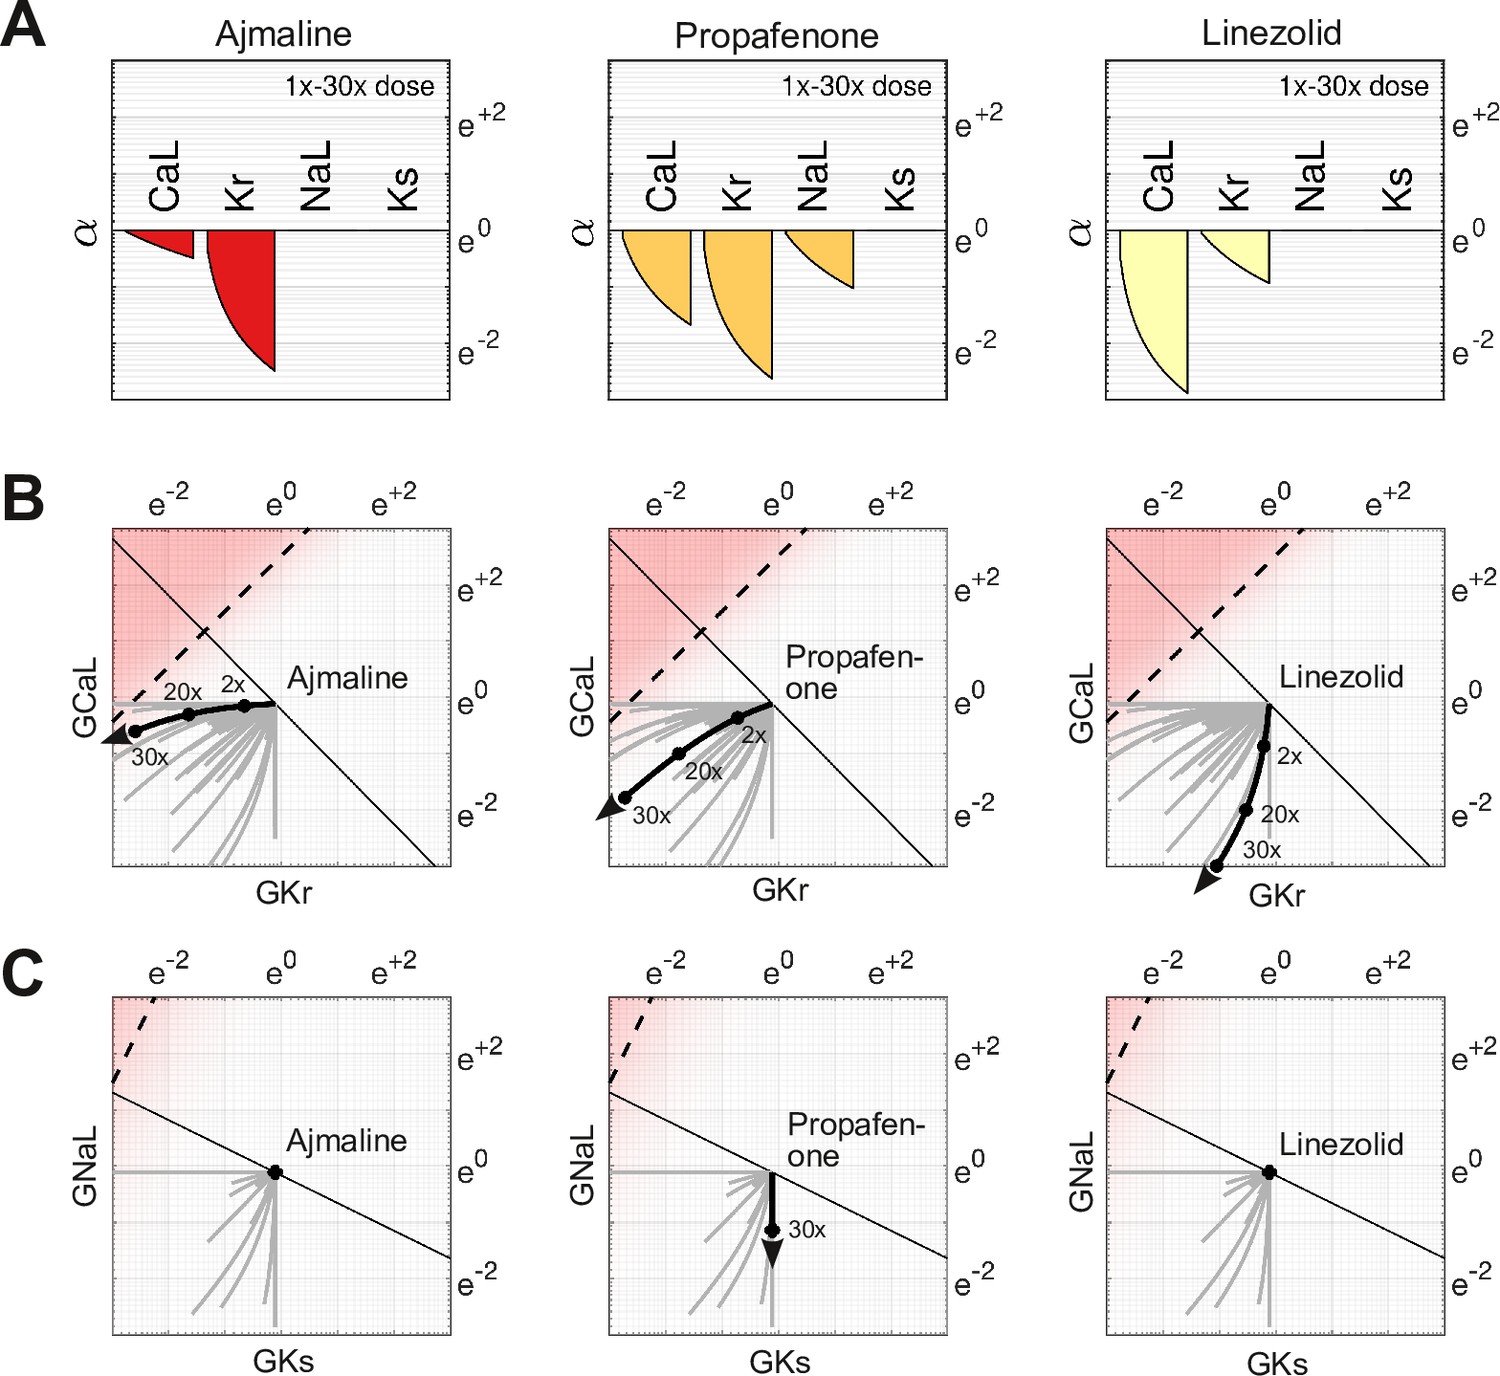
Effect of dose on multi-channel drug-block.
(A) The attenuation of , , , and for 1× to 30× therapeutic doses of Ajmaline, Propafenone, and Linezolid, respectively. The ion channels respond to dosage at differing rates. (B) The dose-dependent action of each drug in the parameter space of and . The paths are curvilinear because of the differing response rates of the ion channels. For comparison, the gray traces are the pathways of all 109 drugs in the dataset. (C) The corresponding pathways in and . Propafenone attenuates but not . Neither Ajmaline nor Linezolid attenuate or , but other drugs do (gray traces).
Figure 7
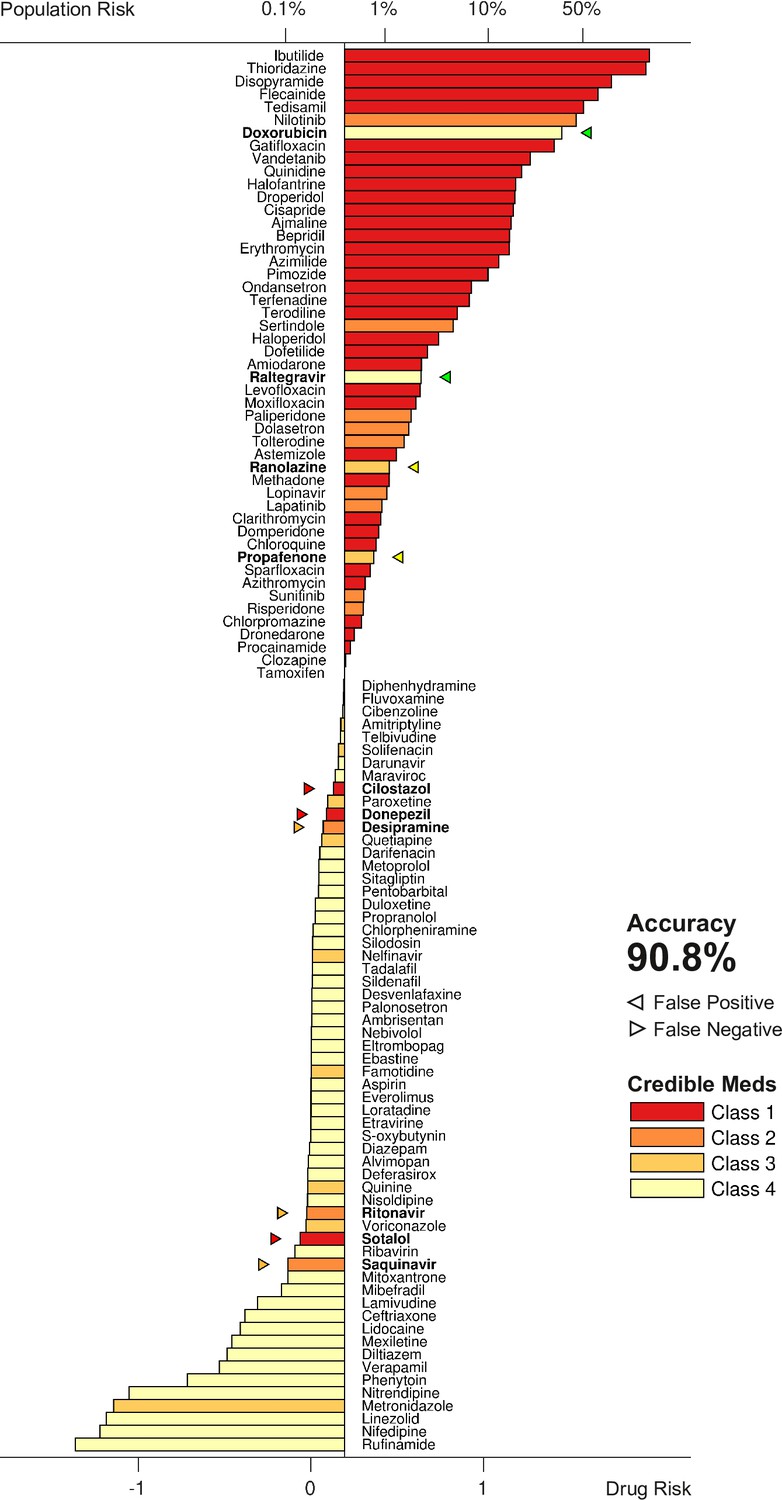
Torsadogenic risk for 109 drugs at 25× dose.
Colors indicate the clinical risk labels from Credible Meds. The drugs are sorted by the score returned by our risk metric (lower axis). The proportion of the natural population that would be susceptible to the drug is shown on the upper axis. Drugs to the right of the scoring threshold were classified as unsafe and those to the left of it were classified as safe. Misclassified drugs are marked with a triangle and highlighted in bold. In this case, 90.8% of the drugs were correctly classified.
Figure 8
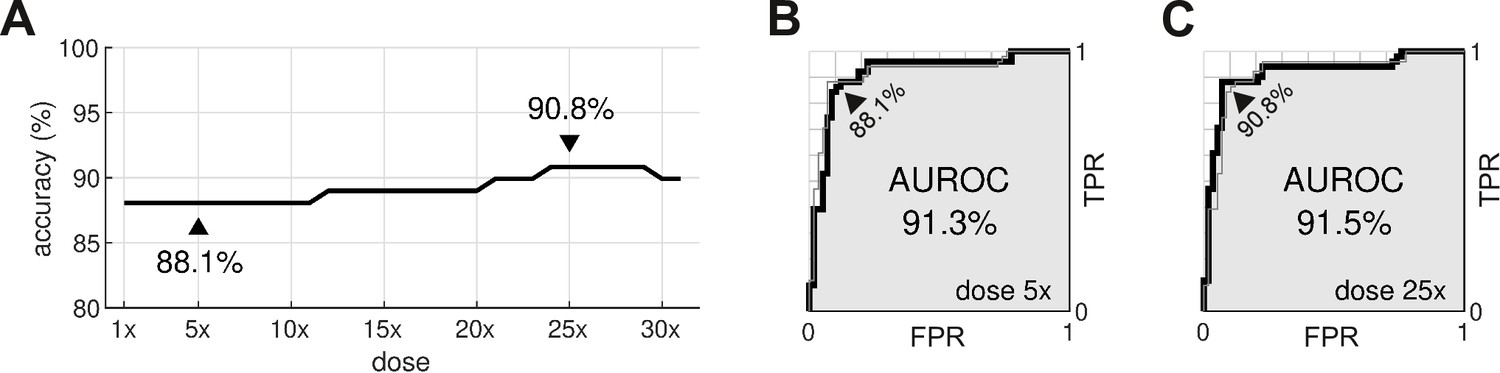
Optimal dosage.
(A) Classification accuracy for drugs assessed at a range of dosages. (B) Receiver operating characteristic (ROC) curve for drugs at 5× dose. (C) ROC curve for drugs at 25× dose. AUROC is area under the ROC curve. TPR is true positive rate. FPR is false positive rate. The false negative rate is 1-TPR.
Author response image 1

Author response image 2

Tables
Table 1
The baseline scaling factors applied to the ORD11 model.
| Maximal conductance | Multiplier |
|---|---|
| 8.09 | |
| 1.17 | |
| () | 3.57 |
| 3.05 | |
| 1.91 | |
| 1.7 |
Table 2
The drug-response dataset.
| Variable name | Description |
|---|---|
| DrugID | Unique identifier for each compound in the dataset |
| Compound | Name of the compound |
| Class | Clinical risk label where 1=known risk, 2=possible risk, 3=conditional risk, 4=no evidence of risk |
| EFTPC | Effective free therapeutic plasma concentration (nM) |
| Cmax | Concentration relative to therapeutic dose |
| Conc | Concentration of the dose (nM) |
| GKrScale | for the given dose (Equation 7) |
| GNaScale | for the given dose (Equation 7) |
| GNaLScale | for the given dose (Equation 7) |
| GCaLScale | for the given dose (Equation 7) |
| GKsScale | for the given dose (Equation 7) |
| GK1Scale | for the given dose (Equation 7) |
| GtoScale | for the given dose (Equation 7) |
| LogGKrScale | |
| LogGNaLScale | |
| LogGCaLScale | |
| LogGKsScale | |
| LogGK1Scale | |
| LogGtoScale | |
| Score | Risk score (Equation 3) |
-
Table 2—source data 1
The data in CSV format.
- https://cdn.elifesciences.org/articles/90027/elife-90027-table2-data1-v1.csv
-
Table 2—source data 2
Dose-response plots for each drug in the dataset.
- https://cdn.elifesciences.org/articles/90027/elife-90027-table2-data2-v1.pdf
Additional files
Download links
A two-part list of links to download the article, or parts of the article, in various formats.
Downloads (link to download the article as PDF)
Open citations (links to open the citations from this article in various online reference manager services)
Cite this article (links to download the citations from this article in formats compatible with various reference manager tools)
Assessing drug safety by identifying the axis of arrhythmia in cardiomyocyte electrophysiology
eLife 12:RP90027.
https://doi.org/10.7554/eLife.90027.3


