ChatGPT identifies gender disparities in scientific peer review
- Department of Molecular and Cell Biology and Helen Wills Neuroscience Institute, University of California, Berkeley, United States
Figures
Figure 1

Characteristics of the 200 papers included in this analysis.
(a) Paper metrics. (b) Author metrics. More information on how these metrics were collected and defined can be found in the ‘Methods’ section.
Figure 2 with 4 supplements
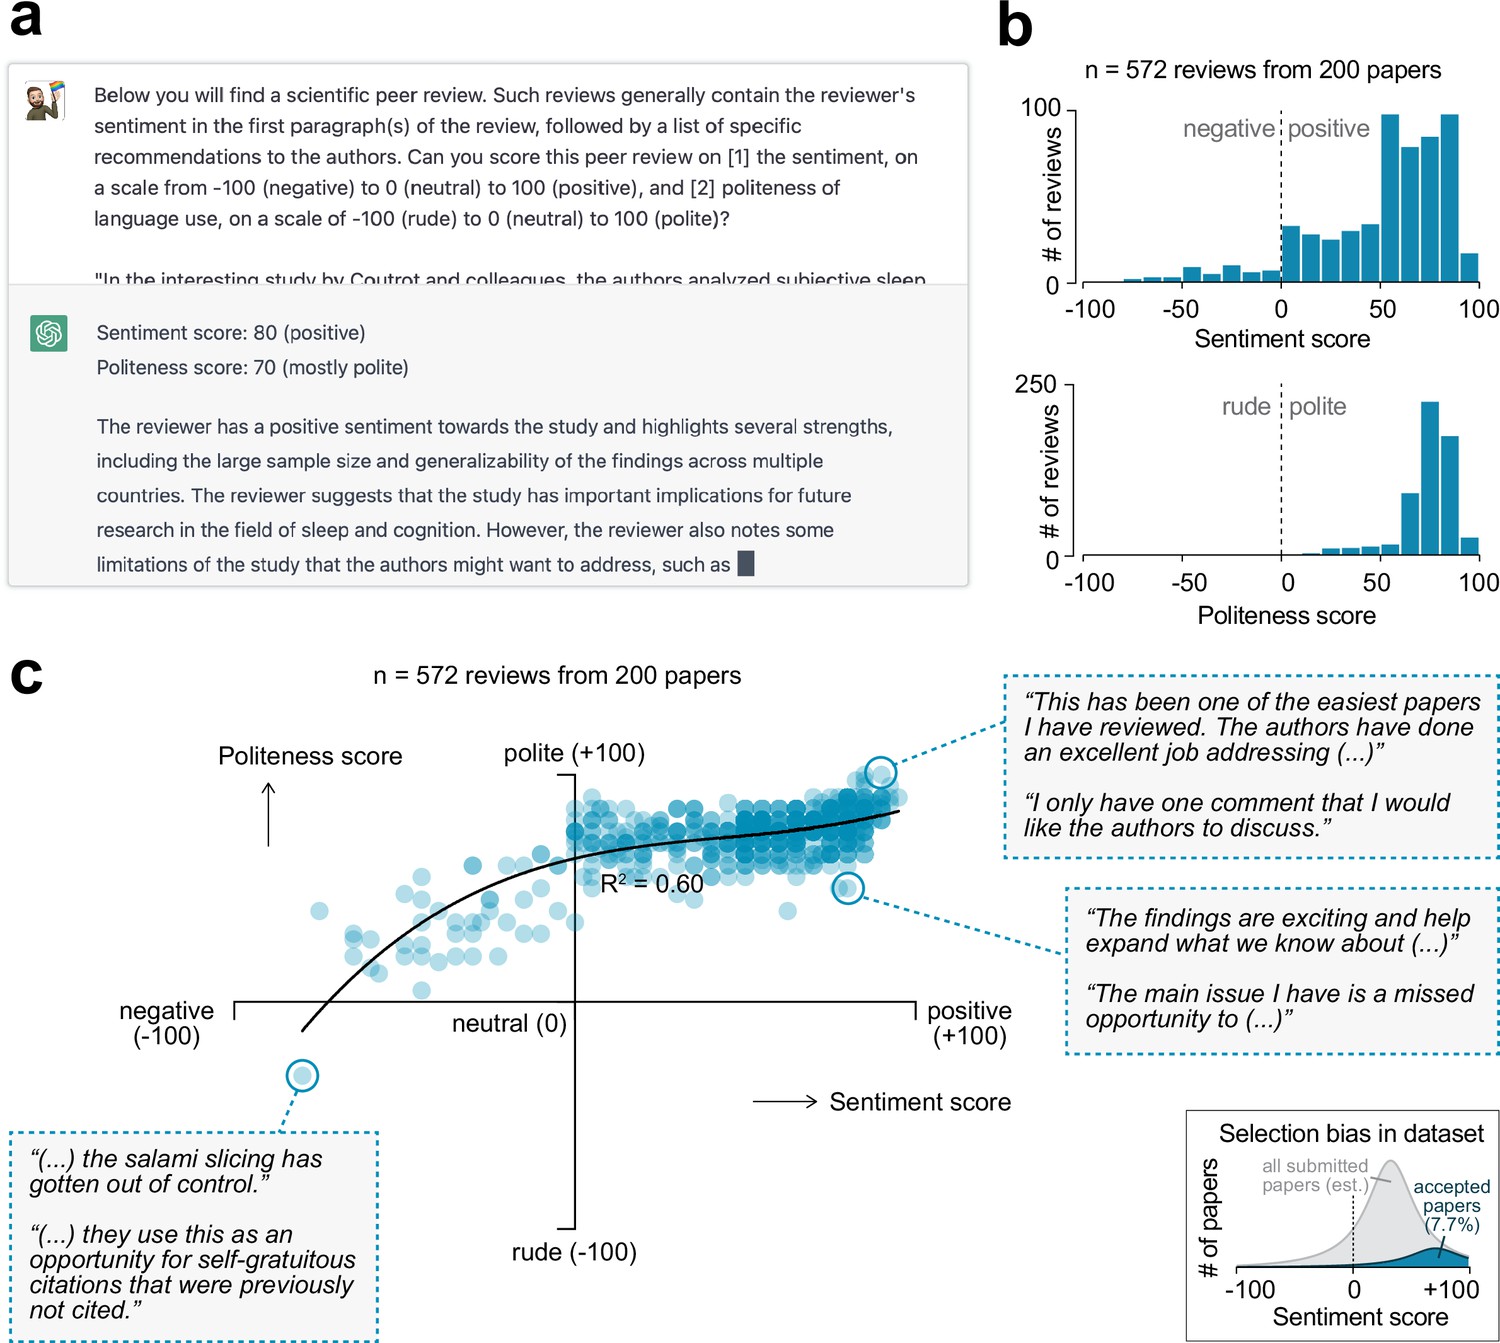
Sentiment analysis on peer review reports using generative artificial intelligence.
(a) OpenAI’s generative artificial intelligence model ChatGPT was used to extract a sentiment and politeness score for each of the 572 first-round reviews. Shown is an example query and ChatGPT’s answer. (b) Histograms showing the distribution in sentiment (top) and politeness (bottom) scores for all reviews. (c) Scatter plot showing the relation between sentiment and politeness scores for the reviews (60% variance explained in third-degree polynomial). Insets show excerpts from selected peer reviews. Inset in the bottom-right corner is a visual depiction of the expected selection bias in this dataset, as only papers accepted for publication were included in this analysis (gray area represents full pool of published and unpublished papers; not to scale).
Figure 2—figure supplement 1
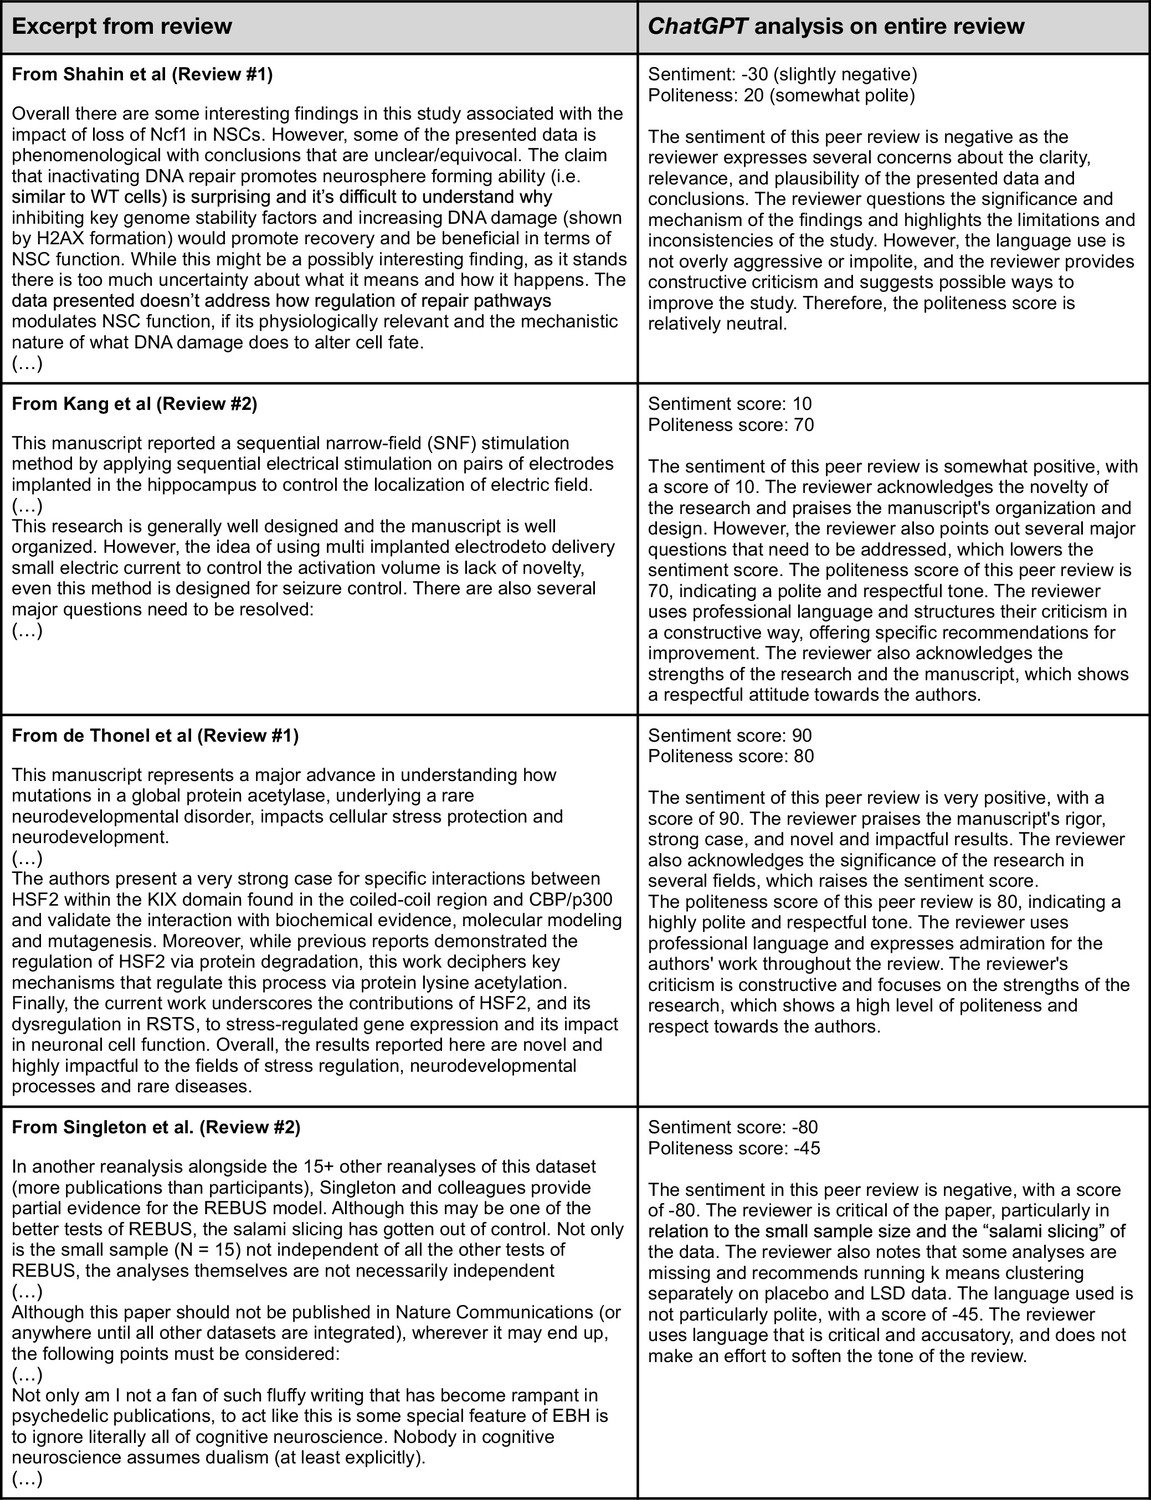
Validation #1: examples of ChatGPT inputs and outputs.
Figure 2—figure supplement 2
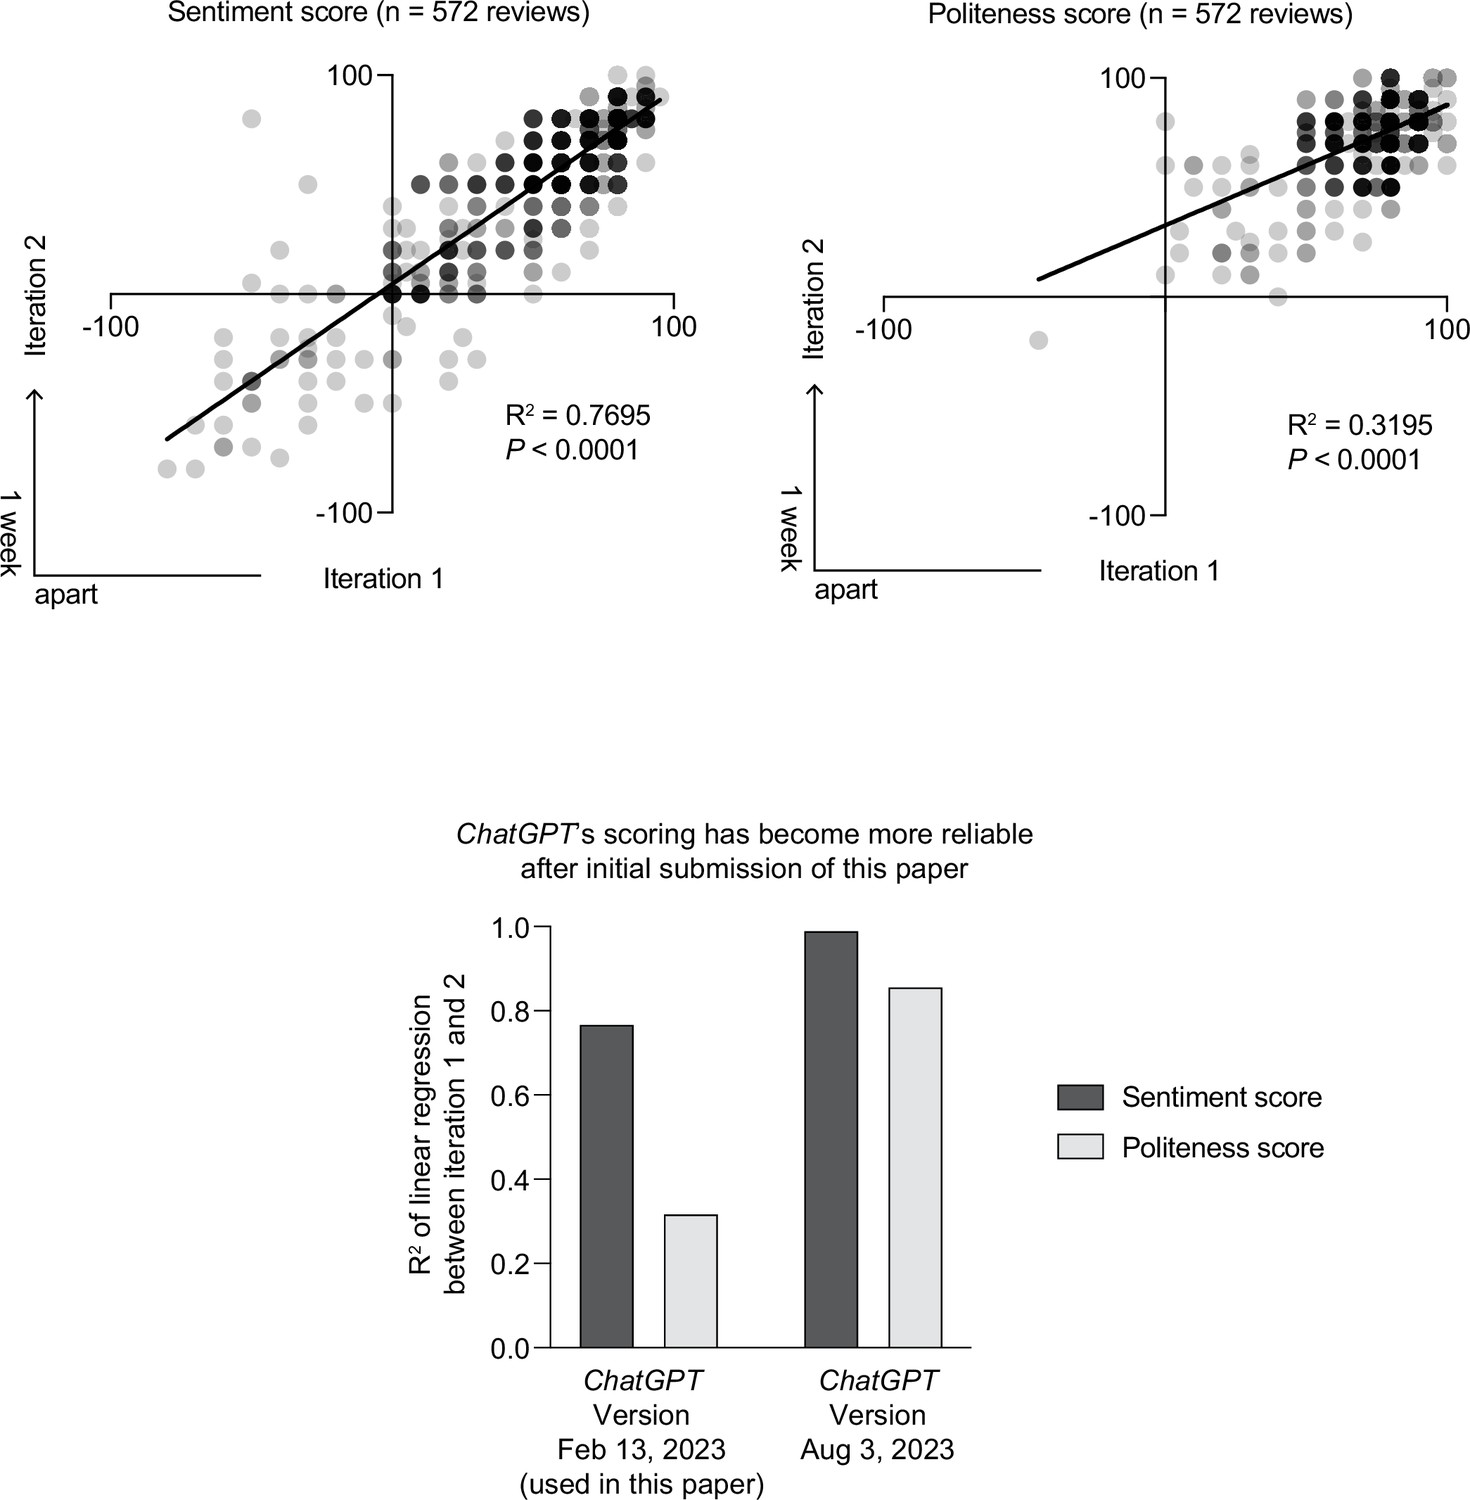
Validation #2: consistency in sentiment and politeness scores for two different times ChatGPT was asked to analyze review reports.
(Top panels) A significant correlation was found between both times ChatGPT was asked to score the sentiment and politeness of the peer reviews. The average score of both iterations was used for all subsequent analyses in this paper. (Bottom panel) The relatively low R2 values between both iterations shown in the top panels have greatly improved in versions of ChatGPT since the initial submission of this paper; R2 values have now increased to 0.992 (for sentiment) and 0.859 (politeness).
Figure 2—figure supplement 3
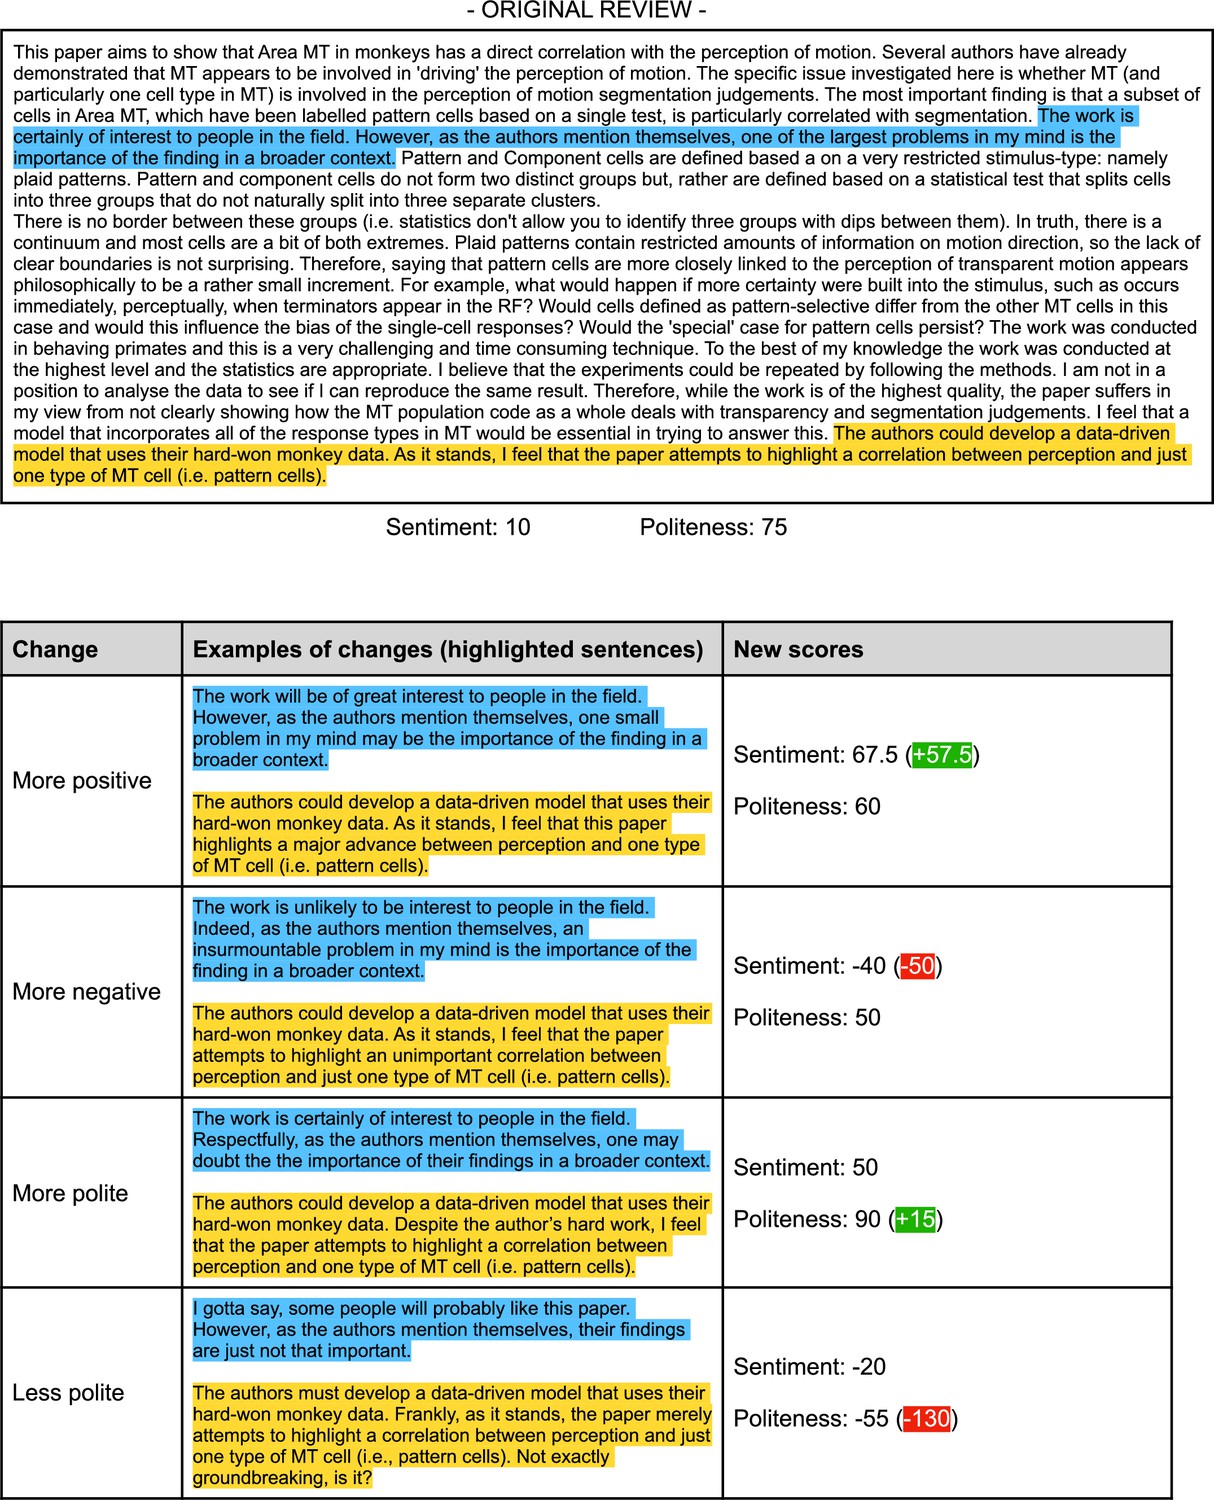
Validation #3: example of a manually manipulated review, showing that ChatGPT can pick up artificial changes in sentiment and language use.
It should be noted here that changes in sentiment usually also affected the politeness score (and vice versa), indicating that these scores are not fully independent. This may intuitively make sense; less polite language is often interpreted as more negative, also by human readers (see Figure 2—figure supplement 4).
Figure 2—figure supplement 4
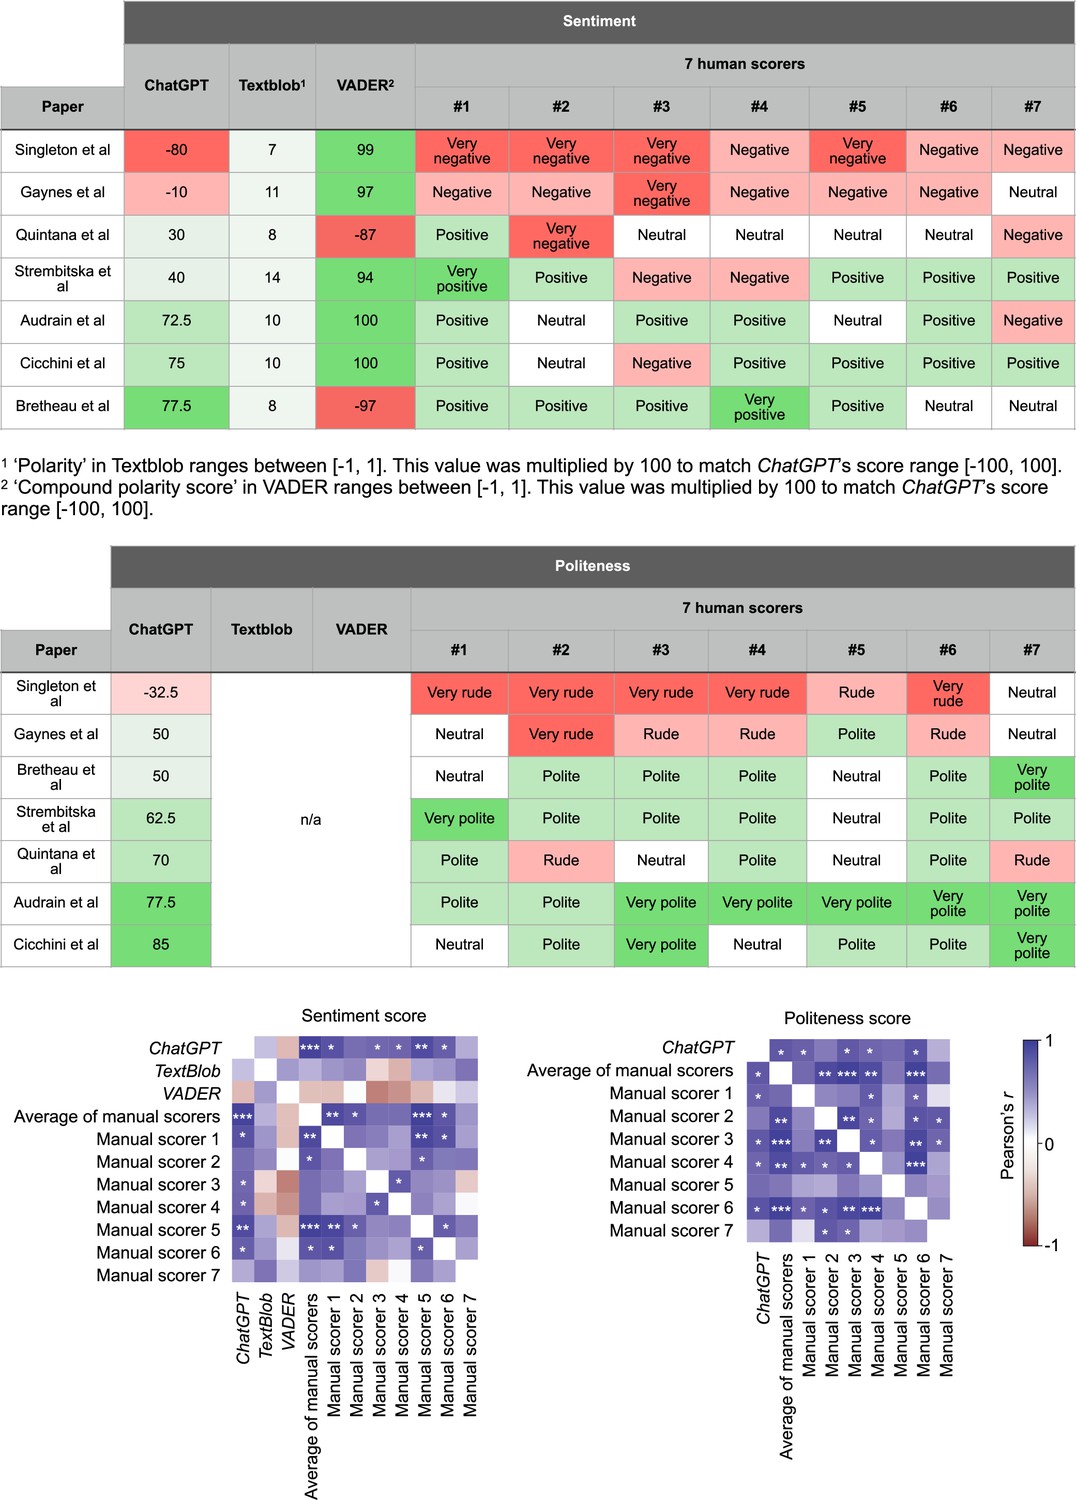
Validation #4: comparison of ChatGPT’s scores of sentiment and politeness as compared to seven (blinded) human scorers for a diverse sample of reviews.
Figure showing high levels of variability across human scorers, but their average score had a high correlation with ChatGPT’s score. For this experiment, human scorers were asked to score the sentiment of seven reviews on a scale from very negative – negative – neutral – positive – very positive. Politeness was scored on a scale from very rude – rude – neutral – polite – very polite. For the cross-correlograms in the bottom panels, human scores were first converted to numbers on a scale from 1 to 5, so that these could be correlated to ChatGPT’s numerical scores. Scorers 1, 2, and 5 were scientists with a PhD; scorer 3, 4, and 6 were neuroscience graduate students; scorer 7 was a non-scientist. Please note that TextBlob and VADER do not provide politeness scores, and were thus not included in the second table. Asterisks indicate significance in a linear regression; *p<0.05, **p<0.01, ***p<0.001.
Figure 3

Consistency across reviews.
(a) Sentiment (left) and politeness (right) scores for each of the three reviewers. The lower sample size for reviewer 3 is because 42 papers received only two reviews. No significant effects were observed of reviewer number on sentiment (mixed effects model, F(1.929, 343.3) = 1.564, p=0.2116) and politeness scores (mixed effects model, F(1.862, 331.4) = 1.638, p=0.1977). (b) Correlations showing low consistency of sentiment scores across reviews for the same paper. The sentiment scores between reviewers 1 and 3 (middle panel) is the only comparison that reached statistical significance (p=0.0032), albeit with a low amount of variance explained (5.5%). The intra-class correlation coefficient (ICC) measures how similar the review scores are for one paper, without the need to split review up into pairs. An ICC < 0.5 generally indicates poor reliability (i.e., repeatability) (Liljequist et al., 2019). (c) Linear regression indicating the relation between a paper’s sentiment scores and the time between paper submission and acceptance. For this analysis, reviews were first split into a paper’s lowest, median (only for papers with an odd number of reviews) and highest sentiment score. The lowest and median sentiment score of a paper significantly predicted a paper’s acceptance time, but its highest sentiment score did not. Note that the relation between politeness scores and acceptance time was not individually tested given the high correlation between sentiment and politeness, thus having a high chance of finding spurious correlations. The metric ‘% variance in paper acceptance time explained’ denotes the R2 value of the linear regression.
Figure 4 with 2 supplements
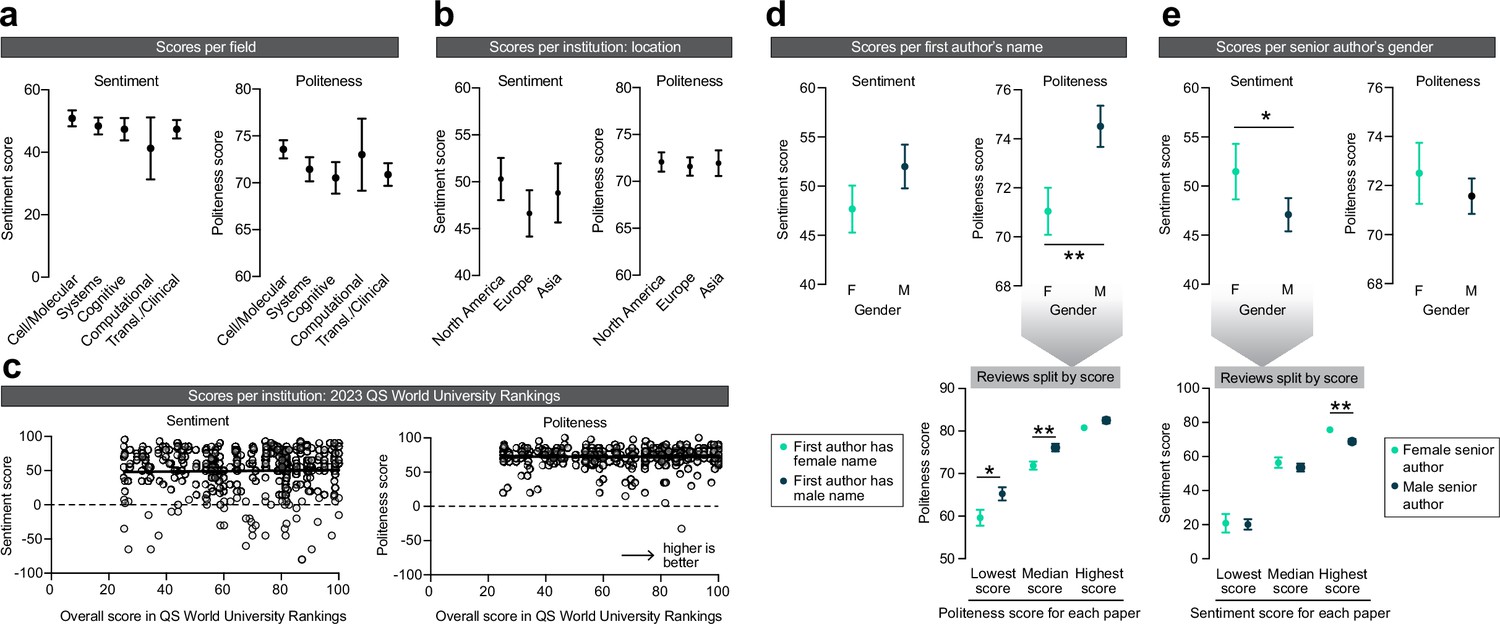
Exploring disparities in peer review.
(a) Effects of the subfield of neuroscience on sentiment (left) and politeness (right) scores. No effects were observed on sentiment (Kruskal–Wallis ANOVA, H = 2.380, p=0.6663) or politeness (Kruskal–Wallis ANOVA, H = 8.211, p=0.0842). n = 178, 149, 100, 20, 125 reviews per subfield. (b) Effects of geographical location of the senior author on sentiment (left) and politeness (right) scores. No effects were observed on sentiment (Kruskal–Wallis ANOVA, H = 1.856, p=0.3953) or politeness (Kruskal–Wallis ANOVA, H = 0.5890, p=0.7449). n=239, 208, 103 reviews per continent. (c) Effects of QS World Ranking score of the senior author’s institutional affiliation on sentiment (left) and politeness (right) scores. No effects were observed on sentiment (linear regression, R2 = 0.0006, p=0.6351) or politeness (linear regression, R2 < 0.0001, p=0.9804). n = 430 reviews. (d) Effects of the first author’s name on sentiment (left) and politeness (right) scores. No effects were observed on sentiment (Mann–Whitney test, U = 19,521, p=0.2131) but first authors with a female name received significantly less polite reviews (Mann–Whitney test, U = 17,862, p=0.0080, Hodges–Lehmann difference of 2.5). Post hoc tests on the data split per lowest/median/highest politeness score indicated significantly lower politeness scores for females for the lowest (Mann–Whitney test, U = 1987, p=0.0103, Hodges–Lehmann difference of 5) and median (Mann–Whitney test, U = 1983, p=0.0093, Hodges–Lehmann difference of 2.5) scores, but not of the highest score (Mann–Whitney test, U = 2279, p=0.1607). n = 206 (F), 204 (M) reviews for top panels; n = 71 (F), 74 (M) papers for lower panel (but n = 54 [F], 53 [M] papers for median scores, because not all papers received three reviews). (e) Effects of the senior author’s gender on sentiment (left) and politeness (right) scores. Women received more favorable reviews than men (Mann–Whitney test, U = 28,007, p=0.0481, Hodges–Lehmann difference of 5) but no effects were observed on politeness (Mann–Whitney test, U = 29,722, p=0.3265). Post hoc tests on the data split per lowest/median/highest sentiment score indicated no effect of gender on the lowest (Mann–Whitney test, U = 3698, p=0.7963) and median (Mann–Whitney test, U = 3310, p=0.1739) sentiment scores, but the highest sentiment score was higher for women (Mann–Whitney test, U = 2852, p=0.0072, Hodges–Lehmann difference of 5). n = 155 (F), 405 (M) reviews for top panels; n = 53 (F), 143 (M) papers for lower panel (but n = 39 [F], 102 [M] papers for median scores, because not all papers received three reviews). Asterisks indicate statistical significance in Mann–Whitney tests; *p<0.05, **p<0.01.
Figure 4—figure supplement 1
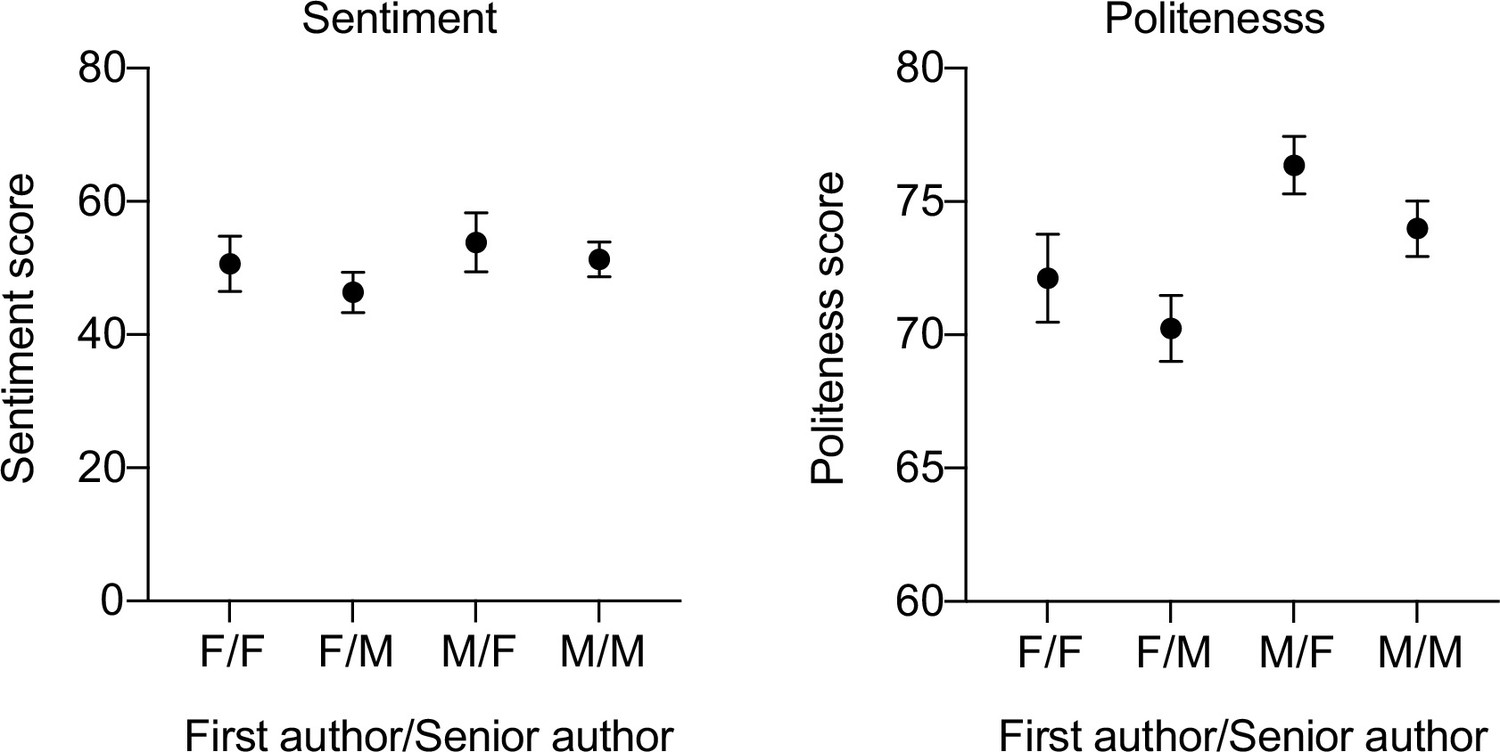
Sentiment and politeness scores for papers in different gender groups.
As an example, ‘F/M’ indicates that the first author had a female name and that the senior author was male. Two-way ANOVAs on these data indicated no significant first × last author gender interaction effects for both sentiment (F(1,397) = 0.05291, p=0.8182) and politeness (F(1,397) = 0.02808, p=0.8670). n = 73 reviews for F/F, 126 for F/M, 44 for M/F, 158 for M/M.
Figure 4—figure supplement 2

Experiments that journals can perform to rule out gender bias in reviewing and editorial decision making.
If these experiments show no evidence of bias, gender differences likely emerge higher up in the academic pipeline.
Additional files
-
MDAR checklist
- https://cdn.elifesciences.org/articles/90230/elife-90230-mdarchecklist1-v1.pdf
-
Source data 1
Peer review reports included in this paper.
- https://cdn.elifesciences.org/articles/90230/elife-90230-data1-v1.xlsx
Download links
A two-part list of links to download the article, or parts of the article, in various formats.
Downloads (link to download the article as PDF)
Open citations (links to open the citations from this article in various online reference manager services)
Cite this article (links to download the citations from this article in formats compatible with various reference manager tools)
ChatGPT identifies gender disparities in scientific peer review
eLife 12:RP90230.
https://doi.org/10.7554/eLife.90230.3


