Phosphorylation, disorder, and phase separation govern the behavior of Frequency in the fungal circadian clock
- Department of Chemistry & Chemical Biology, Cornell University, United States
- Department of Biochemistry and Molecular Biology, SUNY Upstate Medical University, United States
- Department of Molecular and Systems Biology, Geisel School of Medicine at Dartmouth, United States
Figures
Figure 1 with 2 supplements
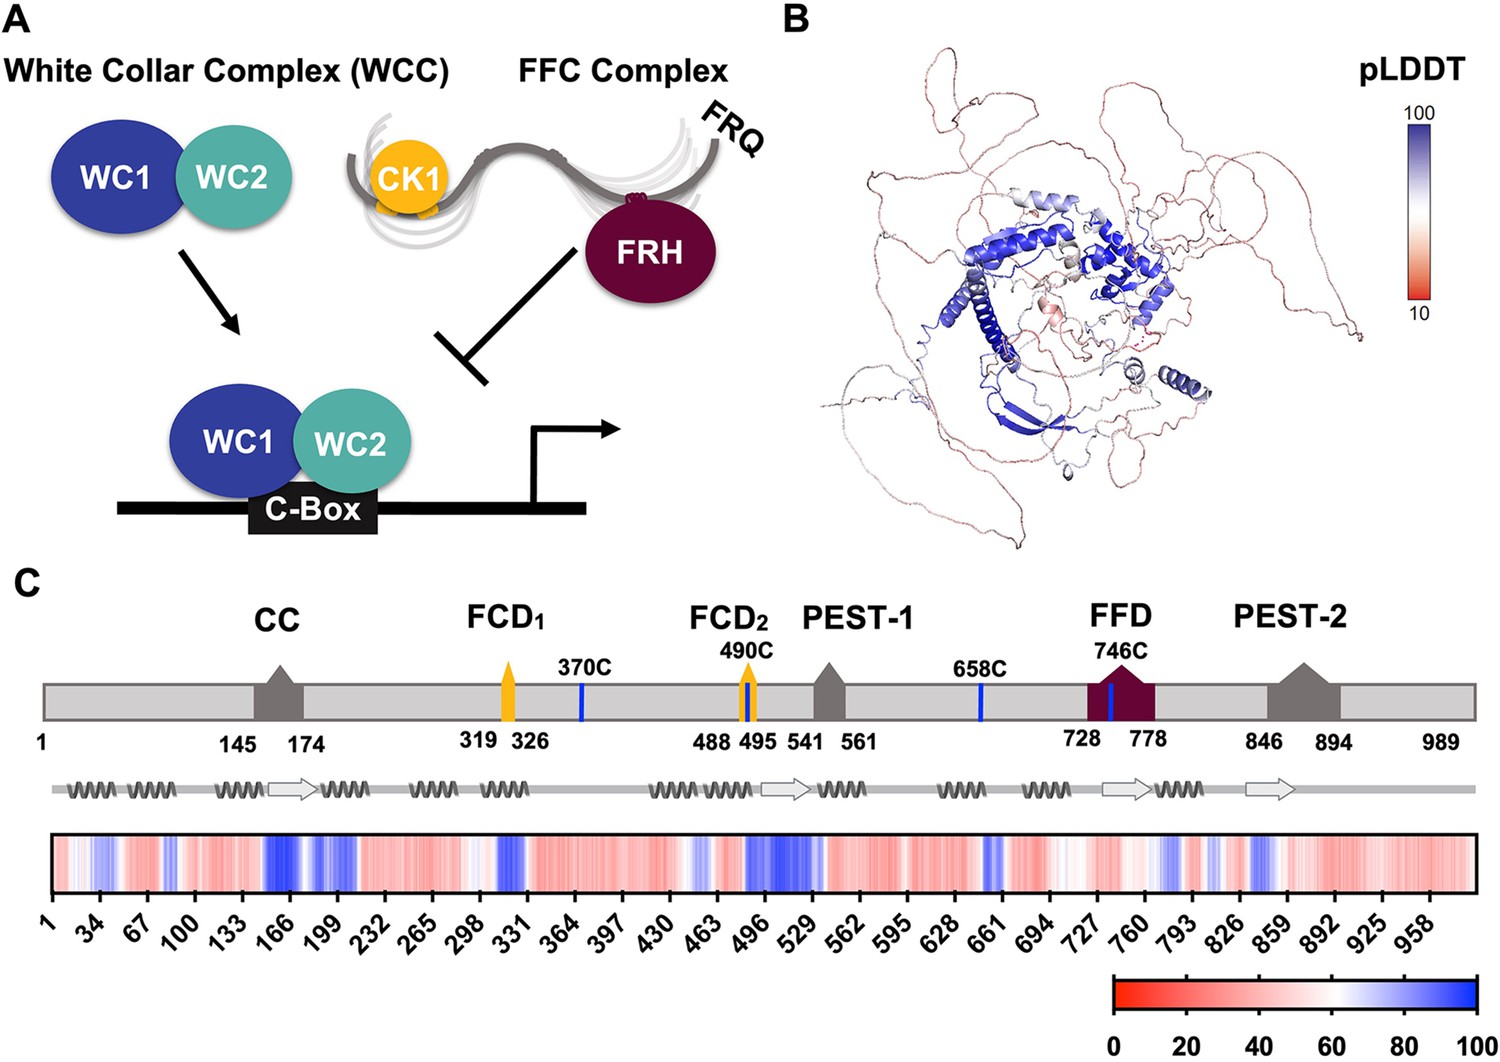
FRQ is a large, dynamic component of the clock oscillator.
(A) LLPS propensity predictions using Pi-Pi and IUPred2A disorder predictions are shown for homologs of FRQ (n=47) (purple), dPER (n=36) (teal), and hPER1 (n=57) (orange) compared to values for proteins of similar length from their respective proteomes (Prot): Nc, Neurospora crassa (n=46); Dc, Drosophila melanogaster (n=121); Hc, Homo sapiens (n=626). This complex inhibits the positive-acting transcription factor known as the white-collar complex (WCC), composed of white collar-1 (WC-1) and white collar-2 (WC-2). The WCC activates frq expression by binding to the c-box region in the frq promoter. Stoichiometries of the components are not represented in the schematic. (B) AlphaFold-derived model of LFRQ color coded by pLDDT score that highlights the confidence in each predicted region (blue being the highest confidence, red the lowest). (C) Functional domains of FRQ showing the start position for the LFRQ isoform (AUGLFRQ.), key regions and the four native cysteine residues. Predicted secondary structure elements are given below as helices (zigzags) and β-strands (arrows). Color bar shows pLDDT scores across the sequence. Characterized domains include: CC, coiled coil domain; FCD, FRQ:CK1 interacting domain; PEST, proline, glutamic acid, serine, and threonine-rich domain; and FFD, FRQ:FRH interacting domain.
Figure 1—figure supplement 1
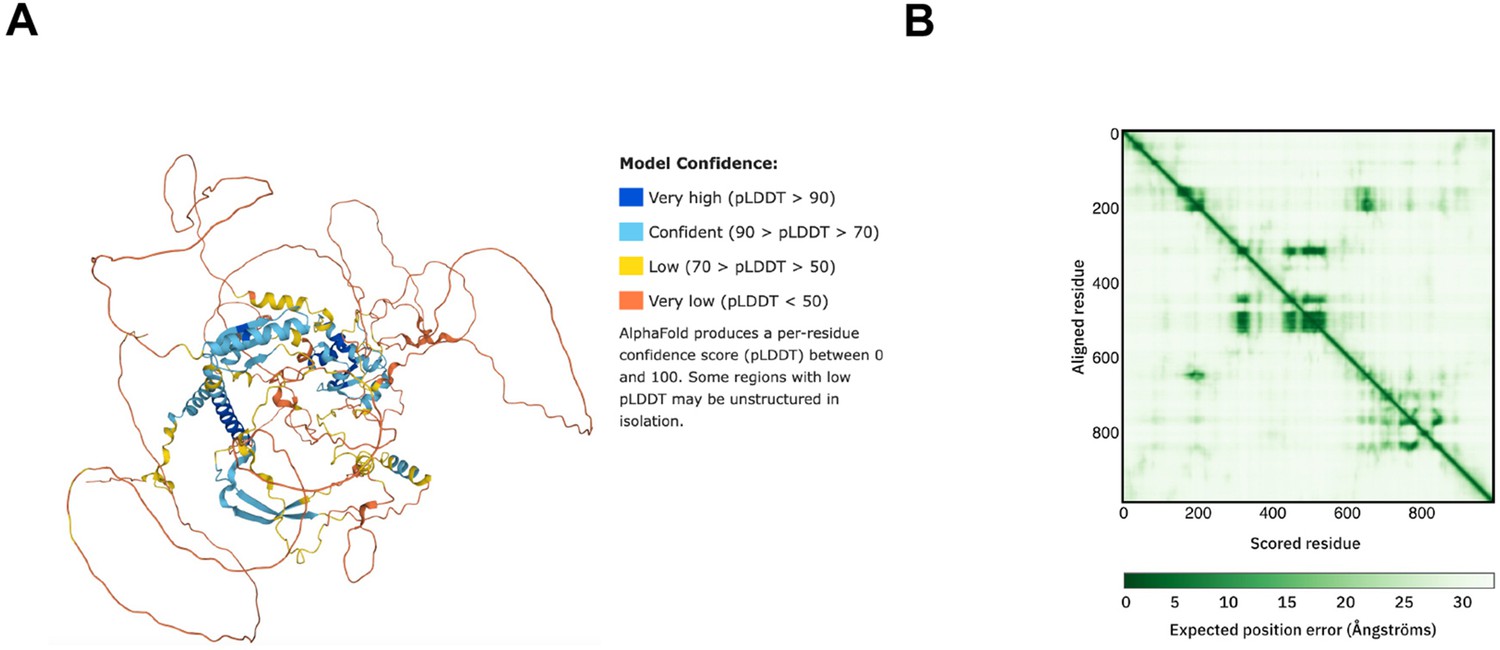
Structure prediction of FRQ.
(A) AlphaFold model of LFRQ colored by pLDDT score. (B) Predicted error alignment plot that shows the uncertainty in the relative positions of two residues in the structure. Image source: https://www.uniprot.org/uniprotkb/P19970/entry#structure.
Figure 1—figure supplement 2
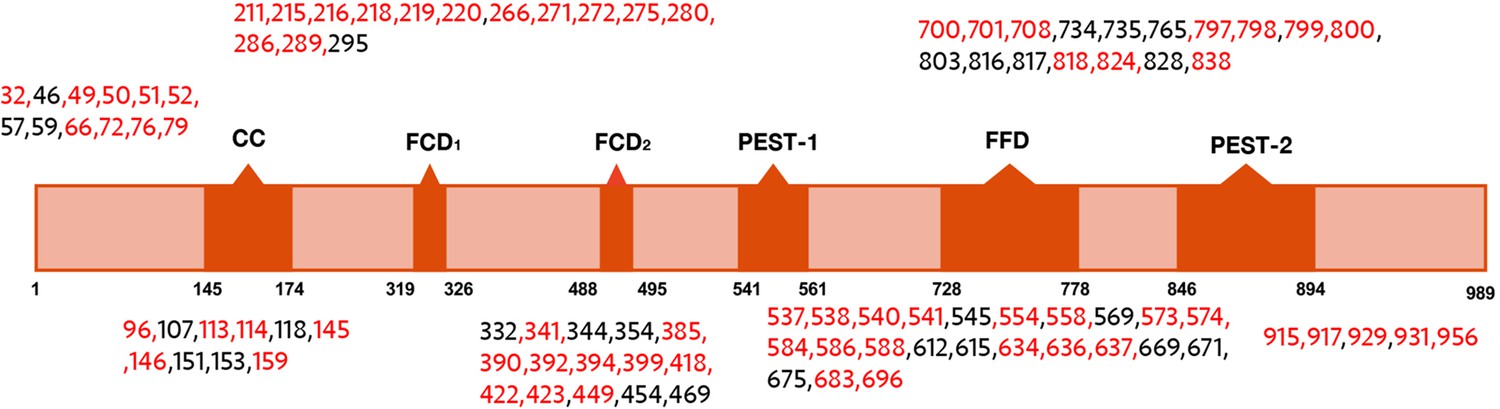
Domain map of FRQ with phosphosites (as identified by mass-spec) highlighted.
The sites in red were also identified in Baker et al., 2009; Tang et al., 2009.
Figure 2 with 1 supplement
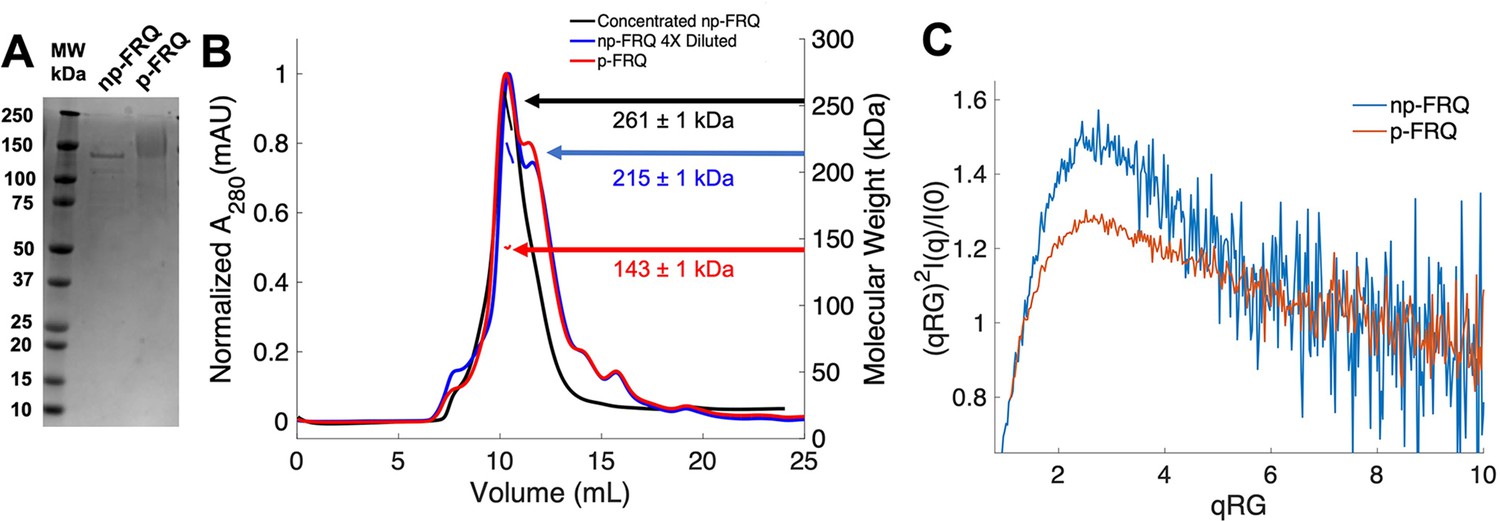
Purification of FRQ in non-phosphorylated and phosphorylated forms reveals intrinsically disordered protein (IDP) behavior.
(A) SDS-PAGE gel showing non-phosphorylated FRQ (np-FRQ) and phosphorylated FRQ (p-FRQ) alongside a molecular weight ladder. Both samples represent the purified full-length long isoform (L-FRQ, residues 1–989) in non-denaturing buffer. (B) Size-exclusion chromatography coupled to multiangle light scattering (SEC-MALS) of phosphorylated FRQ (p-FRQ) and non-phosphorylated (np-FRQ). The molecular weight (MW) of p-FRQ (~143 ± 1 kDa) is somewhat larger than that of an unphosphorylated monomer (~120 kDa), but substantially smaller than that of a dimer, whereas the high-concentration MW value of np-FRQ (~261 ± 1 kDa) is slightly larger than that expected for a dimer (~240 kDa). Note that the p-FRQ MW is affected by >80 phosphosites. The shoulder to the right of the main peak had low light scattering and a large MW error. The colored arrows show the MW of each sample as determined by the MALS traces, which are inlaid within the SEC peaks. (C) Dimensionless Kratky plot of SEC-coupled small-angle X-ray scattering (SAXS) data for p-FRQ and np-FRQ; in both cases, the peak positions of the curves are shifted from that expected for a globular protein (√3,1.104), but neither plateau at 2, which would be characteristic of a flexible, denatured polypeptide (Durand et al., 2010). See Table 1 for additional SAXS parameters. Total protein concentration was between 50 and 75 μM for the MALS and SAXS experiments.
Figure 2—figure supplement 1
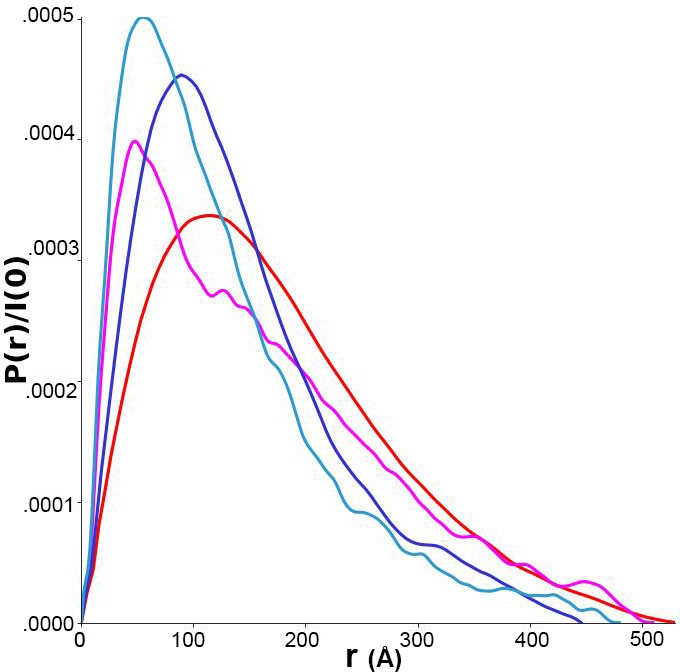
Pairwise distance distributions calculated from size-exclusion chromatography-coupled small-angle x-ray scattering (SAXS) data for p-FRQ (red), np-FRQ (dark blue), p-FFC (magenta), and np-FFC (light blue).
Figure 3 with 2 supplements
Electron spin resonance (ESR) spectroscopy studies of spin-labeled FRQ.
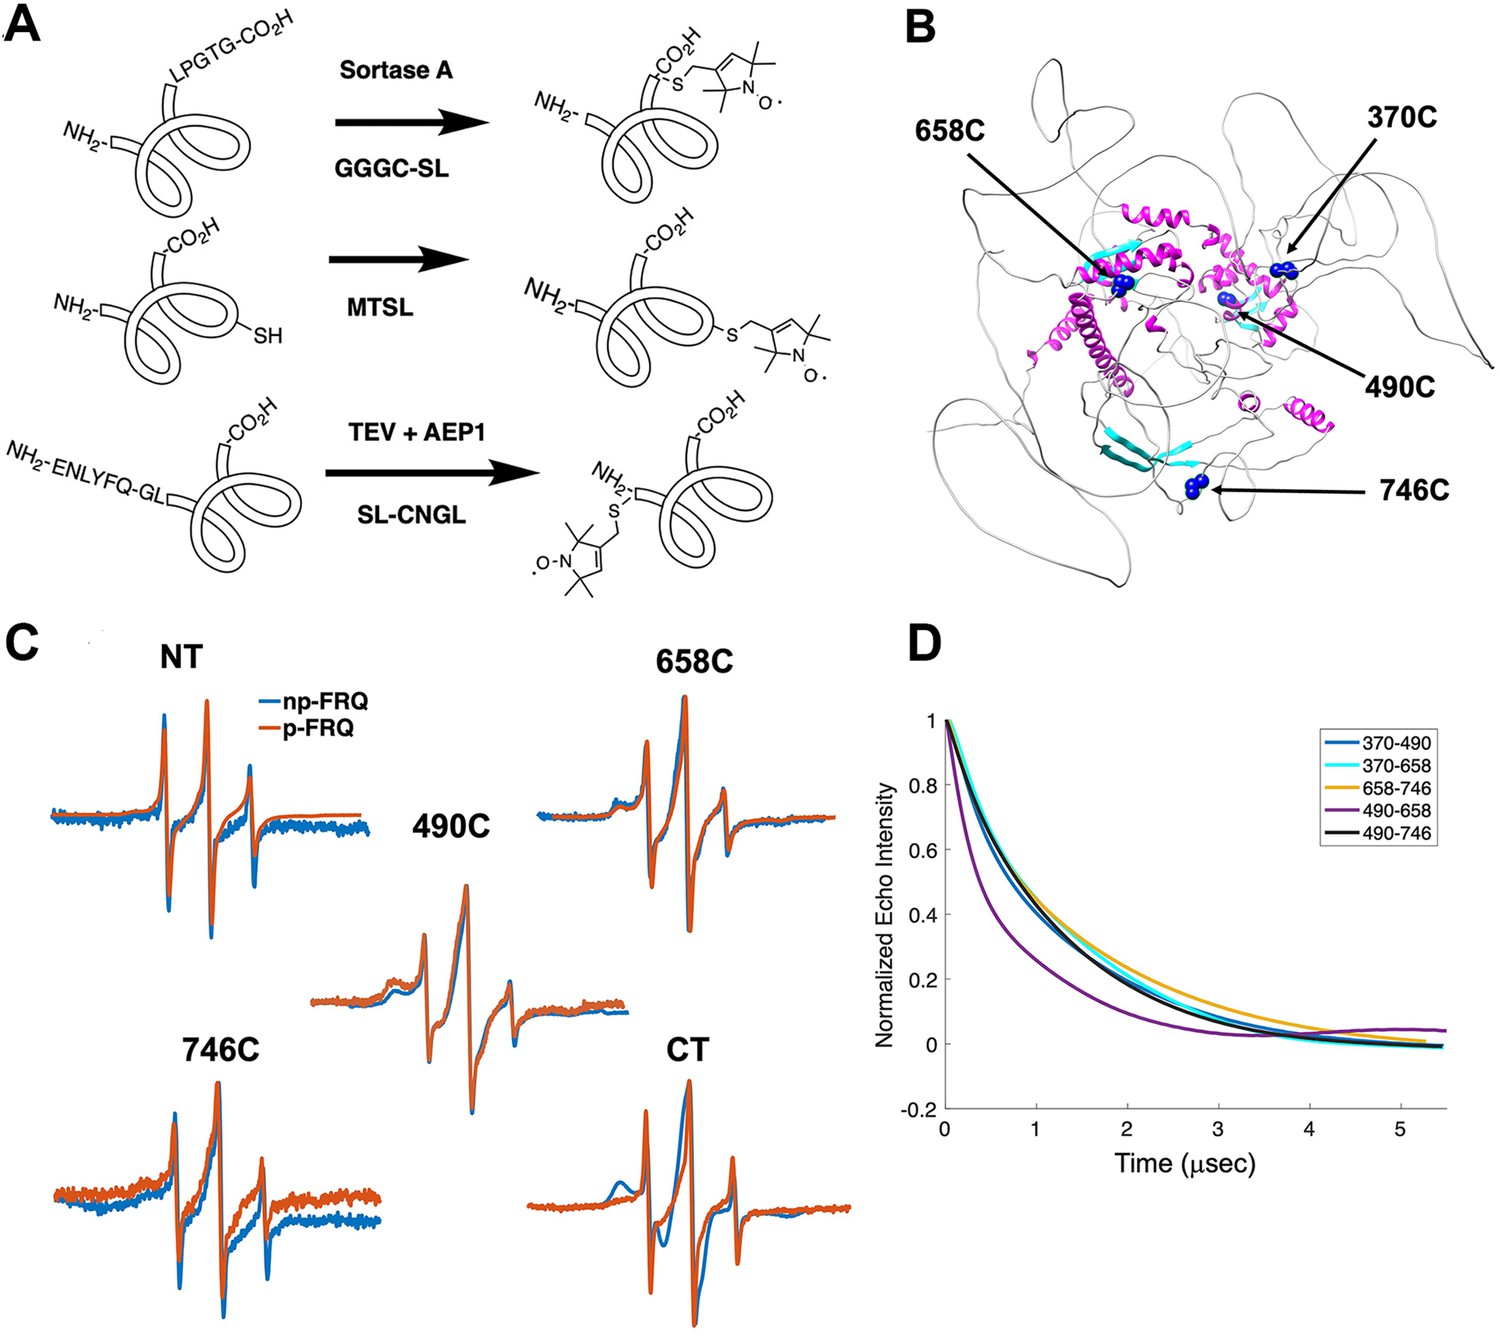
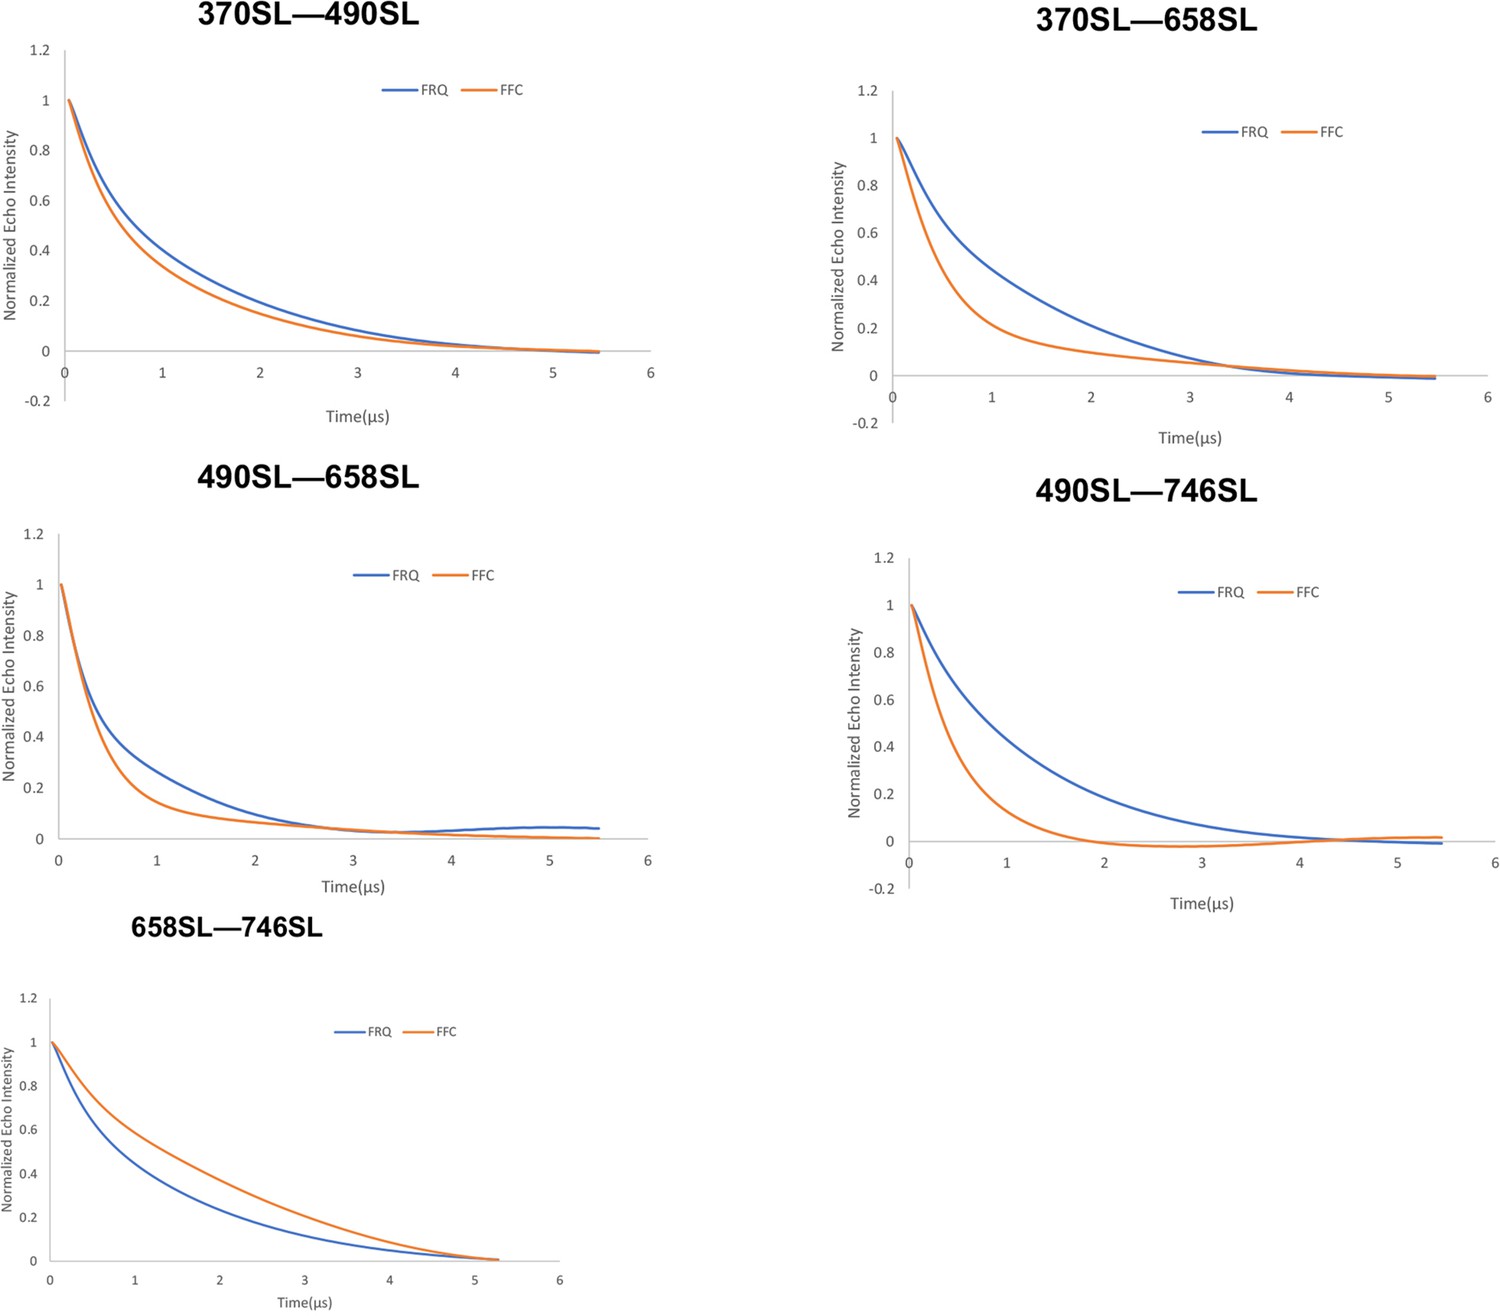
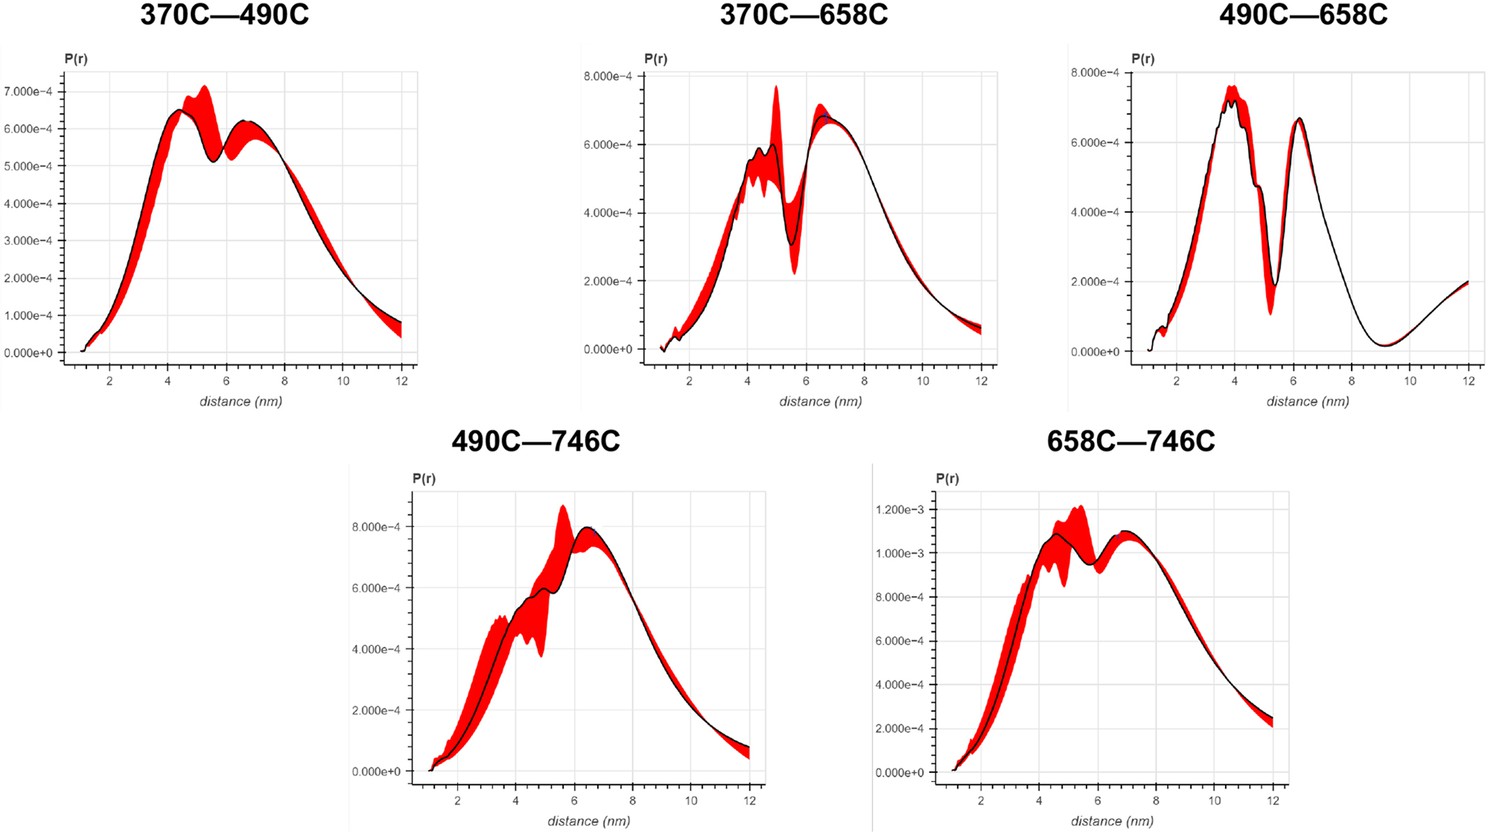
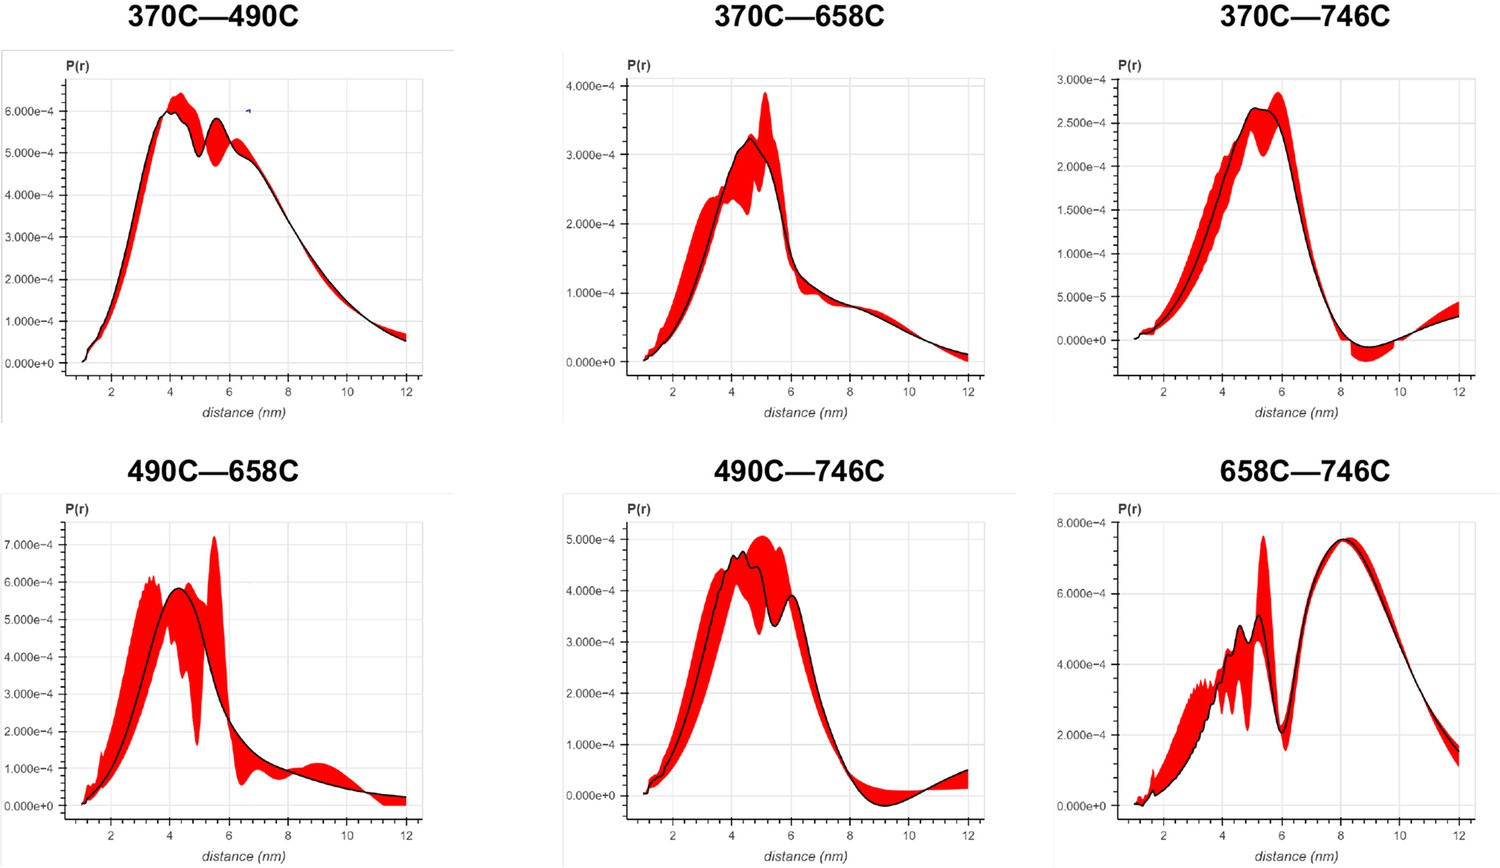
(A) Spin-labeling strategies for FRQ. MTSL was used for internal labeling of cysteine residues and AEP1 and SortaseA were used to label the N and C terminus, respectively. TEV protease cleavage revealed the AEP1 ligation site. (B) AlphaFold-generated model of FRQ with the positions of native spin-labeled cysteine residues highlighted in dark blue. (C) X-band (9.8 GHz) room temperature continuous wave (cw)-ESR measurements for various spin-labeled FRQ variants, each containing a single Cys labeling site, as designated. Data represented as first-derivative spectra, with the horizontal axes depicting the static field strength (typically 3330–3400 G), and the vertical axis depicting the change in magnetic susceptibility with respect to the field, in arbitrary units. (D) Time-domain data of double electron–electron resonance (DEER) measurements for double-cysteine labeled FRQ variants. The baseline-corrected time-domain dipolar evolution trace fits are shown; raw data and baseline corrections are given in the supplements to this figure. The 490–658 separation is noticeably closer and more ordered than the others. The total protein concentration was between 50 and 75 μM for all experiments. The number of replicates varied for each spin pair, largely because there is considerable variation in spin-labeling efficiency. As FRQ protein samples are prone to behave poorly, they were generally produced until a well-labeled sample that remained soluble could be achieved. Nevertheless, the reproducibility of the data is reasonable. For example, P(r) data for p-FRQ 658–746C samples produced many months apart are identical within error.
Figure 3—figure supplement 1
Enzymatic labeling of FRQ at its termini.
X-band (9.8 GHz) RT continuous wave-electron spin resonance (cw-ESR) measurements for the spin-labeled peptide by itself and when it has been grafted onto either the N- or C-terminus of FRQ.
Figure 3—figure supplement 2
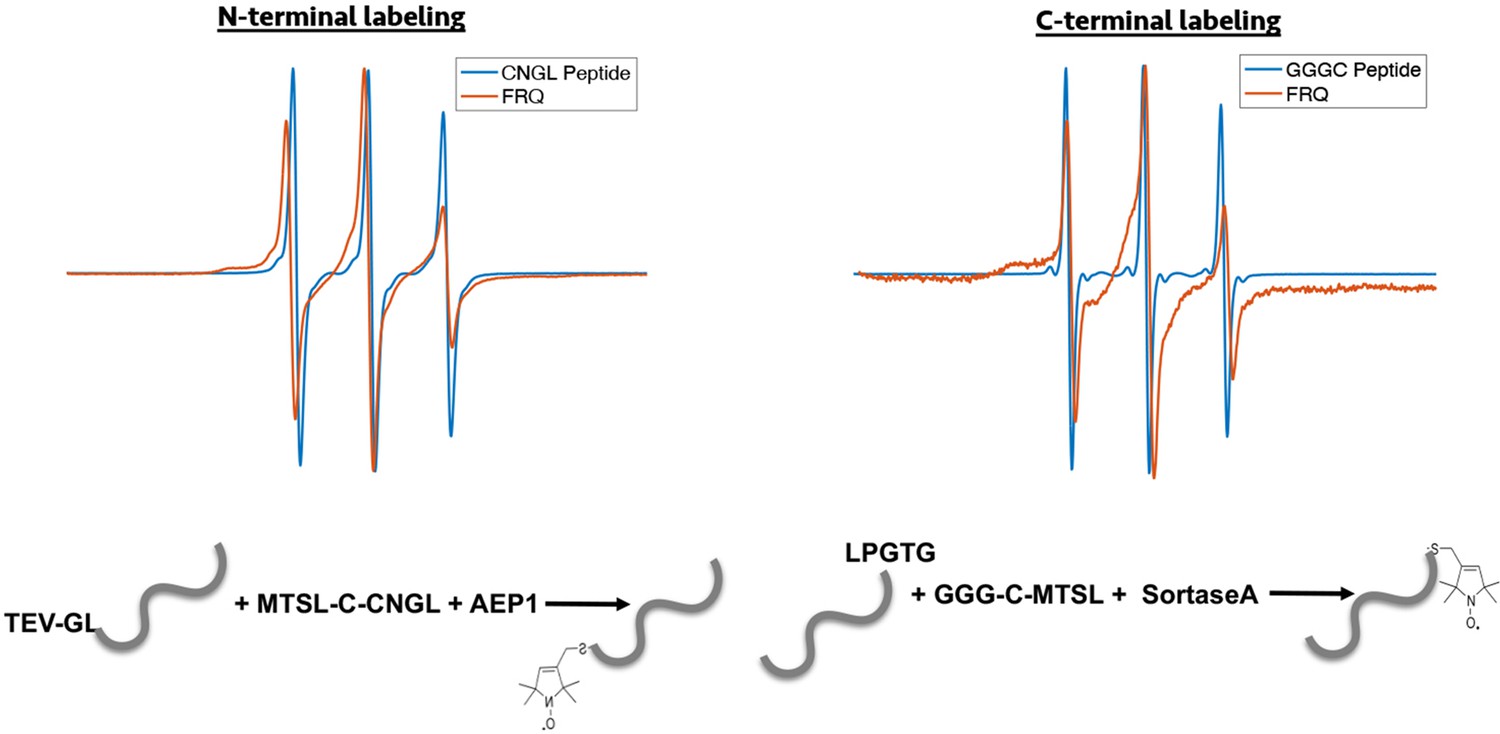
Time-domain traces before (raw) and after (data) background correction and trace fits (fit) from double electron–electron resonance (DEER) experiments of different double-cysteine FRQ variants alone or within the FFC (i.e., when FRQ was bound to FRH and CK1a).
The spins were present on the residue number of FRQ that is highlighted, for example, ‘370–490’ refers to FRQ spin-labeled at the 370C and 490C site and the DEER experiment probed the dipolar coupling of the spins at these sites. The last graphs show the time-domain data for the control single cysteine DEER experiments with p-FRQ 490C and p-FRQ 746C.
Figure 4 with 2 supplements
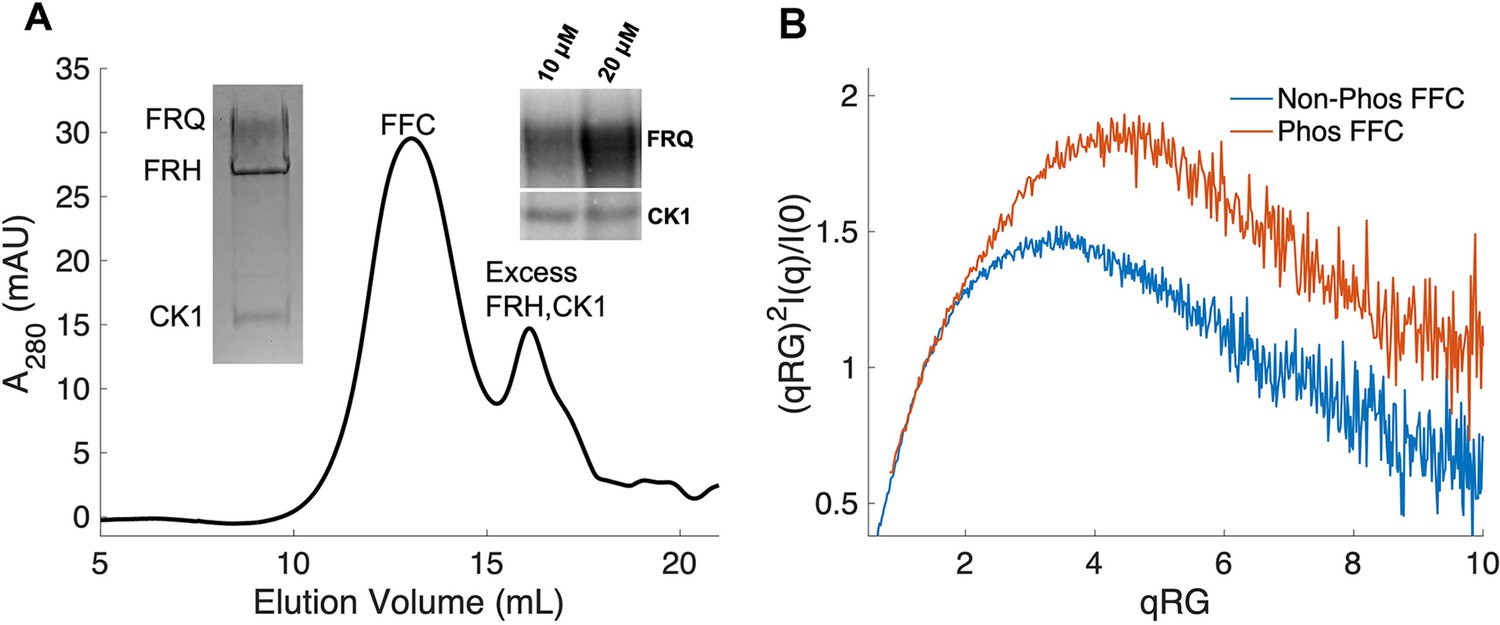
Properties of the FFC.
(A) Size-exclusion chromatography (SEC) of the FFC; left inset: SDS-PAGE gel of the peak components; right inset: 32P-autoradiogram of FRQ phosphorylation by CK1 and CK1 autophosphorylation at 10 and 20 μM FRQ in the presence of FRH. Complete autoradiograms are shown in the supplements to this figure. (B) Overlay of dimensionless Kratky plots of SEC-coupled small-angle X-ray scattering (SAXS) data from the FFC formed with either np- or p-FRQ (protein concentrations were between 50 and 75 μM). The SAXS-derived molecular weight (MW) of np-FRQ FFC = 285 kDa, which compares to a predicted value of 273 kDa; MW of p-FFC = 340 kDa; Table 1.
Figure 4—figure supplement 1
Baseline-corrected time-domain fit traces from Q-band double electron–electron resonance (DEER) experiments of different double-cysteine FRQ mutants alone (blue) and within the FFC (orange).
Original data are shown in Figure 3—figure supplement 2.
Figure 4—figure supplement 2
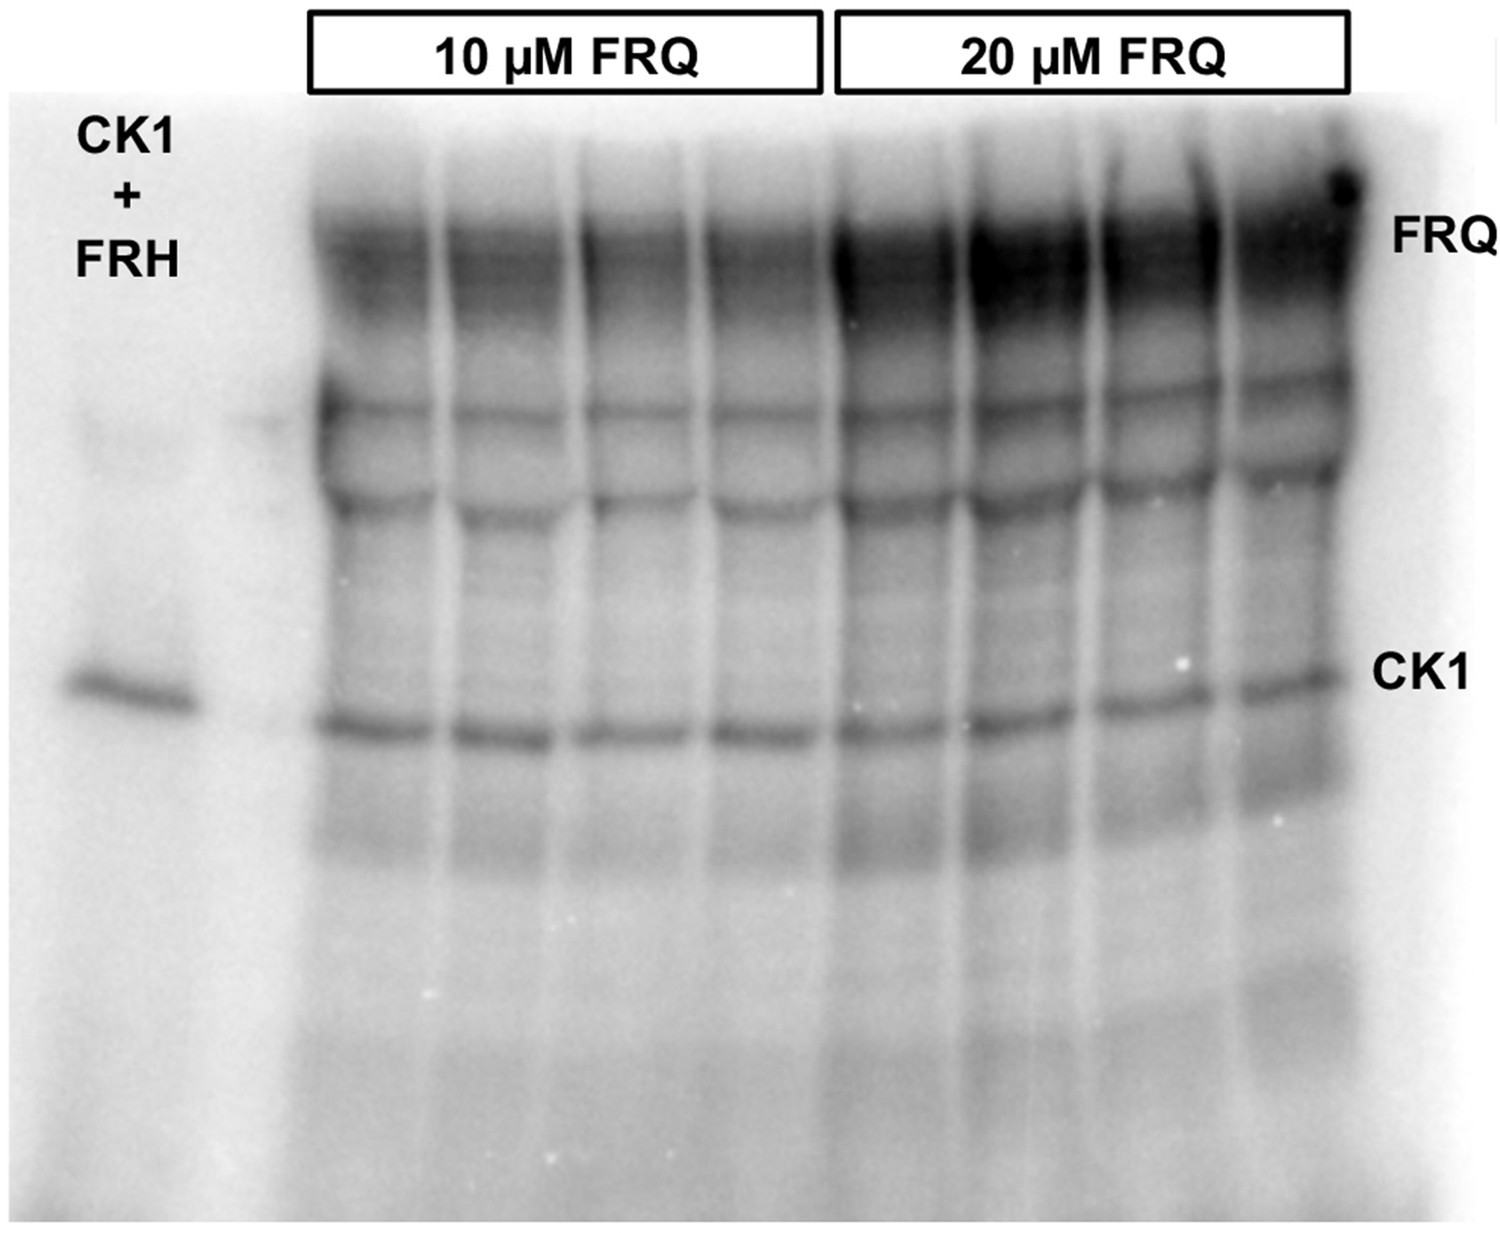
Complete autoradiograph of np-FRQ phosphorylation by CK1 and γ-32P-ATP from Figure 4A inset.
Four technical replicates are shown for each np-FRQ concentration.
Figure 5 with 4 supplements
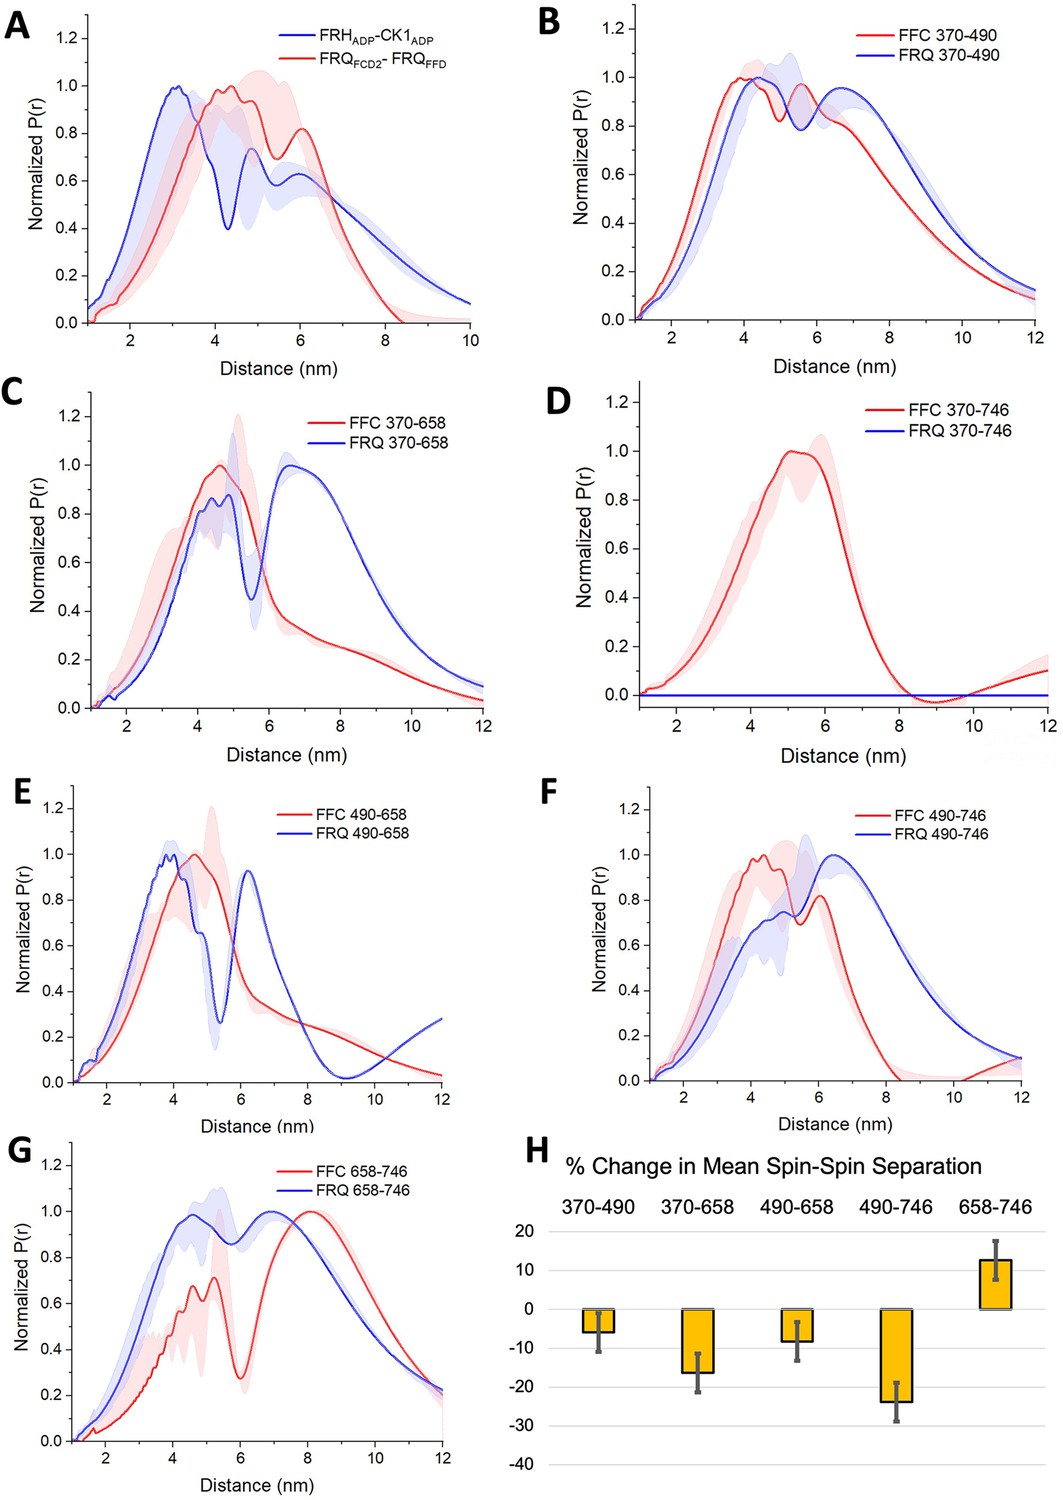
PDS (Pulsed dipolar ESR spectroscopy) distance distributions of spin-labeled FRQ and the FFC.
(A) Double electron–electron resonance (DEER)-derived distance distributions of the FFC wherein the spins were directed by ADP linkage to target the FRH and CK1 ATP-binding sites (blue) or in the form of MTSL labeling of cysteine residues within the FCD2 and FFD domains of FRQ (red). Uncertainties in the distributions at each distance point (see Materials and Methods) are represented by the widths of the blue and red shading. Time-domain data and distance distributions with error estimates for single samples are shown in the supplements to this figure. (B–G) DEER-derived distance distributions of cysteine residue pairs labeled with MTSL within p-FRQ, either alone (blue) or within the FFC (red). Uncertainties in the distributions at each distance point are represented by the widths of the blue and red shading. Time-domain data and distance distributions with error estimates for single samples are shown in the supplements to this figure. (H) Percentage change in the average separation of FRQ when it binds FRH and CK1. Errors are derived from the uncertainties in the distance distributions (also shown in the supplements to this figure). In these experiments, only FRQ was labeled with MTSL at the positions noted. Note: total protein concentrations were between 50 and 75 μM for all experiments.
Figure 5—figure supplement 1
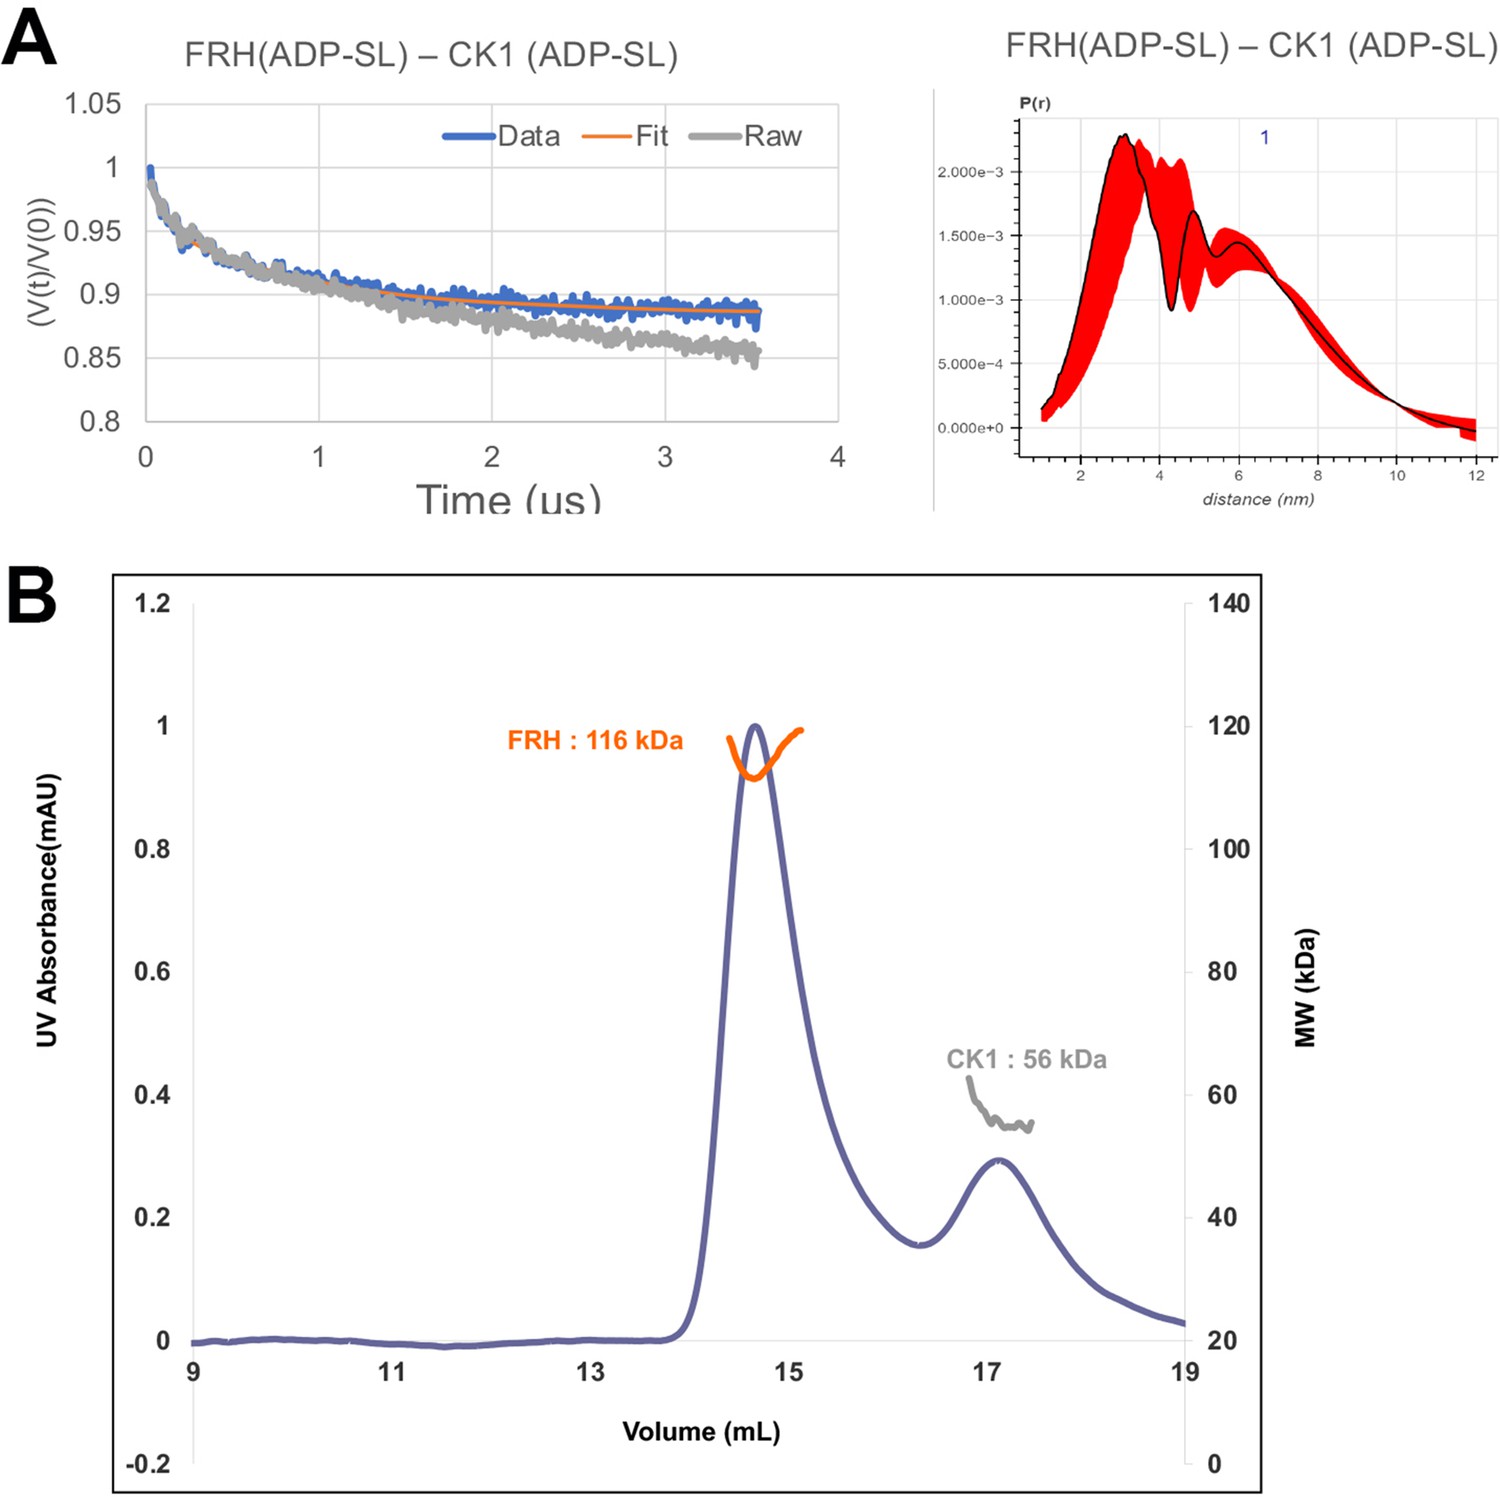
FRQ-mediated interaction between FRH and CK1.
(A) Background-corrected time-domain trace and error analyses from double electron–electron resonance (DEER) experiments targeting the ATP-binding pockets of FRH and CK1. The DEER experiment probed the dipolar coupling of the spins in the ADP-β-S-SL molecules that were present in the ATP-binding pocket of FRH or CK1. (B) Size-exclusion chromatography coupled to multiangle light scattering (SEC-MALS) of a mixture of purified FRH and CK1. The proteins elute separately as monomers with no evidence of co-migration.
Figure 5—figure supplement 2
Error analysis of the distance distributions produced from double electron–electron resonance (DEER) experiments of different double-cysteine FRQ variants.
The spins were present on the amino acid positions of FRQ that are noted, for example, ‘370–490’ refers to FRQ spin-labeled at the 370C and 490C site and the DEER experiment probed the dipolar coupling of the spins at these sites.
Figure 5—figure supplement 3
Error analysis of the distance distributions produced from double electron–electron resonance (DEER) experiments of different double-cysteine FRQ variants within the FFC (i.e., when FRQ was bound to FRH and CK1).
The spins were present on the amino acid positions of FRQ that are noted, for example, ‘370–490’ refers to FRQ spin-labeled at the 370C and 490C site and the DEER experiment probed the dipolar coupling of the spins at these sites.
Figure 5—figure supplement 4
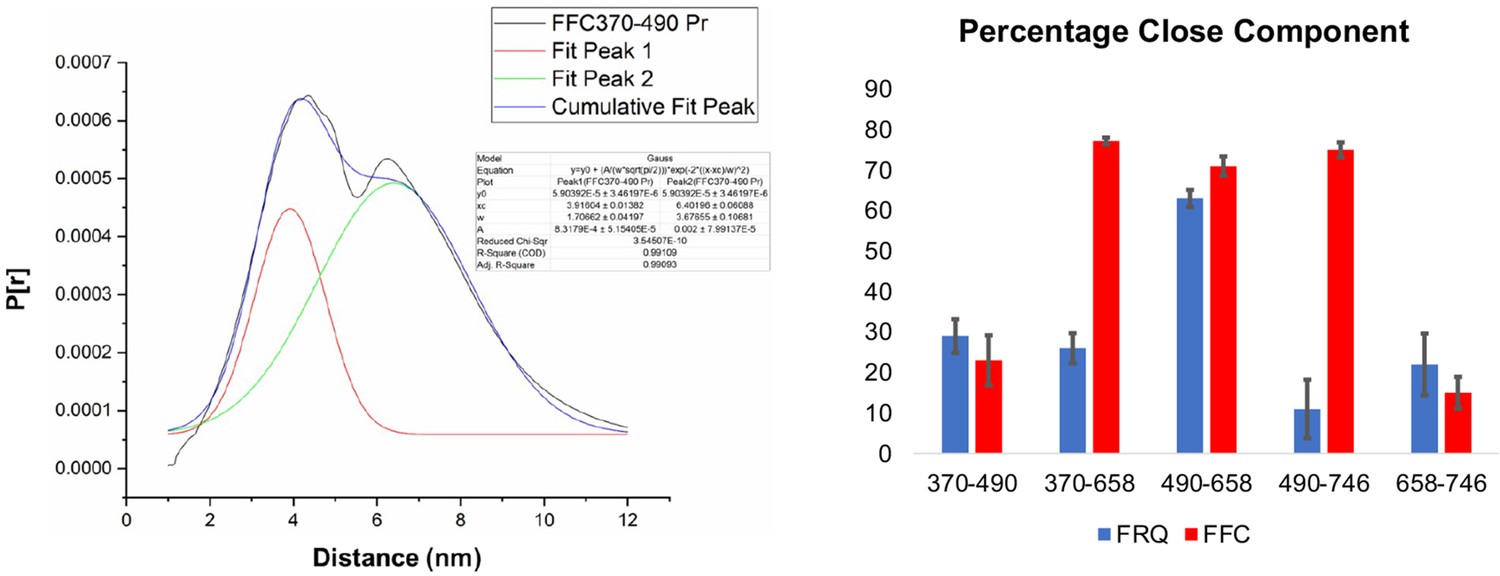
Gaussian function fitting of distance distributions.
(Left) The two-component Gaussian fitting of the distance distribution (P[r]) obtained from singular value decomposition (SVD) for FFC 370–490 (i.e., spins were placed on resides 370 and 490 on FRQ, and this protein was bound to CK1 and FRH). No constraints were placed on the width, position, or amplitude of either component and the best-fit values were obtained by minimizing the difference between the fits and the SVD distance distributions. Similar fits were carried out for all the different variants. The quality of the fit is reported by the R2 values and ranged between 0.94 and 0.99 for all the samples tested. They are reported in Table 5. (Right) The proportion of the closer distance peak in the distance distributions of FRQ (blue) or FRQ + FRH + CK1(FFC) (red) samples. The error bars reflect the uncertainty in estimating the population of each peak and were derived from uncertainties in the distance distributions shown in Figure 5—figure supplements 2 and 3.
Figure 6 with 5 supplements
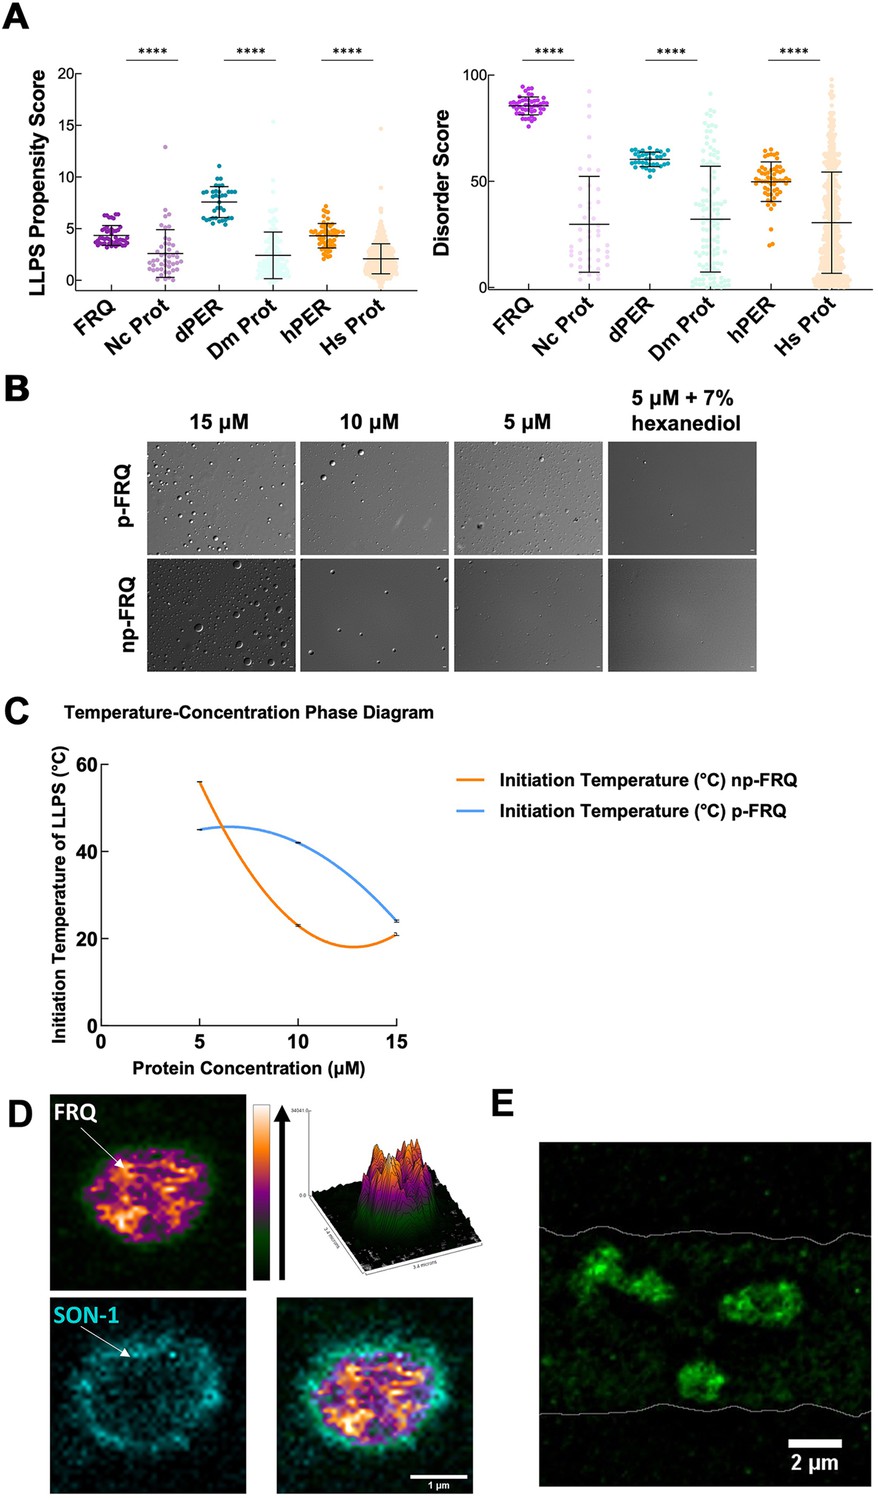
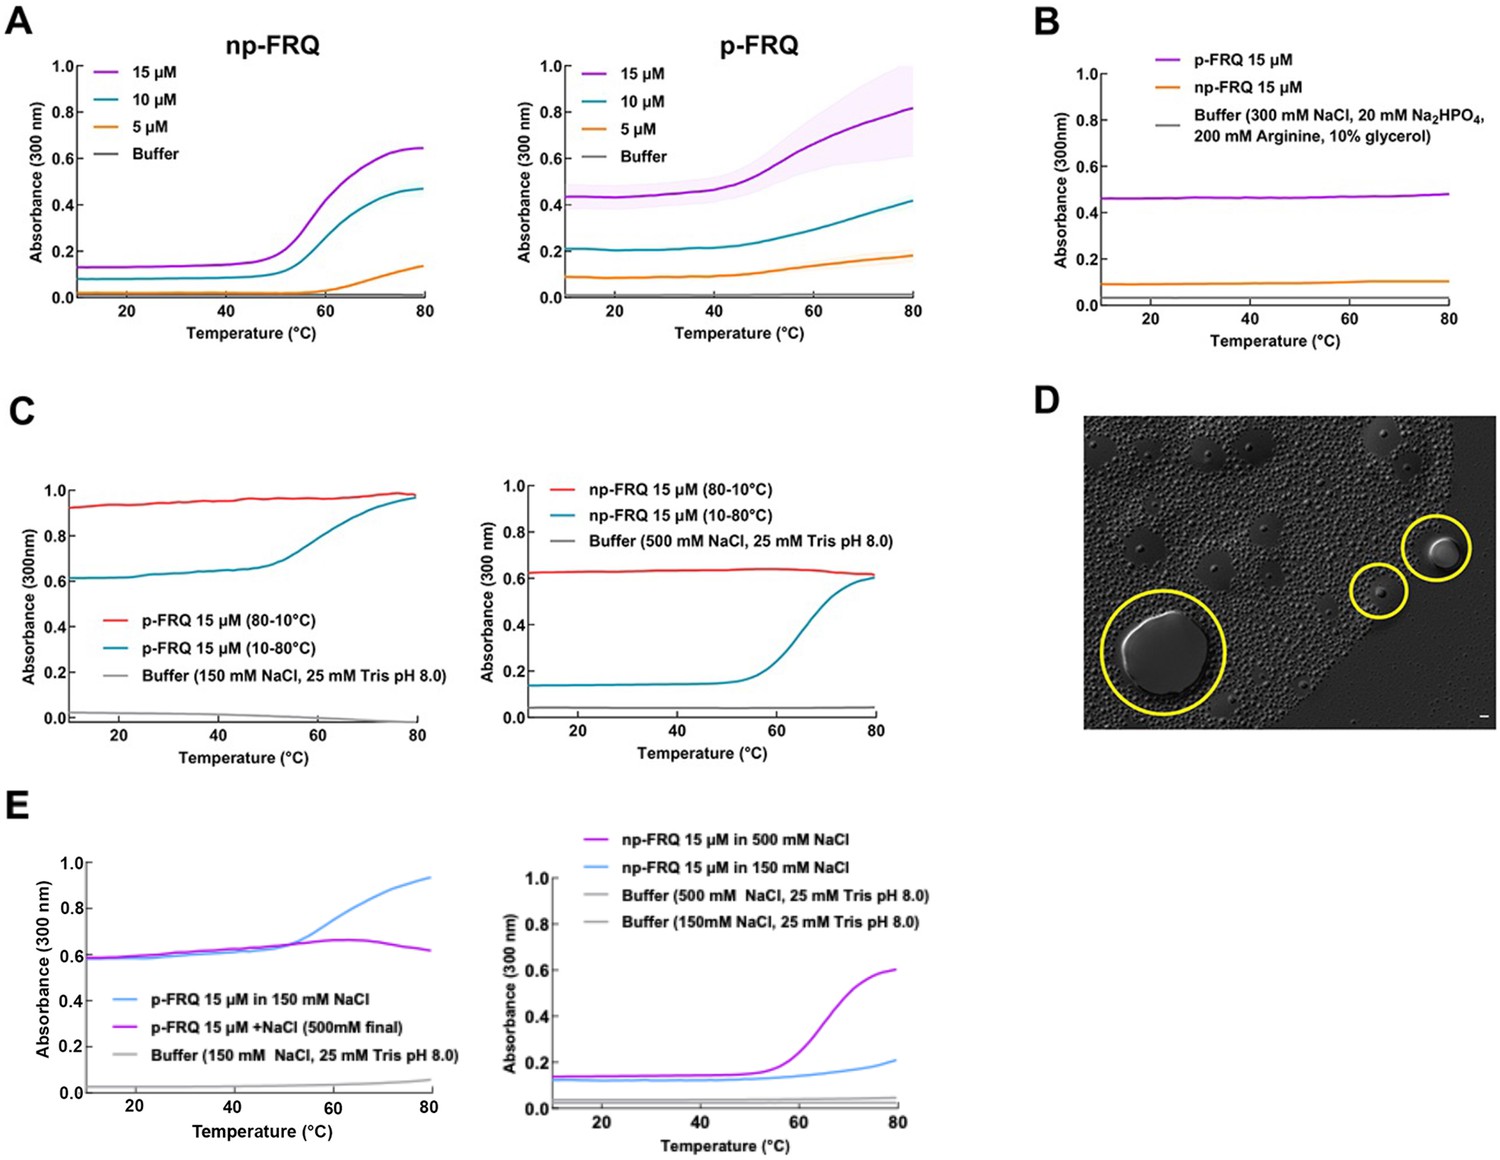
FRQ undergoes liquid–liquid phase separation (LLPS) in agreement with predictions from its sequence properties and those of its functional analogs.
(A) LLPS propensity predictions using Pi-Pi and IUPred2A disorder predictions are shown for FRQ (purple), dPER1 (teal), and hPER1 (orange) compared to values for proteins of similar length from their respective proteomes (Prot): Nc, Neurospora crassa; Dc. Drosophila melanogaster; Hc, Homo sapiens. The mean and standard deviations are represented as horizontal and vertical black bars, respectively. Note: **** denotes a p-value<0.0001 obtained from a Mann–Whitney U-test. (B) Differential interference contrast (DIC) microscopy images of various concentrations of p-FRQ (in 150 mM NaCl, 25 mM Tris pH 8.0) and np-FRQ (in 500 mM NaCl, 25 mM Tris pH 8.0) at 25°C; images shown at ×100 magnification. Scale bar = 2 μm. (C) Temperature vs concentration phase diagram derived from the results of the turbidity assays shown in the supplements to this figure. Both p-FRQ and np-FRQ undergo an LCST phase transition on or above the line (a second-order polynomial fit to the data points). The error bars of each point (about the size of the points) reflect the 95% confidence interval of the mean. The phase boundary for p-FRQ represents the transition apparent in the temperature scans shown in the supplements to this figure. Some p-FRQ phase separation already occurs at low temperature under these buffer conditions, and thus, the region below the line does not represent fully soluble p-FRQ. (D) Live-cell fluorescent imaging of FRQmNeonGreen in nuclei of Neurospora hyphae. Upper left panel shows the FRQ channel, represented as a multicolor heat map of fluorescence intensity; upper right panel shows a surface plot derived from the raw FRQ image to emphasize regions of concentration; lower left shows nucleoporin SON-1mApple, which localizes to the cytoplasmic face of the nuclear envelope; bottom right shows the FRQ:SON-1 merge image. The images were acquired on a Zeiss 880 laser scanning confocal microscope and were smoothed by bicubic interpolation during tenfold enlargement from 42 × 42 pixels to 420 × 420 pixels. (E) FRQ[mNeonGreen] nuclear foci shown within an N. crassa syncytium mycelium (outlined by white lines), cropped from Video 1. Scale bar = 2 μm. Several hundred nuclei of identical genotype in multiple separate hyphae were examined. For visualization of intranuclear dynamics, 2–3 individual well-separated nuclei from multiple hyphae were examined in detail from each of 3 d. Representative data from one of these is reported.
Figure 6—figure supplement 1
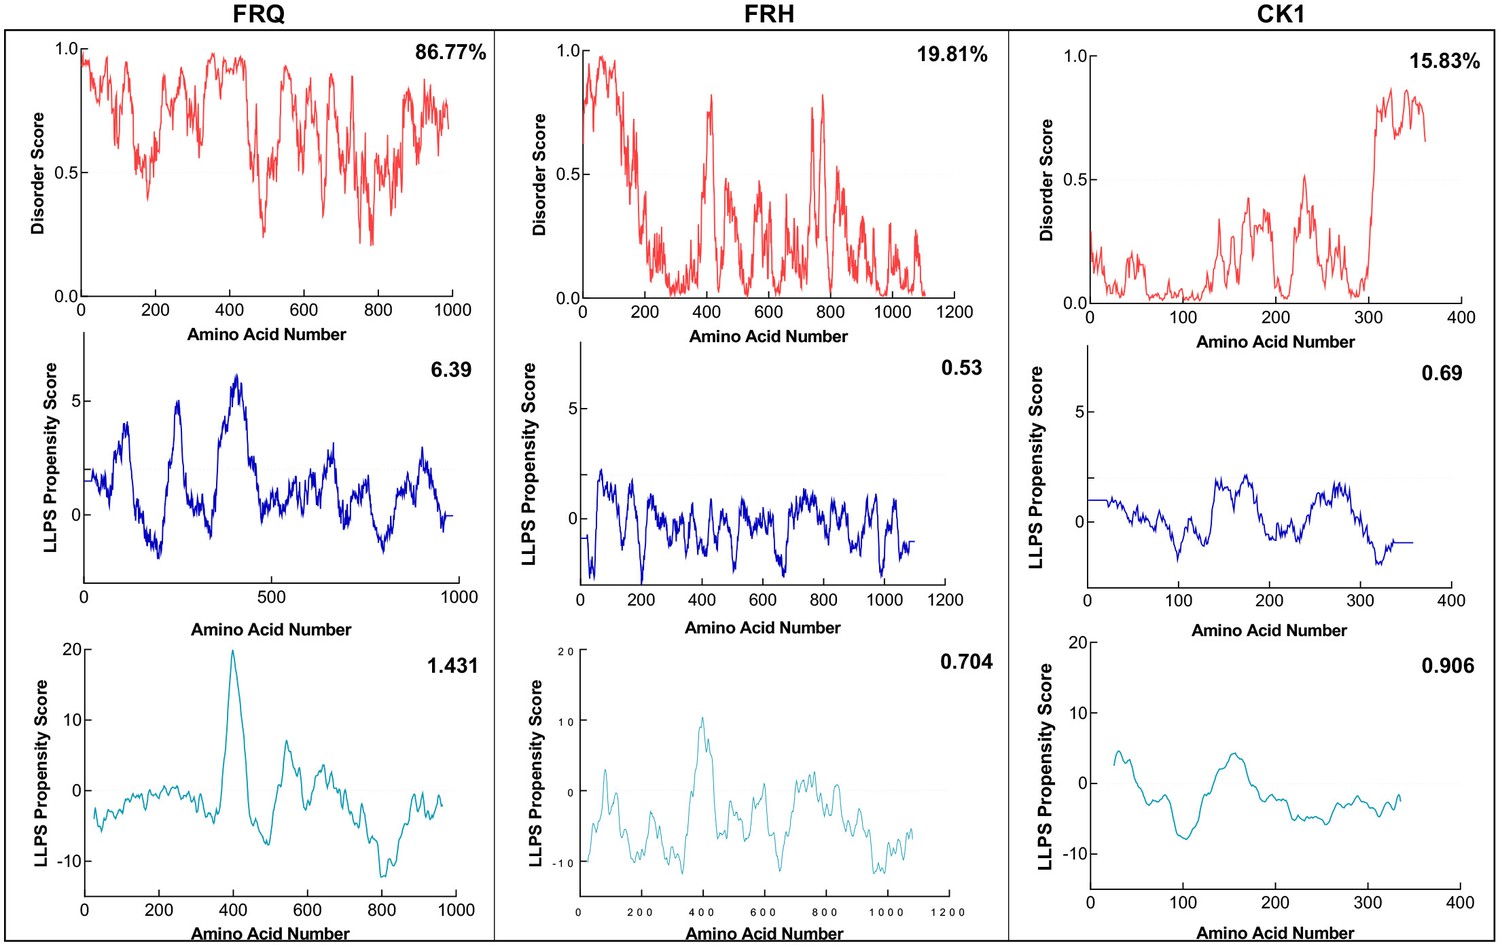
FRQ, but not FRH or CK1, is highly disordered and predicted to undergo liquid–liquid phase separation (LLPS).
Shown are the disorder and LLPS propensity scores of the members for the FFC complex: FRQ, FRH, and CK1. Columns from left to right are disorder and phase-separation predictions for FRQ, FRH, and CK1, respectively. Disorder graphs (red) were computed using the IUPred2A program (Mészáros et al., 2018), where values above a 0.5 threshold (dashed line) are considered disordered. LLPS propensity predictions were computed using Pi-Pi (blue) (Vernon et al., 2018) and catGRANULE (light blue) (Bolognesi et al., 2016). Dashed lines represent neutral propensity. Shown on the top-right corner of each graph are the percent disorder or LLPS propensity scores of each protein.
Figure 6—figure supplement 2
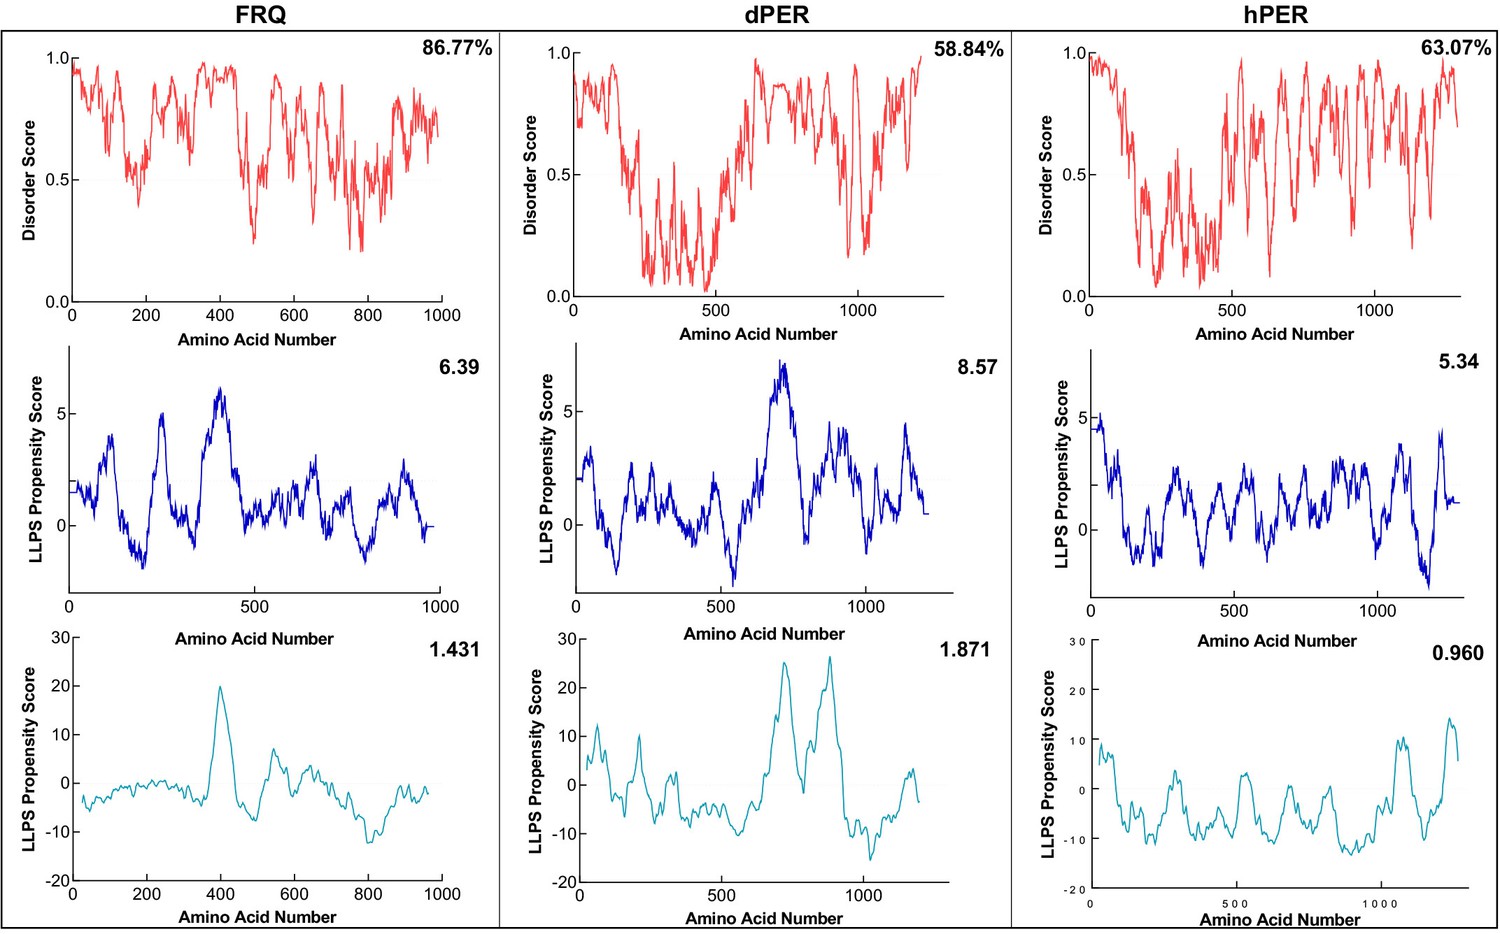
FRQ and its functional homologs are predicted to undergo liquid–liquid phase separation (LLPS).
Shown are the disorder and LLPS propensity scores for FRQ, dPER1, and hPER1. Data for the disorder graphs (red) were computed using the IUPred2A program, where values above a 0.5 threshold (dashed line) are considered disordered. Pi-Pi predictions (blue) were computed using Vernon et al., 2018, while catGRANULE predictions (light blue) were computed using catGRANULE server (Bolognesi et al., 2016). Shown on the top-right corner of each graph are the percent disorder, PScore or catGRANULE score for each protein. Dashed lines represent neutral propensity. FRQ, dPER1, and hPER1 are all predicted to be highly disordered (86.77, 58.84, and 63.07%, respectively) and undergo LLPS.
Figure 6—figure supplement 3
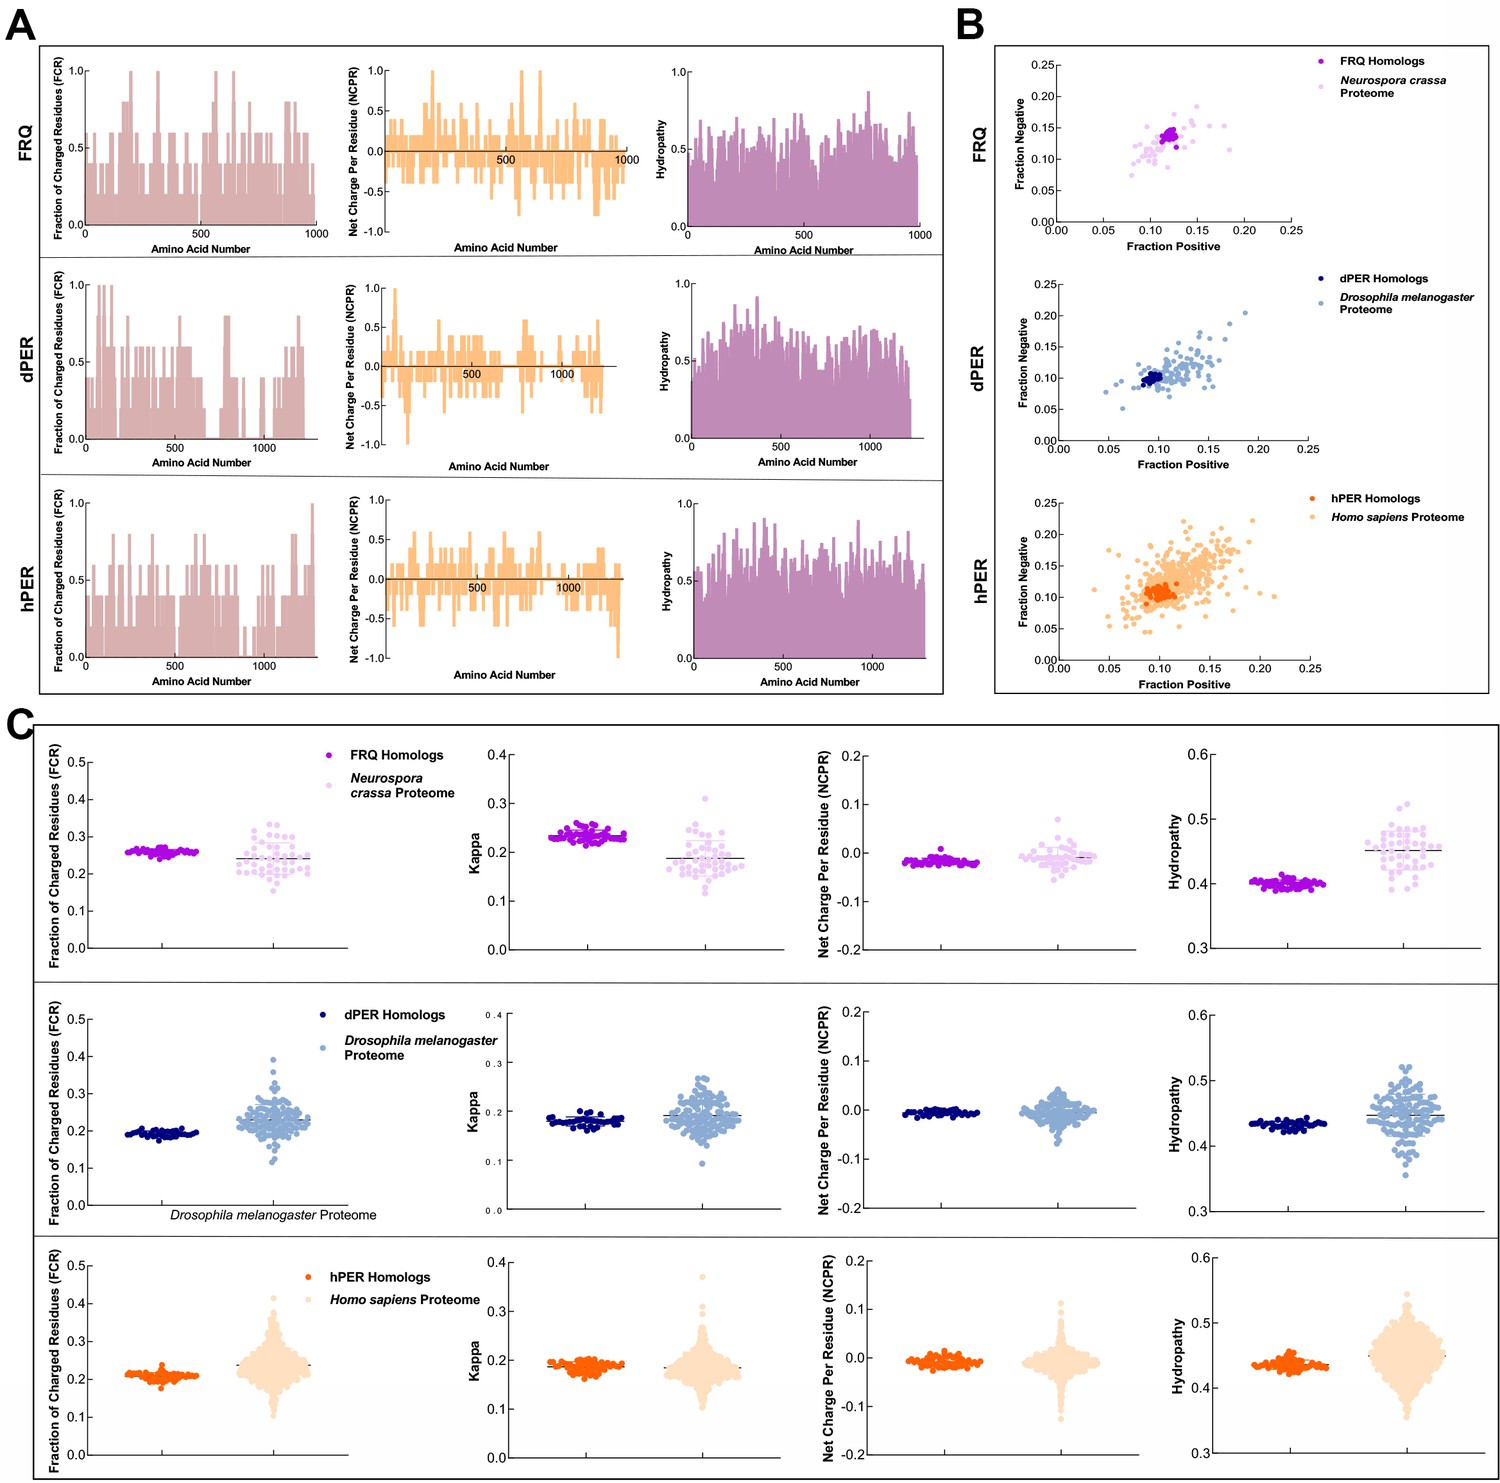
FRQ and its functional homologs, dPER1 and hPER1, have similarly disparate physicochemical properties compared to their proteomes.
(A) Shown are the distribution of fraction of charged residues (FCR), net charge per residue (NCPR), and hydropathy along the sequence of FRQ, dPER1, and hPER1. (B) Classification of the charge properties of the Ref50 clusters of FRQ and its functional homologs, dPER1 and hPER1. Das-Pappu phase plots showing the fraction of negatively vs positively charge residues for the UniProtRef50 clusters of FRQ (purple), Neurospora crassa proteome control (light purple), dPER1 (blue), Drosophila melanogaster proteome control (light blue), hPER1 (orange), and Homo sapiens proteome control (light orange). Shown are the fraction of negative residues versus fraction of positive residues for each cluster of homologs and their controls (similar size proteins from their respective proteomes). Despite the lack of amino acid conservation between the functional homologs of FRQ, dPER1, and hPER1, the ratio of fraction negative to fraction positive residues is similar among the clock proteins. dPER and hPER1 have a similarly low value of both fraction positive and fraction negative compared to their respective proteomes, whereas the fraction positive and fraction negative residues are both higher in FRQ. Note: Ref50 is a clustering method utilized by UniProt and is defined in Steinegger and Söding, 2018. While this work was in preparation, conceptually similar analyses were carried out by Jankowski et al., 2022 . (C) Sequence characteristics of FRQ and its homologs, dPER1 and hPER1. Various protein sequence parameters were calculated using localCIDER (Holehouse et al., 2017) and displayed including FCR, the degree of charge mixing (kappa), NCPR, and hydropathy (the hydrophobic and hydrophilic character of protein chain as defined by Kyte and Doolittle, 1982) for the UniProtRef50 clusters of FRQ (purple), dPER1 (blue), and hPER1 (orange). For comparison are shown protein sequences of similar length from the SWISS-Prot reviewed proteomes of Neurospora crassa (light purple), Drosophila melanogaster (light blue), and Homo sapiens (light orange). Hydropathy is consistently low for the clock proteins and FRQ orthologs have a high degree of charge separation, that is, tracks of negative and positive residues (high kappa). High kappa values are common for proteins that phase separate (Somjee et al., 2020).
Figure 6—figure supplement 4
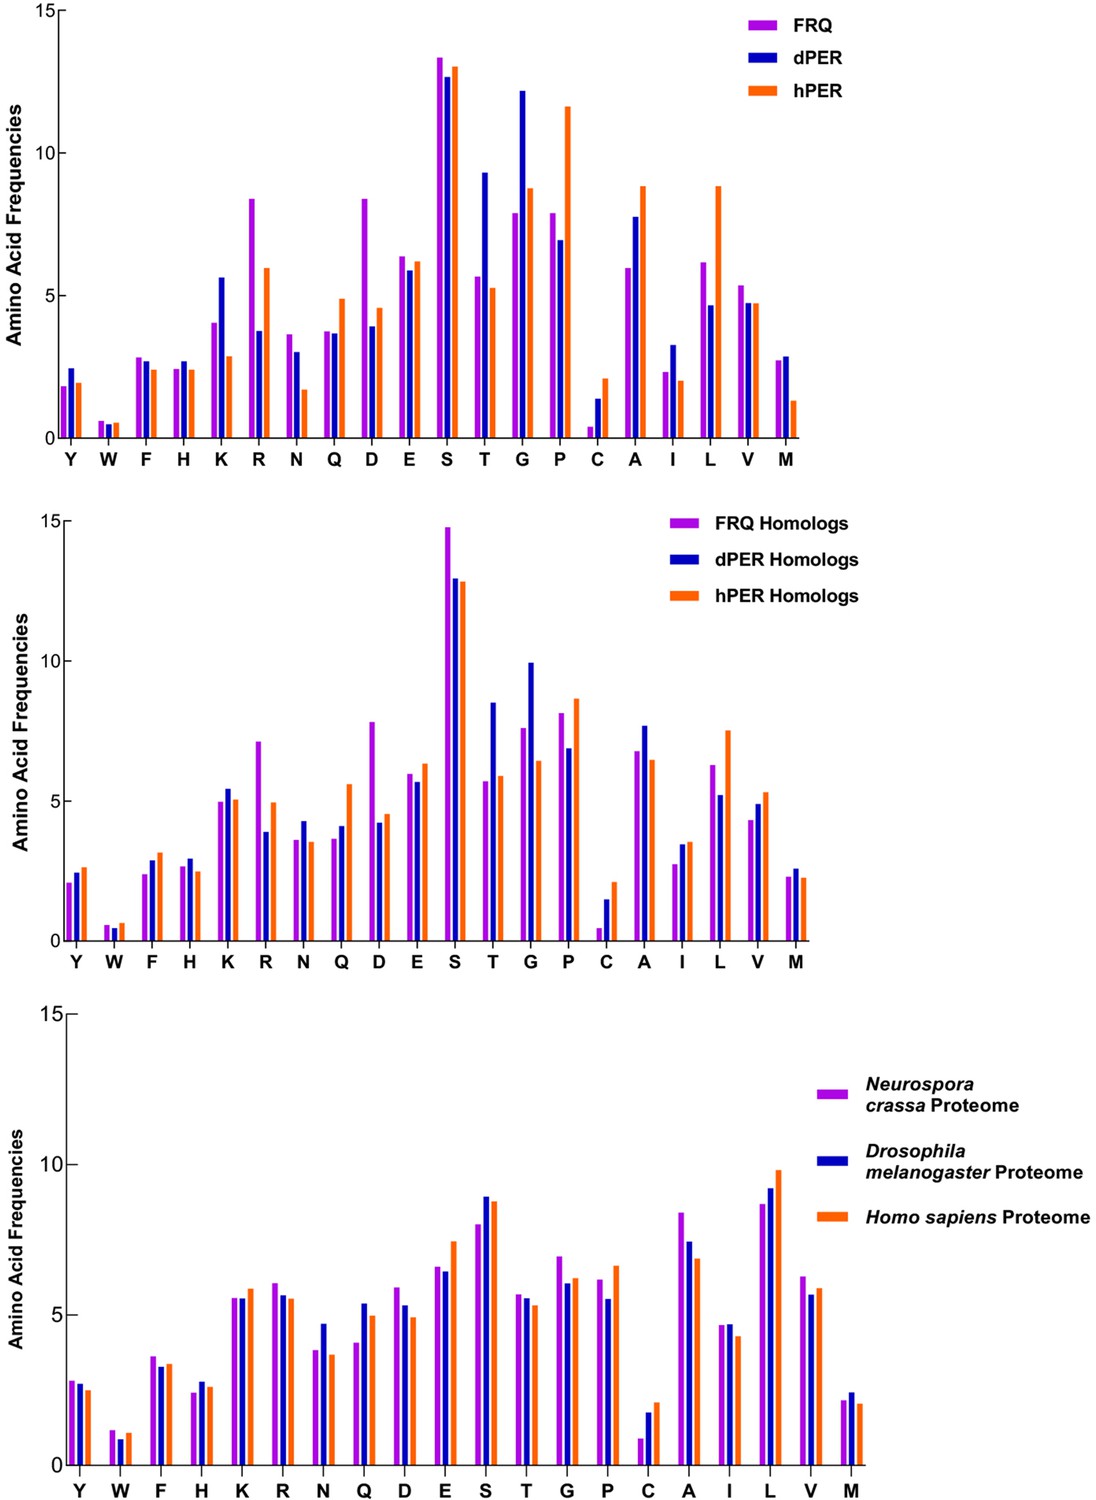
FRQ and its functional homologs dPER1 and hPER1 have similar amino acid composition compared to their respective proteomes.
FRQ and its functional homologs dPER1 and hPER1 have similar amino acid compositions, which differs substantially from that of their respective proteomes. The amino acid composition for FRQ, dPER1, and hPER1 and their respective homolog clusters and proteomes are shown. Generally, G, S, T, and P residues are enriched, whereas hydrophobic (A, I, L, V) residues are relatively depleted for FRQ, dPER1, hPER1, and their homologs compared to their proteomes. Unlike dPER1 and hPER1 and their homologs, FRQ and its homologs are also highly enriched in R and D.
Figure 6—figure supplement 5
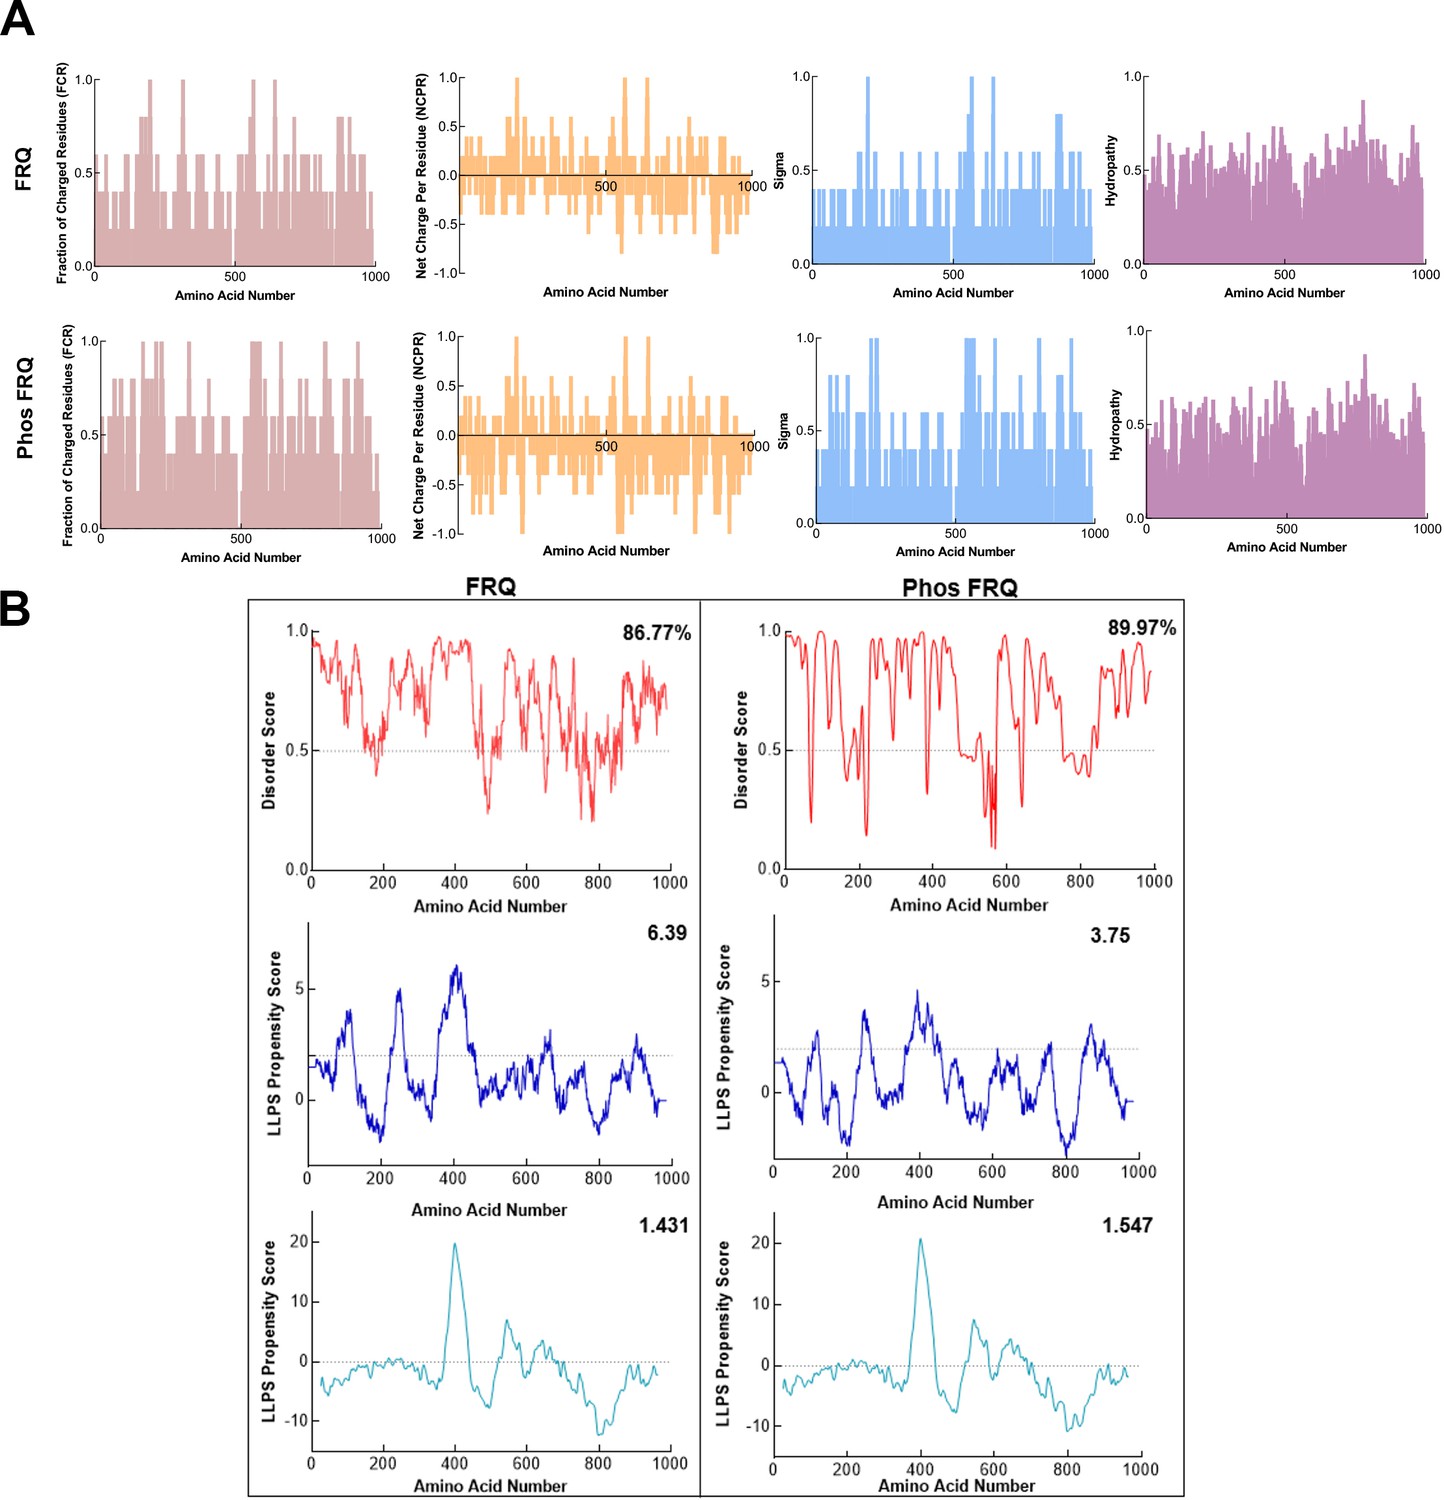
Phosphorylation modulates the physicochemical properties of FRQ.
(A) Shown are the distribution of fraction of charged residues (FCR), net charge per residue (NCPR), and hydropathy along the sequence of np and p-FRQ. (B) Shown are the disorder and liquid–liquid phase separation (LLPS) propensity scores for np and p-FRQ. Data for the disorder graphs (red) were computed using the IUPred2A program (Mészáros et al., 2018), where values above a 0.5 threshold (dashed line) are considered disordered. Pi-Pi predictions (blue) were computed using a phase separation predictor outlined in Vernon et al., 2018, while catGRANULE predictions (light blue) were computed using catGRANULE server (Bolognesi et al., 2016). Shown on the top-right corner of each graph are the percent disorder, PScore, or catGRANULE score for each protein. Dashed lines represent neutral propensity. Note: Glu(E) residues were employed as phospho-mimetics in all analysis.
Figure 7 with 2 supplements
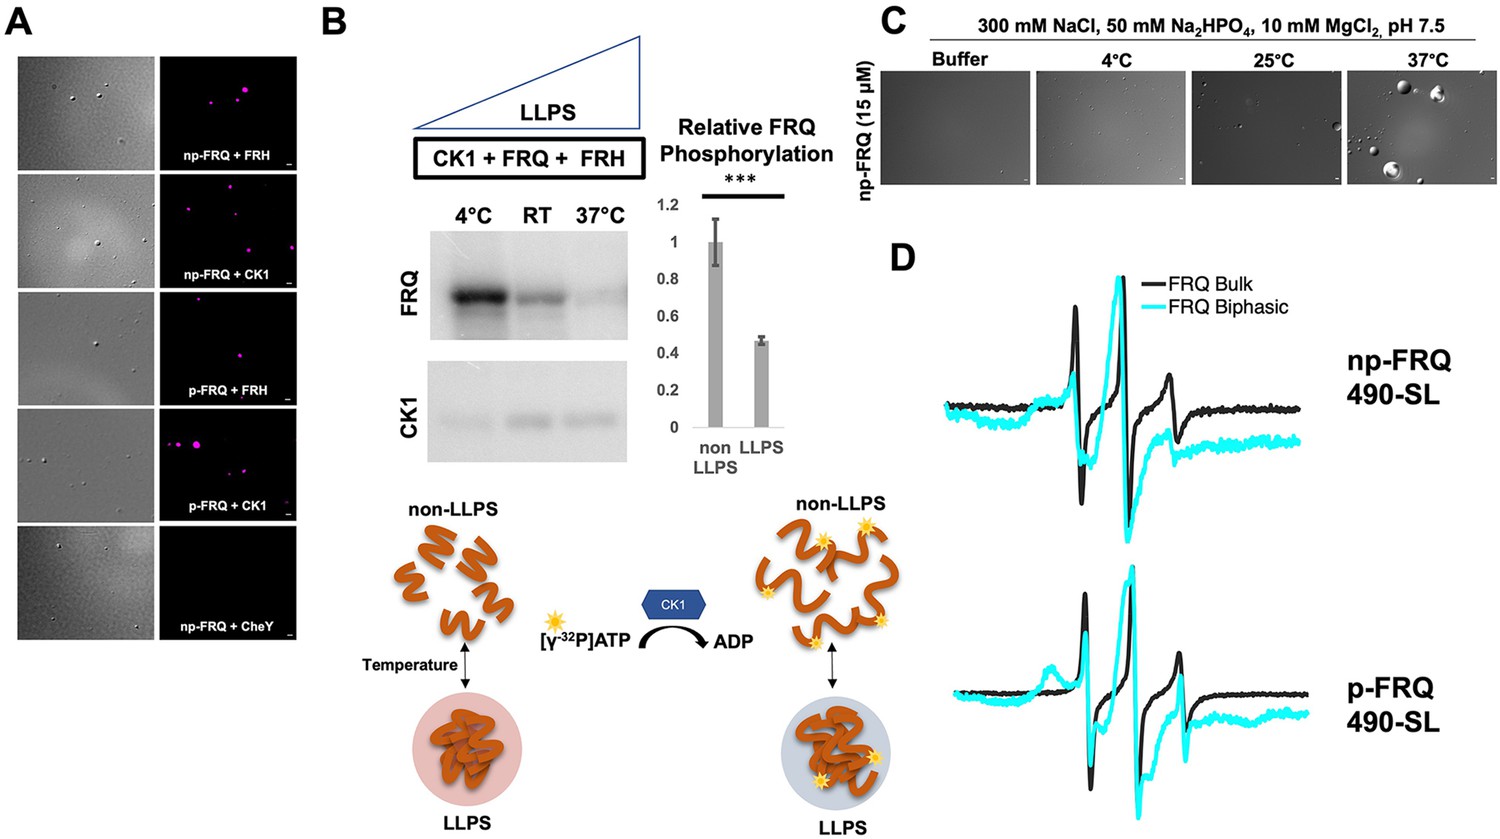
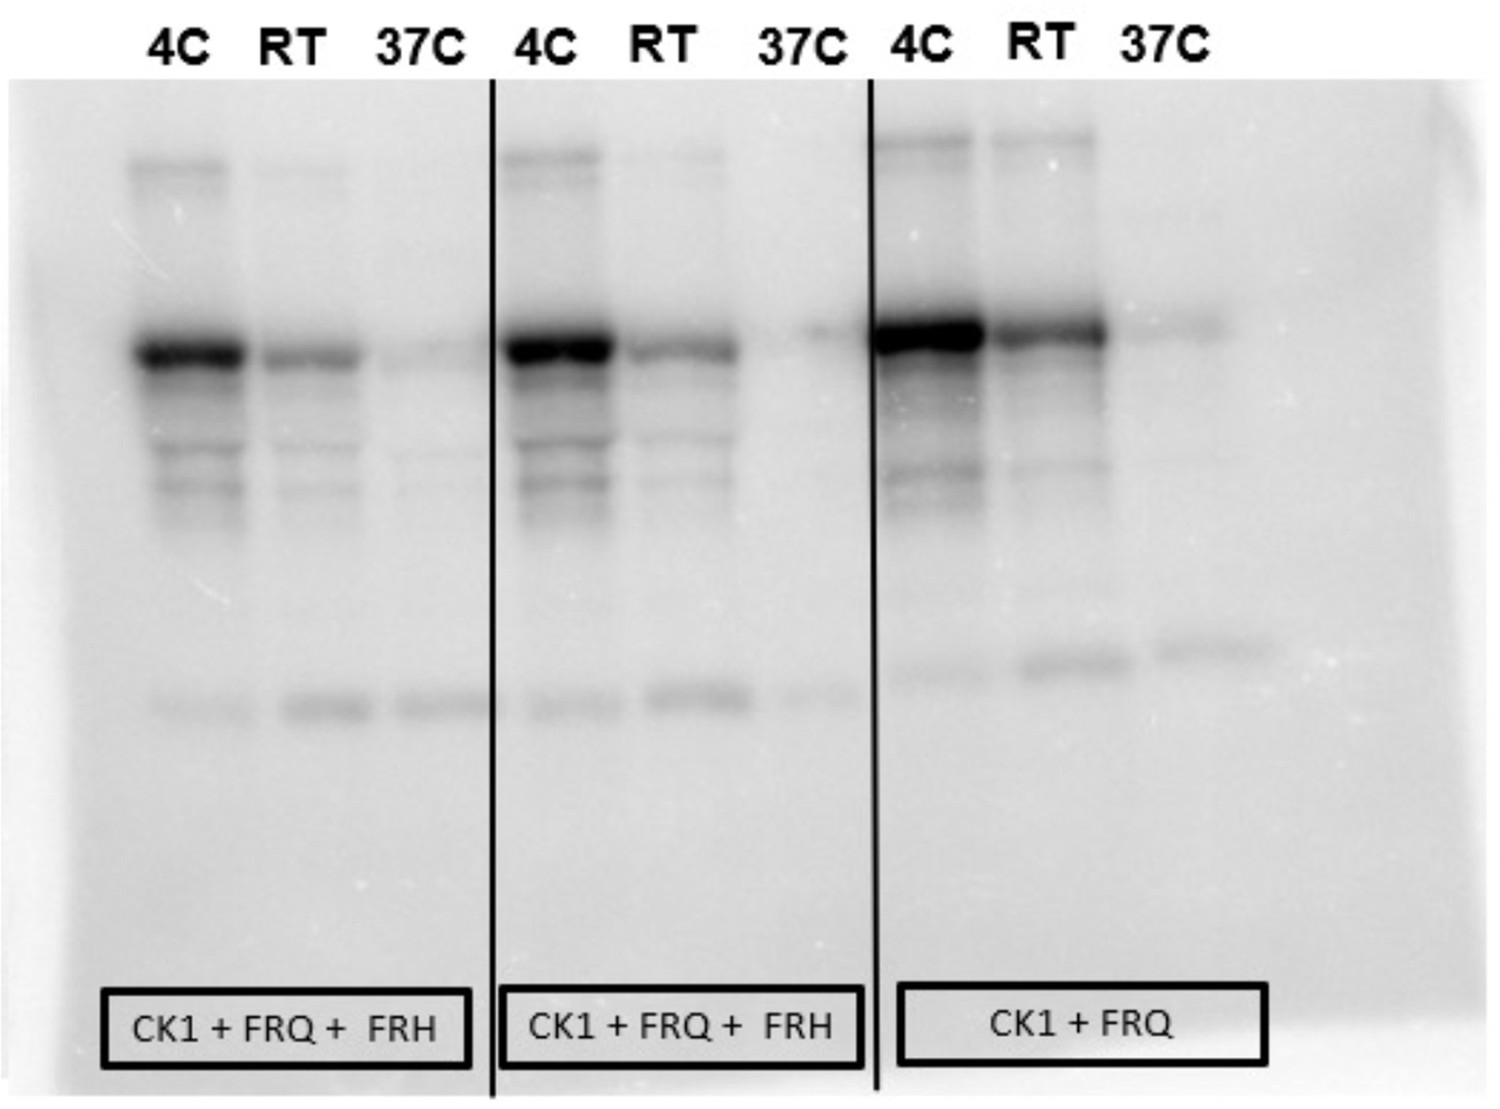
Conditions favoring liquid–liquid phase separation (LLPS) alter the structural and enzymatic properties of the FFC.
(A) Differential interference contrast (DIC) and fluorescence microscopy images at 25°C of phase-separated np-FRQ or p-FRQ (5 μM each) droplets in 500 mM KCl, 20 mM Na2HPO4, pH 7.4 with either equimolar Cy5-labeled FRH, CK1, or CheY (control) visualized using Cy5 fluorescence. Scale bar = 2 μm. (B) Quantification of FRQ phosphorylation by CK1 at RT under LLPS (n=2) and non-LLPS (n=4) conditions with phosphorylation levels under non-LLPS conditions normalized to 1 (Top) Autoradiography of FRQ (20 μM) (left) phosphorylated by CK1 in the presence of FRH at increasing temperatures. (Bottom) Schematic showing the nature and results of the autoradiography assay depicted above. The FRQ phosphorylation under LLPS conditions was reduced relative to non-LLPS conditions. The complete autoradiograms are shown in the supplements to this figure. Quantification of FRQ phosphorylation by CK1 at RT under LLPS and non-LLPS conditions with phosphorylation levels under non-LLPS conditions normalized to 1. Note: *** denotes a p-value<<0.05 obtained from a Student’s t-test. (C) DIC microscopy images of 15 μM phase-separated np-FRQ under the same conditions (i.e., buffer and temperature) as the phosphorylation assay shown in (B). Scale bar = 2 μm. (D) X- band (9.8 GHz) RT continuous wave-electron spin resonance (cw-ESR) spectra of FRQ labeled with MTSL at the 490 site in solubilizing buffer (black) and under conditions that promote LLPS (cyan). Data represented as first-derivative spectra, with the horizontal axes depicting the static field strength (typically 3330–3400 G), and the vertical axis depicting the change in magnetic susceptibility with respect to the field, in arbitrary units.
Figure 7—figure supplement 1
Exploring the phase behavior of FRQ.
(A) UV-Vis absorption spectrum of p-FRQ (in 150 mM NaCl, 25 mM Tris pH 8.0) and np-FRQ (in 500 mM NaCl, 25 mM Tris pH 8.0) as a function of temperature at increasing concentrations. Note: the shading around each curve represents the standard deviation from the mean absorbance from two technical replicates. 15 μM p-FRQ had the greatest standard deviation as seen by the largest shaded area. (B) UV-Vis absorption spectrum of p-FRQ and np-FRQ in a non-liquid–liquid phase separation (non-LLPS) promoting buffer as a function of temperature. Note: p-FRQ appears to undergo a small amount of LLPS even in non-LLPS buffer as seen by its relatively high absorbance relative to np-FRQ. (C) (Left) UV-Vis absorption spectrum of p-FRQ (in 150 mM NaCl, 25 mM Tris pH 8.0) and (right) np-FRQ (in 500 mM NaCl, 25 mM Tris pH 8.0) as a function of temperature to check for reversibility of LLPS transition. (D) Differential interference contrast (DIC) micrograph of FRQ showing droplets fusing and docking as indicated within the yellow circles. (E) UV-Vis absorption spectrum of p-FRQ (left) and np-FRQ (right) as a function of temperature in either low salt (150 mM) or high salt (500 mM).
Figure 7—figure supplement 2
Complete autoradiograph of np-FRQ phosphorylation by CK1 and γ-32P-ATP.
Figure 8
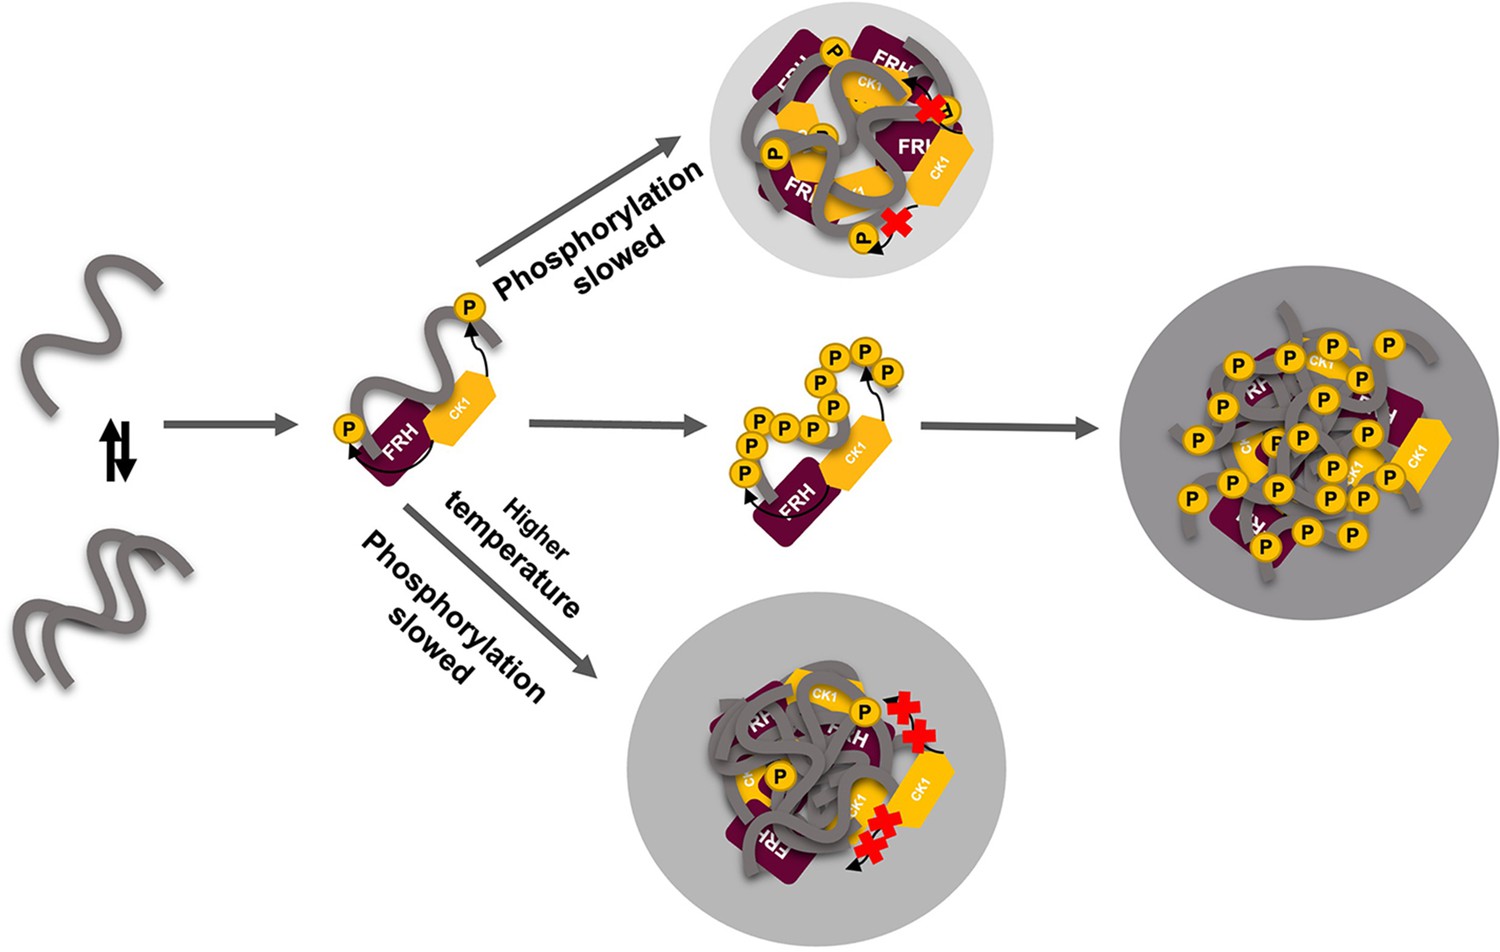
Liquid–liquid phase separation (LLPS) may play a role in temperature compensation of the clock through modulation of FRQ phosphorylation.
Reduced CK1 phosphorylation of FRQ causes both longer periods (Mehra et al., 2009) and loss of temperature compensation (manifested as a shortening of period at higher temperature) (Hu et al., 2021; Liu et al., 2019). Thus, the ability of increased LLPS at elevated temperature (larger gray circle) to reduce FRQ phosphorylation by CK1 will counter a shortening period that would otherwise manifest in an undercompensated system. As further negative feedback, LLPS is also promoted by increased FRQ phosphorylation, which in turn will reduce phosphorylation by CK1. Thus, both increased FRQ phosphorylation and temperature favor LLPS and reduction of CK1 activity.
Author response image 1
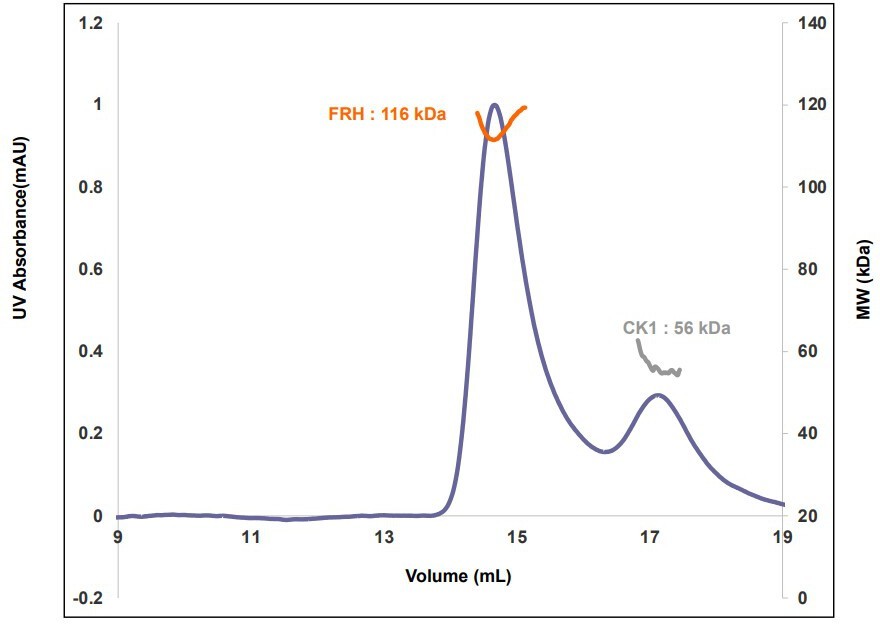
Size-exclusion chromatography- multiangle light scattering (SEC-MALS) of a mixture of purified FRH and CK1.
The proteins elute separately as monomers with no evidence of co-migration.
Videos
Video 1
Visualization of FRQ[mNeonGreen] in living Neurospora, displaying heterogeneous, punctate intranuclear localization.
Images of a single focal plane were acquired in a time series with 300 ms between exposures.
Tables
Table 1
SAXS parameters for p-FRQ, np-FRQ, and their reconstitution into the FFC.
| Rg [Guinier] (Å) | Rg [P(r)] (Å) | Dmax (Å) | MW [VC] (kDa) | |
|---|---|---|---|---|
| p-FRQ | 123 ± 7 | 142 ± 5 | 530 ± 60 | 816 |
| np-FRQ | 100 ± 2 | 116 ± 4 | 446 ± 40 | 680 |
| p-FFC | 101 ± 2 | 136 ± 5 | 510 ± 20 | 314 |
| np-FFC | 8 0 ±2 | 109 ± 7 | 480 ± 10 | 286 |
-
Molecular weight calculations for p-FRQ and np-FRQ are inaccurate because VC (volume of correlation) plots (integrated area of I(q)q vs q; q = 2π/d) did not converge for these species. Expected MW for LFRQ is 110 kDa. Expected FFC MW for the 1:1:1 stoichiometry of FRQ:FRH:CK1 Is 273 kDa. Errors in Dmax were estimated from the range for which P(r) tailed to zero at high distances without constraint.
-
SAXS, size-exclusion chromatography-coupled small-angle X-ray scattering.
Table 2
FRQ cysteine residue locations and context.
| Site | Domain | Binding partner at this region | Reference |
|---|---|---|---|
| 370C | N/A | ||
| 490C | FCD2 | CK1 | Querfurth et al., 2011 |
| 658C | N/A | ||
| 746C | FFD | FRH | Cheng et al., 2005 |
Table 3
FRQ regions that bind clock proteins.
| Binding partner | Region | Cysteine residue(s) present in this region | Reference |
|---|---|---|---|
| FRH | 695–778 | 746C | Cheng et al., 2005 |
| CK1 | 319–326; 488–495 | 490C | Querfurth et al., 2011 |
| WC2 | 490C, 658C, 746C | Guo et al., 2010 |
Table 4
δ values from the cw-ESR central peak for FRQ variants of Figure 3C.
| Site | np-FRQ (G) | p-FRQ (G) |
|---|---|---|
| NT | 1.75 | 1.87 |
| 490C | 1.97 | 2.47 |
| 658C | 1.97 | 2.01 |
| 746C | 1.76 | 1.82 |
| CT | 2.30 | 1.70 |
-
cw-ESR, continuous wave-electron spin resonance.
Table 5
R2 values for the quality of the two-component Gaussian fits to the distance distributions.
| 370 | 490 | 658 | 746 | |
|---|---|---|---|---|
| 370 | 0.99, 0.99 | 0.96, 0.99 | NA, 0.99 | |
| 490 | 0.94, 0.99 | 0.99, 0.99 | ||
| 658 | 0.99, 0.95 | |||
| 746 |
-
There are two values reported in each cell – the first value corresponds to the R2 value for FRQ-only distance while the second value is for the same variant in the FFC complex (i.e., when the FRQ is bound to CK1a and FRH).
Table 6
Calculated values from the UV-Vis turbidity assays of np-FRQ shown in Figure 6C.
| 5 μM | 10 μM | 15 μM | |
|---|---|---|---|
| Mean initial baseline absorbance | 0.02 | 0.08 | 0.13 |
| Temperature of initiation (°C) | 56 | 23 | 21 |
| Cloud point (inflection point) (°C) | 68 | 58 | 57 |
| Absorbance at inflection point | 0.07 | 0.21 | 0.33 |
| Slope at inflection point | 0.01 | 0.02 | 0.03 |
| Mean final baseline absorbance | 0.14 | 0.47 | 0.64 |
-
Initiation temperature was determined as baseline + 5× standard deviation of the baseline.
Table 7
Calculated values from the UV-Vis turbidity assays of p-FRQ shown in Figure 6C.
| 5 μM | 10 μM | 15 μM | |
|---|---|---|---|
| Mean initial baseline absorbance | 0.09 | 0.21 | 0.46 |
| Temperature of initiation (°C) | 45 | 42 | 24 |
| Cloud point (inflection point) (°C) | - | - | - |
| Absorbance at inflection point | - | - | - |
| Slope | 0.00 | 0.01 | 0.02 |
| Mean final baseline absorbance | - | - | - |
-
Initiation temperature was determined as baseline + 5× standard deviation of the baseline. p-FRQ continues to undergo liquid–liquid phase separation within the temperature range of the experiment and thus a cloud point cannot be calculated.
Key resources table
| Reagent type (species) or resource | Designation | Source or reference | Identifiers | Additional information |
|---|---|---|---|---|
| Gene (N. crassa) | LFRQ S513A | Uniprot | Uniprot ID:P19970 | |
| Gene (N. crassa) | FRH | Uniprot | Uniprot ID:Q1K502 | |
| Gene (N. crassa) | CK1 | Uniprot | Uniprot ID:V5IR38 | |
| Strain, strain background (Escherichia coli) | BL21(DE3) | NEB | Catalog #: C2527H | Chemically competent cells |
| Genetic reagent (N. crassa) | frq[mNeonGreen-FLAG] | Bartholomai, 2022a | FungiDB ID: NCU02265 | |
| Genetic reagent (N. crassa) | wc-1[ΔLOV] | Bartholomai, 2022a | FungiDB ID: NCU02356 | |
| Genetic reagent (N. crassa) | son-1[mApple] | Wang et al., 2023; https://doi.org/10.1016/j.fgb.2022.103763 | FungiDB ID: NCU04288 | |
| Genetic reagent (N. crassa) | ∆mus-51 | Colot et al., 2006; https://doi.org/10.1073/pnas.0601456103 | FungiDB ID: NCU08290 | |
| Cell line (include species here) | Neurospora crassa frq[mNeonGreen-FLAG] hph+, wc-1[ΔLOV] bar+, csr-1::pNCU04502- NCU04288(son-1)[mApple], ∆mus-51::bar | Bartholomai, 2022a | frq and wc-1 modified by targeted insertion at their resident loci using hph or bar respectively as selectable markers, son-1[mApple] inserted by targeted transformation to csr-1, mus-51 replaced by bar | |
| Transfected construct (include species here) | Neurospora crassa frq[mNeonGreen-FLAG] hph+, wc-1[ΔLOV] bar+, csr-1::pNCU04502-NCU04288(son-1)[mApple], ∆mus-51::bar | Bartholomai, 2022a | frq and wc-1 modified by targeted insertion at their resident loci using hph or bar respectively as selectable markers, son-1[mApple] inserted by targeted transformation to csr-1, mus-51 replaced by bar | |
| Biological sample (include species here) | ||||
| Antibody | (Include host species and clonality) | (include dilution) | ||
| Recombinant DNA reagent | pET-28a | Novagen | Catalog #: 69864–3 | |
| Recombinant DNA reagent | LFRQ_ 370 S | This paper | pET28 a backbone with twin strep tag Primers- GCGCGAAGCTTCAATCCAACTACAG CTGTAGTTGGATTGAAGCTTCGCGC | |
| Recombinant DNA reagent | LFRQ_ 490 S | This paper | pET28 a backbone with twin strep tag Primers- CAATCTGCTTTCAAACCTGGCCCAG CTGGGCCAGGTTTGAAAGCAGATTG | |
| Recombinant DNA reagent | LFRQ_658 S | This paper | pET28 a backbone twin strep tag Primers- CGCTCCATTTTCAACCGATCTTTC GAAAGATCGGTTGAAAATGGAGCG | |
| Recombinant DNA reagent | LFRQ_746 S | This paper | pET28 a backbone with twin strep tag Primers- GTCTTCCCATGGAGTGAGGATCCTGC GCAGGATCCTCACTCCATGGGAAGAC | |
| Recombinant DNA reagent | LFRQ_LPGTG | This paper | pET28 a backbone with twin strep tag Primers- CGATGGAGGACGTCTCATCCTCGCTGCCGGGCACCGGCT TTAAGCATTATGCGGCCGCTCAGCCGGTGCCCGGCAG | |
| Recombinant DNA reagent | ENLYFQGL_LFRQ | This paper | pET28 a backbone Primers- CCTGTACTTCCAAGGACTAGGAATGGCCGATAG CTATCGGCCATTCCTAGTCCTTGGAAGTACAGG | |
| Sequence-based reagent | ||||
| Peptide, recombinant protein | BSA | Sigma | CAS #: 9048-46-8 | |
| Peptide, recombinant protein | GGGGC | Chandrasekaran et al., 2021 https://doi.org/10.1038/s42003-021-01766-2 | ||
| Peptide, recombinant protein | CNGL | Nguyen et al., 2015 https://doi.org/10.1002/ange.201506810 | ||
| Peptide, recombinant protein | SortaseA | Chandrasekaran et al., 2021 https://doi.org/10.1038/s42003-021-01766-2 | ||
| Peptide, recombinant protein | AEP1 | Nguyen et al., 2015 https://doi.org/10.1002/ange.201506810 | ||
| Commercial assay or kit | ||||
| Chemical compound, drug | MTSL | Cayman Chemicals | CAS #: 81213-52-7 | |
| Chemical compound, drug | ADP-β-S-SL | Muok et al., 2018 https://doi.org/10.1007/s00723-018-1070-6 | ||
| Chemical compound, drug | Cy5-Maleimide | Cytiva | PA25031 | |
| Chemical compound, drug | [γ–32P] ATP | PerkinElmer | BLU002A001MC | |
| Software, algorithm | ASTRA IV | Wyatt Technology | ||
| Software, algorithm | RAW | Hopkins et al., 2017 https://doi.org/10.1107/S1600576717011438 | ||
| Software, algorithm | GraphPad | Dotmatics | ||
| Software, algorithm | Fiji | Schindelin et al., 2012; doi:10.1038/nmeth.2019 | ||
| Software, algorithm | Matlab | MathWorks | ||
| Software, algorithm | localCIDER | Holehouse et al., 2017 https://doi.org/10.1016/j.bpj.2016.11.3200 | ||
| Software, algorithm | IUPred2A | Mészáros et al., 2018 https://doi.org/10.1093/nar/gky384 | ||
| Software, algorithm | Agadir | Muñoz and Serrano, 1994 https://doi.org/10.1038/nsb0694-399 | ||
| Software, algorithm | AlphaFold2.0 | Jumper et al., 2021 https://doi.org/10.1038/s41586-021-03819-2 | ||
| Software, algorithm | PScore | Vernon et al., 2018; https://doi.org/10.7554/eLife.31486 | ||
| Software, algoritm | catGRANULE | Bolognesi et al., 2016 https://doi.org/10.1016/j.celrep.2016.05.076 | ||
| Other |
Additional files
Download links
A two-part list of links to download the article, or parts of the article, in various formats.
Downloads (link to download the article as PDF)
Open citations (links to open the citations from this article in various online reference manager services)
Cite this article (links to download the citations from this article in formats compatible with various reference manager tools)
Phosphorylation, disorder, and phase separation govern the behavior of Frequency in the fungal circadian clock
eLife 12:RP90259.
https://doi.org/10.7554/eLife.90259.3


