Unveiling the signaling network of FLT3-ITD AML improves drug sensitivity prediction
- Cellular and Molecular Biology, Department of Biology, University of Rome Tor Vergata, Italy
- Department of Biology, University of Rome Tor Vergata, Italy
- Sezione di Ematologia, Dipartimento di Scienze Radiologiche ed Ematologiche, Università Cattolica del Sacro Cuore, Italy
- Dipartimento di Diagnostica per Immagini, Radioterapia Oncologica ed Ematologia, Fondazione Policlinico A. Gemelli IRCCS, Italy
- Health Campus for Inflammation, Immunity and Infection (GCI3), Otto-von-Guericke University of Magdeburg, Germany
- Department of Hematology and Oncology, Otto-von-Guericke University of Magdeburg, Germany
- Institute of Molecular and Clinical Immunology, Otto-von-Guericke University of Magdeburg, Germany
- Department of Biology, Fondazione Human Technopole, Italy
- Telethon Institute of Genetics and Medicine (TIGEM), Italy
Figures
Figure 1
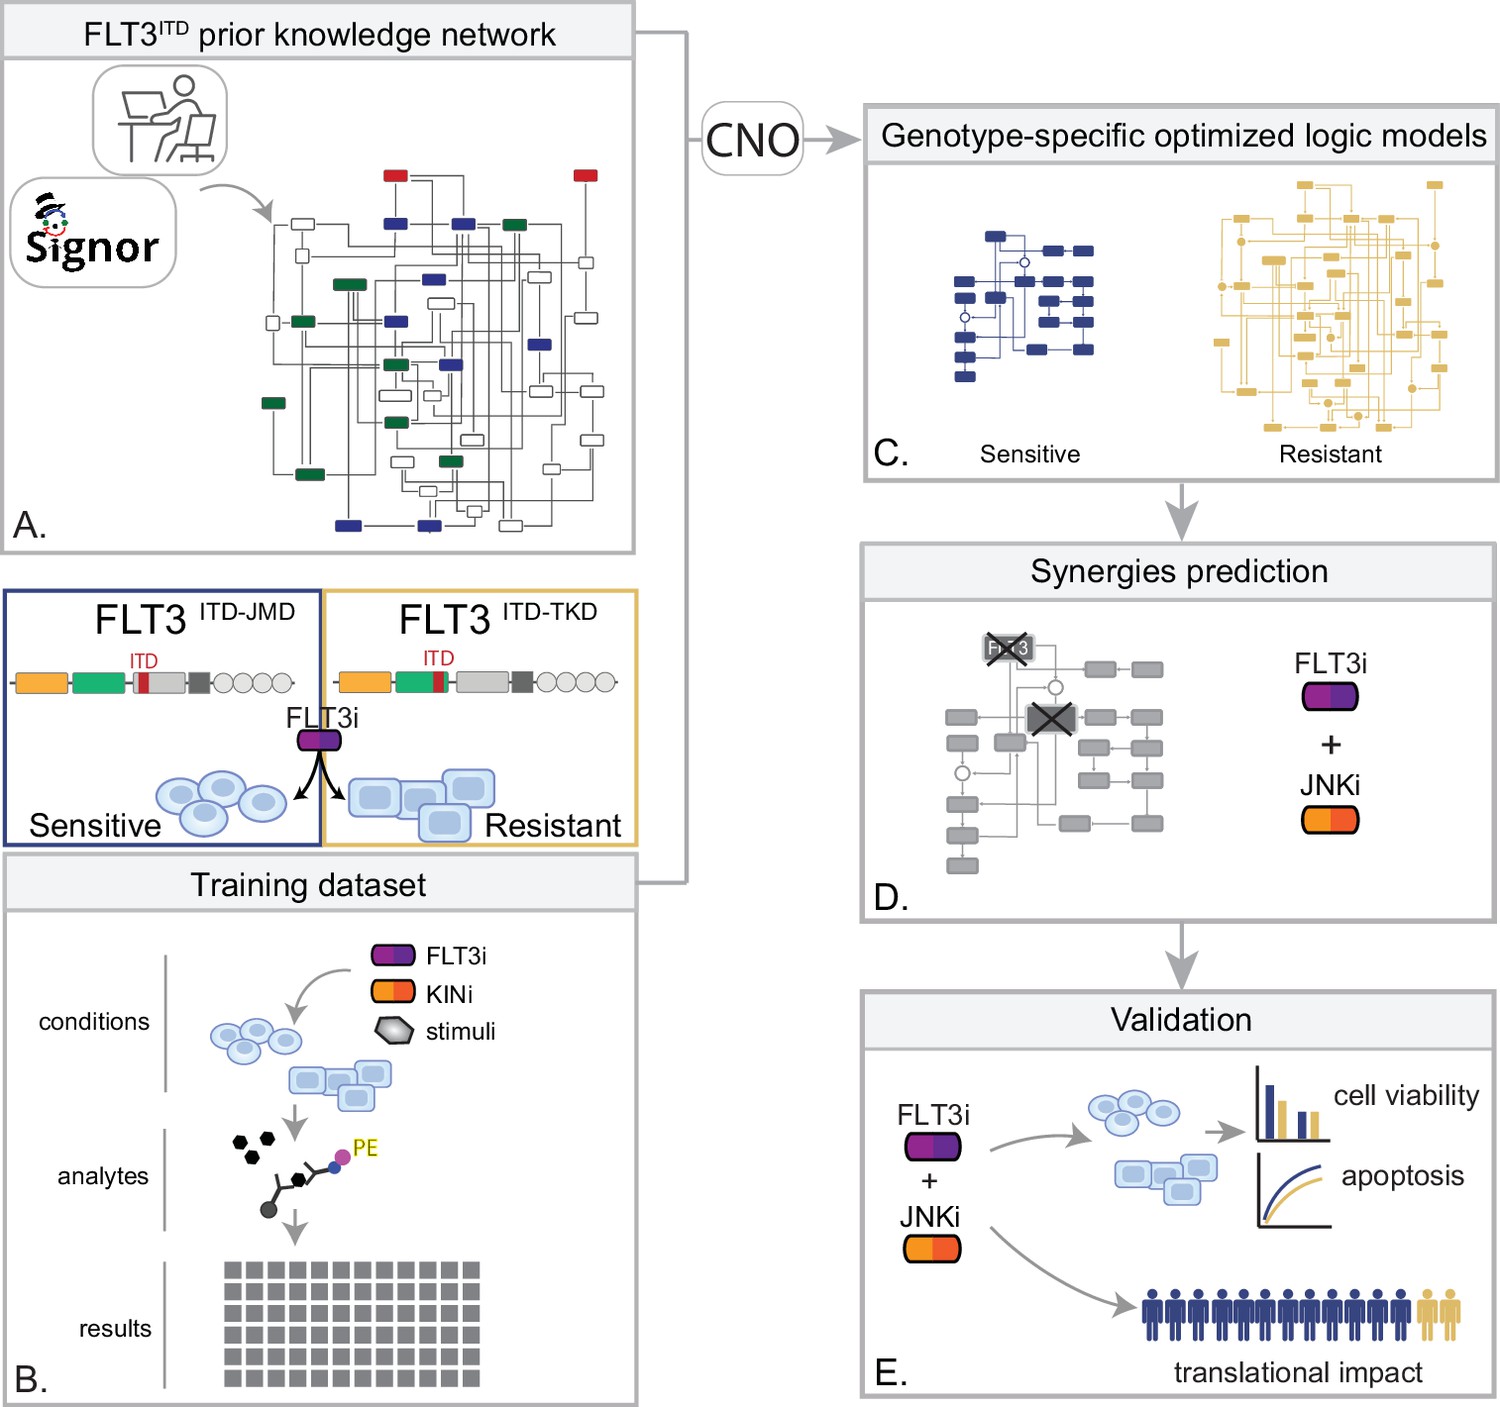
Summary of the experimental strategy.
(A) Manual curation of FLT3-internal tandem duplication (ITD)-specific prior knowledge network (PKN). (B) Multiparametric analysis of signaling perturbations in tyrosine kinase inhibitor (TKI)-sensitive and TKI-resistant cells. (C) Model generation through the CellNOptR tool. (D) Prediction of combinatorial treatments restoring TKI sensitivity. (E) In vitro validation of novel combinatorial treatments.
Figure 2 with 3 supplements
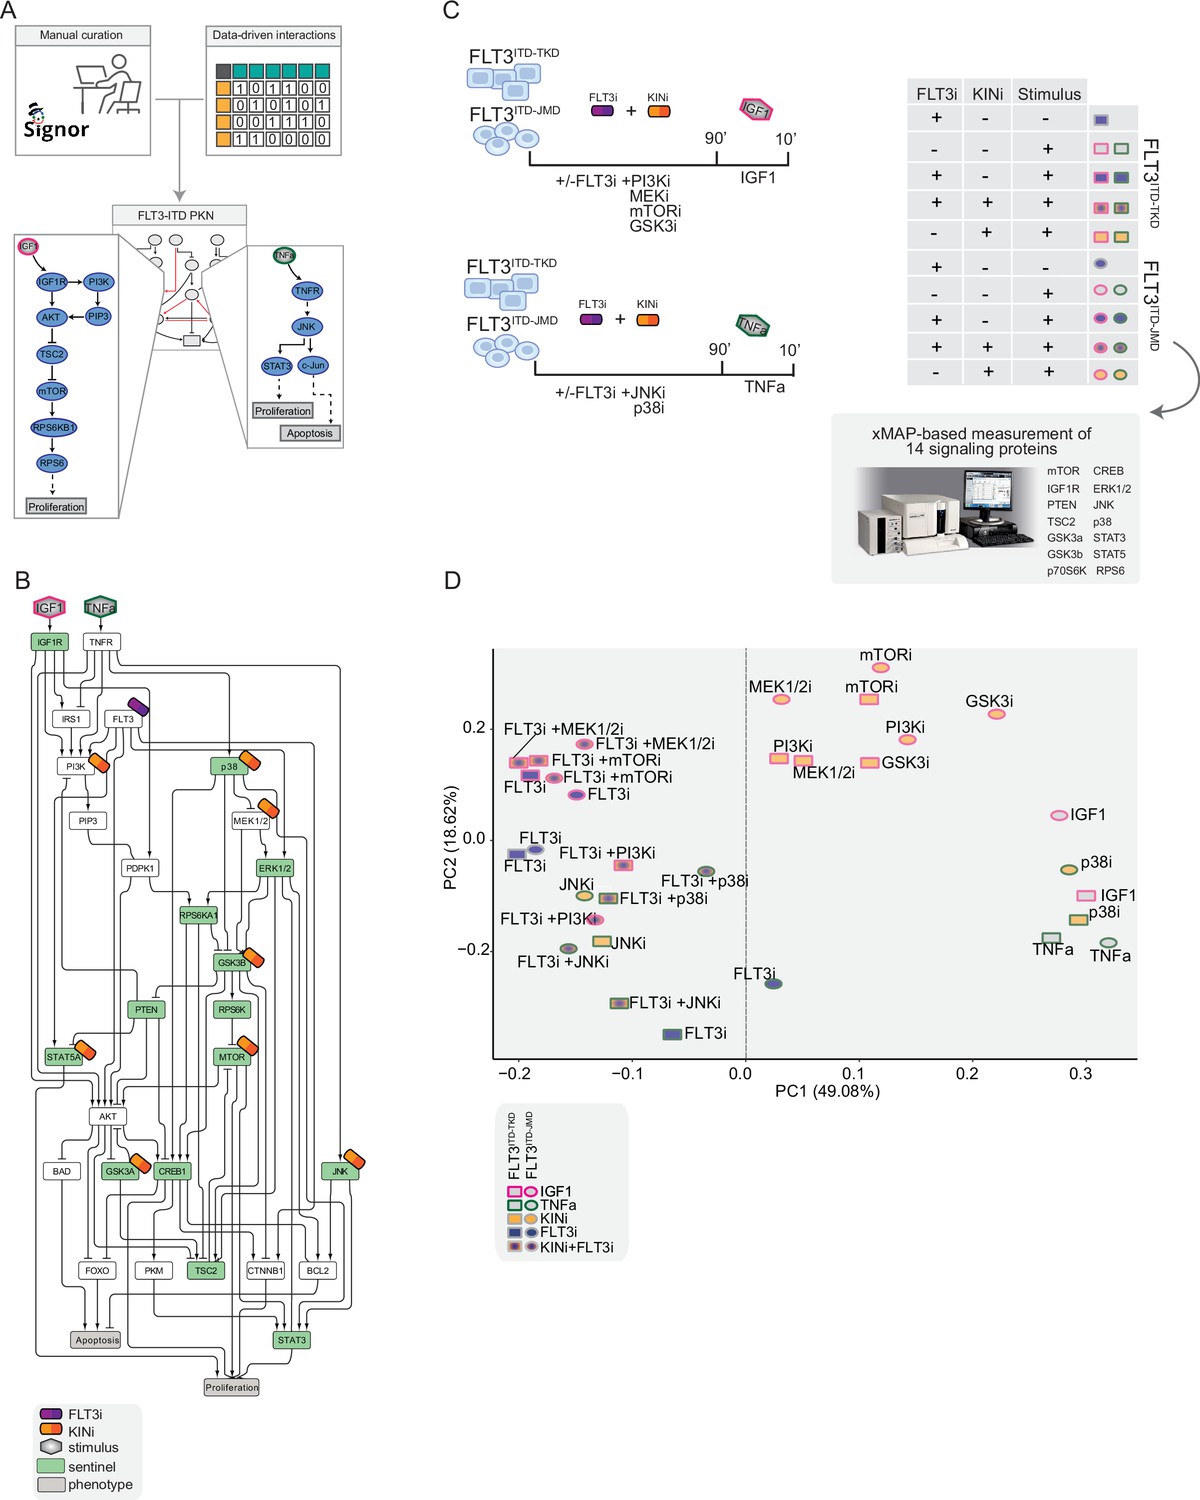
Generation of the training dataset.
(A) Schematic representation of the FLT3-internal tandem duplication (ITD) prior knowledge network (PKN) manual curation, integration of data-driven edges, and manual integration of RTKs pathways involved in acute myeloid leukemia (AML). (B) Schematic representation of the experimental design: FLT3ITD-JMD and FLT3ITD-TKD cells were cultured in starvation medium (w/o FBS) overnight and treated with PI3Ki, MEKi, mTORi, and GSK3i, JNKi and p38i, in presence or absence of the FLT3i Midostaurin for 90 min. Then, the cells were stimulated either with IGF1 or TNFα for 10 min. Control cells were starved and treated with Midostaurin for 90 min. After treatment, samples were collected, and cell lysates were analyzed with an xMAP-based assay through the MagPix instrument. Per each experimental condition, we measured the phosphorylation levels of 14 sentinels. (C) Network representation of a compressed PKN that shows the essential pathways monitored through the perturbation experiment. The perturbed nodes are tagged with a drug icon, and the measured nodes are colored green. (D) Principal component analysis (PCA) of FLT3ITD-JMD and FLT3ITD-TKD cells in the multiparametric analysis. Each point represents a different experimental condition.
Figure 2—figure supplement 1

FLT3-internal tandem duplication (ITD) manually curated prior knowledge network (PKN).
Network representation of the PKN, each node represents a protein, a cytokine (green) or a small molecule inhibitor (yellow). The proteins are colored following the CNO pipeline graphics: target proteins in red, sentinel proteins in blue, and essential nodes in white. The edges represent the directed interactions between the nodes: arrowhead when the interaction is activatory, hammerhead when the interaction is inhibitory.
Figure 2—figure supplement 2

Global overview of multiparametric data.
(A–B) Heatmap showing the Pearson correlation coefficients between the different biological replicates in FLT3 ITD-JMD cells (A) and FLT3 ITD-TKD cells (B). (C) Heatmap of the complete dataset representing the activity of each analyte (rows) in all the experimental conditions (columns). Each square is colored according to the activity of the analyte in each experimental condition (from active(1)=red to inactive(0)=blue). Black squares highlight the activity of specific analytes upon their direct or upstream inhibition. (D) Unsupervised, hierarchical clustering of the intensity of the measured sentinel proteins discriminates samples according to the treatment. (E) Unsupervised, hierarchical clustering allows the classification of the sentinel proteins according to their role (red) and pathway (gray, purple, and blue).
Figure 2—figure supplement 3

Normalization of analytes activity through Hill curves.
Experimental data were normalized and scaled from 0 to 1 using analyte-specific Hill functions. Raw data are reported as triangles, normalized data, and squares. FLT3 ITD-JMD (A) and -TKD (B) plots are blue and yellow, respectively.
Figure 3 with 2 supplements
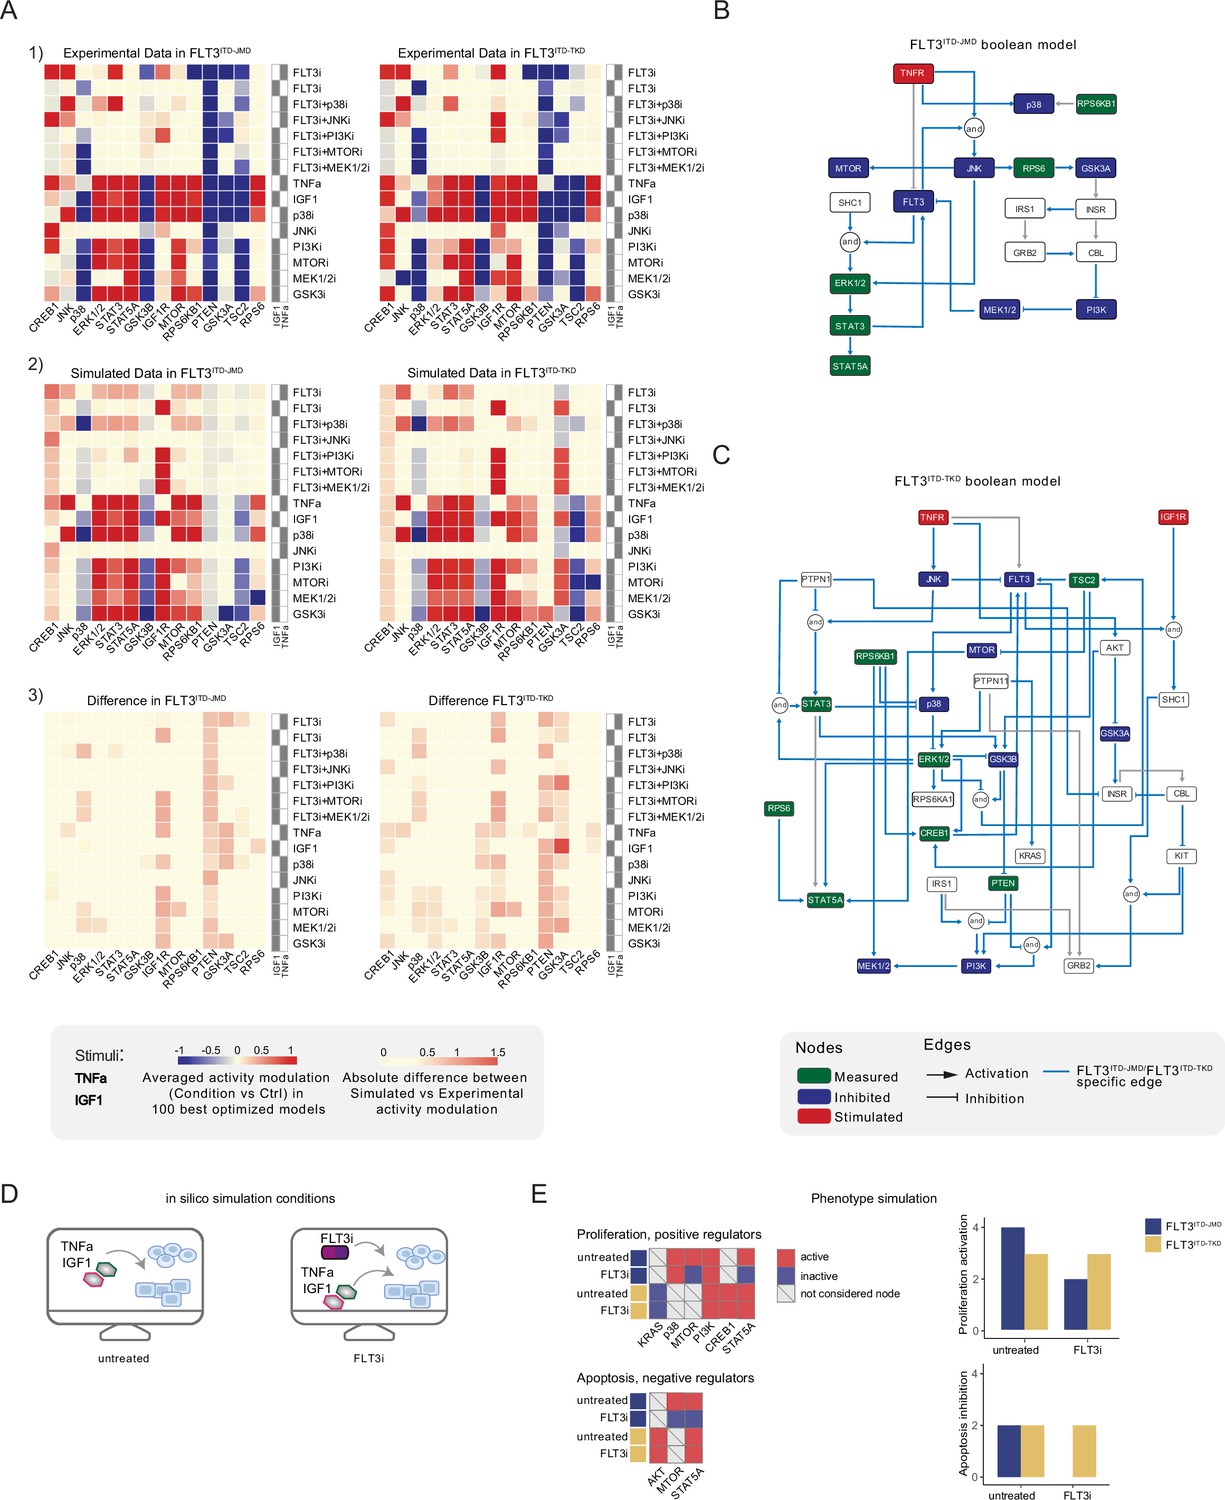
Optimized Boolean models recapitulate the different sensitivity of FLT3ITD-JMD and FLT3ITD-TKD cells to tyrosine kinase inhibitor (TKI).
(A) Color-coded representations of the experimental activity modulation (T90–T0) of sentinel proteins used to train the two Boolean models (upper panel) and the average prediction of protein activities in the family of 100 best models (central panel). The protein activity modulation ranges from –1 to 1 and is represented with a gradient from blue (inhibited) to red (activated). The absolute value of the difference between experimental and simulated protein activity modulation (lower panel) is reported as a gradient from light yellow (error <0.5) to red (1.85). (B–C) FLT3ITD-JMD (B) and FLT3ITD-TKD (C) high-confidence Boolean models. Perturbed proteins in the experimental setup are marked in red or green if inhibited or stimulated, respectively. Sentinel proteins are reported in blue. The edges’ weight represents their frequency in the family of 100 models and only the high-confidence ones (frequency >0.4) are reported. Orange edges are cell-specific links. (D) Cartoon of the in silico conditions simulated to analyze the different TKI sensitivity of the FLT3ITD-JMD and FLT3ITD-TKD Boolean models. Untreated condition: TNFα+IGF1; FLT3i: TNFα+IGF1+FLT3 inhibition. (E) Heatmaps (left) report the activation level of positive and negative phenotype regulators present in the two Boolean models. Bar plots (right) showing the proliferation activation and apoptosis inhibition levels in untreated and FLT3i conditions in the steady states of FLT3ITD-JMD (blue) and FLT3ITD-TKD (yellow) Boolean models.
Figure 3—figure supplement 1
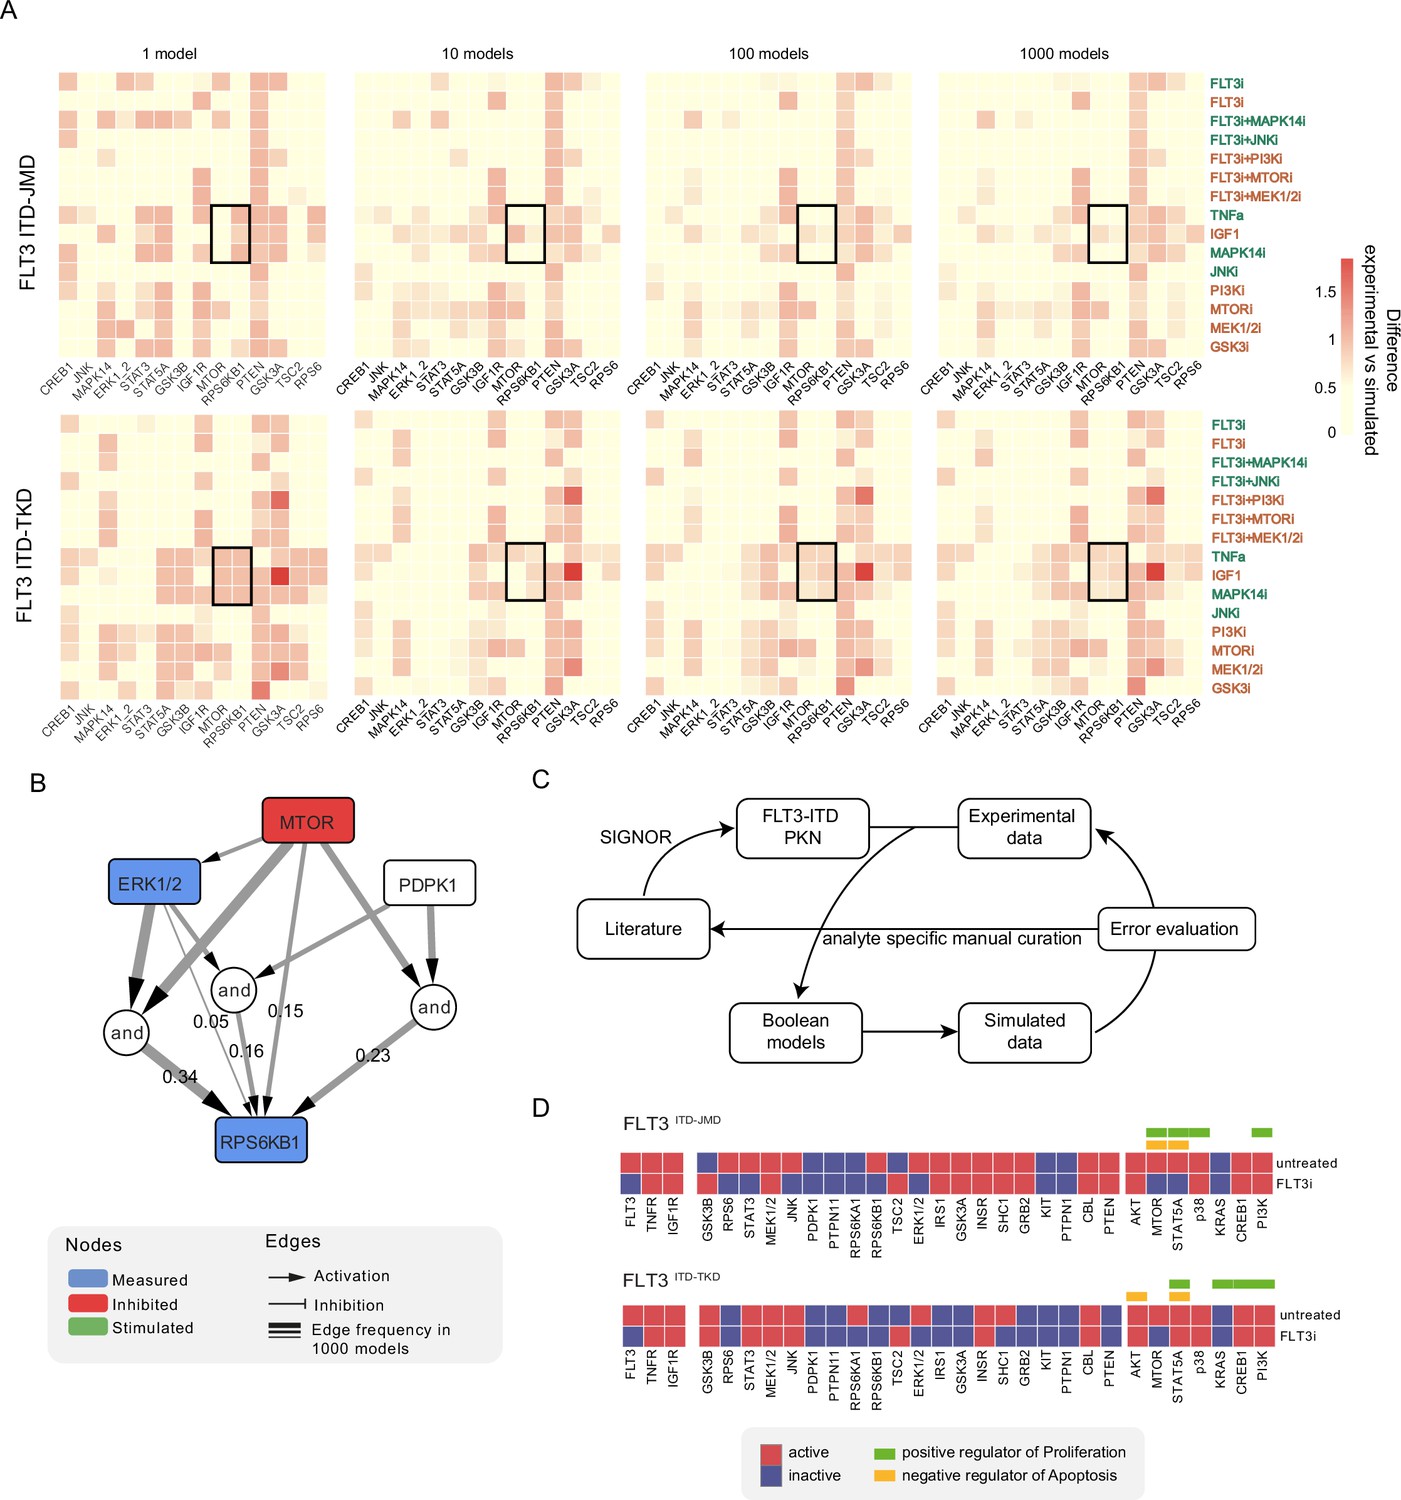
Overview of the optimized Boolean models.
(A) Heatmaps represent the absolute value of the difference between model simulation results to normalized experimental data in a color-coded from light yellow to red. Simulation results of the average of respectively 1, 10, 100, and 1000 models are shown. Squared areas represent subpictures showing that a plateau in the difference is reached averaging 100 models. (B) The subnetwork of the regulation of RPS6KB1, derived from the FLT3 ITD-TKD Boolean model, shows that the family of 1000 models may contain different paths to the same node with similar frequencies. (C) Prior knowledge network (PKN) refinement cycle. We first constructed the FLT3-internal tandem duplication (ITD) PKN extracting the interactions from SIGNOR. Hence, the PKN was trained against the experimental data to produce the Boolean models. The simulated protein values were compared to the experimental data to evaluate the error. When we noticed that the error was systematic (e.g. the error was high for all the measurements of a specific analyte), we manually curated the interactions to improve the predictive abilities of the model. (D) Steady states of FLT3 ITD-JMD (upper panel) and TKD (lower panel) Boolean models in FLT3 inhibition and control conditions. Proteins are red (active) or blue (inactive). The regulators of proliferation and apoptosis are reported in green and orange, respectively.
Figure 3—figure supplement 2
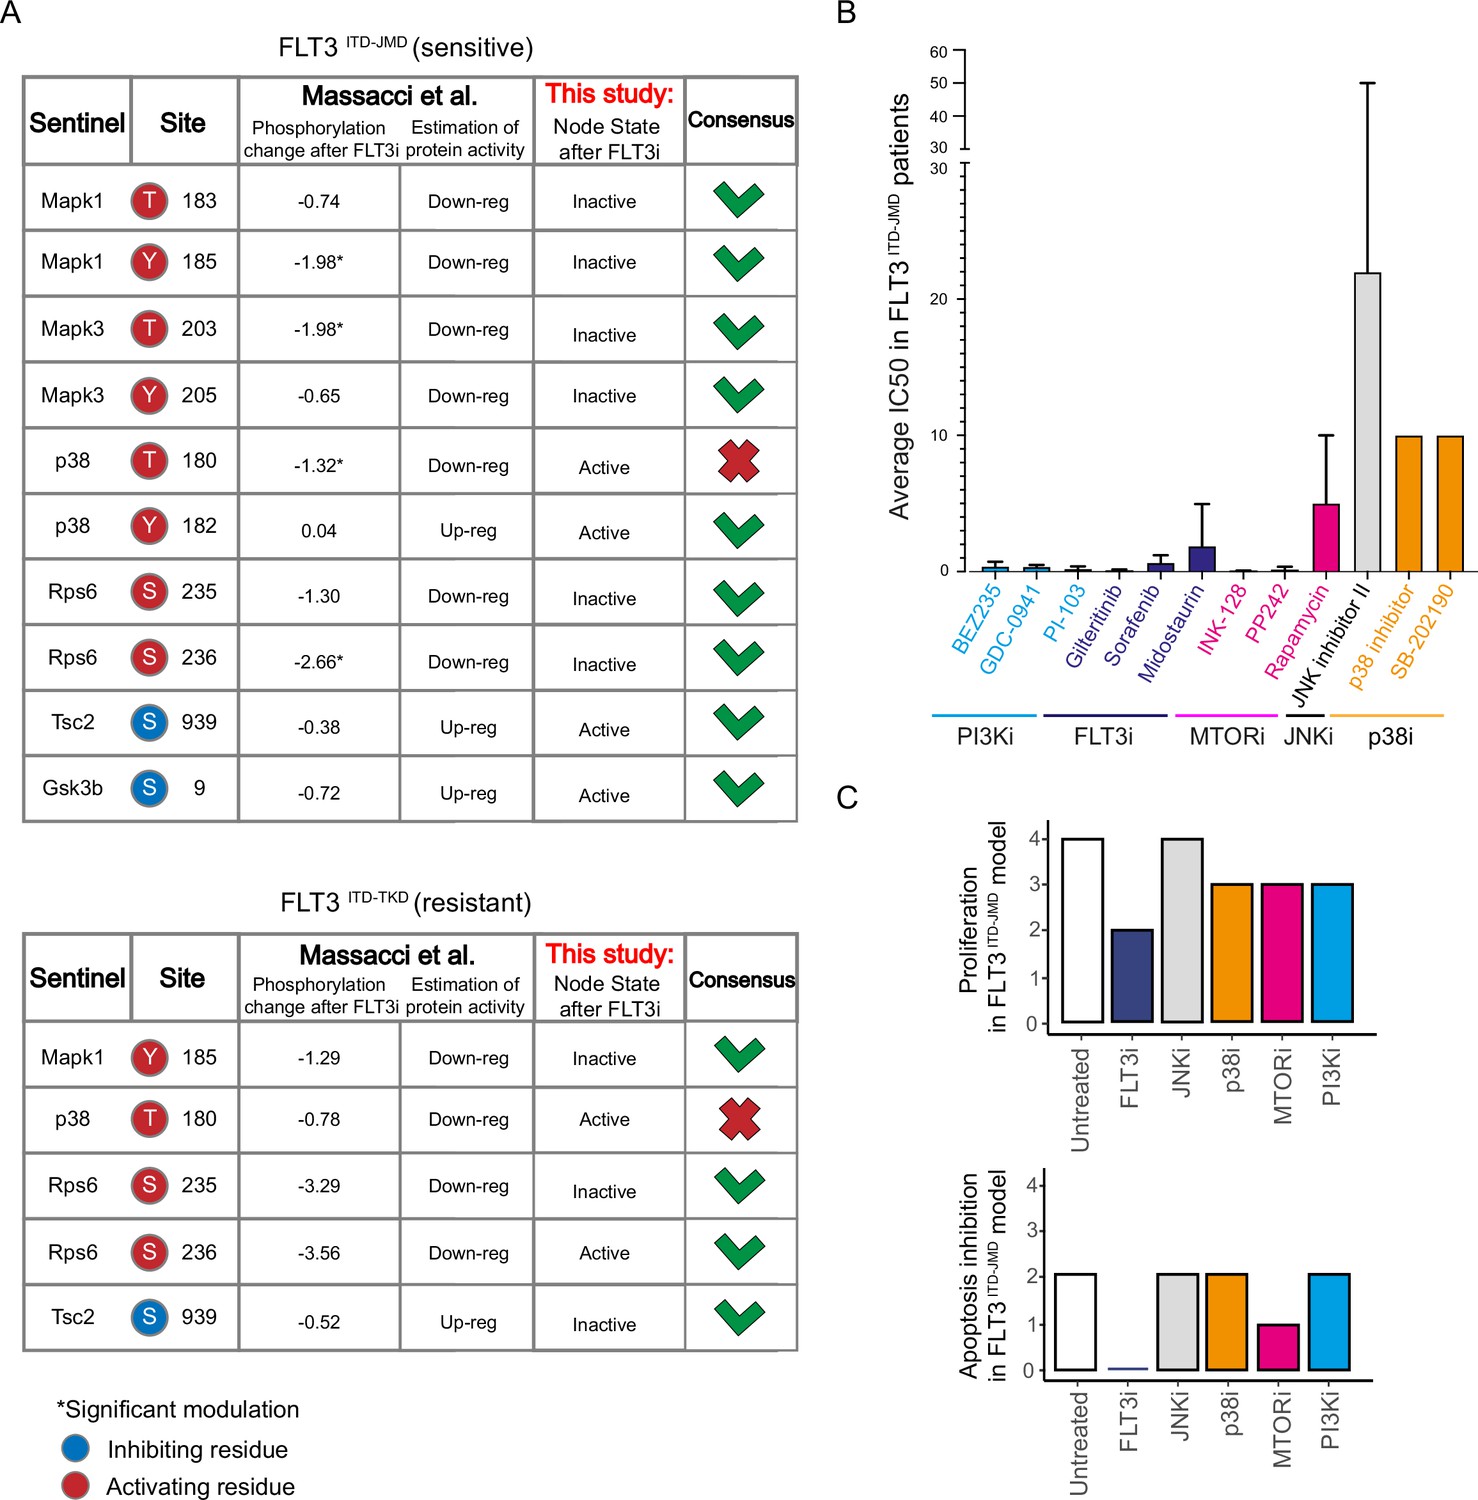
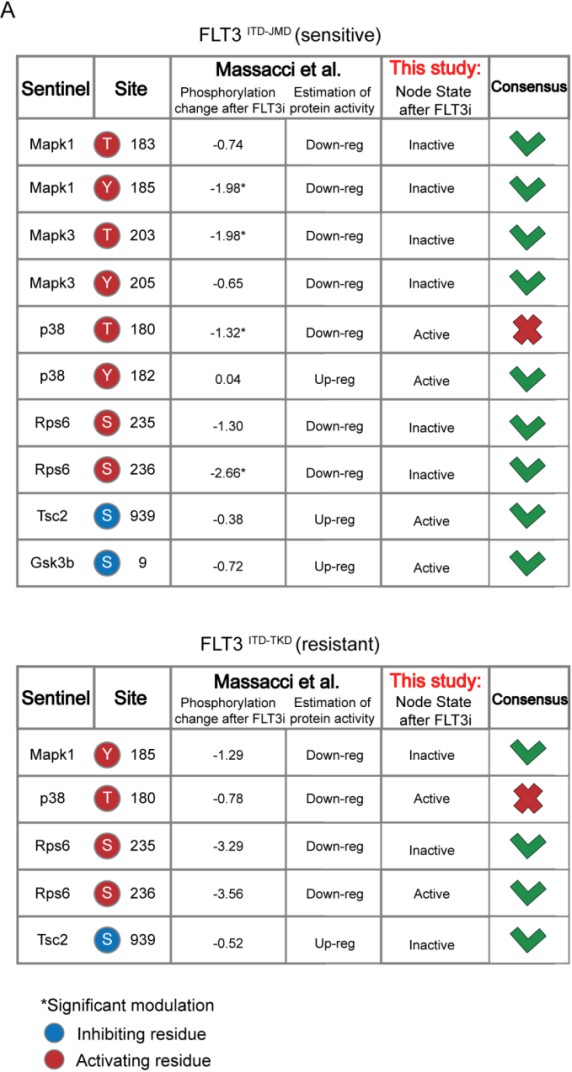
Validation of FLT3-internal tandem duplication (ITD)-specific models on real-world independent datasets.
(A) Comparison of our models’ steady states upon FLT3 inhibition with data from Massacci et al., 2023, paper. The agreement between the activation status of nodes in the FLT3ITD-JMD (upper table) and FLT3ITD-TKD (lower table) models with level of regulatory phosphorylation in the reference dataset is shown in the consensus column. (B) Bar plot reporting the average IC50 values of 134 FLT3ITD-JMD positive patient-derived primary blasts exposed to the indicated drug treatments. (C) Bar plots depicting the in silico proliferation activation (up) and apoptosis inhibition (down) levels of FLT3ITD-JMD model in untreated condition (white) and following in silico treatment with single kinase inhibitors tested in Beat acute myeloid leukemia (AML) dataset (FLT3i, JNKi, p38, MTORi, and PI3Ki in blue, gray, orange, purple, sky blue, respectively).
Figure 4 with 1 supplement
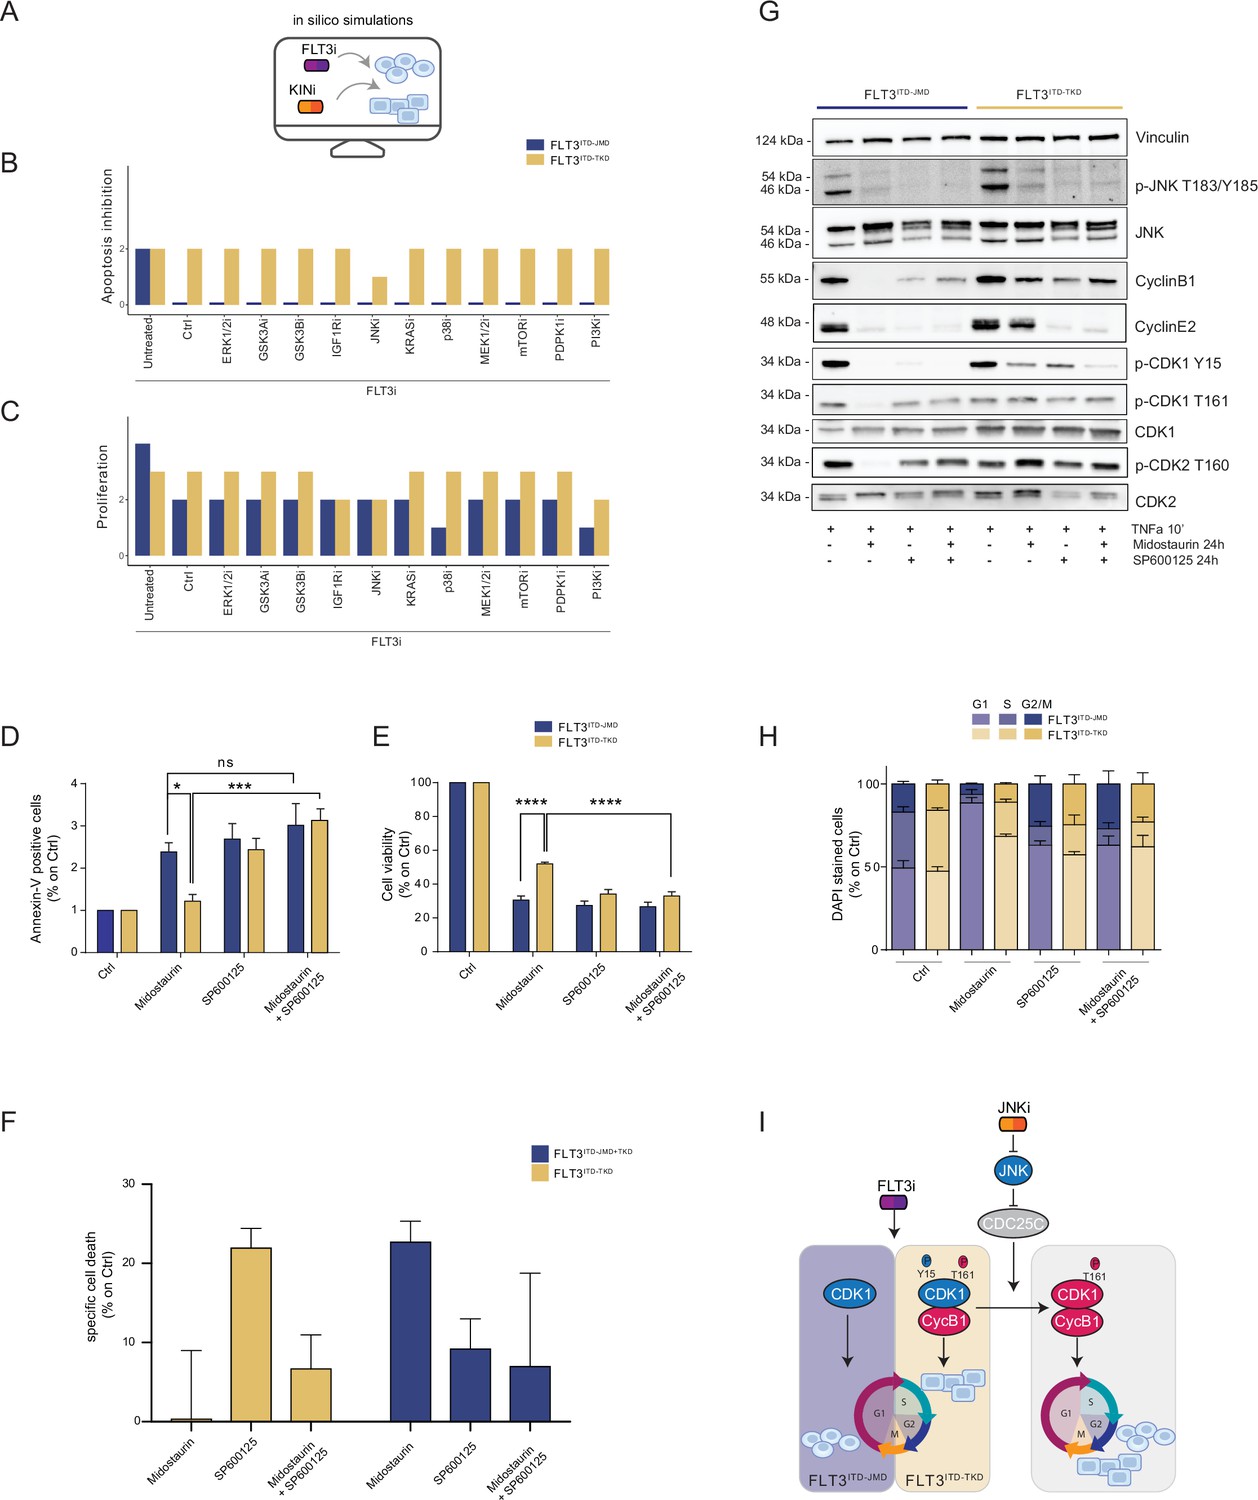
In silico simulation of the FLT3ITD-TKD logic model allows the prediction of novel combinatorial treatment reverting tyrosine kinase inhibitor (TKI) resistance.
(A) Cartoon of the in silico simulation conditions. (B–C) Bar plot showing the in silico simulation of proliferation activation (B) and apoptosis inhibition (C) levels in untreated and FLT3i conditions in combination with knock-out of each of 10 crucial kinases in FLT3ITD-JMD (blue) and -TKD (yellow) cells. (D–E) In FLT3ITD-JMD (blue) and -TKD (yellow) cells treated with 100 nM Midostaurin and/or 10 µM SP600125 (JNK inhibitor) for 24 hr, the percentage of Annexin V positive cells (D) and the absorbance values at 595 nm (E), normalized on control condition, are reported in bar plots. (F) Primary samples from acute myeloid leukemia (AML) patients with the FLT3ITD-TKD mutation (n=2, yellow bars) or the FLT3ITD-JMD/TKD mutation (n=3, blue bars) were exposed to Midostaurin (100 nM, PKC412), and JNK inhibitor (10 µM, SP600125) for 48 hr, or combinations thereof. The specific cell death of gated AML blasts was calculated to account for treatment-unrelated spontaneous cell death. The bars on the graph represent the mean values with standard errors. (G) In FLT3ITD-JMD (blue) and FLT3ITD-TKD (yellow) cells treated with 100 nM Midostaurin and/or 10 µM SP600125, followed by 10’ of TNFα 10 ng/ml, the protein levels of phospho-JNK (T183/Y185), JNK, phospho-CDK1 (Y15), phospho-CDK1 (T161), CDK1, phospho-CDK2 (T160), CDK2, CyclinB1, CycinE2, and Vinculin were evaluated by western blot analysis. (H) Cytofluorimetric cell cycle analysis of DAPI-stained FLT3ITD-JMD (blue) and FLT3ITD-TKD (yellow) cells treated with 100 nM Midostaurin and/or 10 µM SP600125 (JNK inhibitor) for 24 hr. (I) Cartoon of the molecular mechanism proposed for FLT3ITD-JMD and FLT3ITD-TKD cells.
-
Figure 4—source data 1
Original files for the western blot analysis in Figure 4G of phospho-JNK(T183/Y185), JNK, phospho-CDK1 (Y15), phospho-CDK1 (T161), CDK1, phospho-CDK2(T160), CDK2, CyclinB1, CycinE2, and Vinculin.
- https://cdn.elifesciences.org/articles/90532/elife-90532-fig4-data1-v1.zip
-
Figure 4—source data 2
PDF containing Figure 4G and original scans for the western blot analysis of phospho-JNK(T183/Y185), JNK, phospho-CDK1 (Y15), phospho-CDK1 (T161), CDK1, phospho-CDK2(T160), CDK2, CyclinB1, CycinE2, and Vinculin, with highlighted band.
- https://cdn.elifesciences.org/articles/90532/elife-90532-fig4-data2-v1.pdf
Figure 4—figure supplement 1

Quantification of western blot analysis of cell cycle proteins.
(A–B) Bar plot showing the absorbance values at 595 nm normalized on control conditions for FLT3 ITD-JMD (yellow) and -TKD (blue) cells treated with Midostaurin and/or UO126 (MEK inhibitor) (A) and with Midostaurin and/or SB203580 (p38 inhibitor) (B). (C–H) Bar plots showing the densitometric quantification of the representative western blots for the proteins: phpspho-CDK1 Y15 (C), phospho-CDK1 T161 (D), phospho-CDK2 T160 (E), phospho-JNK (F), CyclinB1 (G), CyclinE2 (H).
Figure 5 with 2 supplements
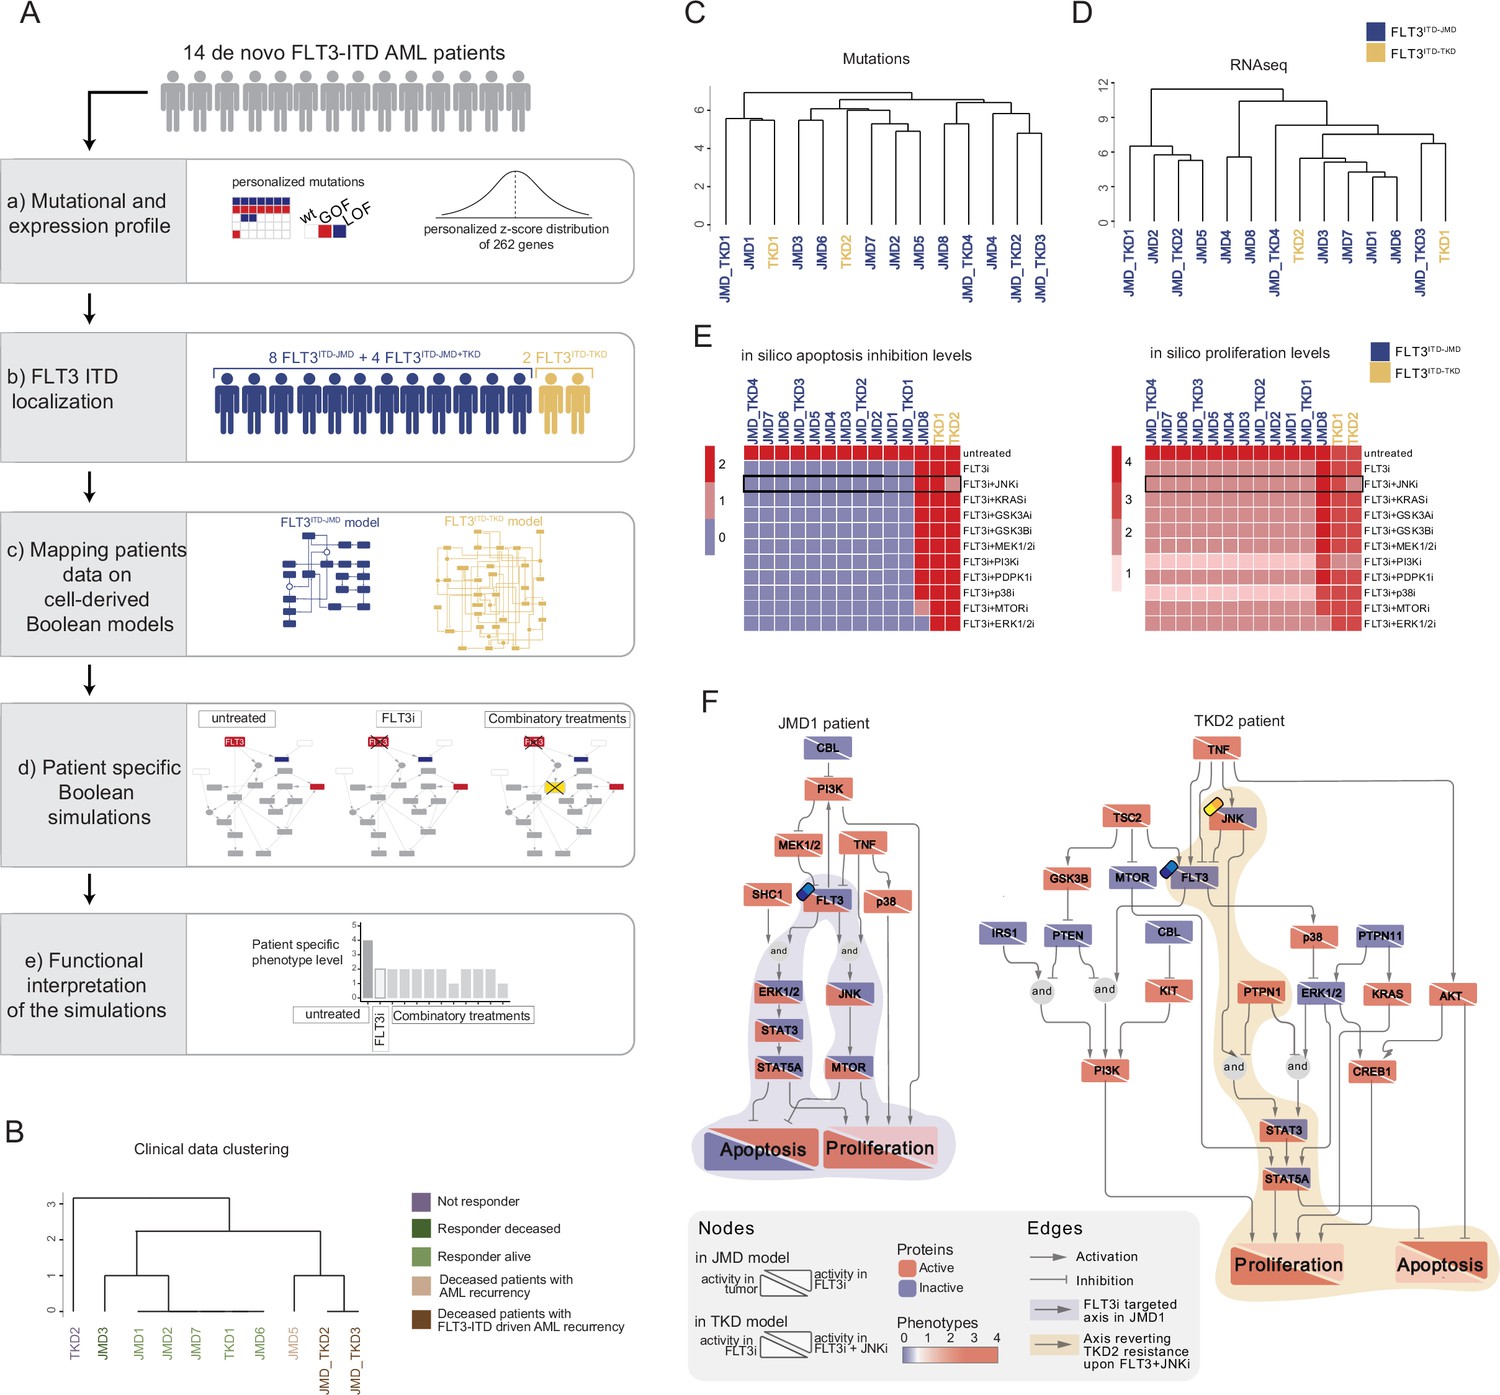
FLT3-internal tandem duplication (ITD) patient-specific Boolean models.
(A) Schematic representation of our computational approach to obtain personalized logic models. (B) Hierarchical clustering of patients according to their clinical characteristics (response to chemotherapy, vital status, and acute myeloid leukemia [AML] recurrence). Resistant, alive or deceased responders, and deceased with general or FLT3-ITD AML recurrence patients are reported in purple, light or dark green, and light or dark brown, respectively. (C–D) Hierarchical clustering of patients according to their mutational profile (C) and their expression profile of 262 genes (D). (E) Heatmap representing patient-specific in silico apoptosis inhibition (left panel) and proliferation levels (right panel) upon each simulation condition. (F) Patient-specific (JMD1 and TKD2) Boolean models. In the JMD1 model (left panel), nodes’ activity has been simulated in control (bottom-left part) and FLT3 inhibition conditions (upper-right part). In the TKD2 model (right panel), nodes’ activity has been simulated in FLT3 inhibition (bottom-left part) and FLT3 and JNK co-inhibition conditions (upper-right part).
Figure 5—figure supplement 1

Overview of patient-specific Boolean models.
(A) Heatmap showing the mutational profile (columns) of each patient (rows). Acute myeloid leukemia (AML) driver genes are highlighted with black squares. White, blue, and red squares represent wild-type genes, ‘loss of function’ (LOF) and ‘gain of function’ (GOF) mutations, respectively. (B) Bar plot reporting the number of mutations for each patient. The red line represents the average number of mutations (55). (C) Principal component analysis (PCA) of patients’ expression profile. (D) Heatmap reporting the mutational profile of patients restricted to genes present in the cell-derived Boolean model. White, blue, and red squares represent wild-type genes, ‘LOF’‘ and ‘GOF’ mutations, respectively. (E) Each couple of bar plots show the in silico apoptosis inhibition (right) and proliferation activation (left) levels in control and FLT3 inhibition conditions in combination with the knock-out of each of 10 kinases in FLT3 ITD-JMD and FLT3 ITD-JMD+TKD (blue) and FLT3 ITD-TKD (blue) patients.
Figure 5—figure supplement 2

Personalized Boolean models.
(A) High-confidence Boolean models of representative patients (JMD1, JMD8, JMD-TKD1, TKD2). Nodes are color-coded according to their activity upon in silico simulation of FLT3 inhibition. (B) High-confidence Boolean model of TKD2 patient shows how the combined inhibition of FLT3 and JNK in silico reverts the tyrosine kinase inhibitor (TKI) resistance.
Author response image 1
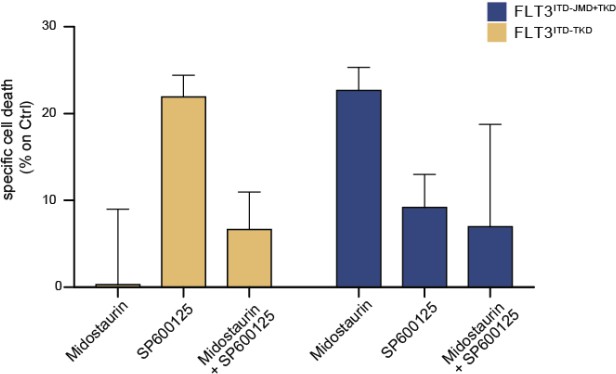
Primary samples from AML patients with the FLT3ITD-TKD mutation (n=2, yellow bars) or the FLT3ITD-JMD/TKD mutation (n=3, blue bars) were exposed to Midostaurin (100nM, PKC412), and JNK inhibitor (10µM, SP600125) for 48 hours, or combinations thereof.
The specific cell death of gated AML blasts was calculated to account for treatment-unrelated spontaneous cell death. The bars on the graph represent the mean values with standard errors.
Author response image 2

Partial Figure of normalization of analytes activity through Hill curves.
Experimental data were normalized and scaled from 0 to 1 using analyte-specific Hill functions. Raw data are reported as triangles, normalized data and squares. Partial Figure representing three plots of the FLT3 ITD-JMD data (Complete Figure in Supplementary material Fig S3).
Author response image 3
Author response image 4

Author response image 5

Tables
Table 1
Small molecule inhibitors and stimuli for the multiparametric analysis.
| Inhibitors | Target | Usage | Time | Stimuli | Usage | Time |
|---|---|---|---|---|---|---|
| Midostaurin | FLT3 | 100 nM | 90 min | IGF1 | 100 ng/ml | 10 min |
| SB203580 | p38 | 10 μM | 90 min | TNFα | 10 ng/ml | 10 min |
| SP600125 | JNK | 20 μM | 90 min | |||
| Wortmannin | PI3K | 50 nM | 90 min | |||
| Rapamycin | mTOR | 100 nM | 90 min | |||
| UO126 | MEK1/2 | 15 μM | 90 min | |||
| LY2090314 | GSK3 | 20 nM | 90 min |
Table 2
xMAP analytes.
| Analytes | Cat. no. | Phosphosite measured | Activity annotation |
|---|---|---|---|
| CREB1 | 42-680MAG | Ser133 | 1 |
| ERK1/2 | 42-680MAG | Thr185/Tyr187 | 1 |
| JNK | 42-680MAG | Thr183/Tyr 185 | 1 |
| p38 | 42-680MAG | Thr180/Tyr182 | 1 |
| STAT3 | 42-680MAG | Ser727 | 1 |
| STAT5 | 42-680MAG | Tyr694/699 | 1 |
| p70S6K | 42-611MAG | Thr412 | 1 |
| RPS6 | 42-611MAG | Ser235/236 | 1 |
| MTOR | 42-611MAG | Ser2448 | 1 |
| IGF1R | 42-611MAG | Tyr1135/Tyr1136 | 1 |
| PTEN | 42-611MAG | Ser380 | –1 |
| TSC2 | 42-611MAG | Ser939 | –1 |
| GSK3A | 42-611MAG | Ser21 | –1 |
| GSK3B | 42-611MAG | Ser9 | –1 |
| β-Tubulin | 46-413MAG | Total protein | Loading control |
Additional files
-
Supplementary file 1
FLT3-internal tandem duplication (ITD) prior knowledge network (PKN), table downloaded form SIGNOR, data-driven edges integration, PKN in .sif format; regulators of phenotypes annotated by ProxPath resource.
- https://cdn.elifesciences.org/articles/90532/elife-90532-supp1-v1.xlsx
-
Supplementary file 2
Experimental design of the multiparametric experiment of FLT3 ITD-JMD and ITD-TKD BaF3 cell lines; treatments and analytes measured; activity readout annotation.
- https://cdn.elifesciences.org/articles/90532/elife-90532-supp2-v1.xlsx
-
Supplementary file 3
Cue-sentinel-response multiparametric dataset raw data and statistics (MILLIPLEX kit: 9plex_Cat.No.48-680MAG).
- https://cdn.elifesciences.org/articles/90532/elife-90532-supp3-v1.xlsx
-
Supplementary file 4
Cue-sentinel-response multiparametric dataset, raw data, and statistics (MILLIPLEX kit: 11plex_Cat.No.48-611MAG).
- https://cdn.elifesciences.org/articles/90532/elife-90532-supp4-v1.xlsx
-
Supplementary file 5
Complete cue-sentinel-response multiparametric dataset used for Boolean models building in MIDAS format, raw and normalized data.
- https://cdn.elifesciences.org/articles/90532/elife-90532-supp5-v1.xlsx
-
Supplementary file 6
Data used for the validation of FLT3-internal tandem duplications (ITDs) Boolean models using independent resources.
- https://cdn.elifesciences.org/articles/90532/elife-90532-supp6-v1.xlsx
-
Supplementary file 7
Panel of 262 mutations relevant to hematological malignancies analyzed in de novo acute myeloid leukemia (AML) cohort of 14 patients.
- https://cdn.elifesciences.org/articles/90532/elife-90532-supp7-v1.xlsx
-
Supplementary file 8
Results of the getITD output for the classification of the de novo acute myeloid leukemia (AML) cohort of 14 patients.
- https://cdn.elifesciences.org/articles/90532/elife-90532-supp8-v1.xlsx
-
Supplementary file 9
Clinical data, mutation profile, and RNAseq results of the acute myeloid leukemia (AML) patients’ cohort.
- https://cdn.elifesciences.org/articles/90532/elife-90532-supp9-v1.xlsx
-
MDAR checklist
- https://cdn.elifesciences.org/articles/90532/elife-90532-mdarchecklist1-v1.pdf
Download links
A two-part list of links to download the article, or parts of the article, in various formats.
Downloads (link to download the article as PDF)
Open citations (links to open the citations from this article in various online reference manager services)
Cite this article (links to download the citations from this article in formats compatible with various reference manager tools)
Unveiling the signaling network of FLT3-ITD AML improves drug sensitivity prediction
eLife 12:RP90532.
https://doi.org/10.7554/eLife.90532.3


