The BTB-ZF gene Bm-mamo regulates pigmentation in silkworm caterpillars
- State Key Laboratory of Resource Insects, Key Laboratory of Sericultural Biology and Genetic Breeding, Ministry of Agriculture and Rural Affairs, College of Sericulture, Textile and Biomass Sciences, Southwest University, China
Figures
Figure 1
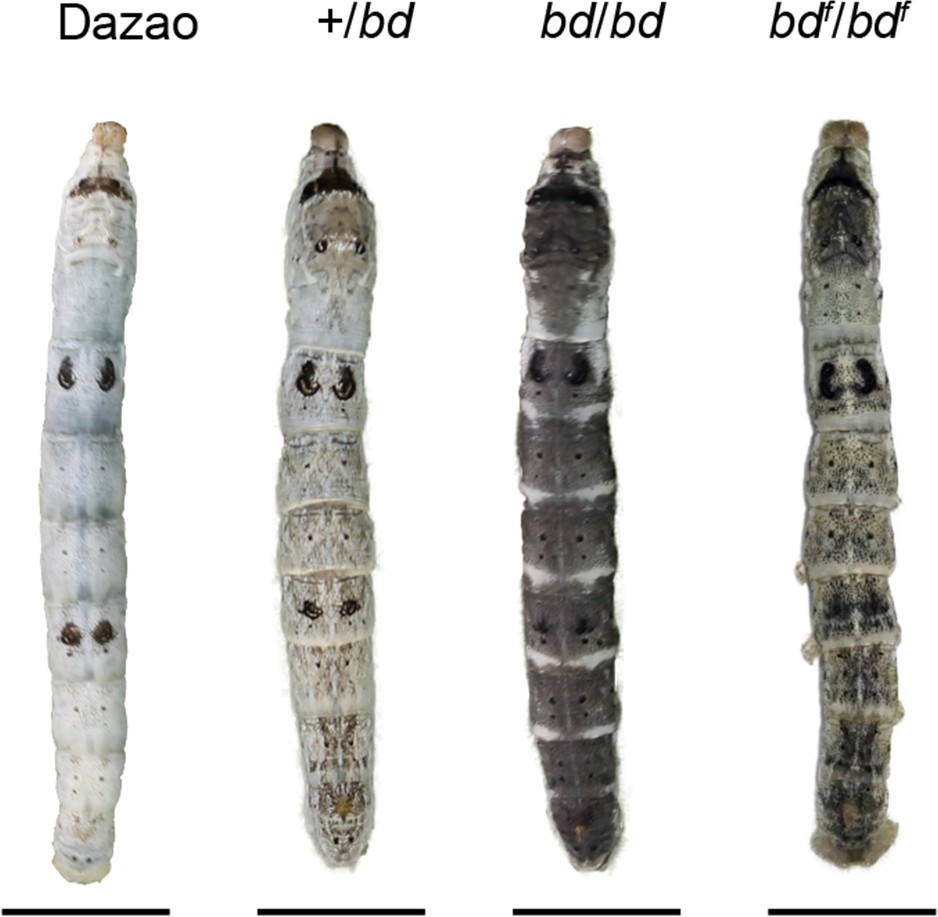
Phenotypes of bd, bdf, and wild-type Dazao larvae.
The epidermis of bd is dark gray, and the epidermis of bdf is light gray at the fifth instar (Day 3) of silkworm larvae. The scale bar indicates 1 cm.
Figure 2 with 5 supplements
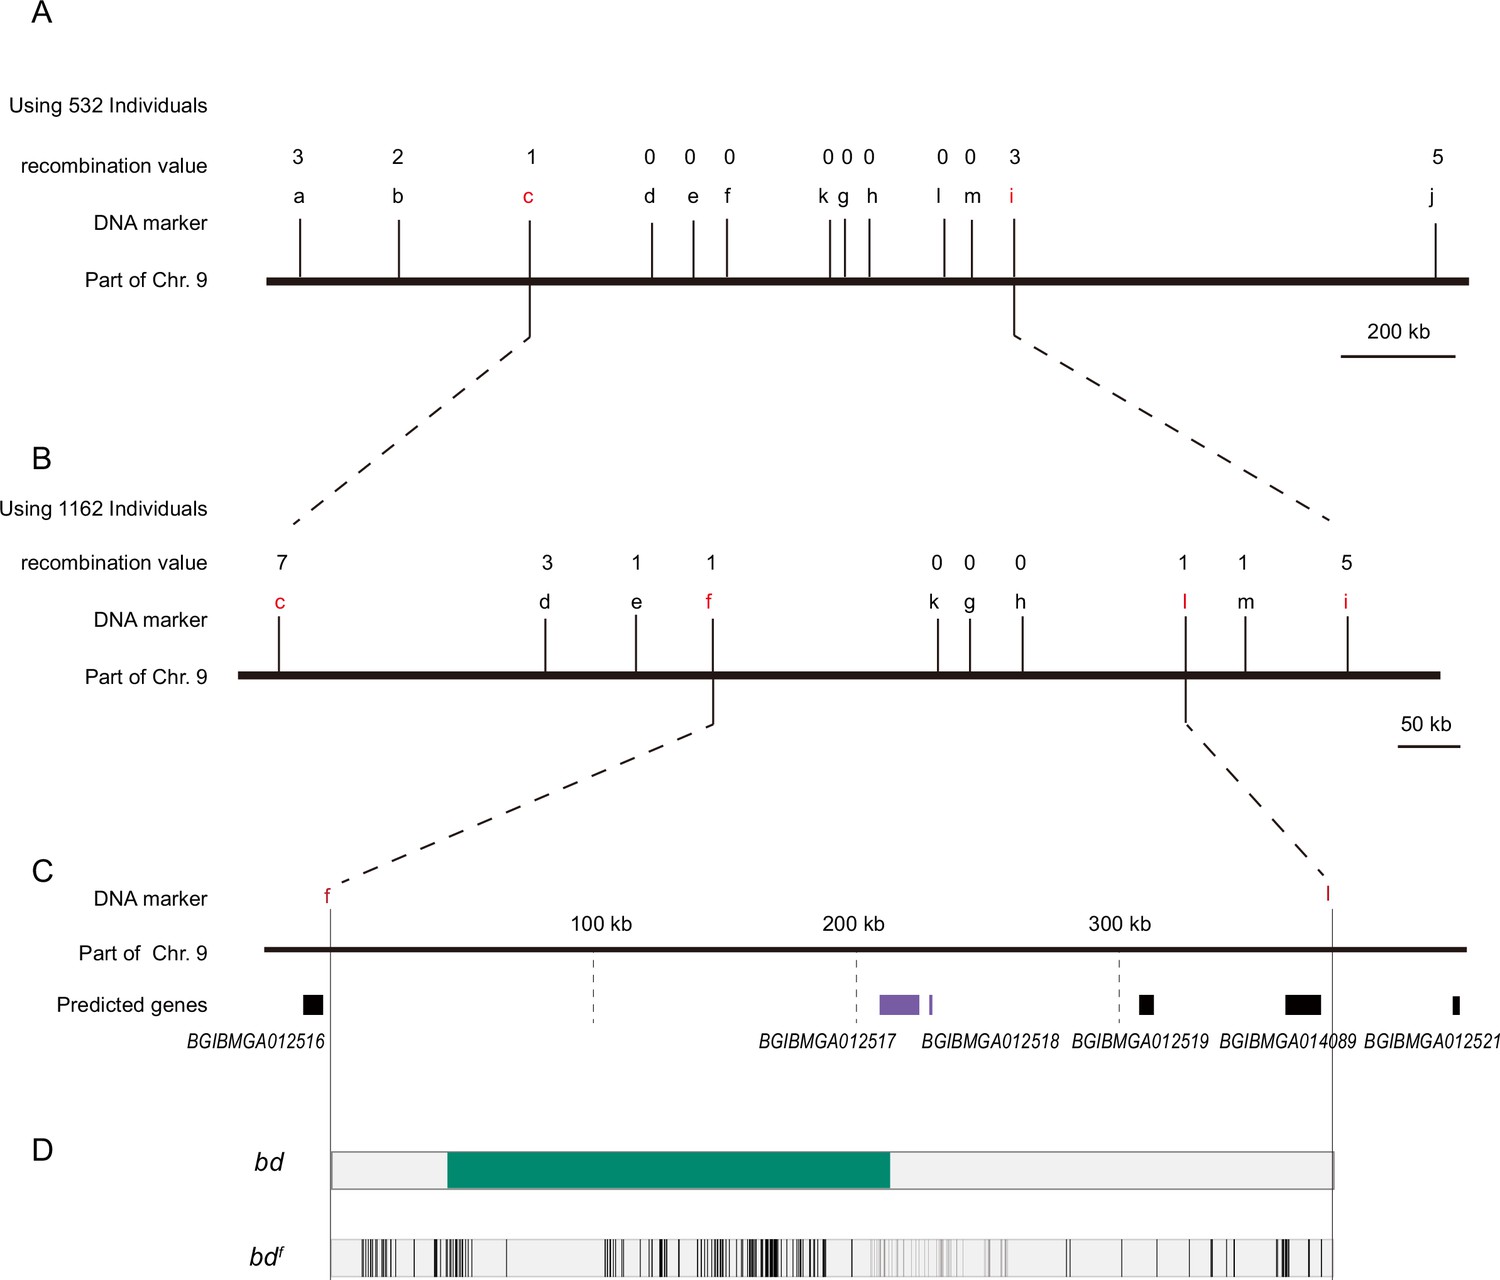
Positional cloning of the bd locus.
(A) We used 532 BC1 individuals to map the bd locus between PCR markers c and i. The numbers above the DNA markers indicate recombination events. (B) A total of 1162 BC1 individuals were used to narrow the bd locus to an approximately 400 kb genomic region. (C) Partial enlarged view of the region responsible for bd. This region contains four predicted genes, BGIBMGA012517, BGIBMGA012518, BGIBMGA012519, and BGIBMGA014089. (D) Analysis of nucleotide differences in the region responsible for bd. The green block indicates the deletion of the genome in bd mutants. The black vertical lines indicate the single-nucleotide polymorphisms (SNPs) and indels of bdf mutants.
Figure 2—figure supplement 1
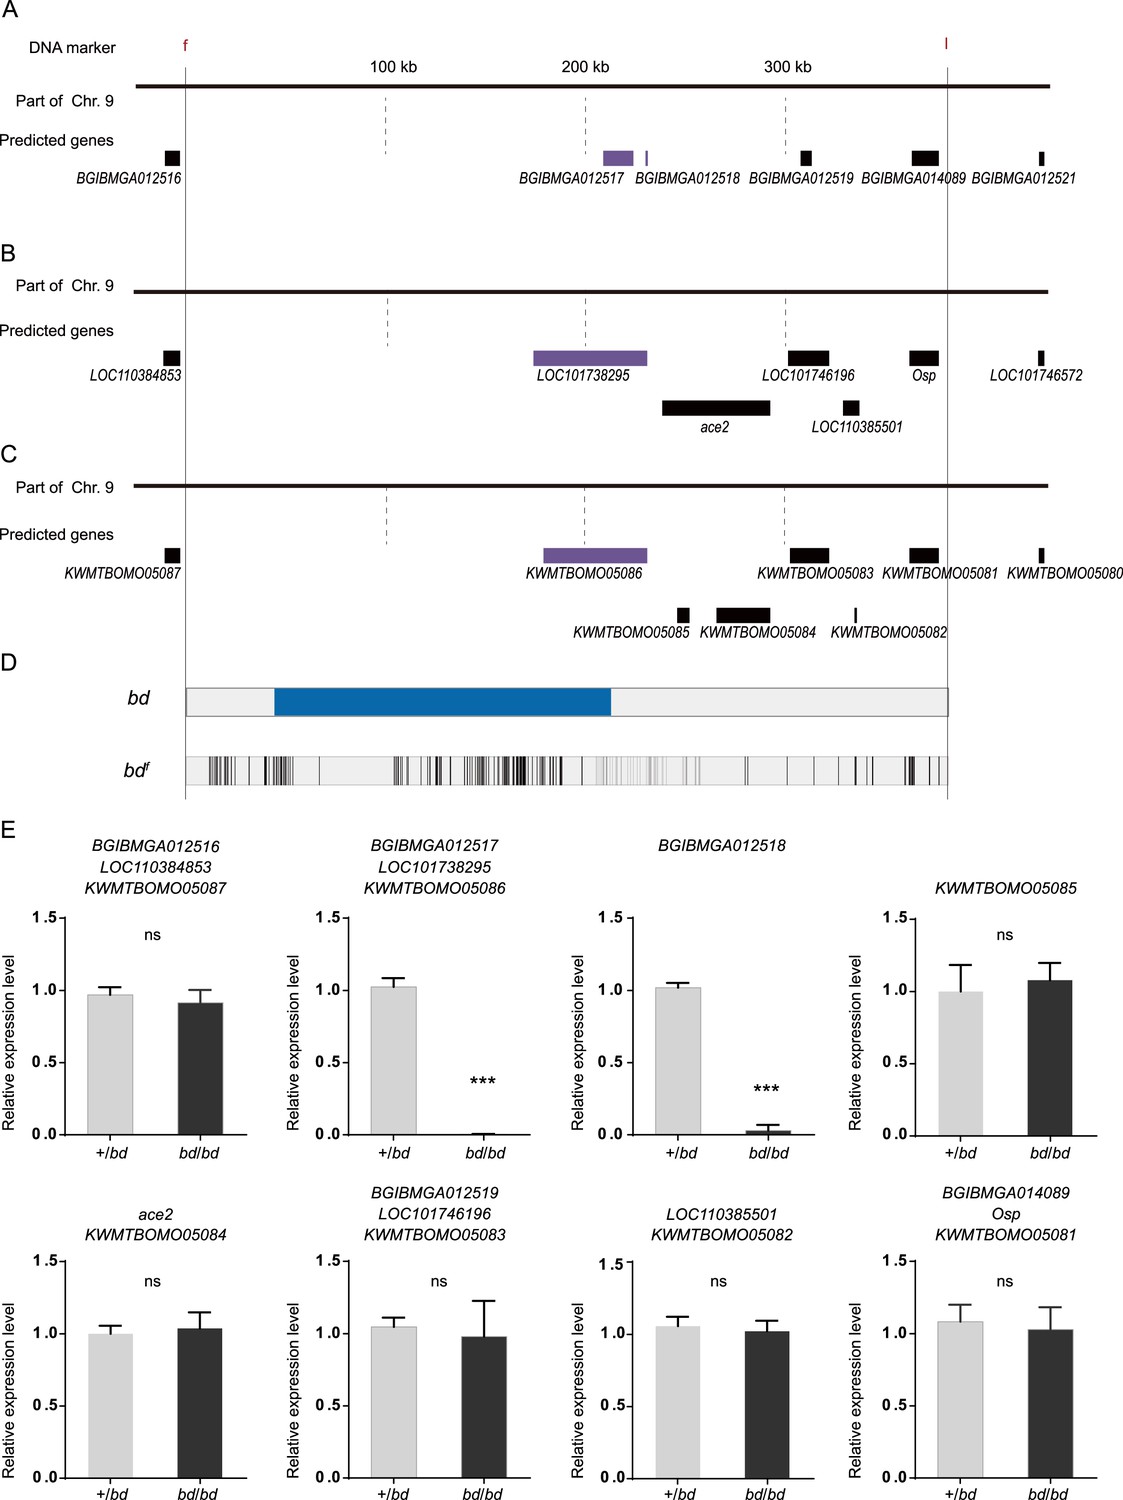
Screening analysis of candidate genes for the bd mutant.
(A) The predicted genes in the SilkDB. (B) The predicted genes in GenBank. (C) The predicted genes in Silkbase. (D) Analysis of nucleotide differences in the region responsible for bd. (E) Investigation of the expression levels of candidate genes by quantitative polymerase chain reaction (qPCR). The mean ± standard deviation (SD), n=3. ***p < 0.001 (Student’s t test).
Figure 2—figure supplement 2
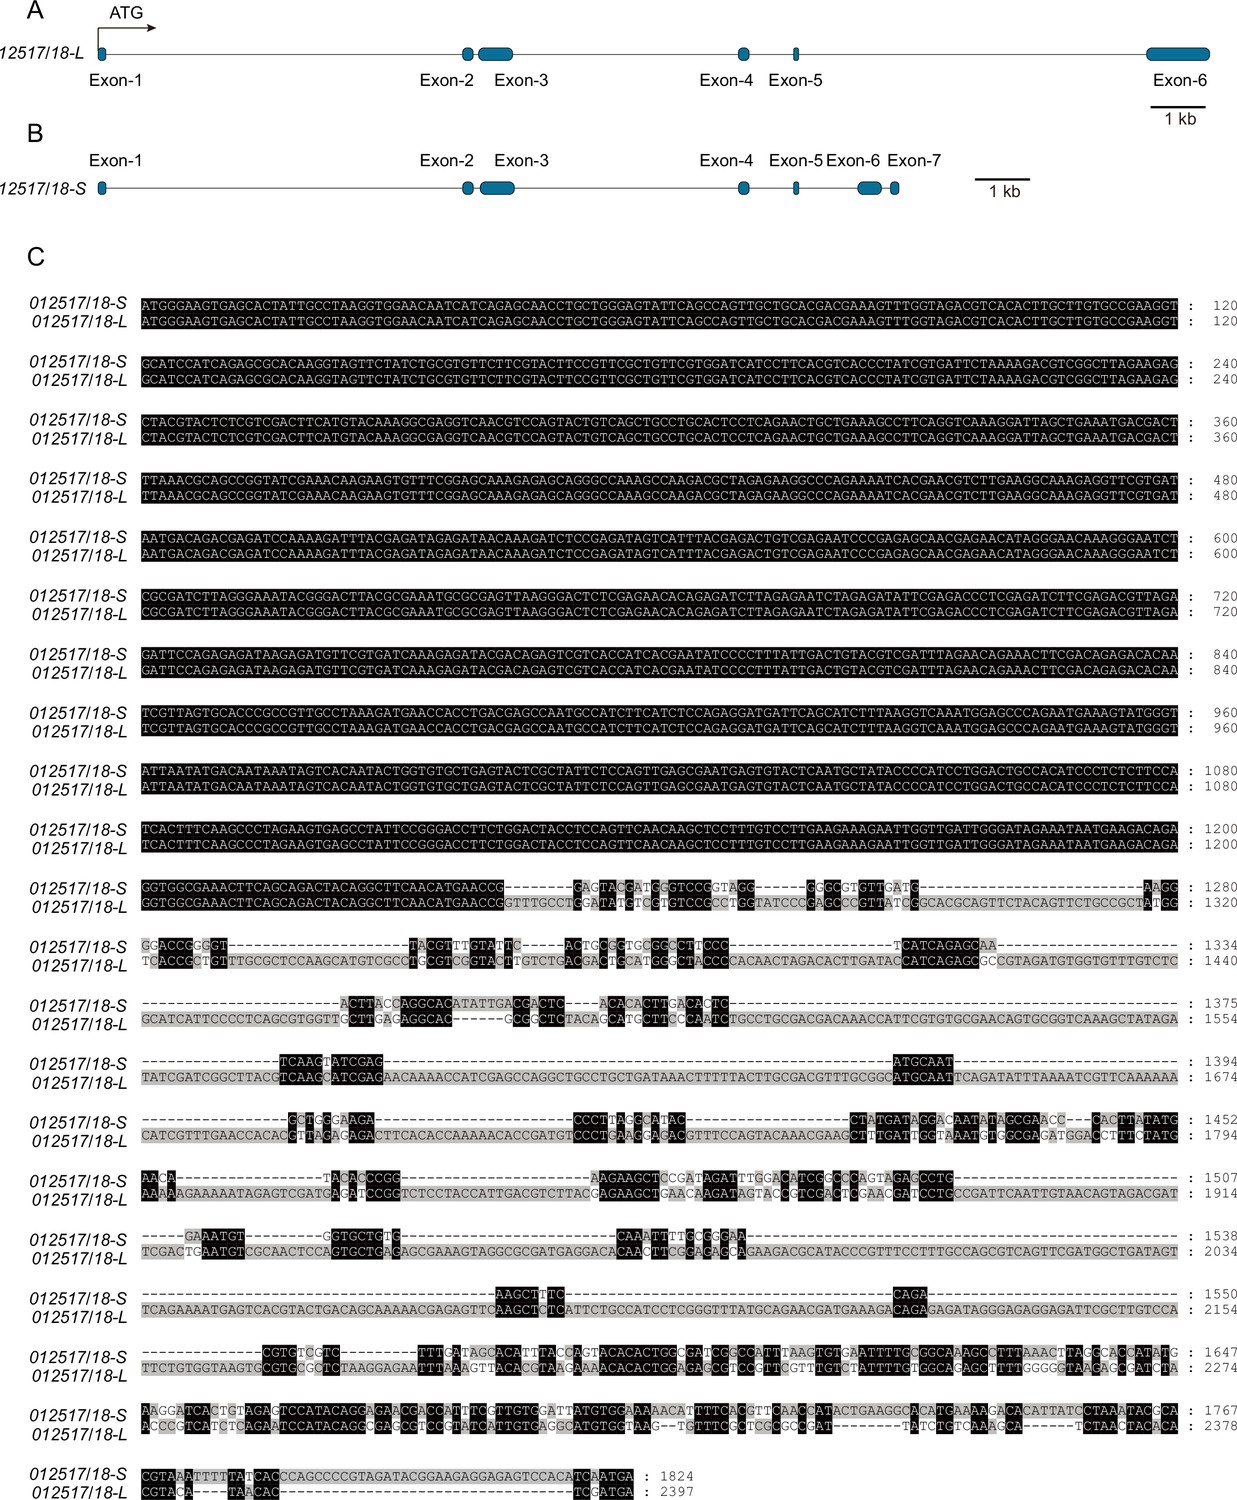
Sequence analysis of the 12517/18-L and 12517/18-S transcripts.
(A) The gene structure of 12517/18-L. (B) The gene structure of 12517/18-S. (C) Sequence alignment of 12517/18-L and 12517/18-S.
-
Figure 2—figure supplement 2—source data 1
The coding sequences of two transcripts of Bm-mamo.
- https://cdn.elifesciences.org/articles/90795/elife-90795-fig2-figsupp2-data1-v1.xlsx
Figure 2—figure supplement 3

The expression levels of 12517/18 in the wild-type Dazao strain and bd allele mutants.
The mean ± SD, n=3. **p < 0.01 (Student’s t test).
Figure 2—figure supplement 4
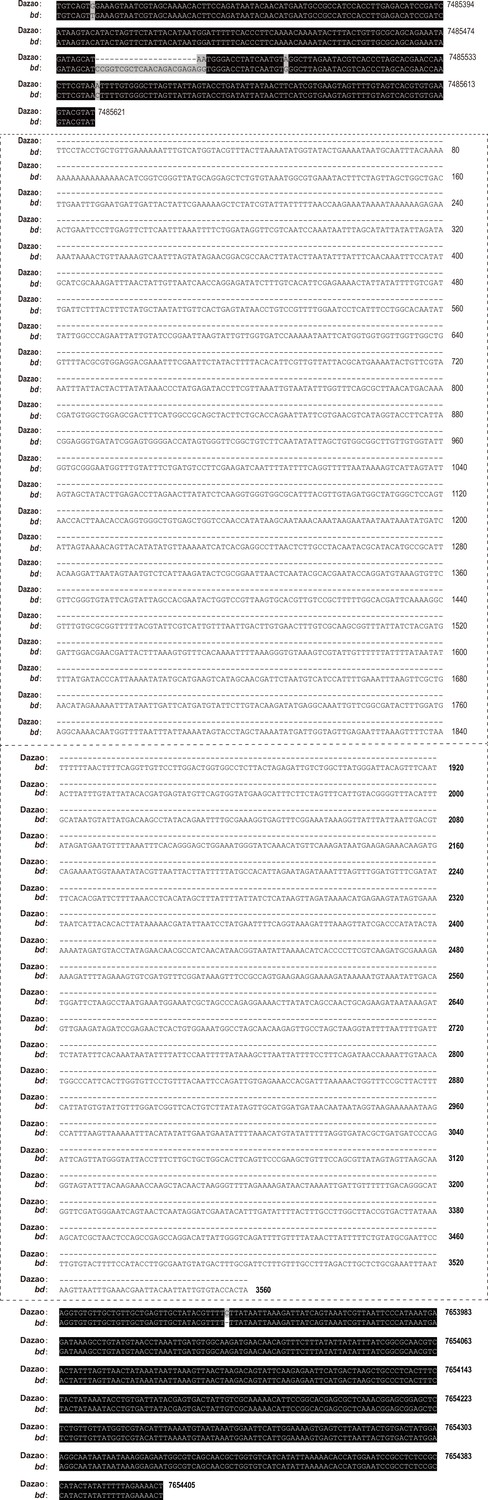
The responsible sequence of the bd mutant.
In the bd mutant, an over 168-kb genome sequence was absent, and a 3560-bp sequence was inserted. The dashed box represents the sequence inserted in bd. The 168 kb deletion in bd is represented by the number at the end of the sequence.
-
Figure 2—figure supplement 4—source data 1
The genomic sequence of the Bm-mamo gene and its upstream region in the wild-type and bd mutant.
- https://cdn.elifesciences.org/articles/90795/elife-90795-fig2-figsupp4-data1-v1.xlsx
Figure 2—figure supplement 5
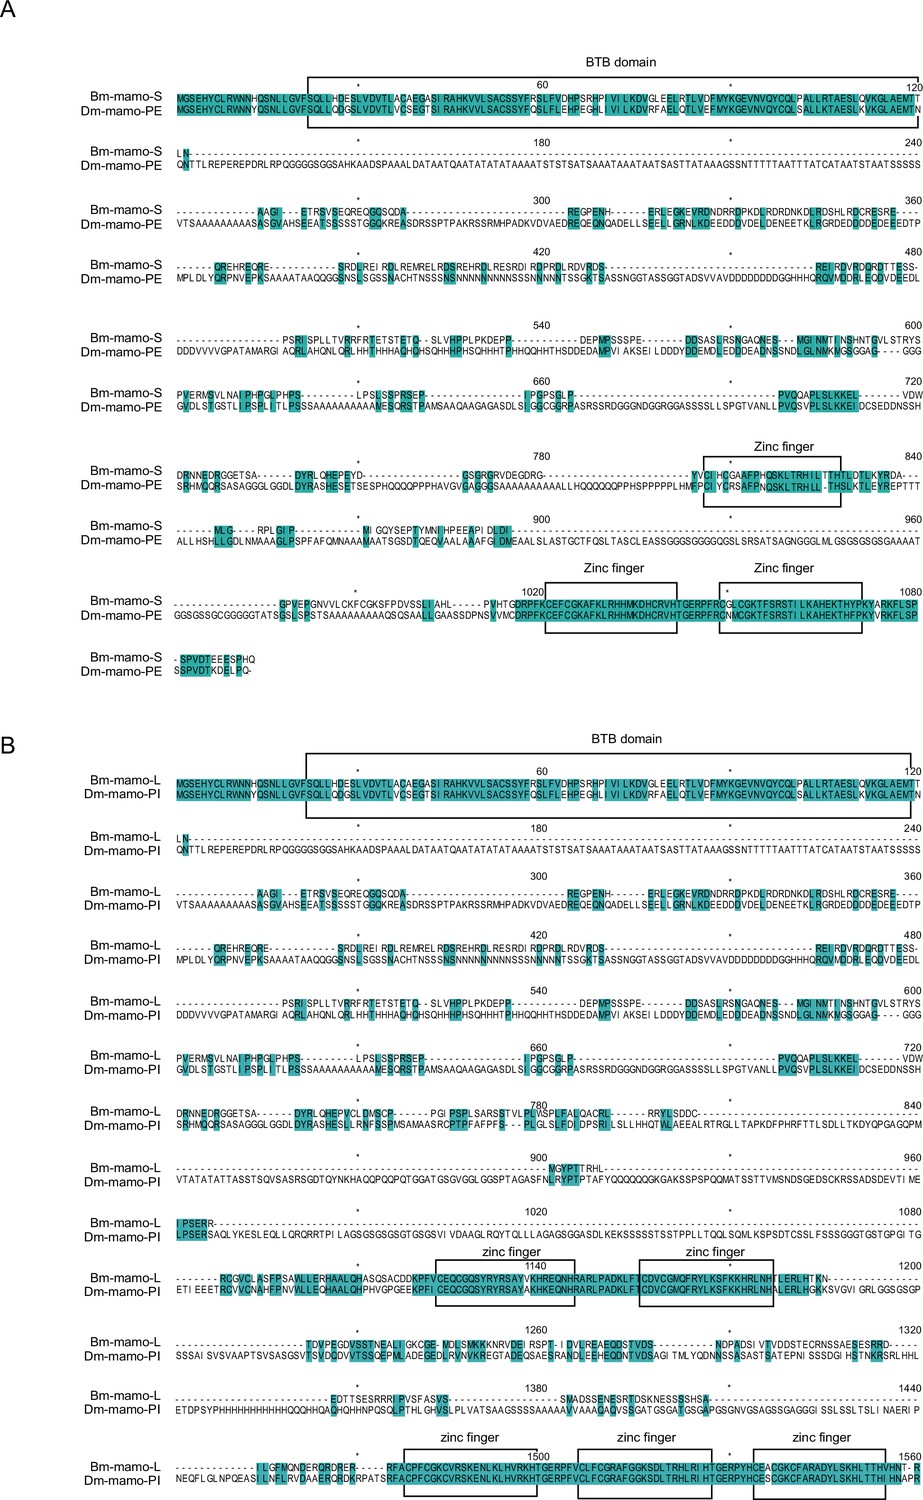
Sequence alignment between the mamo protein of Drosophila melanogaster and the amino acid sequence encoded by the 012517/18 gene.
(A) Sequence alignment of Bm-mamo-S and Dm-mamo-PE. (B) Sequence alignment of Bm-mamo-L and Dm-mamo-PI. The BTB domains and zinc finger motif of these genes are highly conserved.
-
Figure 2—figure supplement 5—source data 1
The amino acid sequences encoded of the mamo genes in silkworms and Drosophila melanogaster.
- https://cdn.elifesciences.org/articles/90795/elife-90795-fig2-figsupp5-data1-v1.xlsx
Figure 3
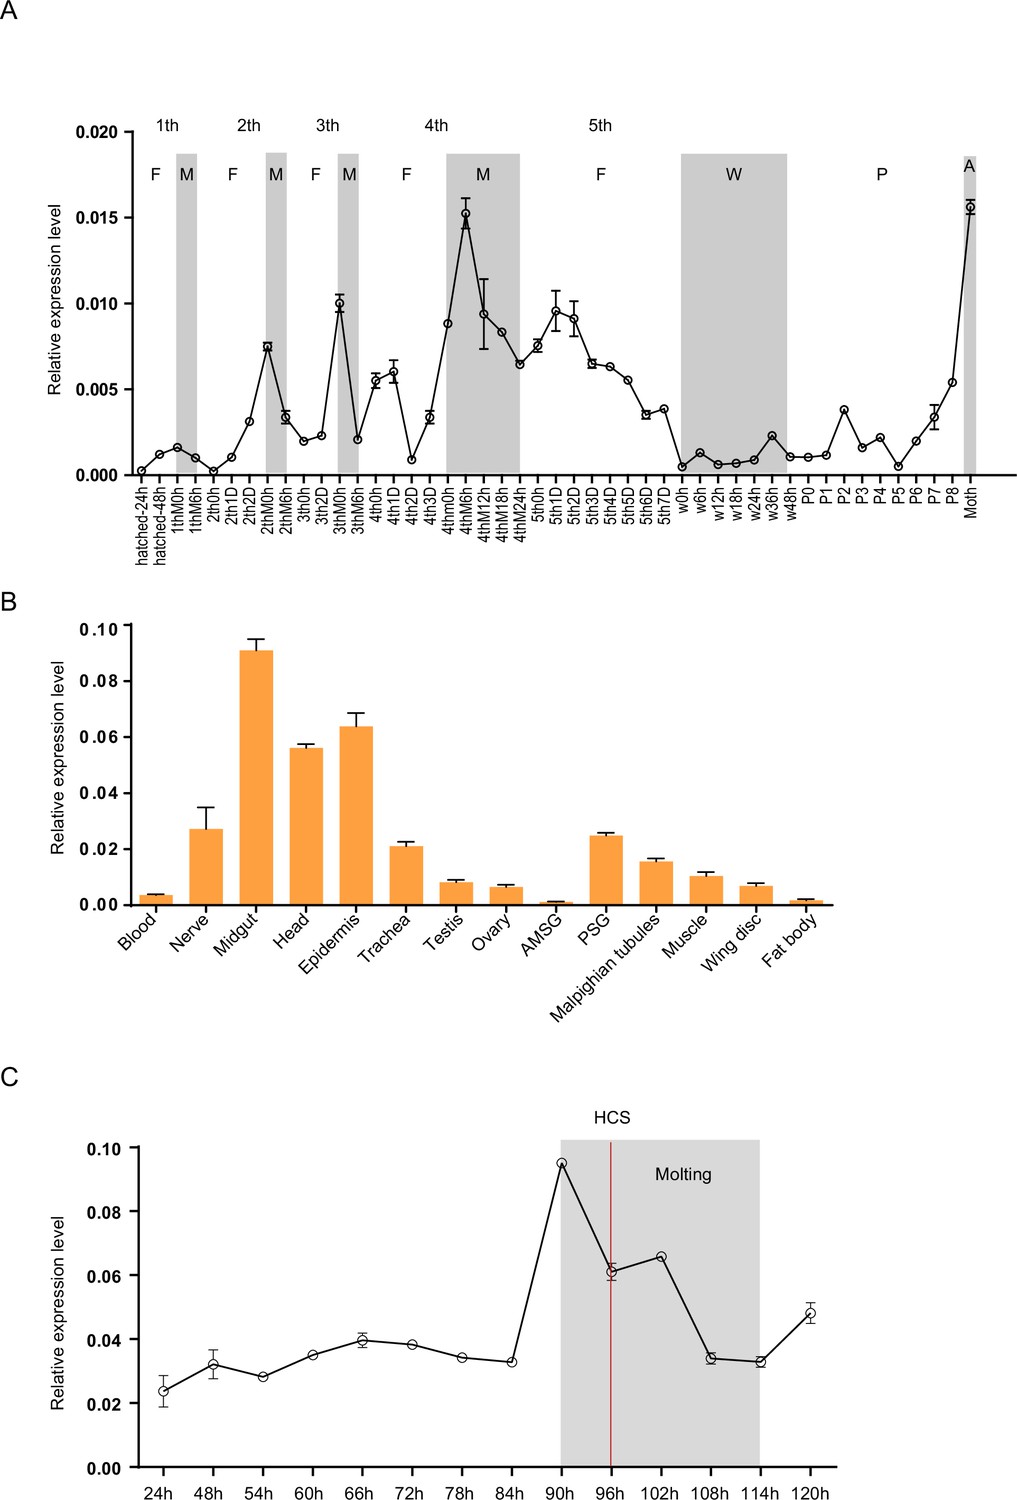
Spatiotemporal expression of Bm-mamo.
(A) Temporal expression of Bm-mamo. In the molting and adult stages, this gene was significantly upregulated. M: molting stage, W: wandering stage, P: pupal stage, P1: Day 1 of the pupal stage, A: adult stage, 4th3d indicates the 4th instar on Day 3. 1st to 5th denote the first instar of larvae to fifth instar of larvae, respectively. (B) Tissue-specific expression of genes in 4th-instar molting larvae. Bm-mamo had relatively high expression levels in the midgut, head, and epidermis. AMSG: anterior division of silk gland and middle silk gland, PSG: posterior silk gland. (C) Detailed analysis of Bm-mamo at the 4th larval stage in the epidermis of the Dazao strain. Bm-mamo expression is upregulated during the molting stage. HCS indicates the head capsule stage. The ‘h’ indicates the hour, 90 h: at 90 h of the 4th instar. The mean ± SD, n=3.
Figure 4
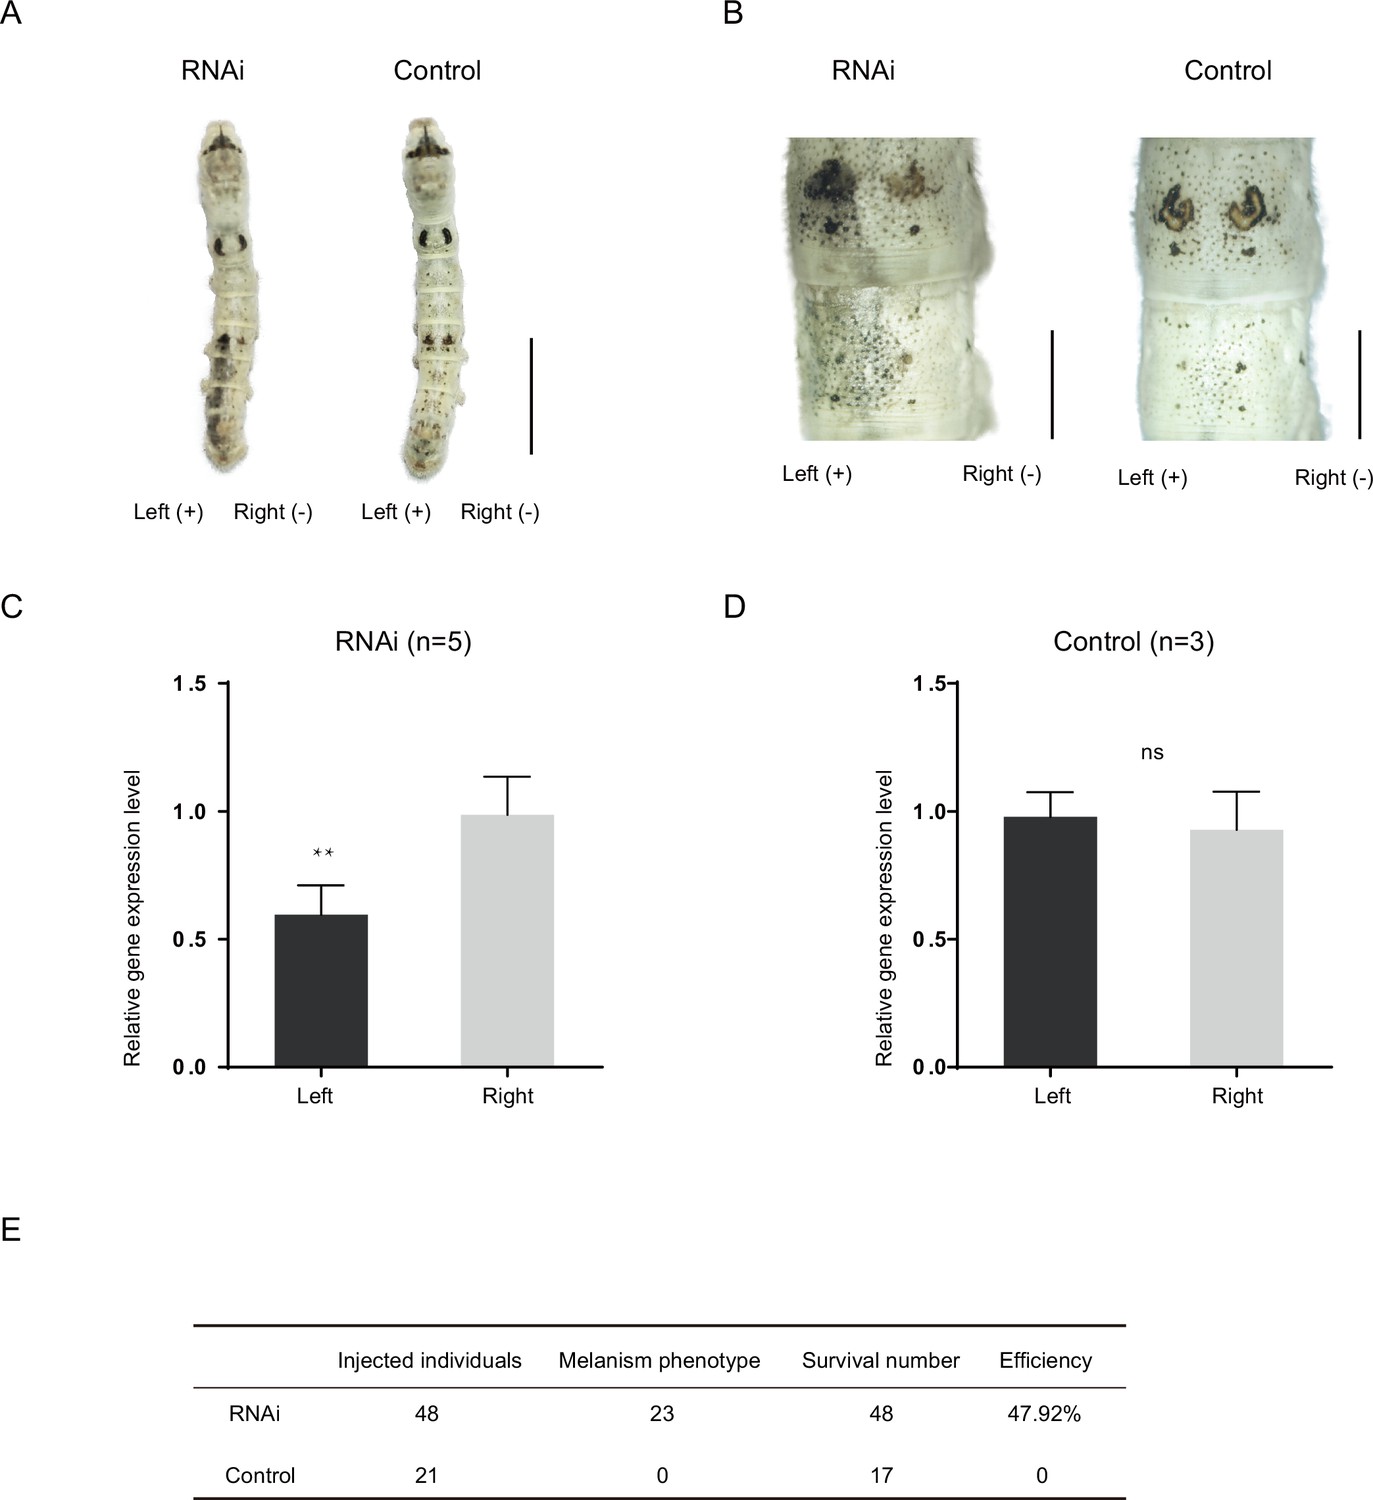
RNA interference (RNAi) of Bm-mamo.
(A) Short interfering RNA (siRNA) was introduced by microinjection followed by electroporation. ‘+’ and ‘−’ indicate the positive and negative poles of the electrical current, respectively. Scale bars, 1 cm. (B) Partial magnification of the siRNA experimental group and negative control group. Scale bars, 0.2 cm. (C, D) Relative expression levels of Bm-mamo in the negative control and RNAi groups were determined by quantitative polymerase chain reaction (qPCR) analysis. The mean ± SD. Numbers of samples are shown in the upper right in each graph. **p < 0.01, paired Student’s t test (ns, not significant). (E) Statistical analysis of the efficiency of the RNAi.
Figure 5
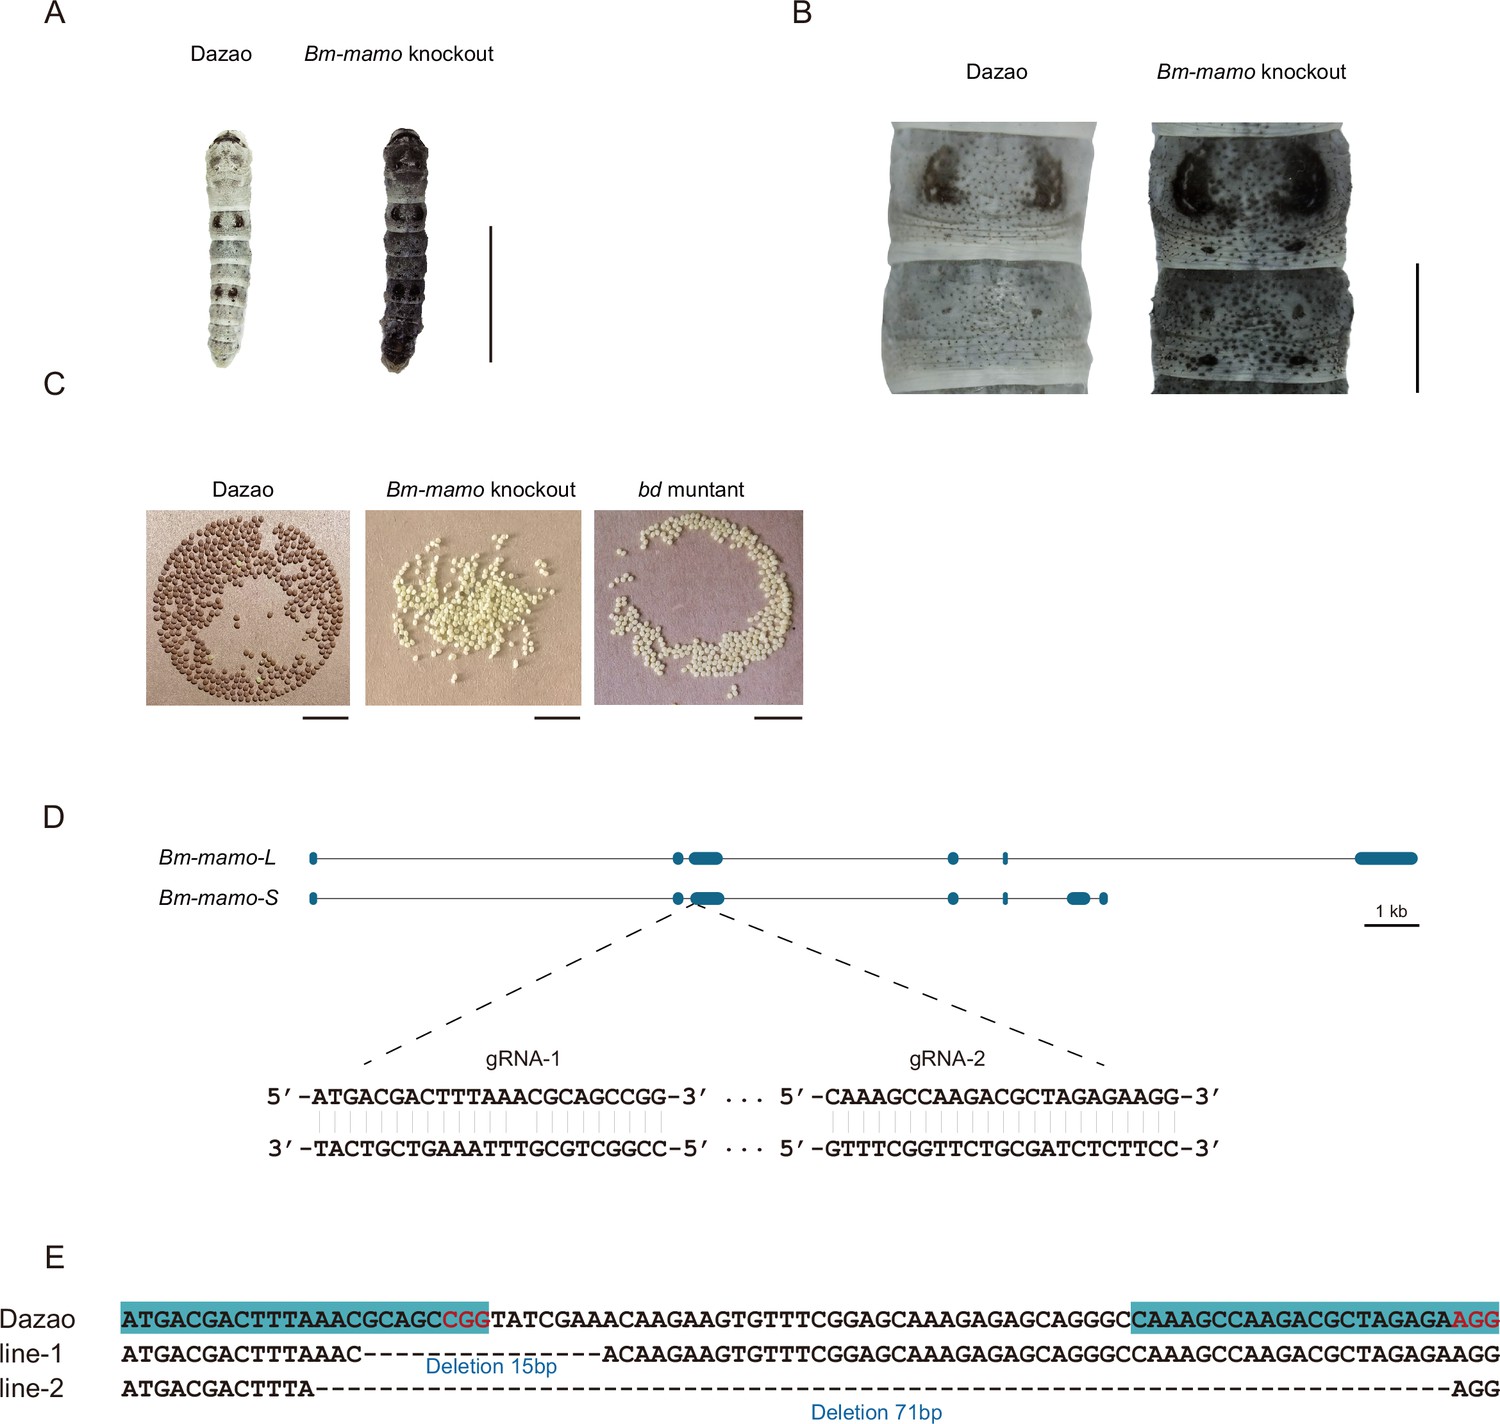
Bm-mamo knockout.
(A) Larval phenotype of G3 fourth-instar larvae of Bm-mamo-targeted Dazao. Scale bars, 1 cm. (B) Partial magnification of Bm-mamo knockout and control individuals. Scale bars, 0.2 cm. (C) After 48 hr of egg laying, the pigmentation of the eggs indicates that those produced by homozygous knockout females cannot undergo normal pigmentation and development. (D) Genomic structure of Bm-mamo. The open reading frame (blue) and untranslated region (black) are shown. The gRNA 1 and gRNA 2 sequences are shown. (E) Sequences of the Bm-mamo knockout individuals. Lines 1 and 2 indicate deletions of 15 and 71 bp, respectively.
Figure 6 with 2 supplements
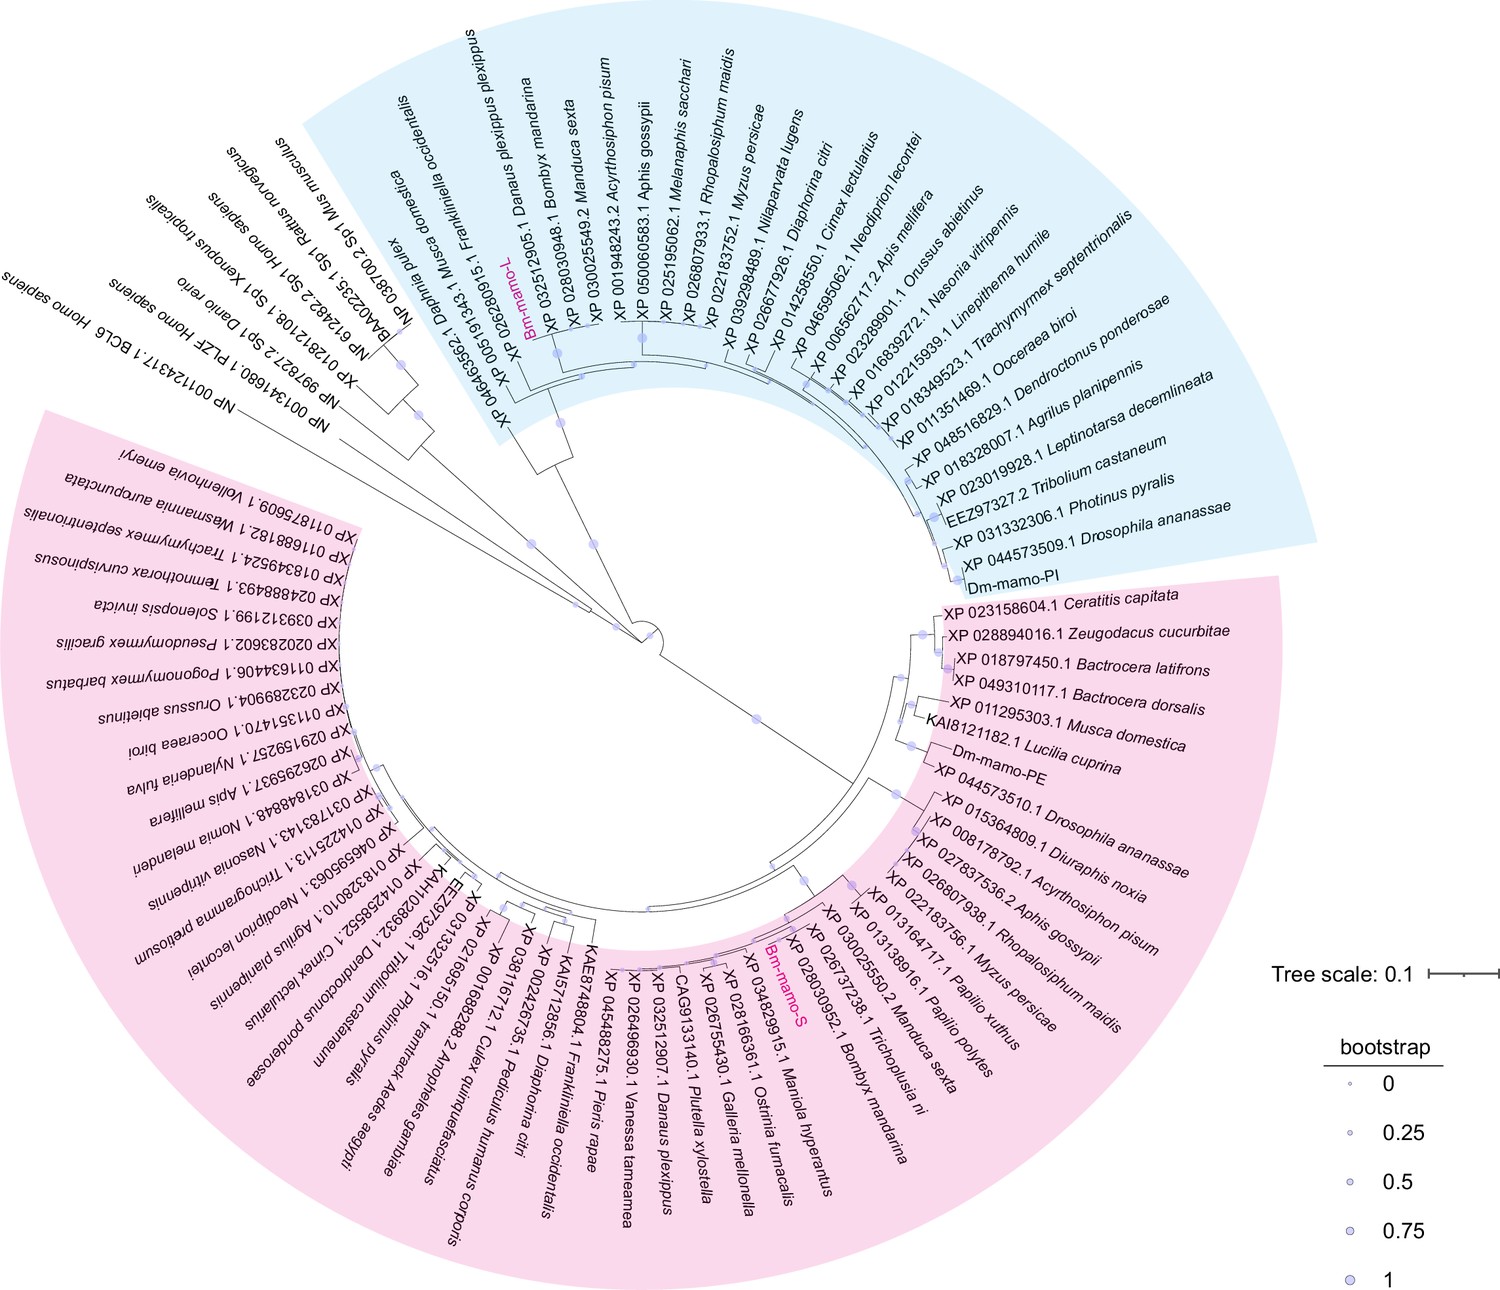
Phylogenetic analysis.
The phylogenetic tree was subsequently constructed using the neighbor-joining method with the MEGA7 program (Pearson model). The confidence levels for various phylogenetic lineages were estimated by bootstrap analysis (2000 replicates). The magenta color indicates the homologous Bm-mamo protein, which has three zinc finger motifs. The blue color indicates the homologous Bm-mamo protein, which has five zinc finger motifs.
-
Figure 6—source data 1
The amino acid sequences of the mamo orthologs among multiple species.
- https://cdn.elifesciences.org/articles/90795/elife-90795-fig6-data1-v1.xlsx
Figure 6—figure supplement 1
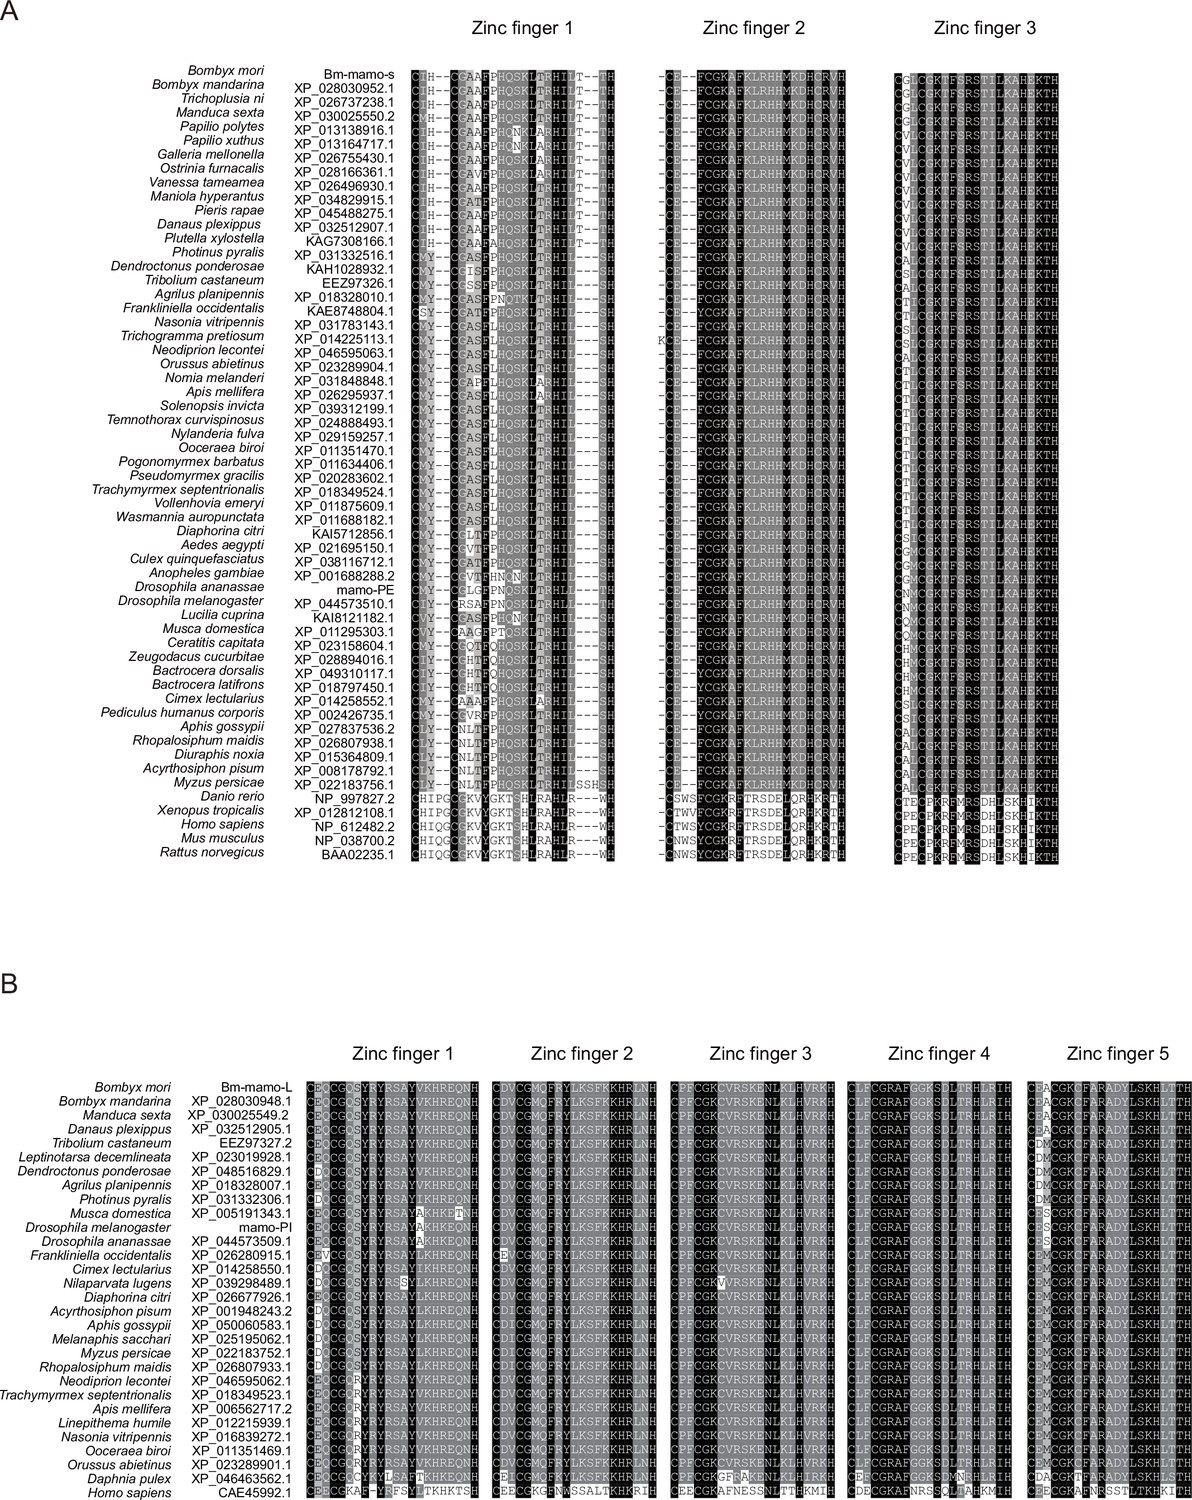
The sequence alignment of the zinc finger motif of orthologs of mamo in multiple species.
(A) The sequence alignment of the zinc fingers of orthologs of Bm-mamo-S. (B) The sequence alignment of the zinc fingers of orthologs of Bm-mamo-L.
-
Figure 6—figure supplement 1—source data 1
The amino acid sequences of the zinc finger motifs of the mamo orthologs among multiple species.
- https://cdn.elifesciences.org/articles/90795/elife-90795-fig6-figsupp1-data1-v1.xlsx
Figure 6—figure supplement 2
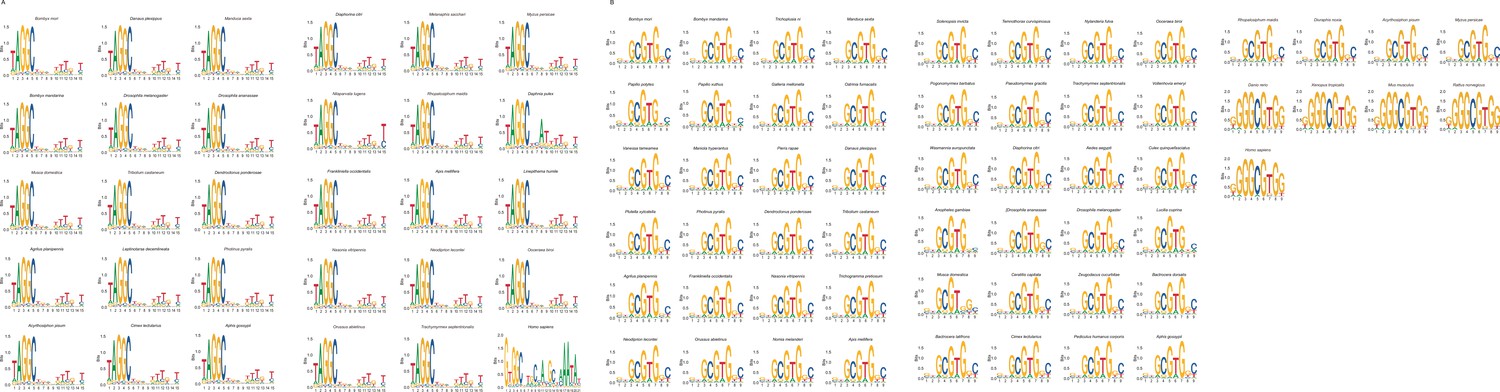
The sequence logo of the DNA-binding sites of orthologs of mamo in multiple species.
(A) The sequence logo of the DNA-binding site of orthologs of Bm-mamo-L. (B) The sequence logo of the DNA-binding site of orthologs of Bm-mamo-S.
Figure 7
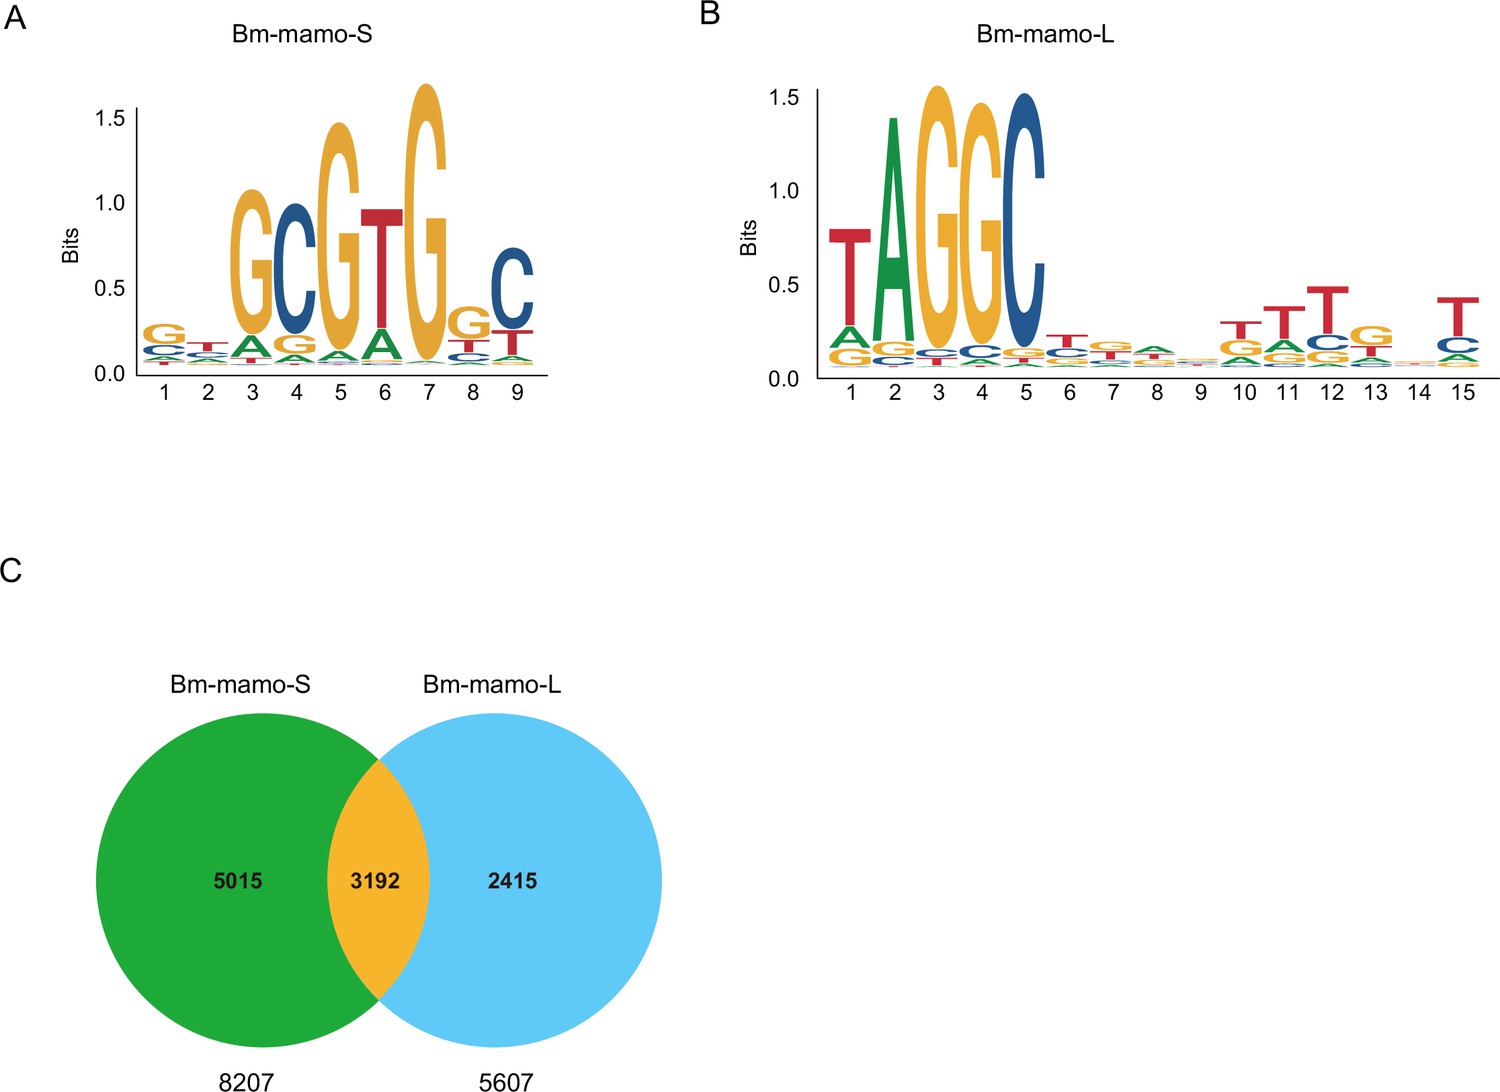
The DNA-binding site sequence logo of the Bm-mamo protein and the analysis of downstream target genes.
(A) The DNA-binding site sequence logo of the Bm-mamo-S protein. (B) The DNA-binding site sequence logo of the Bm-mamo-L protein. (C) Potential downstream target genes of the Bm-mamo protein in the silkworm genome were identified via the MEME FIMO program.
Figure 8
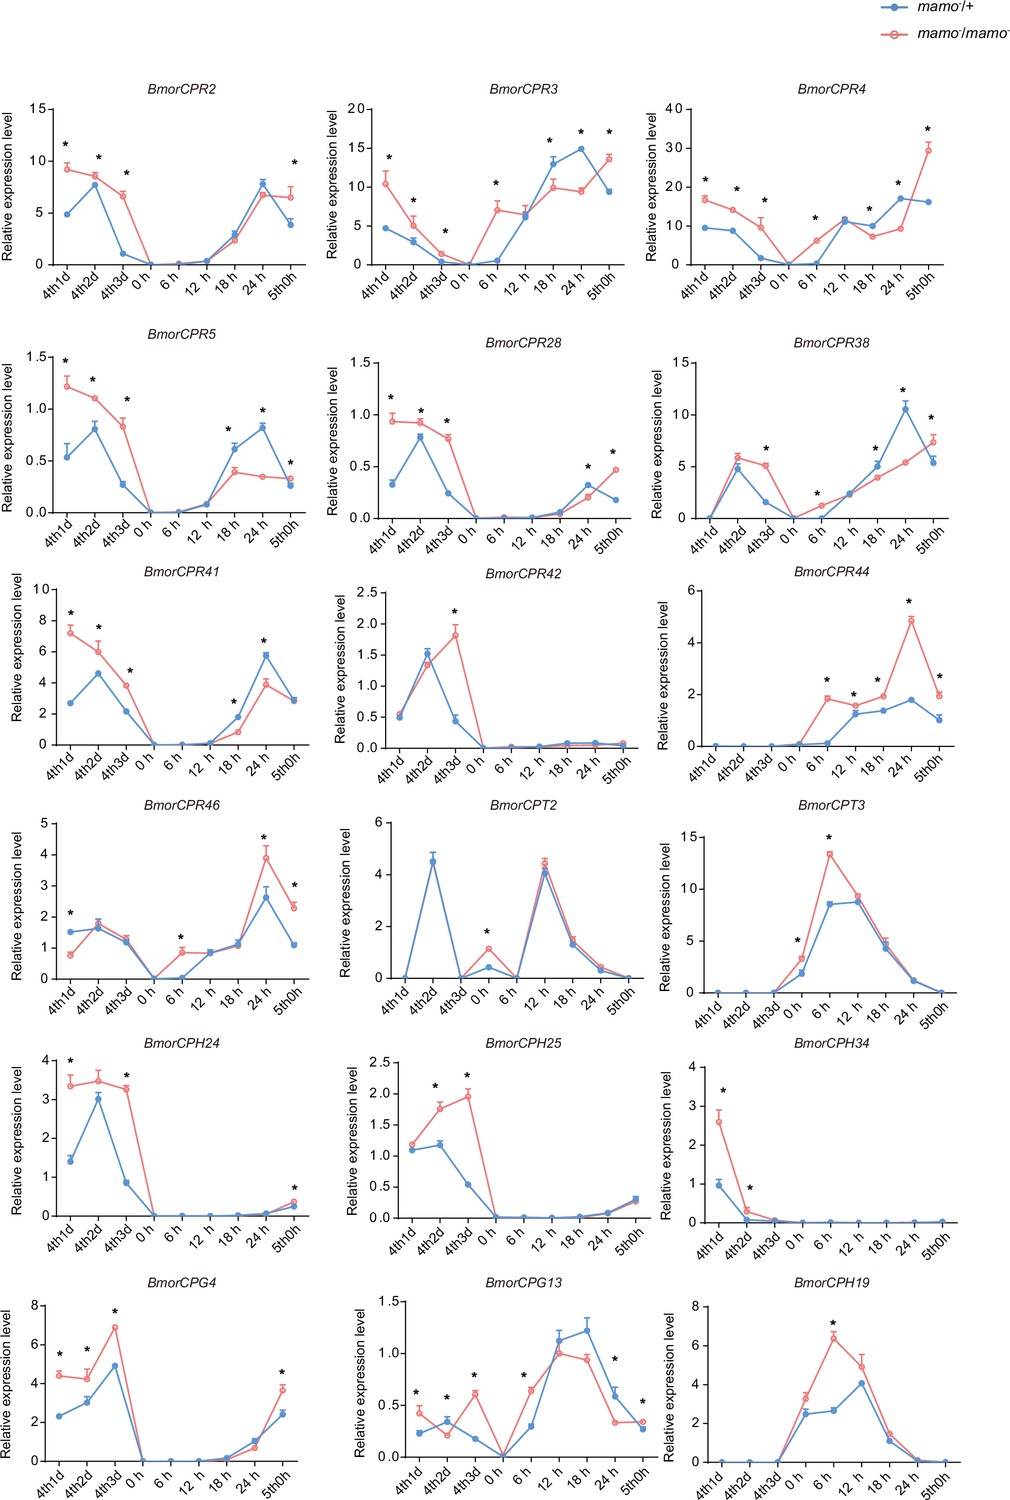
The expression levels of 18 cuticular protein genes were measured via quantitative polymerase chain reaction (qPCR).
The red line indicates the homozygous Bm-mamo knockout individuals, and the blue line indicates the heterozygous Bm-mamo knockout individuals. The mean ± SD, n=3. *p < 0.05 ( Student’s t test). 4th1d indicates 4-instar Day 1; 0 h indicates the beginning of molting, h indicates hours, and 5th0h indicates the beginning of the 5th instar.
Figure 9 with 3 supplements
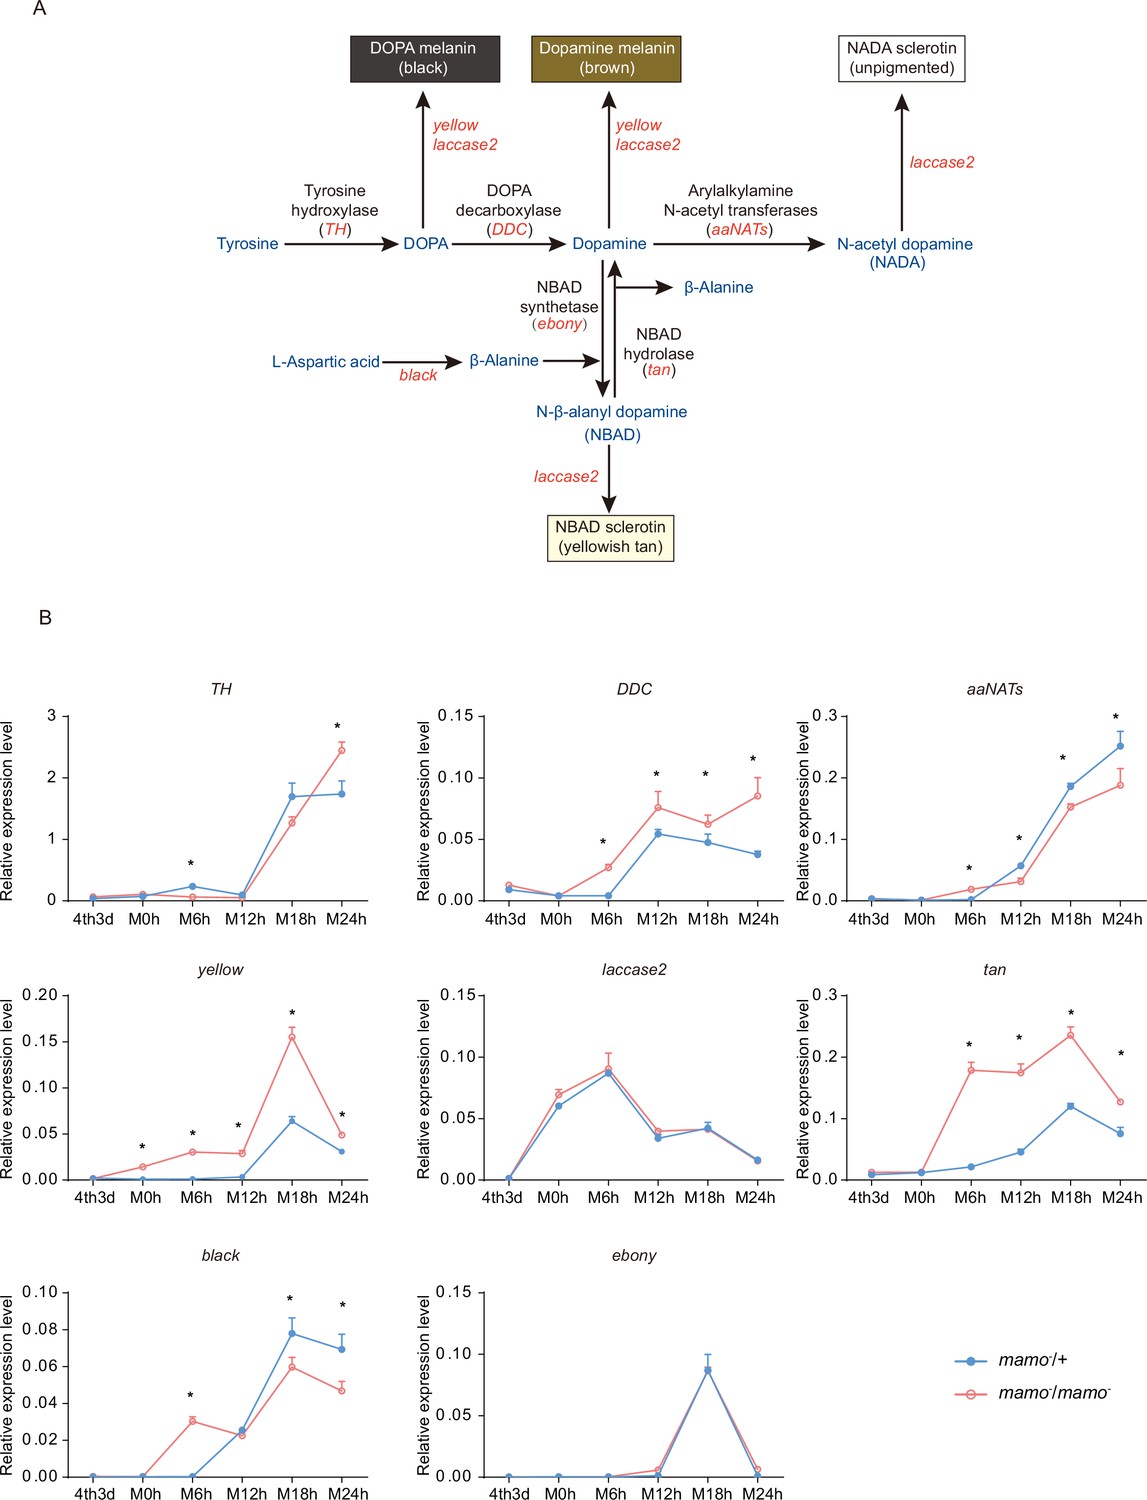
Melanin metabolism pathway and quantitative polymerase chain reaction (qPCR) of related genes.
(A) The melanin metabolism pathway. Blue indicates amino acids and catecholamines, red indicates the names of genes, and black indicates the names of enzymes. (B) Relative expression levels of eight genes in the heterozygous Bm-mamo knockout group (blue) and homozygous Bm-mamo knockout group (red) determined via qPCR analysis. The mean ± SD, n=3. *p < 0.05 (Student’s t test). 4th3d indicates the 4th instar on Day 3, M indicates molting, and h indicates hours.
Figure 9—figure supplement 1
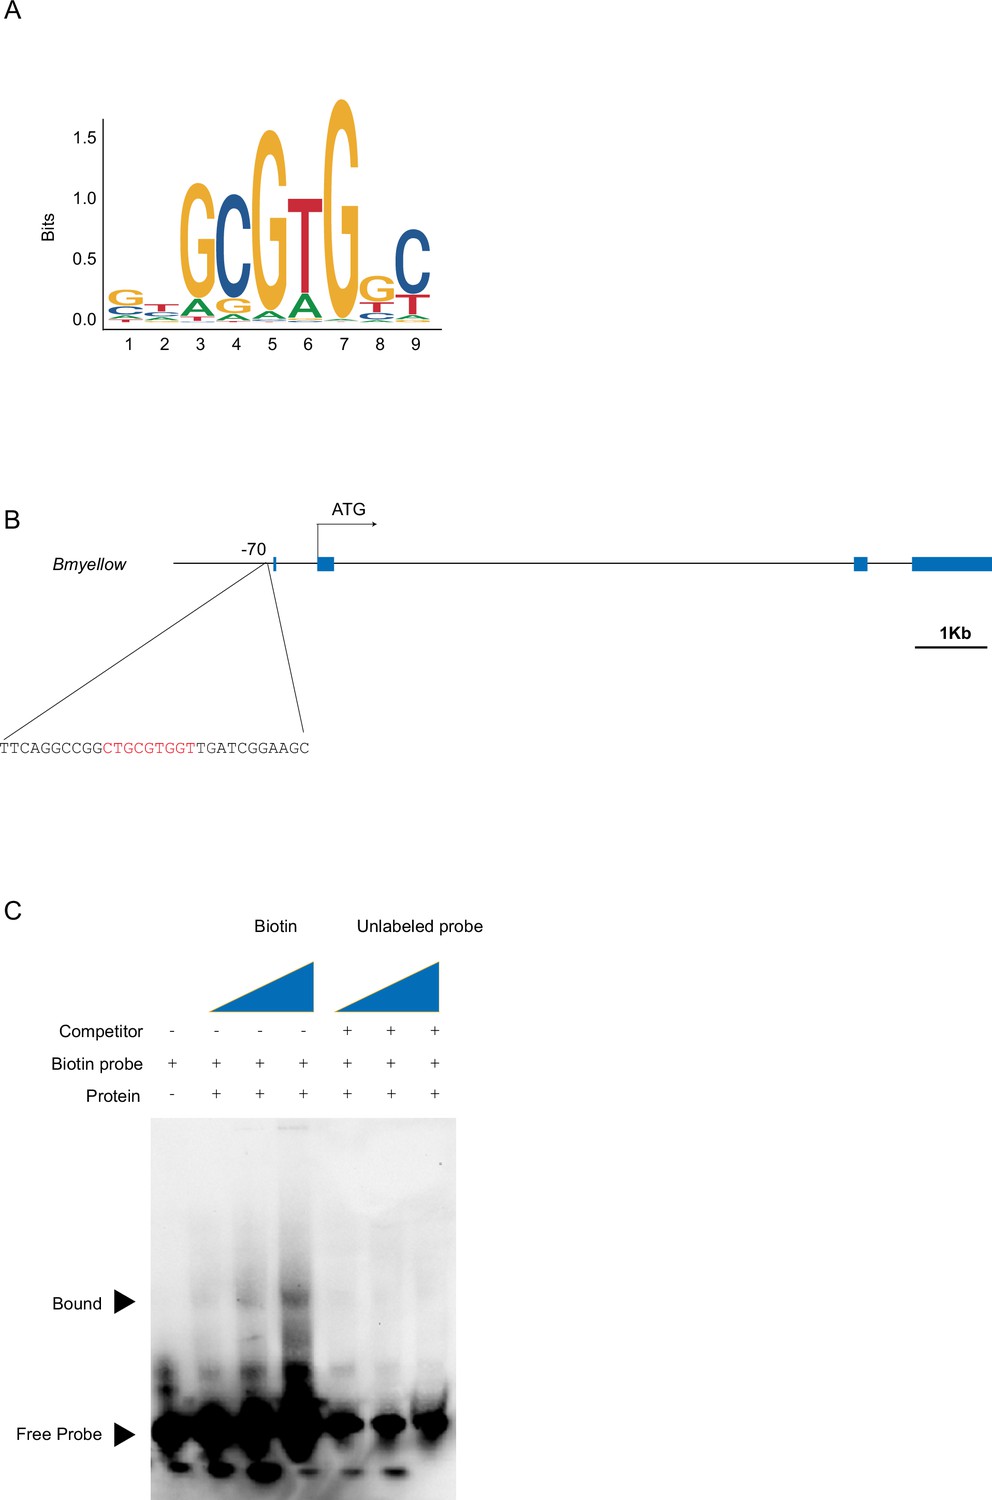
Bm-mamo directly binds yellow.
(A) The sequence logo of Bm-mamo-S. (B) The gene structure of Bm-yellow, which contains a Bm-mamo-S-binding consensus sequence (red). (C) Electrophoretic mobility shift assay (EMSA) analyses of Bm-mamo-S.
Figure 9—figure supplement 2

The expression levels of yellow and tan in the epidermis of pigmented and nonpigmented areas of the Dazao strain.
The mean ± SD, n=3. *p<0.05, **p < 0.01 (Student’s t test). 4thM6h indicates 6 hr of the fourth molting.
Figure 9—figure supplement 3

The cis-regulatory element model of yellow in D. melanogaster.
The blue blocks indicate exons, the black lines indicate introns, the brown block indicates the wing element, the gray block indicates the body element, the green lines indicate the binding site of bab-1, and the red lines indicate the binding site of Abd-B.
-
Figure 9—figure supplement 3—source data 1
Genomic sequence of yellow gene in Drosophila melanogaster.
- https://cdn.elifesciences.org/articles/90795/elife-90795-fig9-figsupp3-data1-v1.xlsx
Figure 10
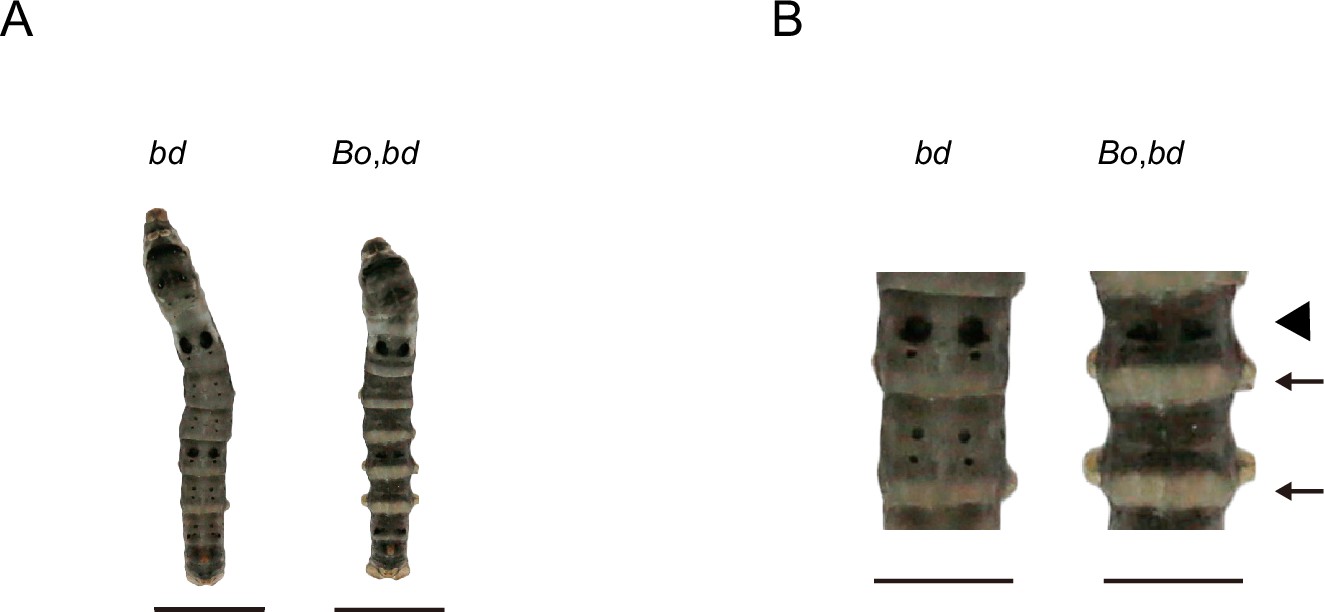
Phenotypes of offspring from hybridization between Bo and bd.
(A) The phenotypes of 5th instar and Day 3. the. The bars indicate 1 cm. (B) Magnification of body segments. The bars indicate 0.5 cm. The area where the pigment is significantly reduced is indicated by the arrow. The triangle shape indicates that the number of lunar spots is reduced.
Figure 11 with 1 supplement
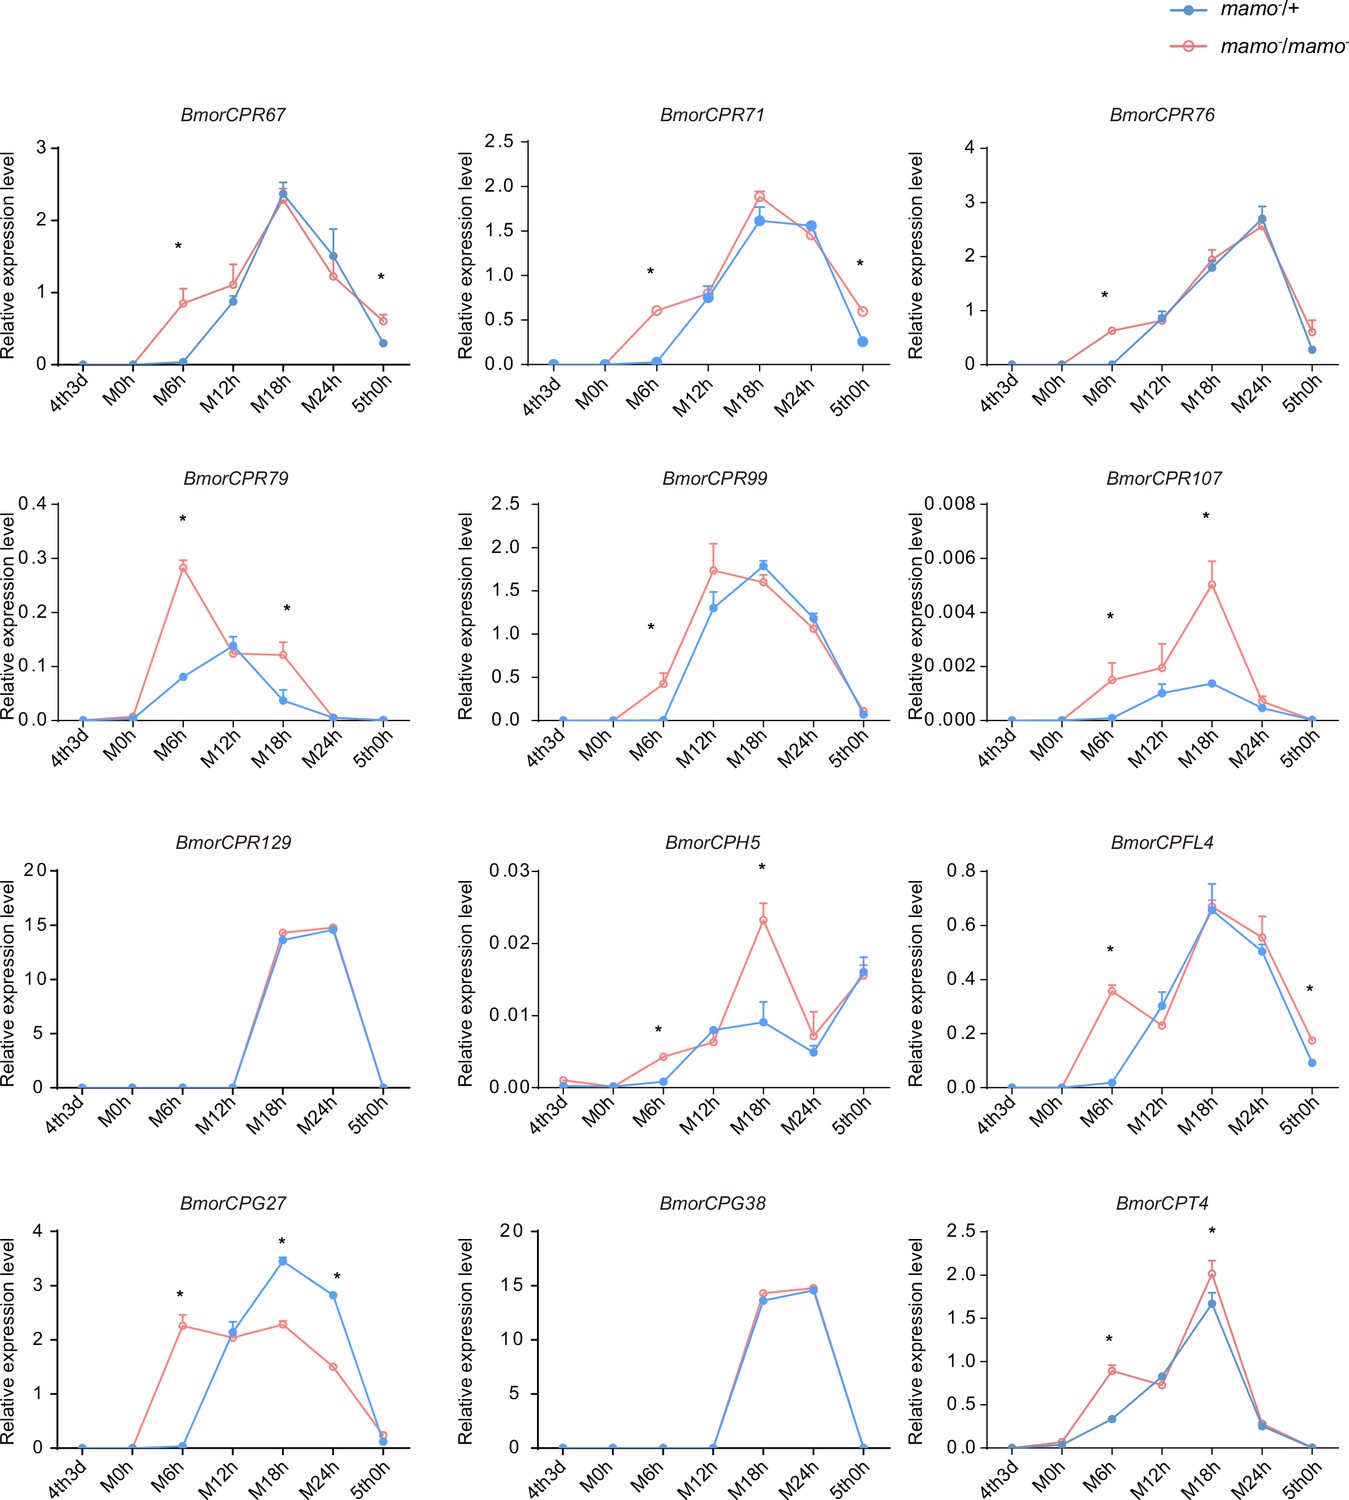
The expression levels of 12 cuticular protein-encoding genes were detected.
The expression levels of the orthologous genes of the cuticular protein genes highly expressed in the black marking of Papilio xuthus caterpillars in the silkworm caterpillars were detected. Blue indicates heterozygous Bm-mamo gene knockout individuals, and red indicates homozygous Bm-mamo gene knockout individuals. The mean ± SD, n=3. *p < 0.05 (Student’s t test). 4th3d indicates the 4th instar on Day 3, M indicates molting, and h indicates hours.
Figure 11—figure supplement 1

Heatmap of 28 differentially expressed cuticular protein genes.
Differentially expressed cuticular protein genes between homozygous (mamo−/mamo−) and heterozygous (mamo−/+) Bm-mamo knockout individuals. Red indicates upregulation in homozygous individuals. Blue indicates downregulation in homozygous individuals. White indicates no difference in expression level or no investigation. 4th1d indicates 4-instar Day 1, M indicates molting, and h indicates hours.
Figure 12 with 1 supplement
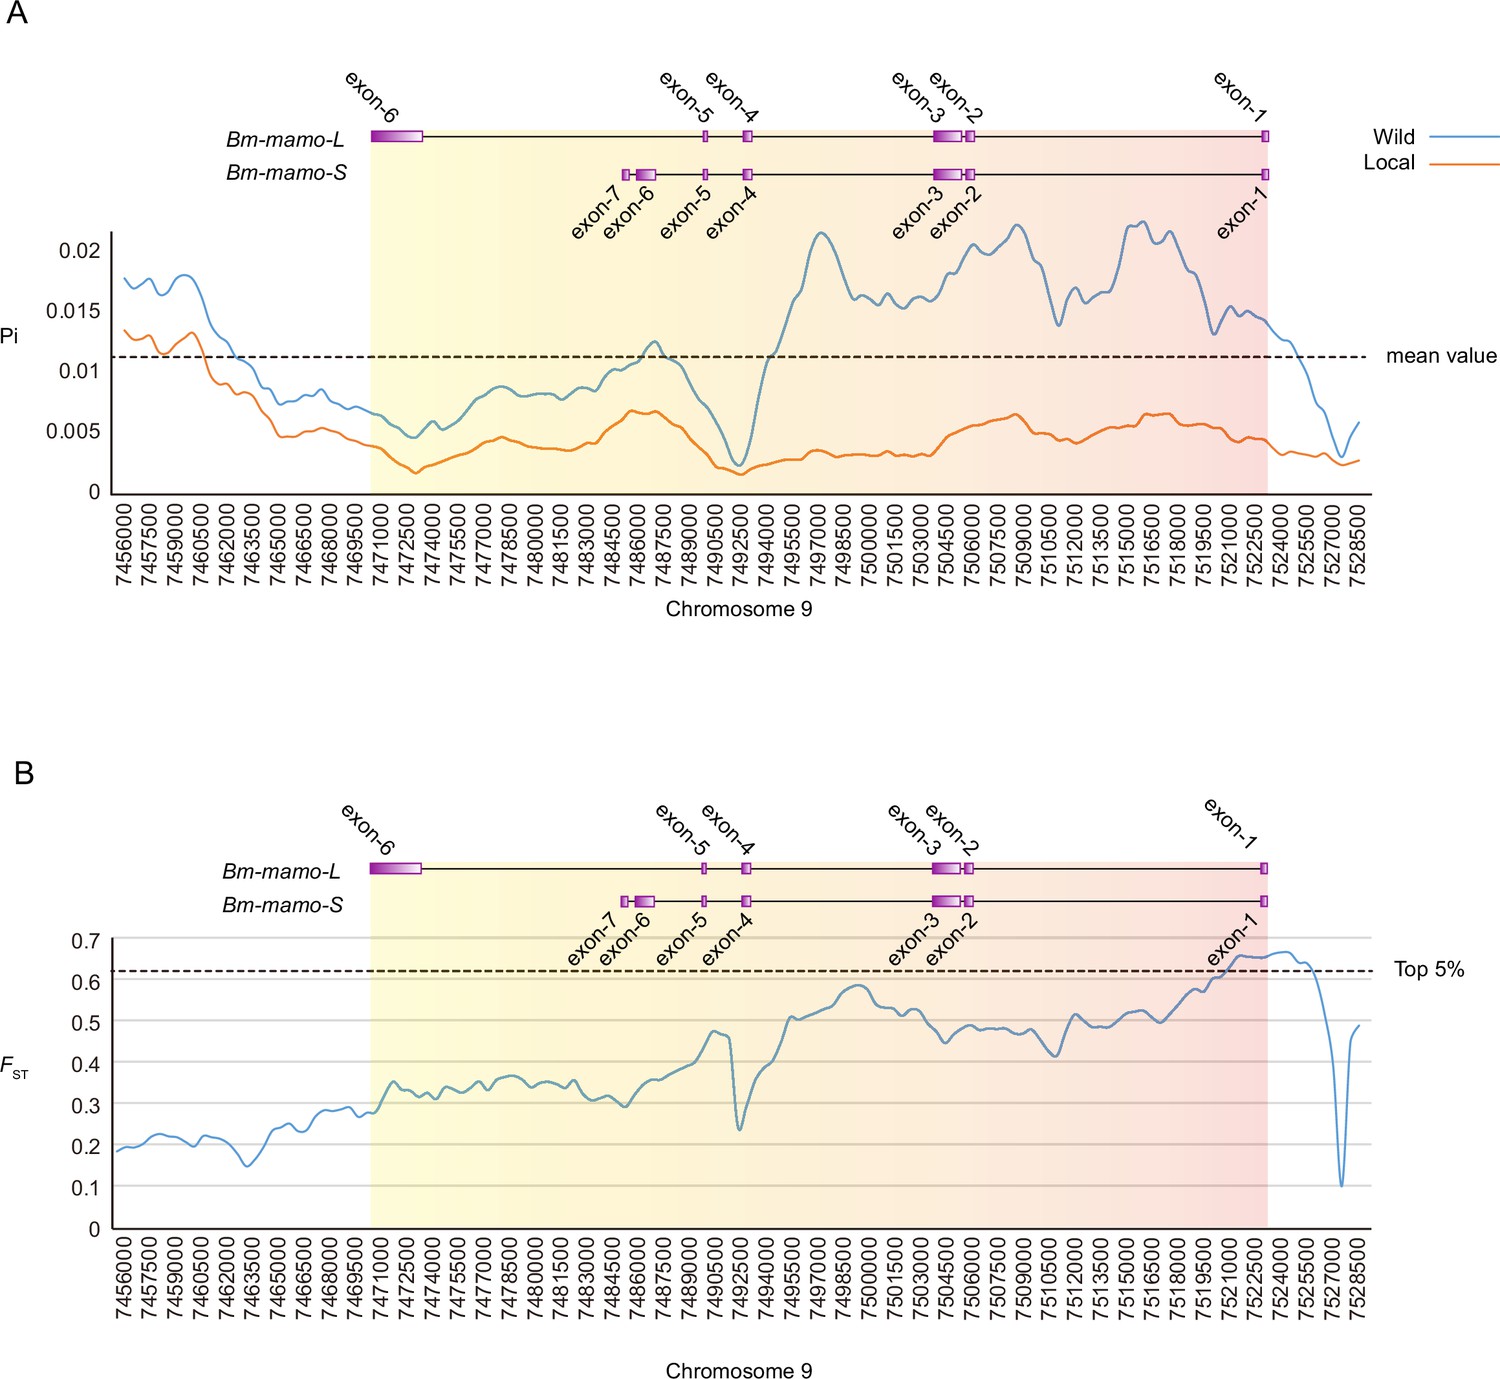
Investigation of nucleotide diversity and fixation index in the Bm-mamo genomic region using 51 wild and 171 domestic silkworm strains.
(A) Nucleotide diversity analysis. The greater the value of pi (π) is, the greater the diversity of nucleotide sequences within the population. The dashed line represents the average nucleotide diversity level of the silkworm. The X-axis represents the position of chromosome 9. (B) Fixation index analysis. The greater the value of FST is, the greater the degree of differentiation of alleles between populations. The dashed line represents the top 5% fixation level of silkworms. The X-axis represents the position of chromosome 9.
Figure 12—figure supplement 1
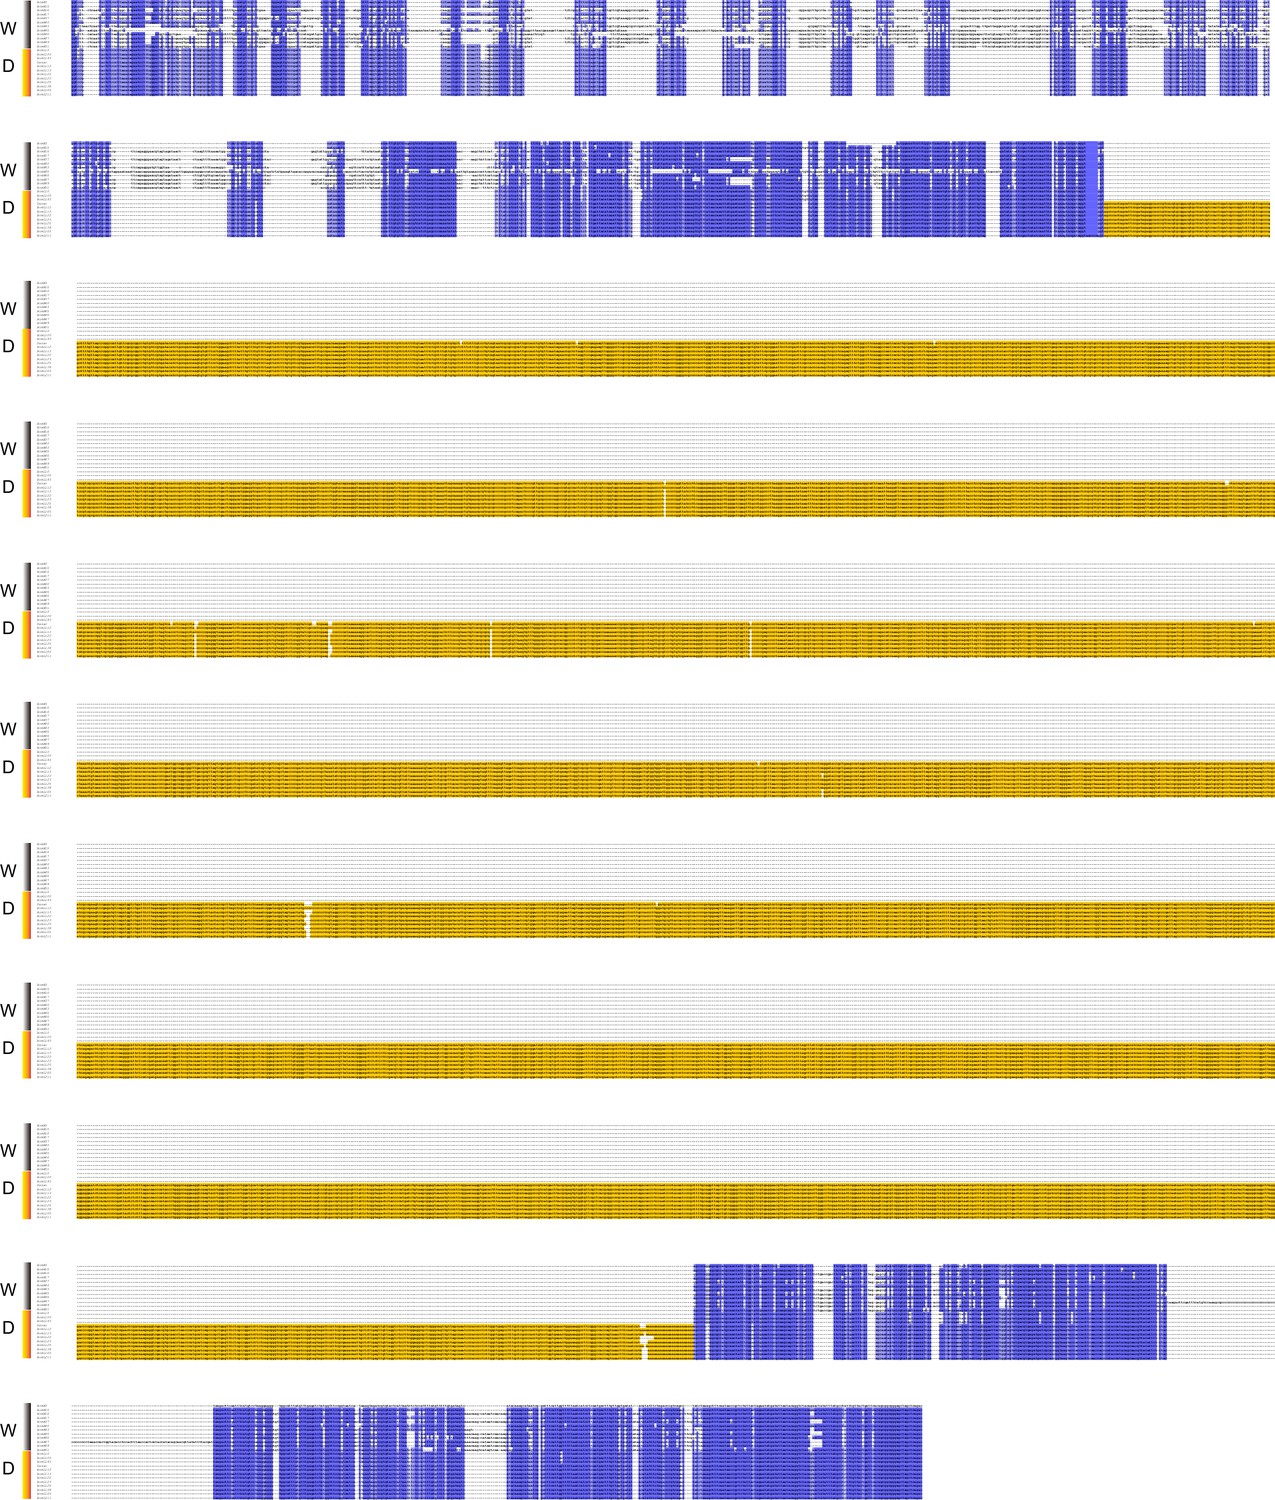
The multiple sequence alignment of the upstream sequences of Bm-mamo among 12 wild silkworms and 12 domesticated silkworms.
W indicates wild-type strains. D indicates domesticated strains. Yellow indicates long interspersed nuclear elements (LINEs).
-
Figure 12—figure supplement 1—source data 1
Upstream sequences of mamo genes in 12 wild silkworm and 12 domestic silkworm strains.
- https://cdn.elifesciences.org/articles/90795/elife-90795-fig12-figsupp1-data1-v1.xlsx
Additional files
-
Supplementary file 1
bdf linkage analysis of the BC1 population.
‘A’ indicates homozygosity, and ‘H’ indicates heterozygosity.
- https://cdn.elifesciences.org/articles/90795/elife-90795-supp1-v1.xlsx
-
Supplementary file 2
The indel and single-nucleotide polymorphism (SNP) in the region responsible for bdf.
- https://cdn.elifesciences.org/articles/90795/elife-90795-supp2-v1.xlsx
-
Supplementary file 3
Binding site analysis of Bm-mamo-L.
The position weight matrix of the mamo-L protein was used to search for 2000 base pair regions upstream and downstream of the predicted silkworm gene.
- https://cdn.elifesciences.org/articles/90795/elife-90795-supp3-v1.xlsx
-
Supplementary file 4
Binding site analysis of Bm-mamo-S.
The position weight matrix of the mamo-s protein was used to search for 2000 base pair regions upstream and downstream of the predicted silkworm gene.
- https://cdn.elifesciences.org/articles/90795/elife-90795-supp4-v1.xlsx
-
Supplementary file 5
Differentially expressed genes between bd/bd and +/bd individuals.
- https://cdn.elifesciences.org/articles/90795/elife-90795-supp5-v1.xlsx
-
Supplementary file 6
The orthologs of 19 cuticular protein genes.
- https://cdn.elifesciences.org/articles/90795/elife-90795-supp6-v1.xlsx
-
Supplementary file 7
The genes encoding cuticular proteins with high expression in the black epidermal region of Papilio xuthus caterpillars.
Futahashi R, et al. Comprehensive microarray-based analysis for stage-specific larval camouflage pattern-associated genes in the swallowtail butterfly, Papilio xuthus. BMC Biol. 2012;10:46. Published 2012 May 31. doi:10.1186/1741-7007-10-46
- https://cdn.elifesciences.org/articles/90795/elife-90795-supp7-v1.xlsx
-
Supplementary file 8
The temporal expression of the mamo gene in Drosophila melanogaster.
Brown JB, Boley N, Eisman R, et al. Diversity and dynamics of the Drosophila transcriptome. Nature. 2014;512(7515):393–399. doi:10.1038/nature12962
- https://cdn.elifesciences.org/articles/90795/elife-90795-supp8-v1.xlsx
-
Supplementary file 9
Information on the silkworm strains.
p indicates that the larva has a pale body color and has no markings. p3 indicates that the larva has a pale body color and has eye spots, lunar spots, and star spots. The hyphen indicates not available. The wild indicates the wild silkworm (Bombyx mandarina). ‘Local’ indicates domesticated strains.
- https://cdn.elifesciences.org/articles/90795/elife-90795-supp9-v1.xlsx
-
Supplementary file 10
Primers used for this research.
- https://cdn.elifesciences.org/articles/90795/elife-90795-supp10-v1.xlsx
-
MDAR checklist
- https://cdn.elifesciences.org/articles/90795/elife-90795-mdarchecklist1-v1.docx
Download links
A two-part list of links to download the article, or parts of the article, in various formats.
Downloads (link to download the article as PDF)
Open citations (links to open the citations from this article in various online reference manager services)
Cite this article (links to download the citations from this article in formats compatible with various reference manager tools)
The BTB-ZF gene Bm-mamo regulates pigmentation in silkworm caterpillars
eLife 12:RP90795.
https://doi.org/10.7554/eLife.90795.4


