Hammerhead-type FXR agonists induce an enhancer RNA Fincor that ameliorates nonalcoholic steatohepatitis in mice
- Department of Molecular and Integrative Physiology, University of Illinois at Urbana-Champaign, United States
- Department of Biochemistry and Molecular Biology, McGovern Medical School, University of Texas Health Science Center, United States
Figures
Figure 1 with 2 supplements
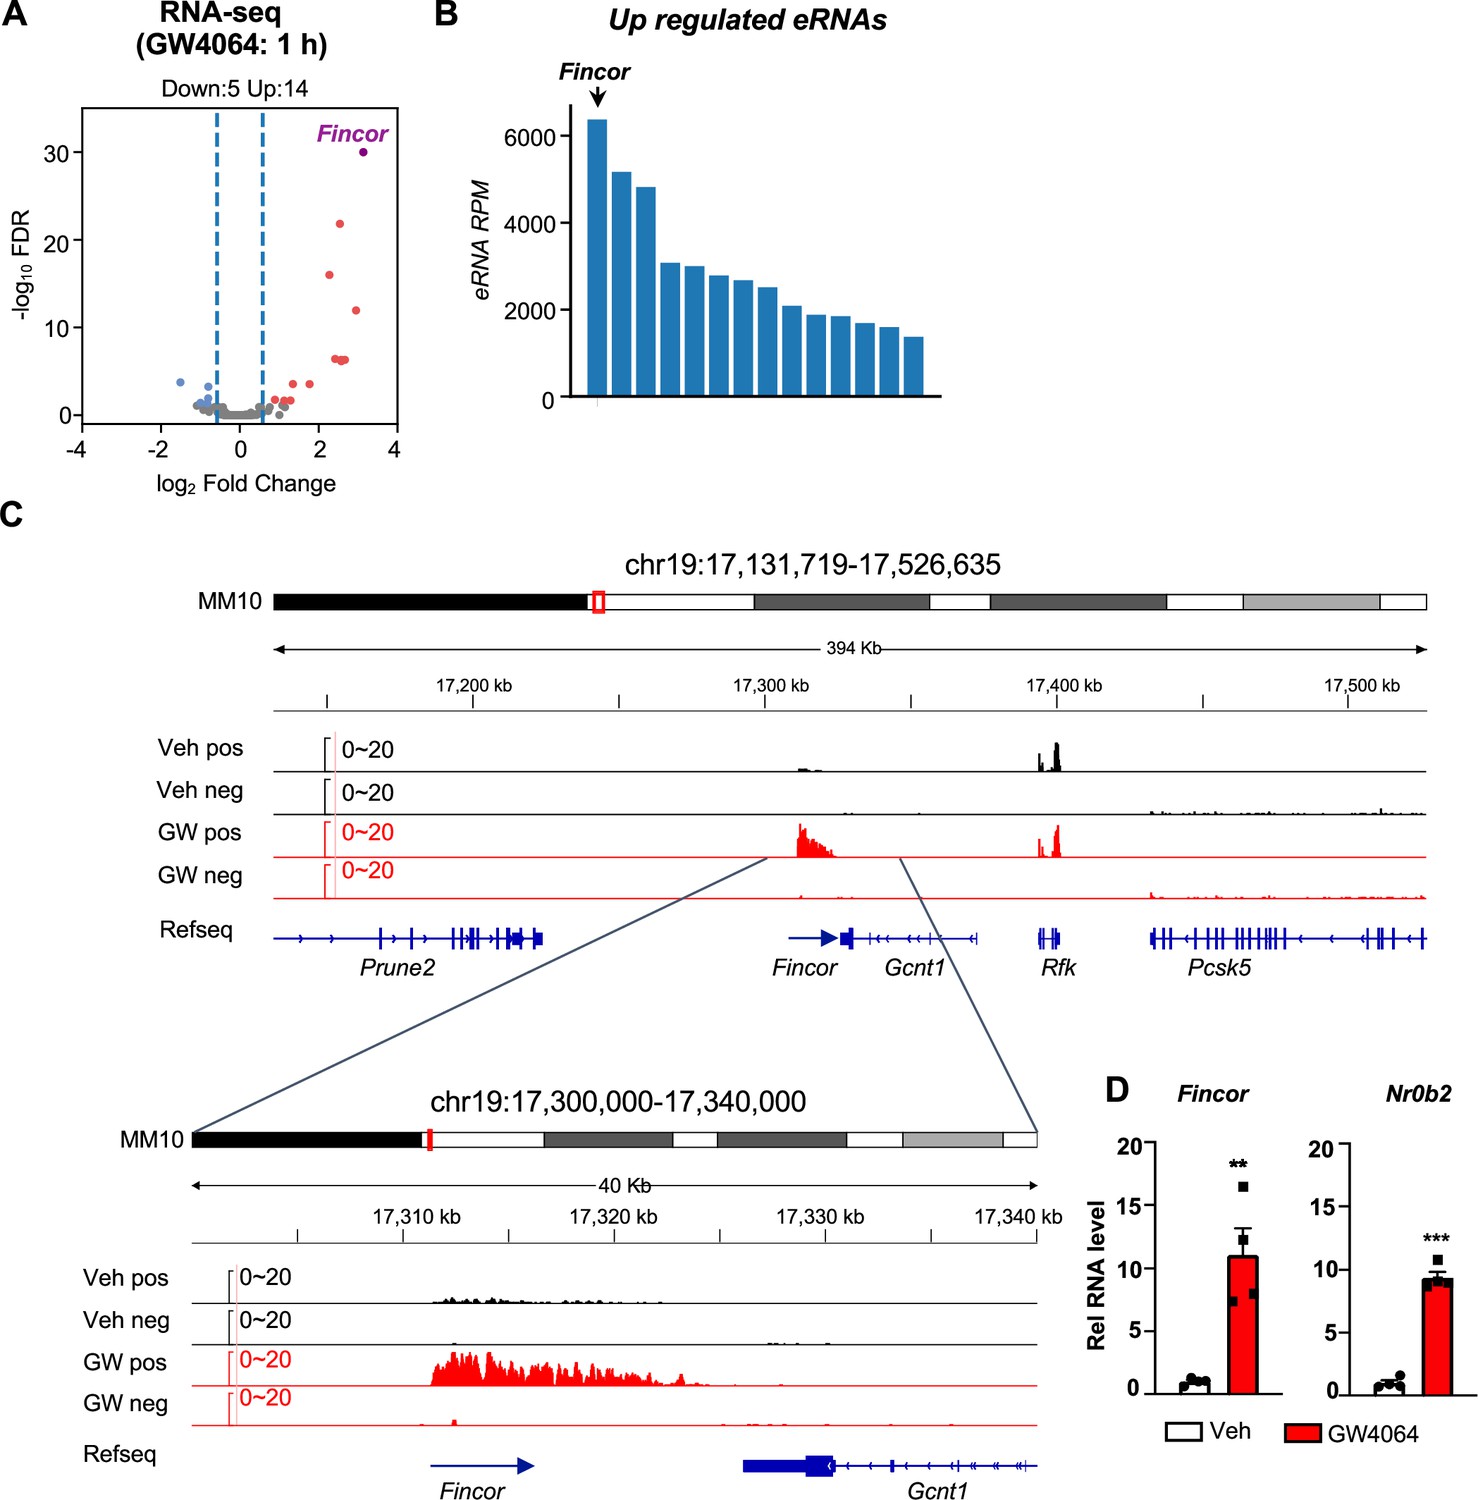
Activation of farnesoid X receptor (FXR) by GW4064 induces FXR-induced non-coding RNA (Fincor), a novel enhancer RNA (eRNA), in mouse liver.
(A) Volcano plot from RNA-seq showing significantly induced eRNAs (Fincor is highlighted) in the livers of C57BL/6 male mice treated with GW4064 (i.p. injection, 30 mg/kg, 1 hr) or vehicle. The x axis denotes log2 fold change (GW4064/Veh) of eRNAs and the y axis denotes -log10 FDR of eRNAs. (B) A bar plot showing the reads per million (RPMs) of upregulated eRNAs by GW4064 treatment. (C) IGV genome browser track showing RNA-seq signals from vehicle or GW4064-treated samples around the Fincor locus and its neighboring regions. A zoom-in view of Fincor is shown below. Veh, vehicle; GW, GW4064; pos, positive strand; neg, negative strand; Refseq, reference sequence. (D) Reverse transcription qPCR (RT-qPCR) data showing GW4064 induction of Fincor eRNA and Nr0b2 mRNA in the liver (n=4/group). Data are presented as mean ± SEM. Statistical significance was determined by the two-way ANOVA Sidak’s multiple comparisons test with **p<0.01 and ***p<0.001.
Figure 1—figure supplement 1
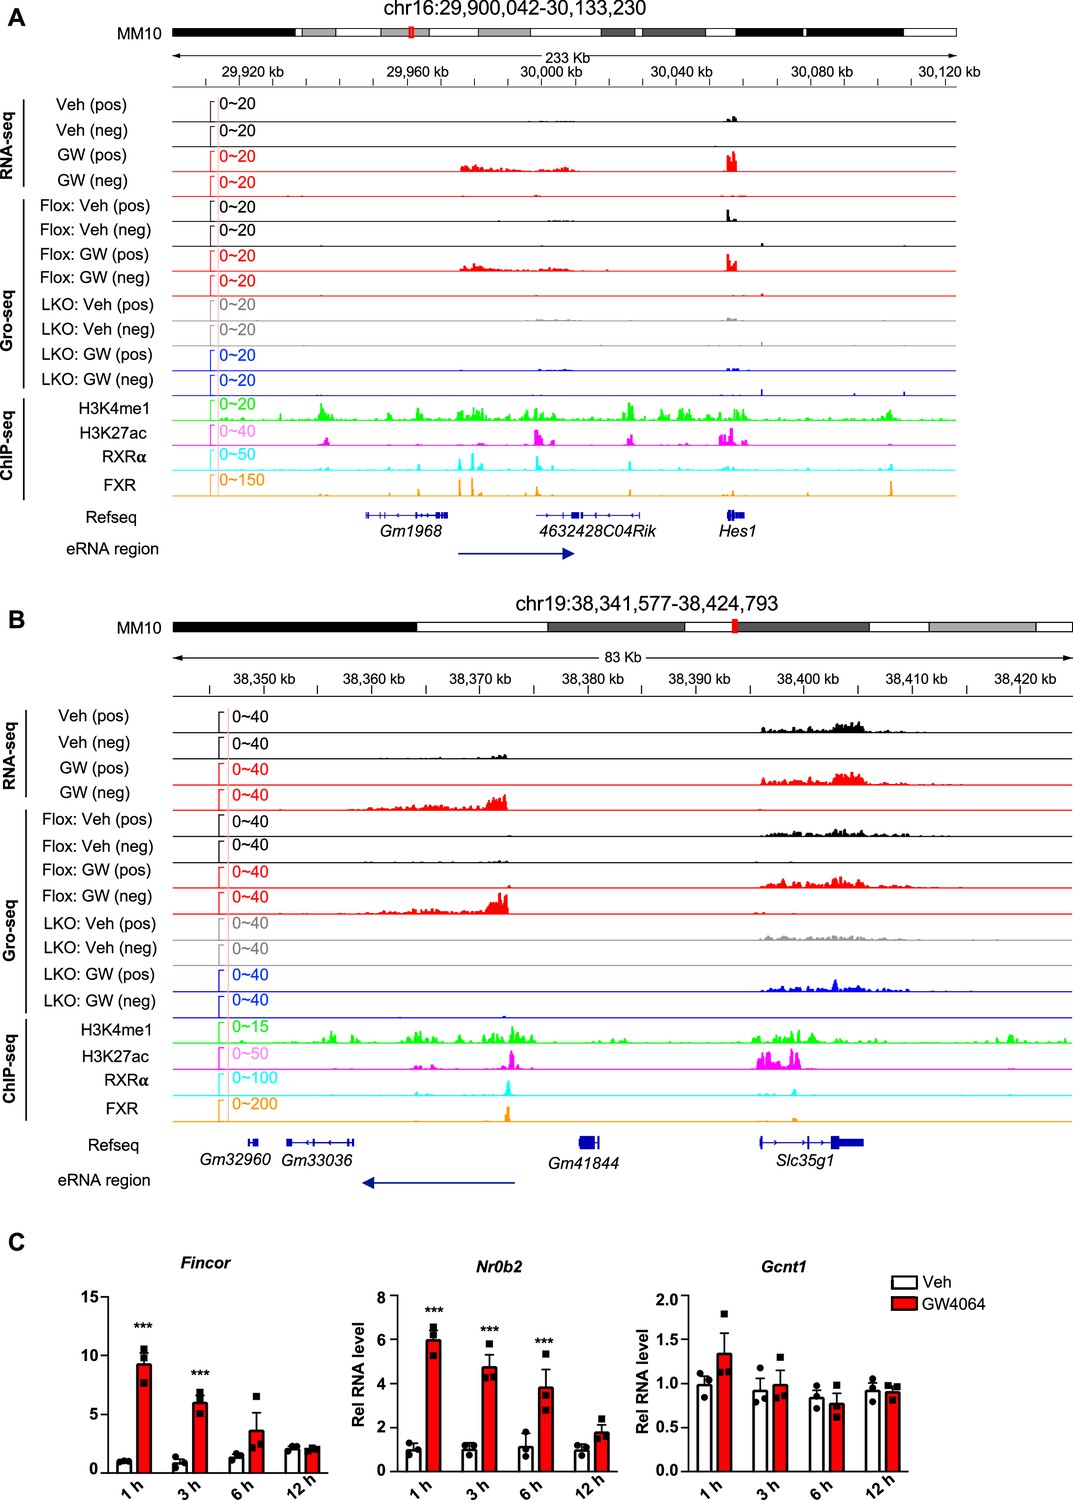
Examples of FXR-regulated eRNAs and time course expression of Fincor after FXR activation.
(A, B) Examples of farnesoid X receptor (FXR)-regulated eRNAs produced near the genes Hes1 (A) and Slc35g1 (B) were shown. (C) Time course expression of FXR-induced non-coding RNA (Fincor). C57BL/6 male mice were fasted overnight and injected i.p. with vehicle or GW4064 (30 mg/kg) for 1, 3, 6, 12 hr. Livers were collected at the indicated time points (n=3/group) and Fincor and mRNA levels of Nr0b2 and Gcnt1 were measured. Data are presented as mean ± SEM. Statistical significance was determined by the two-way ANOVA Sidak’s multiple comparisons test with *p<0.05 and ***p<0.001.
Figure 1—figure supplement 2
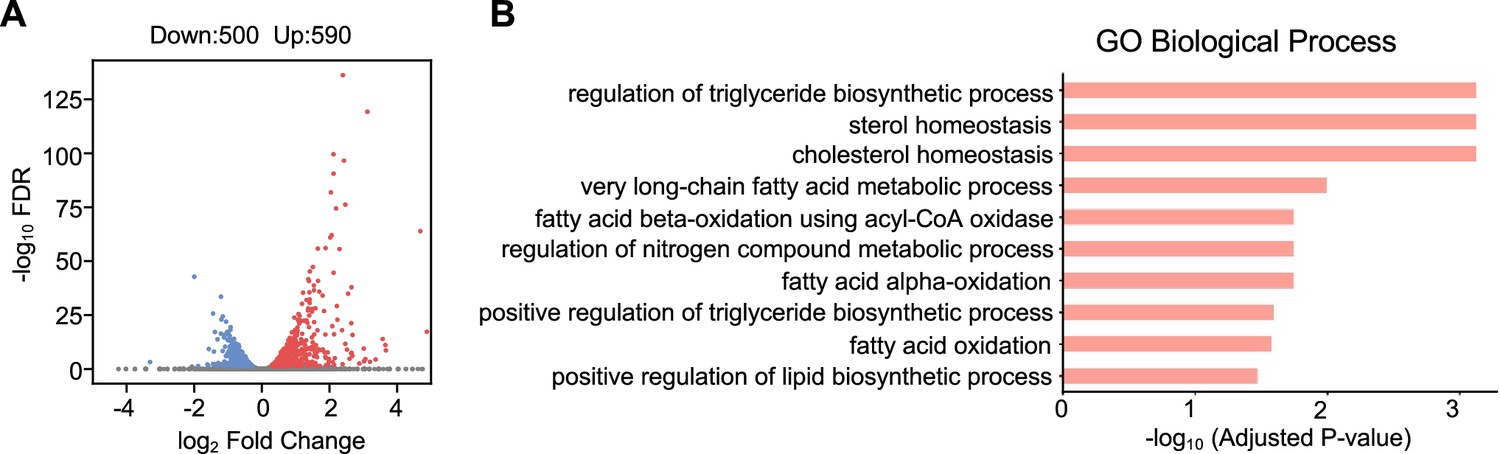
RNA-seq analysis of the differentially expressed genes in the GW4064-treated mouse liver.
(A) Volcano plot showing the differential expressed genes (DEGs) after GW4064 treatment (DESeq2 FDR <0.05). The numbers refer to the number of genes up- or downregulated. (B) Bar plot showing the enriched gene ontology in terms of biological processes for upregulated genes.
Figure 2 with 1 supplement
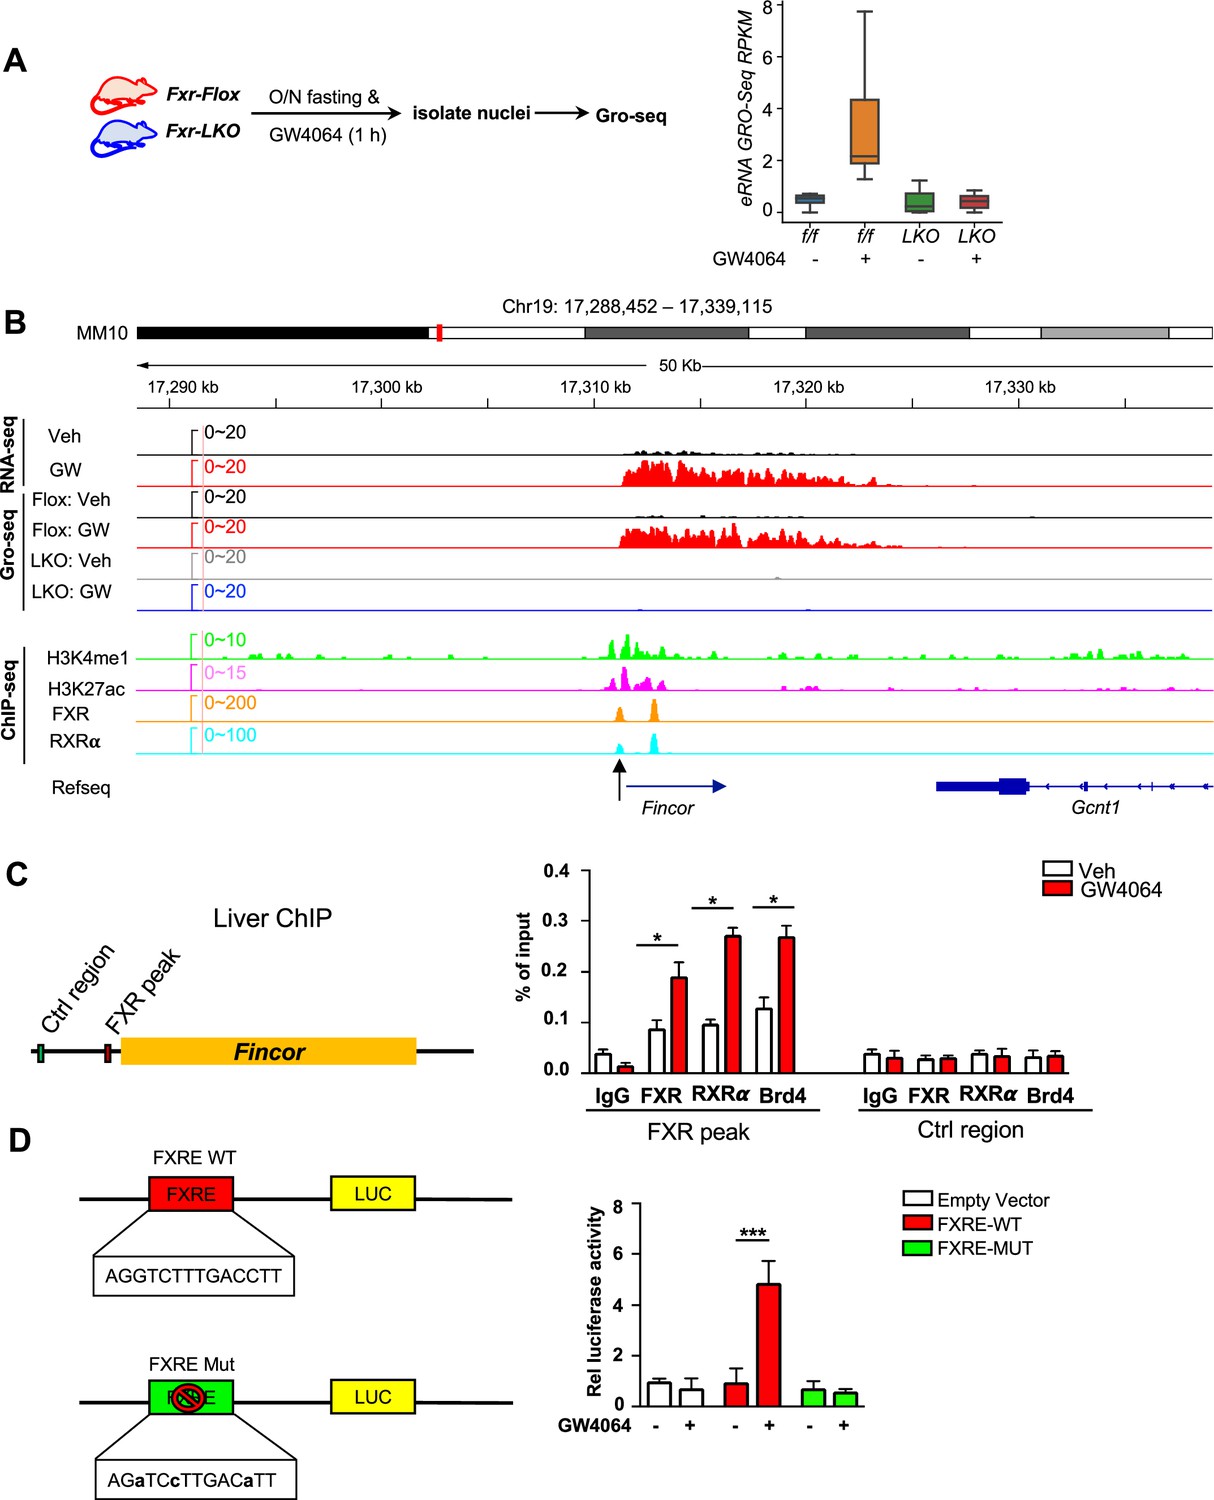
Ligand-activated farnesoid X receptor (FXR) directly activates transcription of enhancer RNAs including FXR-induced non-coding RNA (Fincor) in the liver.
(A) Left: experimental outline. Fxr floxed (Fxr-Flox) and Fxr liver-specific knockout (Fxr-LKO) male mice were fasted overnight and treated with vehicle or GW4064, and livers were collected 1 hr later with nuclei isolated for global run-on sequencing (GRO-seq) (n=2/group). Right: a boxplot shows the GRO-seq signals for GW4064 upregulated eRNAs in different conditions. RPKM: reads per kbp per million. (B) IGV genome browser track showing RNA-seq, GRO-seq, and ChIP-seq signals in the Fincor locus. An arrow at the bottom points to the FXR ChIP-seq peak that contains an IR1 motif. (C) ChIP assays were performed in the same liver samples described in Figure 1A to detect FXR, retinoid X receptor alpha (RXRα), and bromodomain-containing protein 4 (BRD4) occupancy at the FXR binding peak region close to the transcription start site of Fincor (black arrow in B). (D) HepG2 cells were transfected with luciferase reporter expressing wild-type FXRE or mutant FXRE (see Materials and methods) for 24 hr before treatment with GW4064 for an additional 6 hr. Relative luciferase activities are shown. (C–D) Data are presented as mean ± SEM (n=3/group). Statistical significance was determined by the Student’s t test with *p<0.05 and ***p<0.001.
Figure 2—figure supplement 1

Validation of Fincor expression and the analysis of the epigenetic features (presence of histone marks and binding of FXR and RXR⍺) at the enhancers that display FXR-induced eRNAs.
(A) Farnesoid X receptor (FXR) protein levels in the livers isolated from Fxr floxed (Fxr-Flox) and Fxr liver-specific knockout (Fxr-LKO) mice are shown. (B) Validation of hepatic FXR-dependent induction of FXR-induced non-coding RNA (Fincor) by qPCR (n=3/group). The gene Nr0b2 was used as a control. Data are presented as mean ± SEM. Statistical significance was determined by the two-way ANOVA Tukey’s multiple comparisons test with *p<0.05 and **p<0.01. (C) Metagene plots showing H3K27ac, H3K4me1, FXR, and retinoid X receptor alpha (RXRα) ChIP-seq profiles centered on upregulated eRNAs.
Figure 3
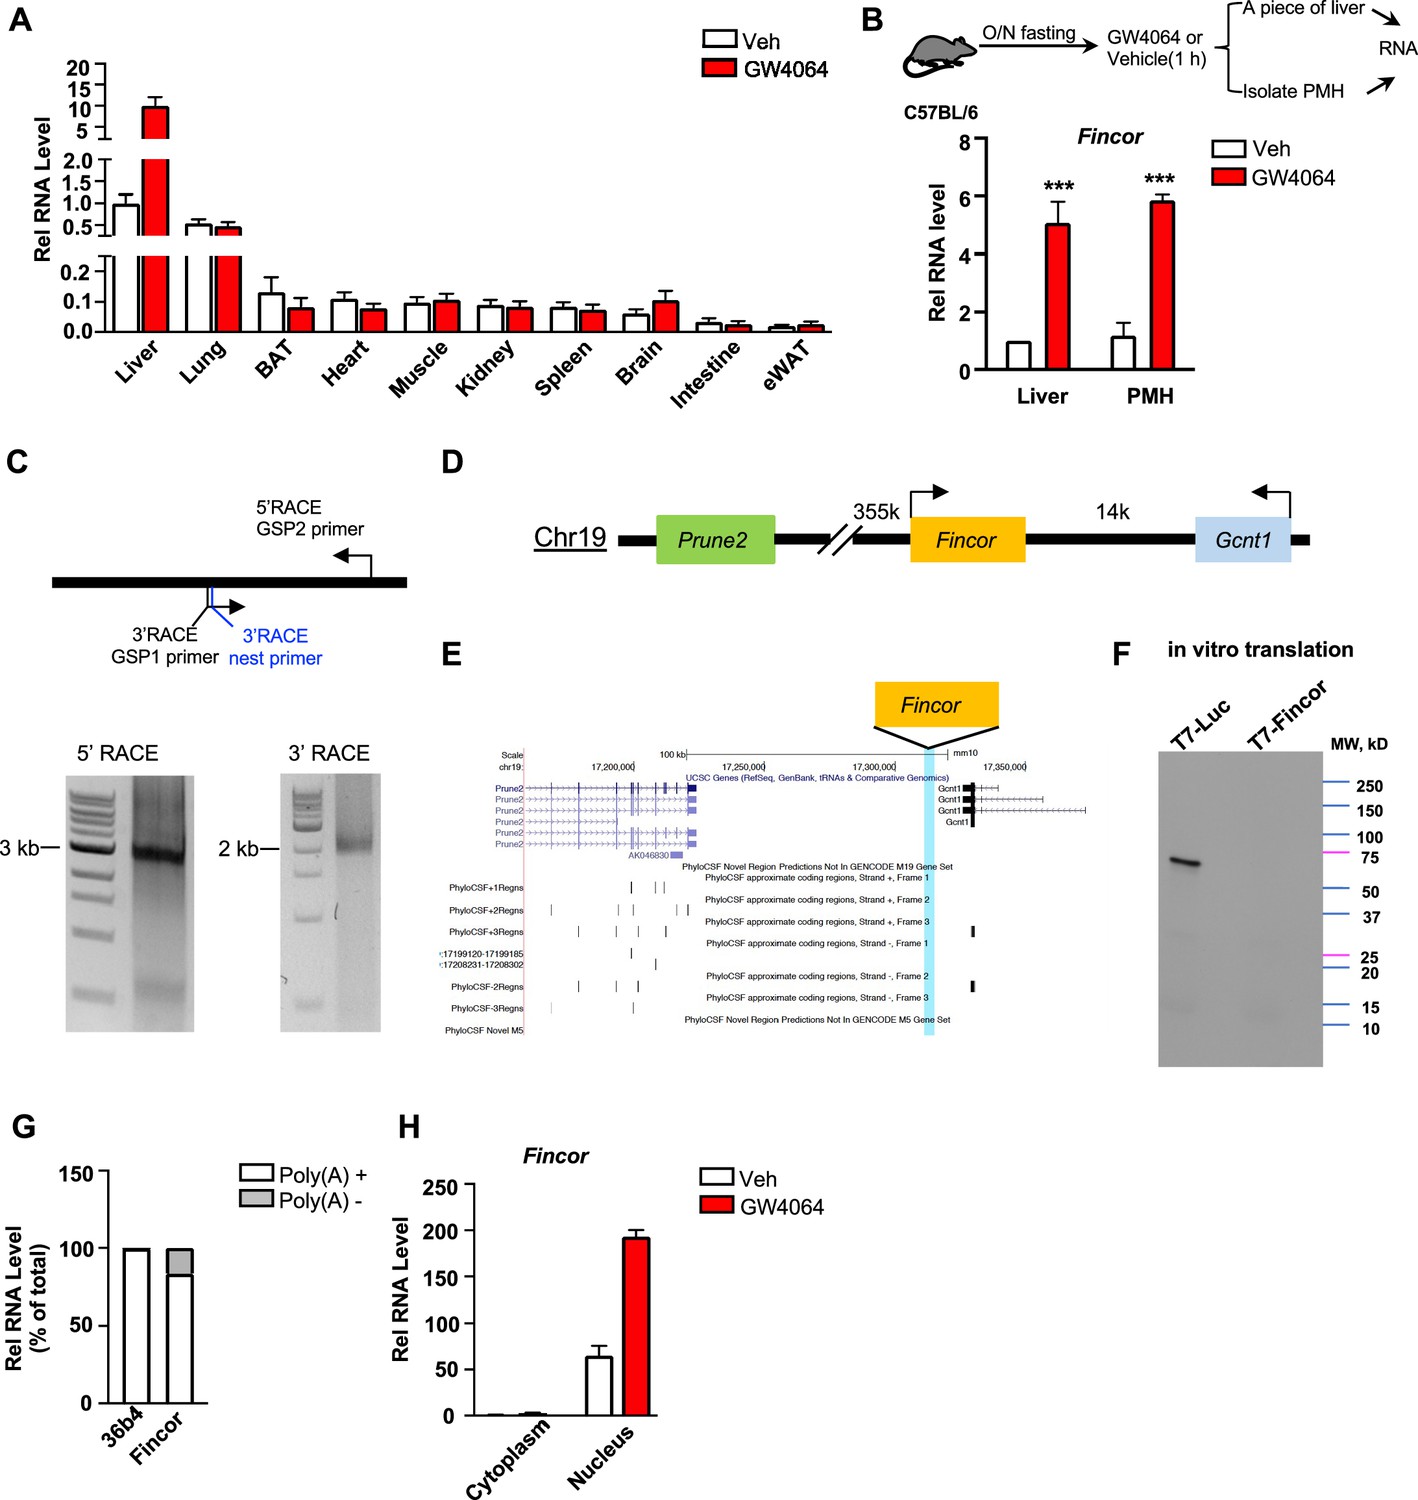
Farnesoid X receptor-induced non-coding RNA (Fincor) is a liver-specific nucleus-enriched eRNA.
(A) Expression levels of Fincor in various tissues after GW4064 treatment. Data from C57BL/6 male mice fasted overnight and i.p. injected with vehicle or GW4064 (30 mg/kg) for 1 hr (n=2/group). Data are presented as mean ± SD. BAT, brown adipose tissue; eWAT, epididymal white adipose tissue. (B) C57BL/6 male mice were fasted overnight and injected i.p. with vehicle or GW4064 (30 mg/kg) for 1 hr. One small piece of liver was snap-frozen for later RNA isolation and the remaining part was used for immediate primary hepatocyte isolation. Then, RNAs were extracted from liver or primary hepatocytes and Fincor expression was measured (n=3/group). Data are presented as mean ± SEM. Statistical significance was determined by the Student’s t-test with ***p<0.001. (C) Agarose gel electrophoresis of PCR products generated in 5′ (left) and 3′ (right) RACE of Fincor in liver samples. Primer locations are shown. RACE, rapid amplification of cDNA ends. GSP: gene-specific primer. (D) A schematic diagram showing location of Fincor relative to nearby genes in the mice genome. (E) PhyloCSF analysis of the coding potential of Fincor. (F) In vitro translation of Fincor using the Promega Transcend Non-Radioactive Translation Detection Systems. Luciferase is used as a control for coding RNA. (G) qPCR analysis of Fincor, 36b4 in Poly(A)+ and Poly(A)- RNA fractions from GW4064-treated mouse liver. (H) Fincor identified in the subcellular fractions using cellular fractionation assays. Primary hepatocytes were isolated from GW4064 or DMSO-treated mice and the cytoplasm and nucleus fractions of these hepatocytes were separated and both fractions were subjected to RNA extraction and qPCR (n=2/group). Data are presented as mean ± SD.
-
Figure 3—source data 1
Original file for the gel images shown in Figure 3C.
- https://cdn.elifesciences.org/articles/91438/elife-91438-fig3-data1-v1.zip
-
Figure 3—source data 2
Original file for the gel images shown in Figure 3C with highlighted bands and sample labels.
- https://cdn.elifesciences.org/articles/91438/elife-91438-fig3-data2-v1.zip
-
Figure 3—source data 3
Original file for the immunoblot image shown in Figure 3F.
- https://cdn.elifesciences.org/articles/91438/elife-91438-fig3-data3-v1.zip
-
Figure 3—source data 4
Original file for the immunoblot image shown in Figure 3F with highlighted bands and sample labels.
- https://cdn.elifesciences.org/articles/91438/elife-91438-fig3-data4-v1.zip
Figure 4
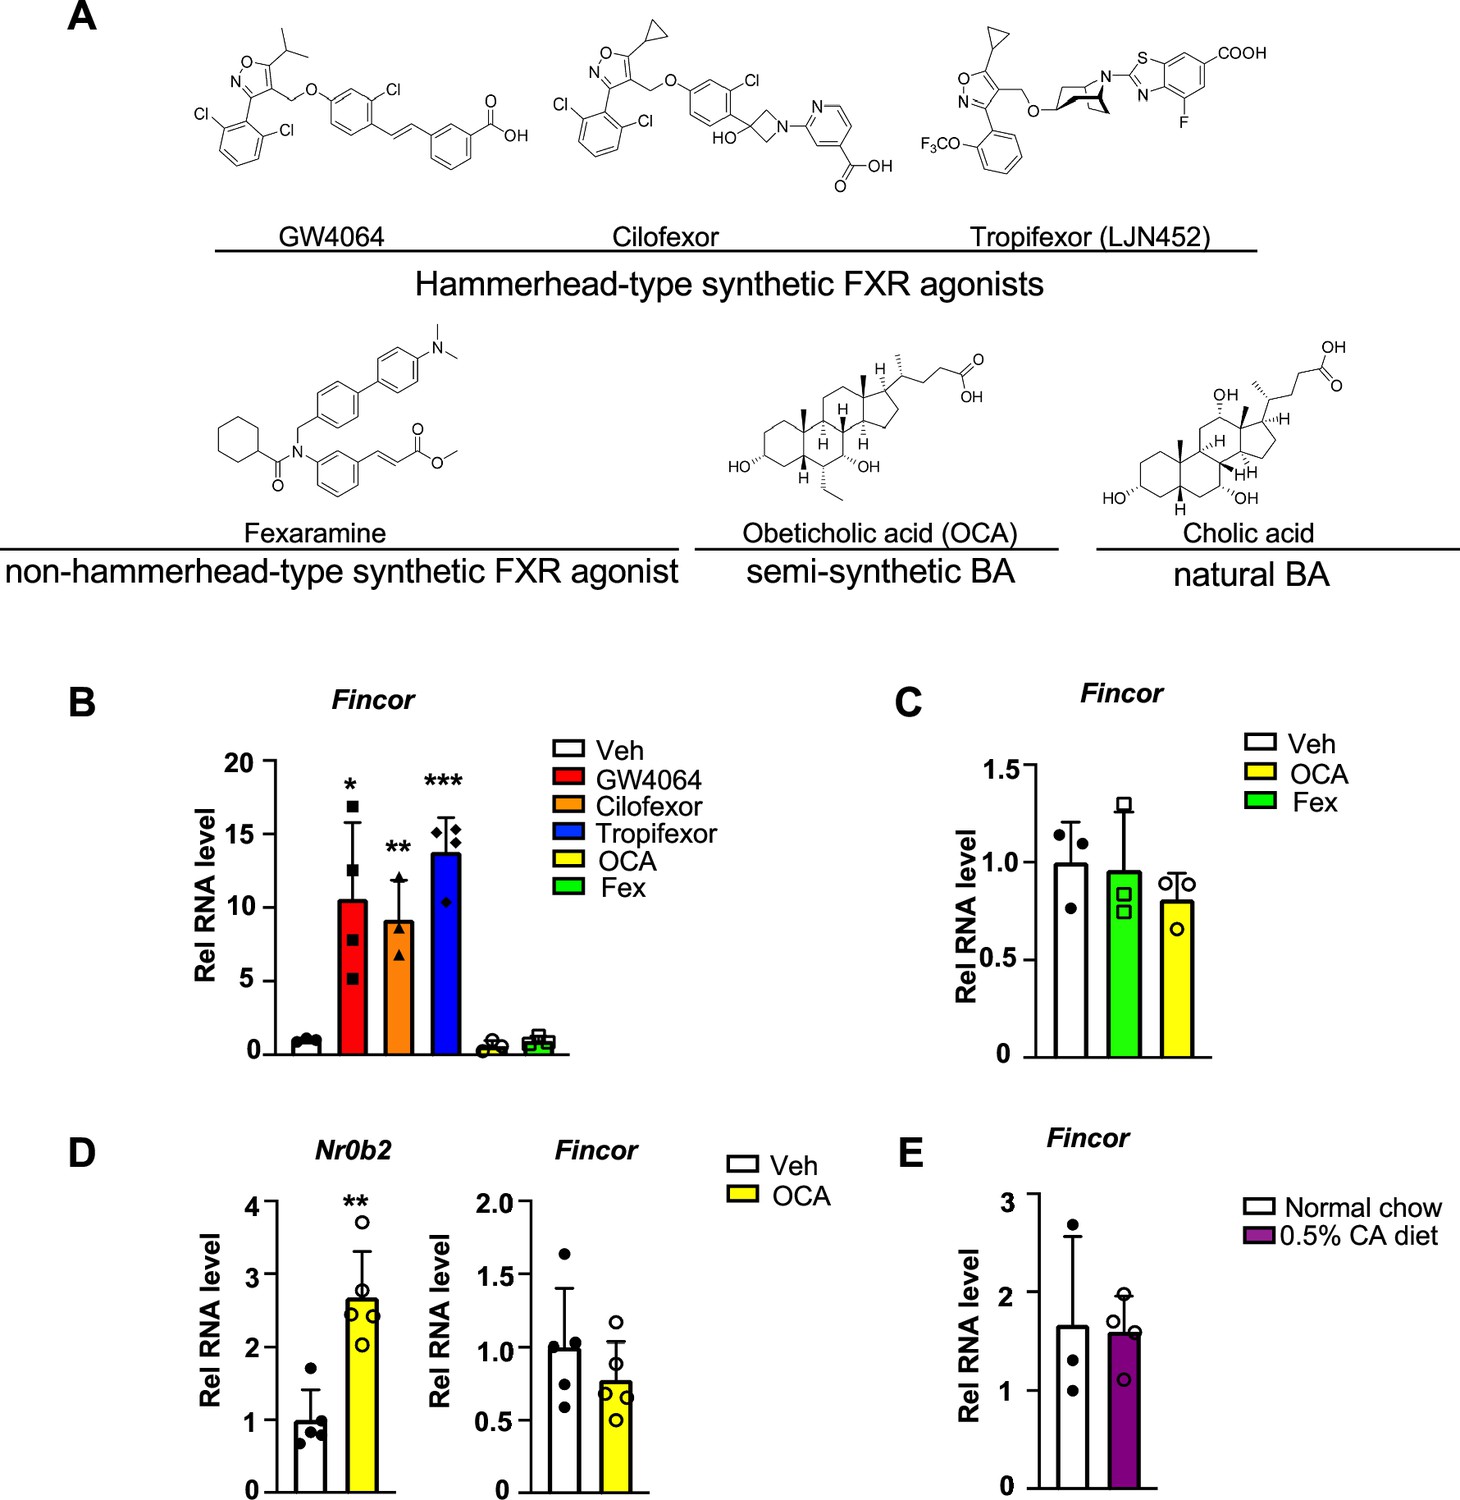
Farnesoid X receptor-induced non-coding RNA (Fincor) is induced by the hammerhead class of non-steroidal farnesoid X receptor (FXR) agonists, including GW4064 and tropifexor.
(A) The chemical structures of the FXR agonists including the hammerhead class of synthetic FXR agonists, non-hammerhead-type synthetic agonist, semi-synthetic BA, and natural BA. BA: bile acid. (B) qPCR data showing Fincor expression levels in C57BL/6 mice liver respectively treated with GW4064 (30 mg/kg), cilofexor (30 mg/kg), tropifexor (0.5 mg/kg), fexaramine (100 mg/kg), or obeticholic acid (OCA) (20 mg/kg) for 1 hr (n=3–4/group). (C) Fincor expression levels in C57BL/6 mice liver treated with OCA (20 mg/kg) or fexaramine (100 mg/kg) for 4 hr (n=3/group). (D) Expression of Fincor in C57BL/6 mice liver after daily treatment with OCA (20 mg/kg) for 7 days (n=5/group). Nr0b2 gene mRNA was measured as a positive control. (E) Expression of Fincor in C57BL/6 mice fed with 0.5% cholic acid (CA) diet for 6 hr (n=3–4/group). In panels B–E, all mice underwent overnight fasting before treatment. (B–E) Data are presented as mean ± SEM. Statistical significance was determined by the Student’s t test with *p<0.05, **p<0.01, and ***p<0.001.
Figure 5 with 1 supplement
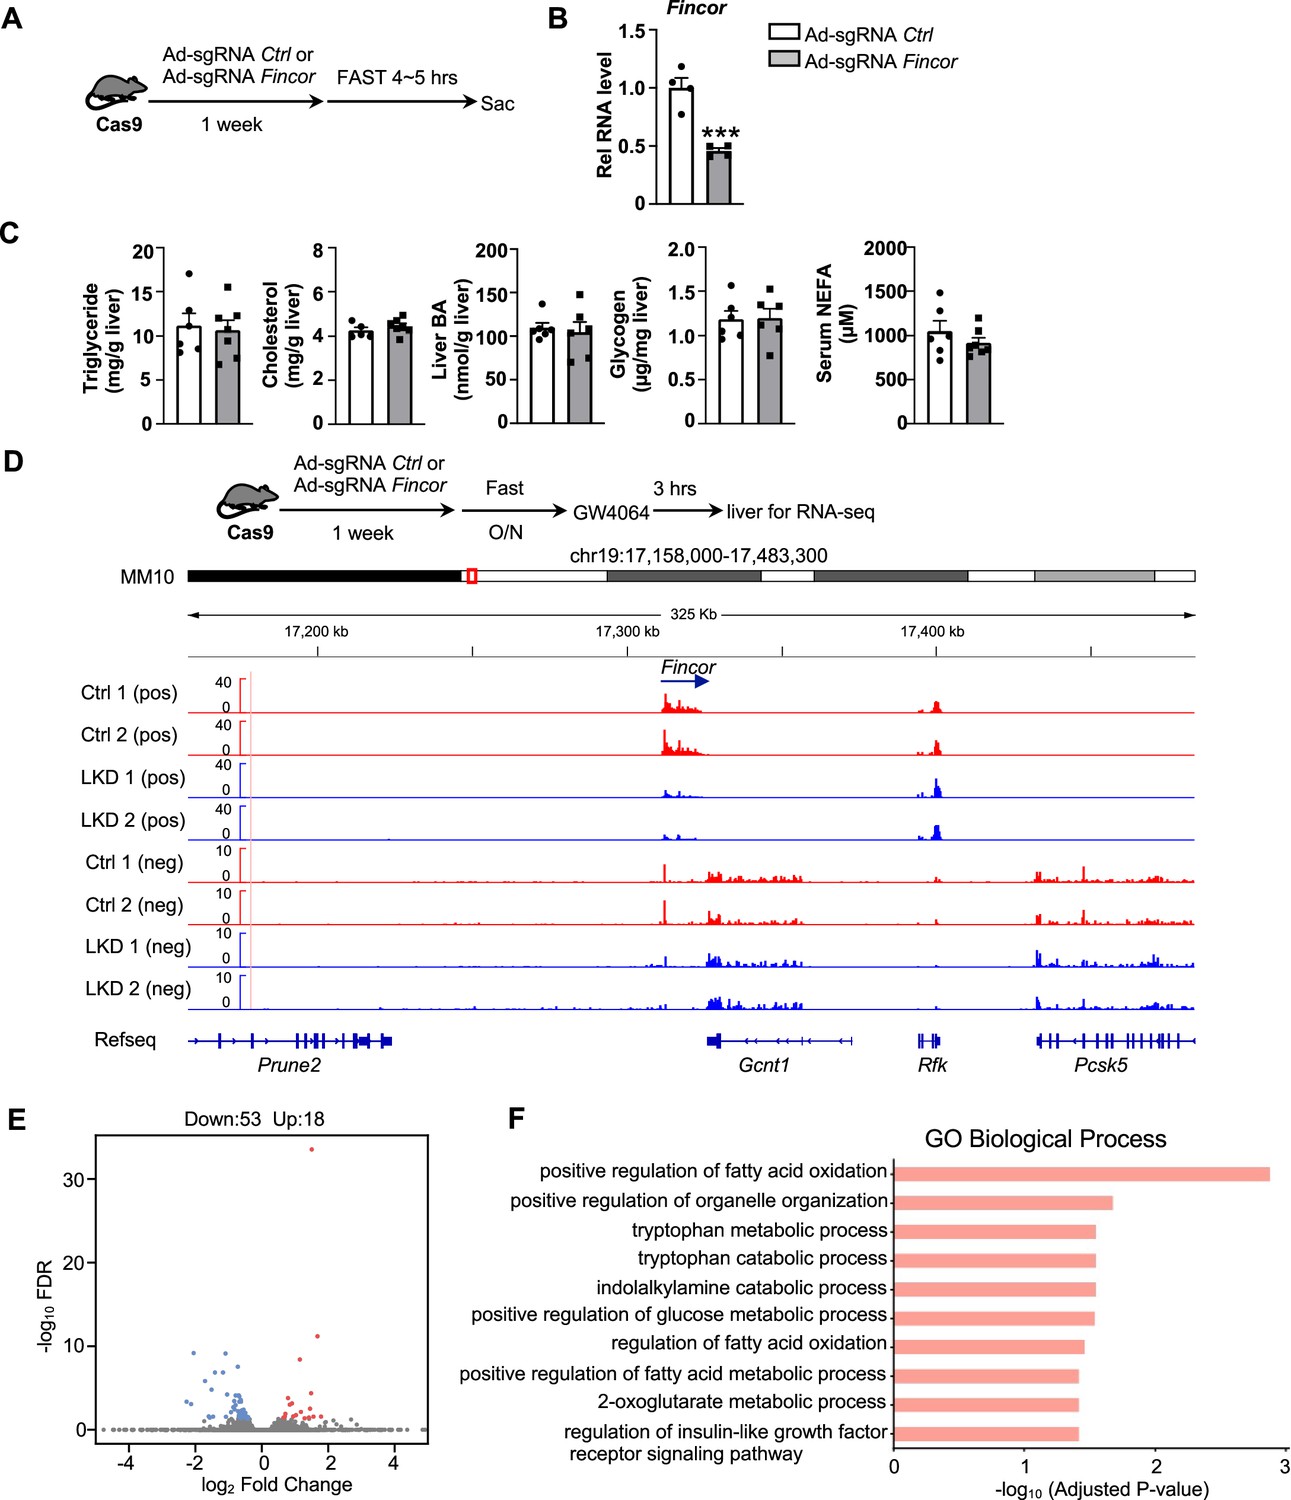
Generation of CRISPR/Cas9-mediated farnesoid X receptor-induced non-coding RNA (Fincor) liver-specific knockdown mice.
(A) Experimental scheme: male Cas9 mice were infected with adenovirus expressing sgRNA for Fincor or a control for 1 week. Then the liver and serum were collected from these mice after 4–5 hr of fasting. (B) The expression of Fincor in the liver was measured by qPCR (n=4/group). (C) Hepatic triglyceride, cholesterol, bile acid, glycogen, and serum non-esterified fatty acids (NEFA) were measured (n=5–7/group). (D) Male Cas9 mice were infected with adenovirus expressing sgRNA for Fincor or control for 1 week. Then these mice were fasted overnight and treated with GW4064 for 3 hr before tissue collection. RNA-seq profiles of expression of hepatic Fincor and the adjacent genes were shown (n=2/group). (E) Genome-wide changes in mRNA expression shown in a volcano plot. The numbers refer to the number of genes up- or downregulated by twofold or more with an adjusted p-value <0.01. (F) Gene ontology analysis of biological pathways using DAVID Tools for genes downregulated after Fincor knockdown. (B-C) Data are presented as mean ± SEM. Statistical significance was determined by the Student’s t test with ***p<0.001.
Figure 5—figure supplement 1

Generation of farnesoid X receptor-induced non-coding RNA (Fincor) liver-specific knockdown mice by CRISPR-Cas9 method.
(A) Left: experimental scheme for the farnesoid X receptor-induced non-coding RNA (Fincor) loss-of-function experiments. Right: illustration demonstrating the sequence targeted by the sgRNA in relation to the transcriptional and epigenetic profile. (B) The genomic DNAs from liver, spleen, intestine, brain, heart, muscle, kidney, lung, and adipose tissue were isolated and PCR was performed using the primers (Supplementary file 5) to verify tissue-specific knockout. (C–G) RNA-seq profiles of expression of hepatic Prune2 (C), PPP1r3g (D), Igfbp2 (E), Eda2r, (F) and Fndc1 (G) are shown (n=2/group).
-
Figure 5—figure supplement 1—source data 1
Original file for the gel image shown in Figure 5—figure supplement 1.
- https://cdn.elifesciences.org/articles/91438/elife-91438-fig5-figsupp1-data1-v1.zip
-
Figure 5—figure supplement 1—source data 2
Original file for the gel image shown in Figure 5—figure supplement 1 with highlighted bands and sample labels.
- https://cdn.elifesciences.org/articles/91438/elife-91438-fig5-figsupp1-data2-v1.zip
Figure 6
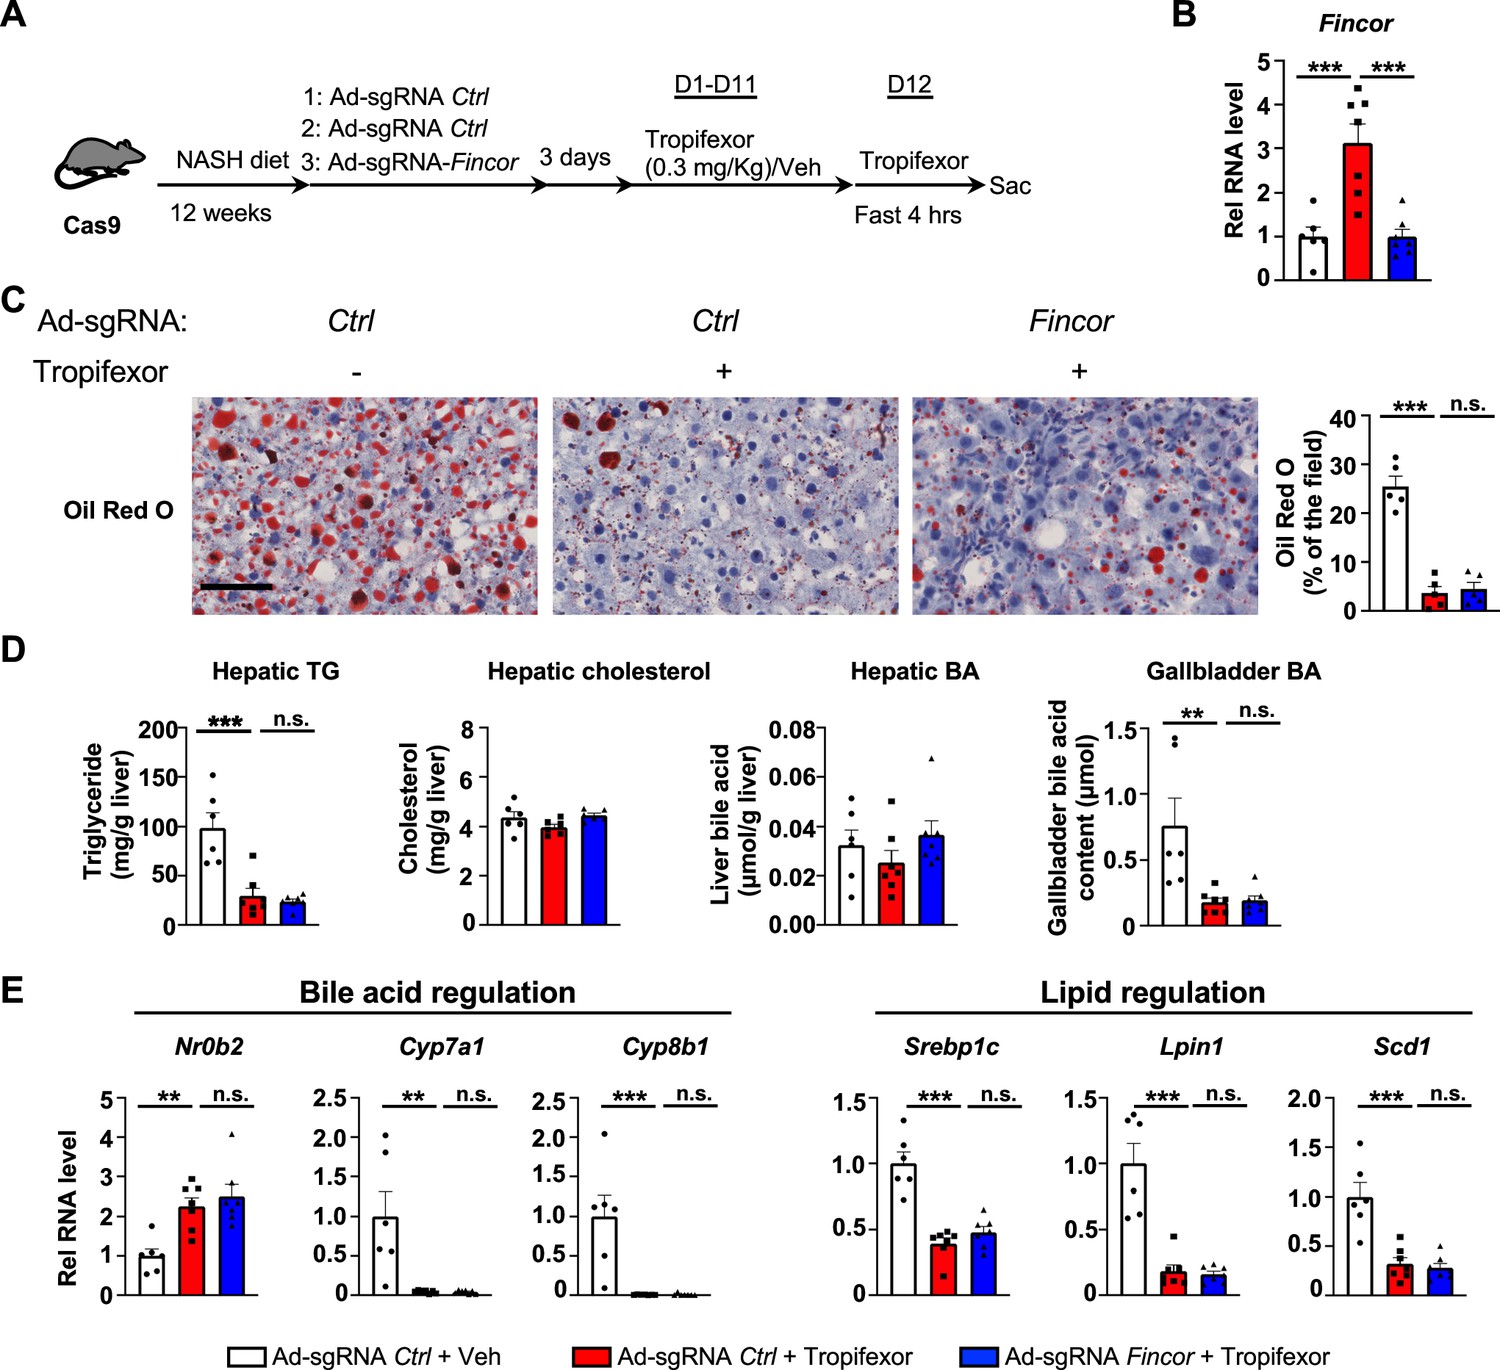
In diet-induced nonalcoholic steatohepatitis (NASH) mice, tropifexor-mediated beneficial effects on reducing hepatic steatosis are largely independent of farnesoid X receptor-induced non-coding RNA (Fincor).
(A–E) Male Cas9 mice were fed a NASH diet for 12 weeks. The mice were randomly assigned to three groups and infected with adenovirus expressing sgRNA for Fincor or control. Three days later, the mice were daily treated with tropifexor (0.3 mg/kg) or vehicle from day 1 to day 11. On day 12, the mice were given the final treatment of tropifexor or vehicle and fasted for 4 hr before tissues were collected. (A) Experimental scheme. (B) Hepatic Fincor expression was measured (n=6–7/group). (C) Oil Red O staining of liver sections. Scale bar (50 μm). Image analyses were done using ImageJ and the areas of stained field were quantified (n=5/group). (D) Hepatic TG, hepatic cholesterol, gallbladder bile acid (BA), and hepatic BA levels were measured (n=6–7/group). (E) mRNA levels in the liver of the indicated genes involved in bile acid regulation and lipid regulation (n=6–7/group). (B-E) Data are presented as mean ± SEM. Statistical significance was determined by the one-way ANOVA (Sidak’s multiple comparisons test) with *p<0.05, **p<0.01, and ***p<0.001. Ad, adenovirus; H&E, hematoxylin and eosin; TG, triglyceride; Veh, vehicle; ns, not significant.
Figure 7 with 1 supplement
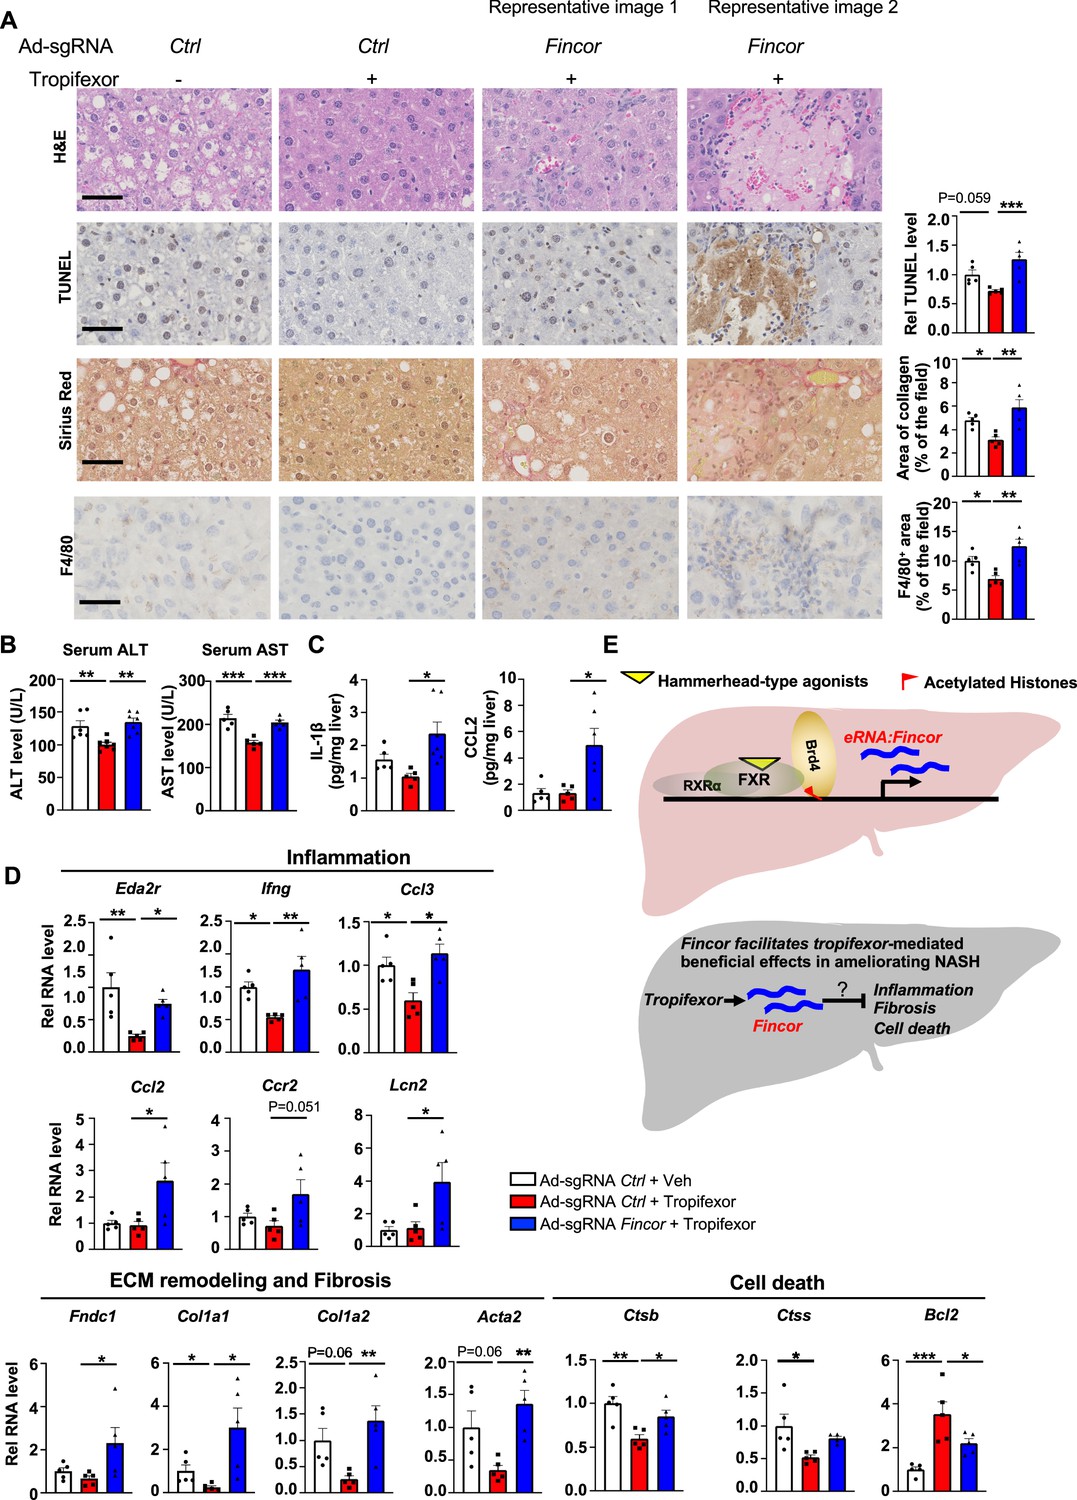
In diet-induced nonalcoholic steatohepatitis (NASH) mice, tropifexor-mediated beneficial effects on reducing liver fibrosis and inflammation are diminished by farnesoid X receptor-induced non-coding RNA (Fincor) downregulation.
(A) Representative images from hematoxylin and eosin (H&E), TUNEL, Sirius Red, and F4/80 staining of liver sections from the same cohort of mice described in Figure 6. Scale bar (50 μm). Image analyses were done using ImageJ and the area of collagen staining, TUNEL, and F4/80 levels were quantified (n=5/group). (B) Serum ALT and AST levels were measured (n=5/group). (C) IL-1β and CCL2 levels in the liver tissues were determined by ELISA (n=5/group). (D) mRNA levels in the liver of the indicated genes involved in inflammation, fibrosis, and cell death (n=5/group). (E) Model: Fincor is a liver-enriched eRNA that is induced specifically by hammerhead-type farnesoid X receptor (FXR) agonists (top). In diet-induced NASH mice, Fincor is required for tropifexor-mediated beneficial effects on reducing hepatic inflammation, fibrosis, and cell death with the mechanisms to be determined (bottom). (A–D) Data are presented as mean ± SEM. Statistical significance was determined by the one-way ANOVA (Sidak’s multiple comparisons test) with *p<0.05, **p<0.01, and ***p<0.001.
Figure 7—figure supplement 1
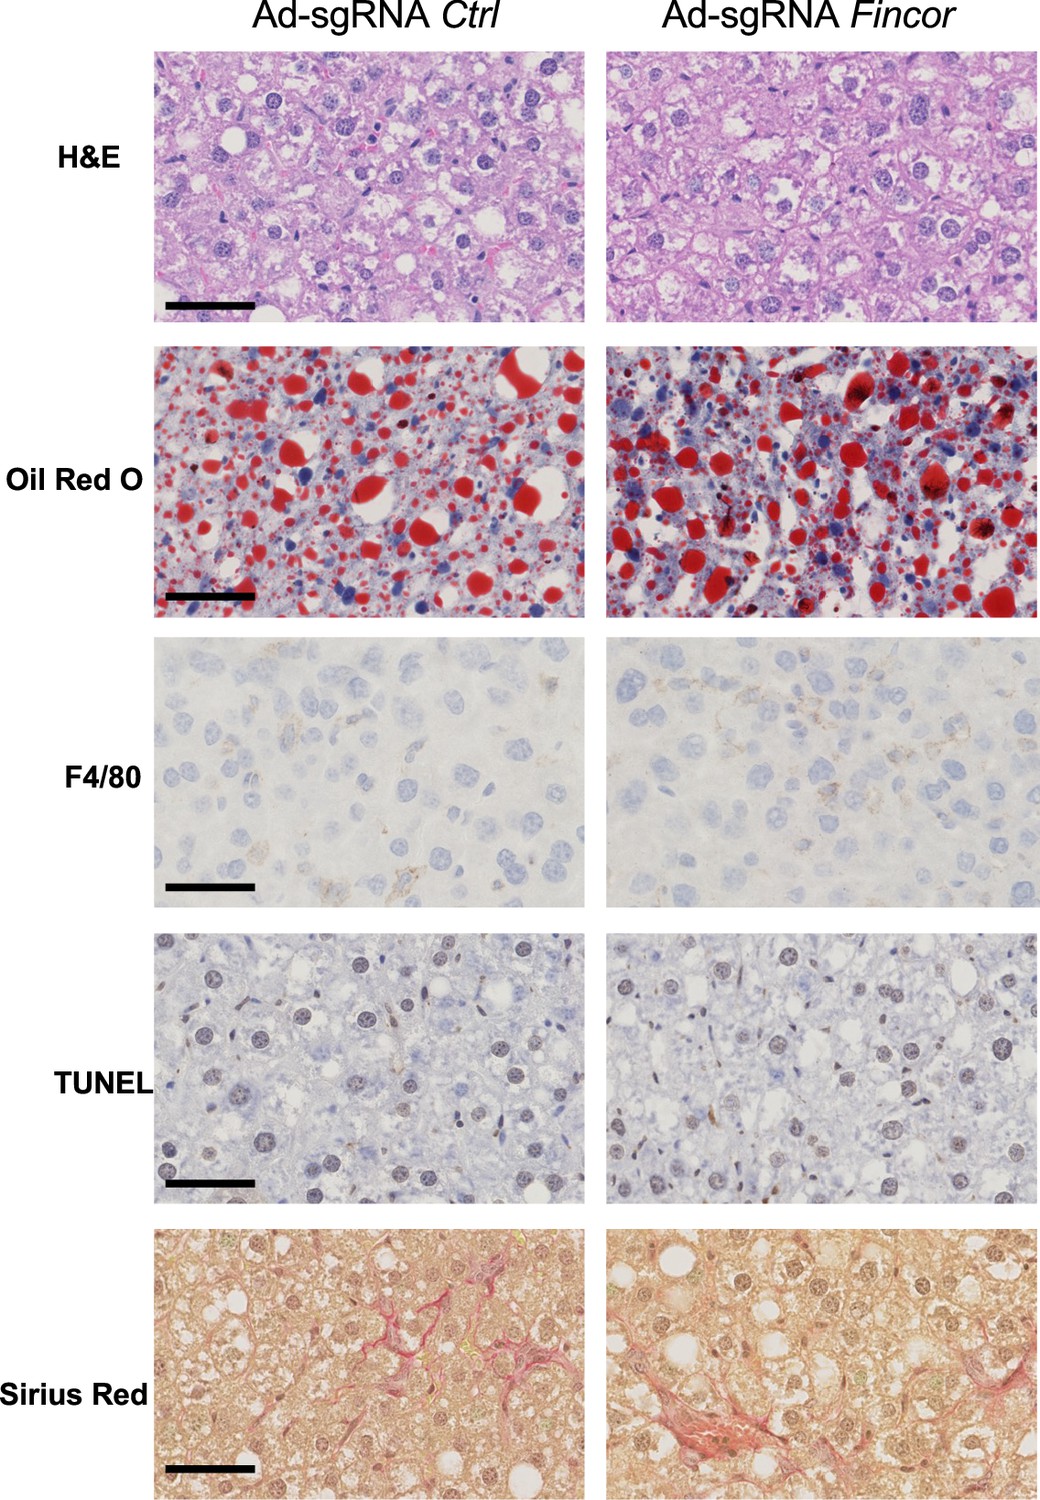
The effects of farnesoid X receptor-induced non-coding RNA (Fincor) downregulation on nonalcoholic steatohepatitis (NASH) pathologies.
Male Cas9 mice were fed with a NASH diet for 12 weeks. Then these mice were randomly assigned to two groups and infected with adenovirus expressing sgRNA for Fincor or control. The tissues were collected 2 weeks later. Liver histology analysis was performed and representative images were shown. Scale bar (50 μm).
Figure 8
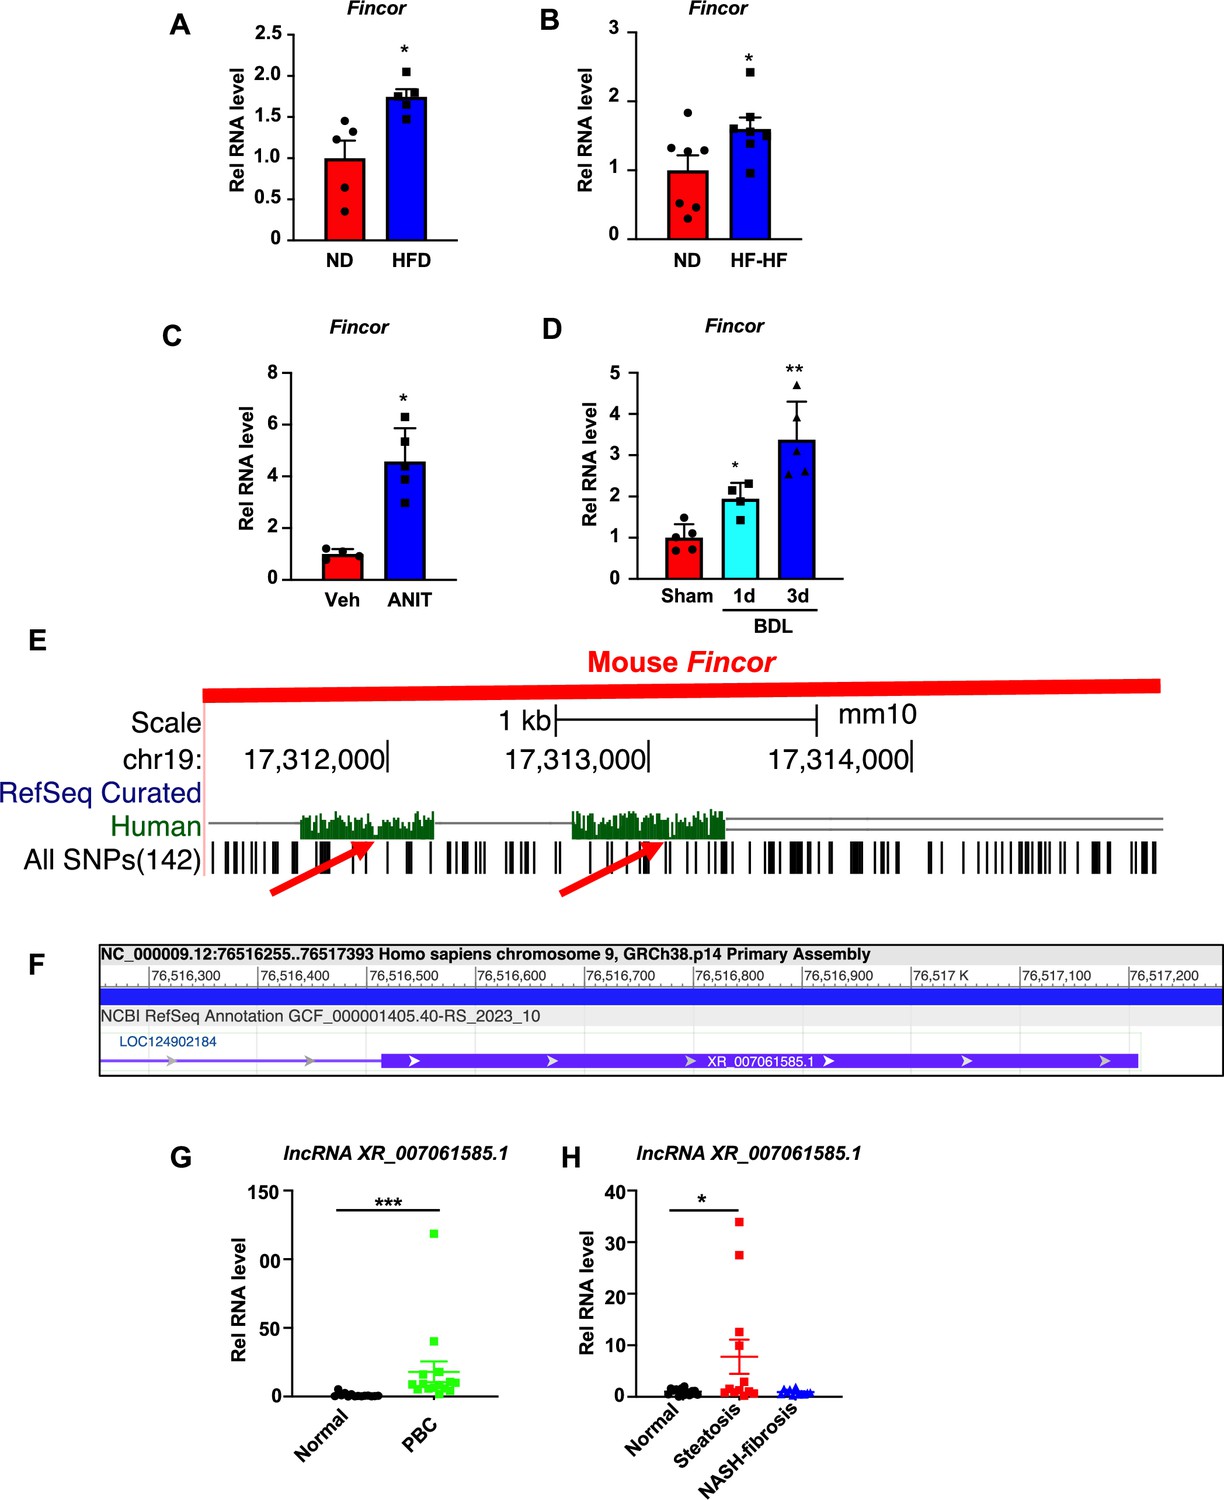
Hepatic expression of farnesoid X receptor-induced non-coding RNA (Fincor) is elevated in liver disease associated with inflammation and fibrosis.
(A) C57BL/6 mice were fed with a high-fat diet for 12 weeks. The liver RNAs were extracted and Fincor expression was measured (n=5/group). (B) C57BL/6 mice were fed with a high-fat diet with high fructose water for 12 weeks. The liver RNAs were extracted and Fincor expression was measured (n=7/group). (C) C57BL/6 mice were treated with α-naphthylisothiocyanate (ANIT) (75 mg/kg) for 48 hr and then sacrificed after 5 hr of fasting. The liver RNAs were extracted, and Fincor expression was measured (n=4–5/group). (D) C57BL/6 mice were bile duct ligated for 1 day or 3 days. They were then sacrificed after 5 hr of fasting. The liver RNAs were extracted and Fincor expression was measured (n=4–5/group). (E) Fincor conservation between mice and human as displayed in the UCSC Genome Browser. Red arrows indicate the conserved region. (F) Human long non-coding RNA (lncRNA) XR_007061585.1 with sequence similarity to mouse Fincor annotated in the NCBI genome data viewer. (G) Expression of lncRNA XR_007061585.1 in liver samples from normal individuals or patients with primary biliary cholangitis (PBC) (n=14–15/group). (H) Expression of lncRNA XR_007061585.1 in liver samples from normal individuals or patients with nonalcoholic fatty liver disease (NAFLD)-associated steatosis (n=12–15/group). (A–D, G–H) Data are presented as mean ± SEM. Statistical significance was determined by the Student’s t test with *p<0.05, **p<0.01, and ***p<0.001.
Additional files
-
Supplementary file 1
Sequencing data generated in this study and a list of Farnesoid X receptor (FXR)-associated eRNAs.
- https://cdn.elifesciences.org/articles/91438/elife-91438-supp1-v1.xlsx
-
Supplementary file 2
Differentially expressed genes in the FXR-induced non-coding RNA (Fincor)-downregulated mice liver.
- https://cdn.elifesciences.org/articles/91438/elife-91438-supp2-v1.xlsx
-
Supplementary file 3
The binding of transcription factors at the FXR-induced non-coding RNA (Fincor) locus.
- https://cdn.elifesciences.org/articles/91438/elife-91438-supp3-v1.docx
-
Supplementary file 4
Predicted RNA binding proteins (RBPs) binding to FXR-induced non-coding RNA (Fincor).
- https://cdn.elifesciences.org/articles/91438/elife-91438-supp4-v1.docx
-
Supplementary file 5
Primer sequences used in this study.
- https://cdn.elifesciences.org/articles/91438/elife-91438-supp5-v1.docx
-
MDAR checklist
- https://cdn.elifesciences.org/articles/91438/elife-91438-mdarchecklist1-v1.docx
Download links
A two-part list of links to download the article, or parts of the article, in various formats.
Downloads (link to download the article as PDF)
Open citations (links to open the citations from this article in various online reference manager services)
Cite this article (links to download the citations from this article in formats compatible with various reference manager tools)
Hammerhead-type FXR agonists induce an enhancer RNA Fincor that ameliorates nonalcoholic steatohepatitis in mice
eLife 13:RP91438.
https://doi.org/10.7554/eLife.91438.3


