Conformation selection by ATP-competitive inhibitors and allosteric communication in ERK2
- Department of Biochemistry, University of Colorado, United States
- Department of Pharmacology, University of Colorado Anschutz Medical Center, United States
- ArrayBioPharma, Inc., United States
- Genentech, Inc., United States
Figures
Figure 1
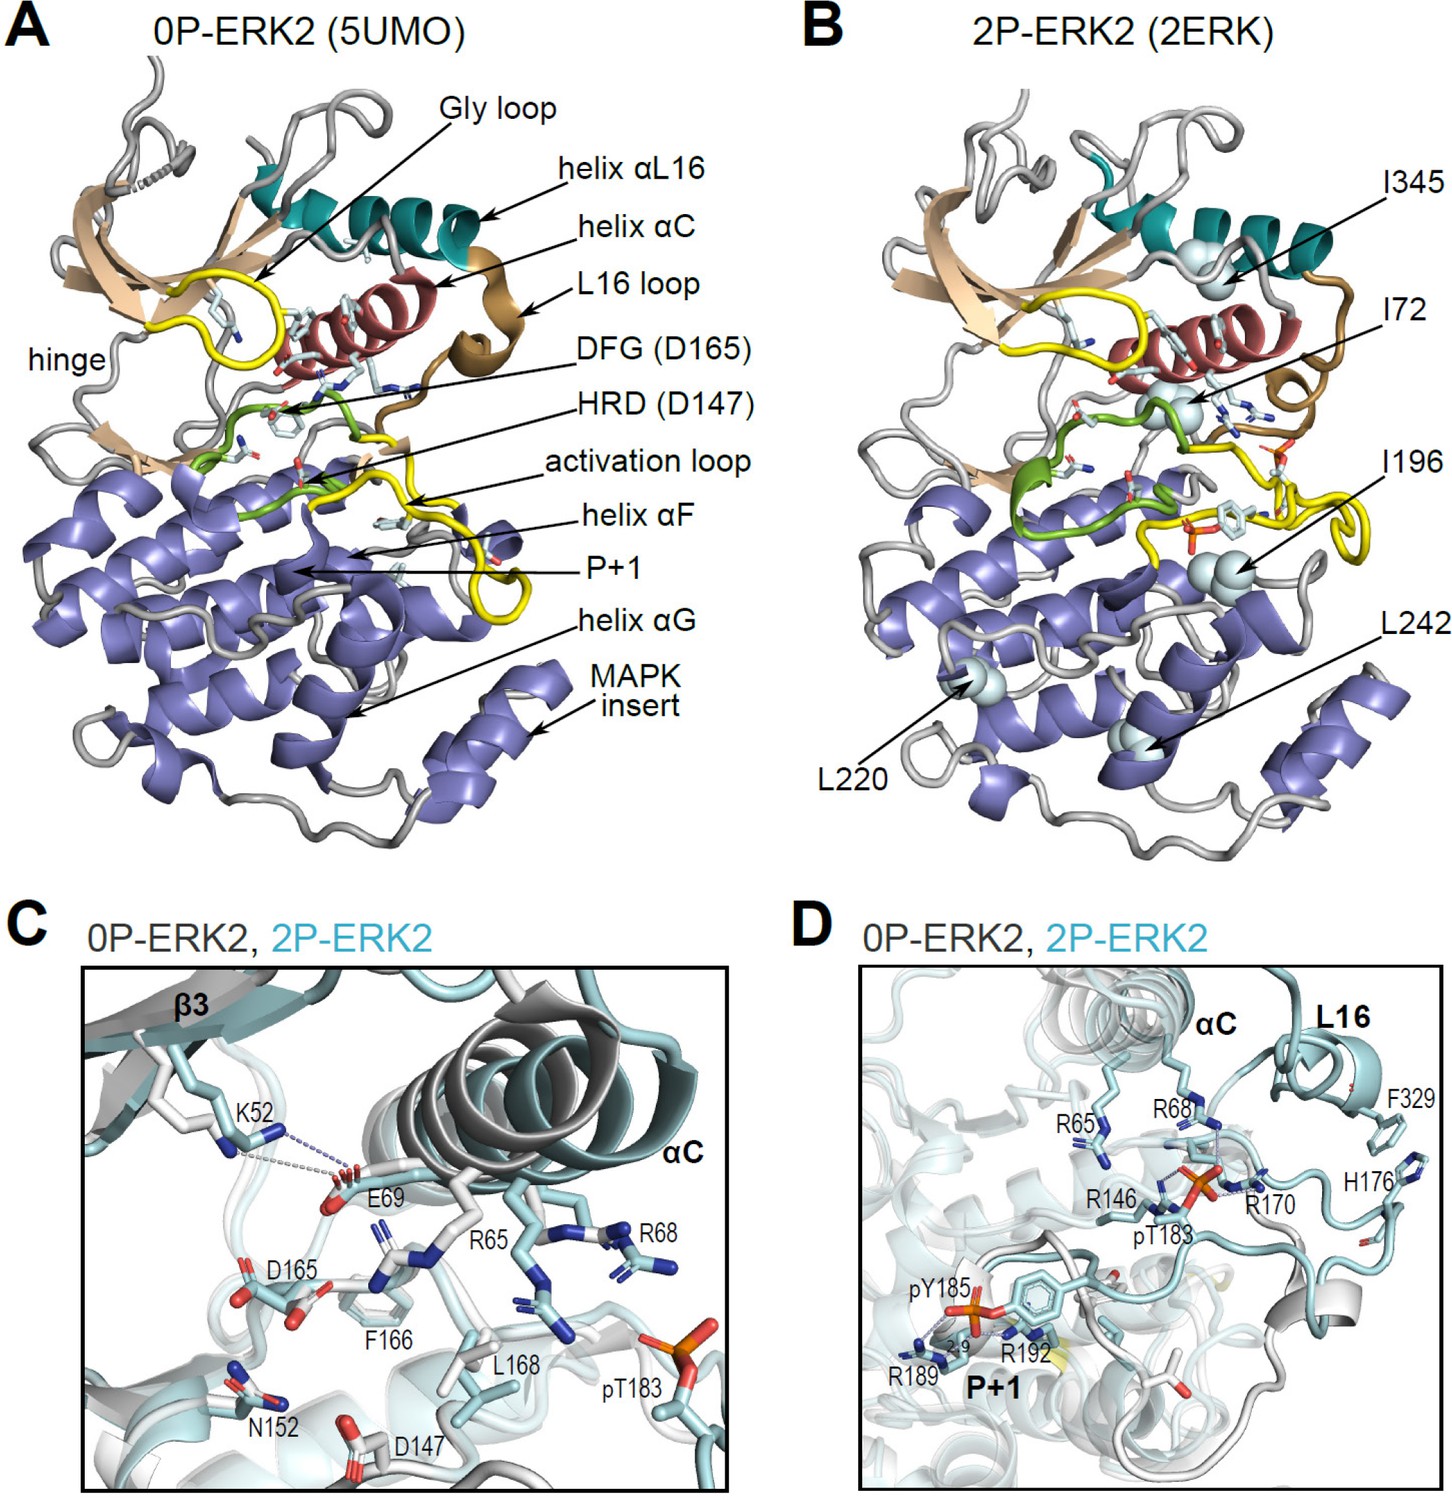
Structural features of extracellular signal-regulated kinase-2 (ERK2).
(A, B) X-ray structures of (A) 0P-ERK2 (PDBID:5UMO) and (B) 2P-ERK2 (PDBID:2ERK) apoenzymes. Panel A labels conserved motifs in ERK2 common to protein kinases. Panel B labels residues that illustrate L↔R exchange (I72, L220, L242; see Figure 2 and Figure 7), and key chemical shift perturbations (I196, I345; see Figure 8). (C) Structural superposition of 0P-ERK2 (white) and 2P-ERK2 (pale blue), illustrating overlapping positions of active site residues and an outward shift of helix αC upon dual phosphorylation. Root-mean-square deviations between 0P- and 2P-ERK2 for catalytic site residues were K52-0.69 Å, E69-0.16 Å, D147-0.055 Å, D165-0.88 Å. (D) Superposition of 0P-ERK2 and 2P-ERK2, illustrating conformational differences in the activation loop. In 2P-ERK2, pT183, and pY185 form ion pairs with multiple Arg residues, while the L16 loop folds into a 3/10 helix with side chain interactions to the activation loop. Structures were superpositioned by aligning Cα atoms within the C-terminal domain (residues 109–141, 205–245, 272–310).
Figure 2 with 4 supplements
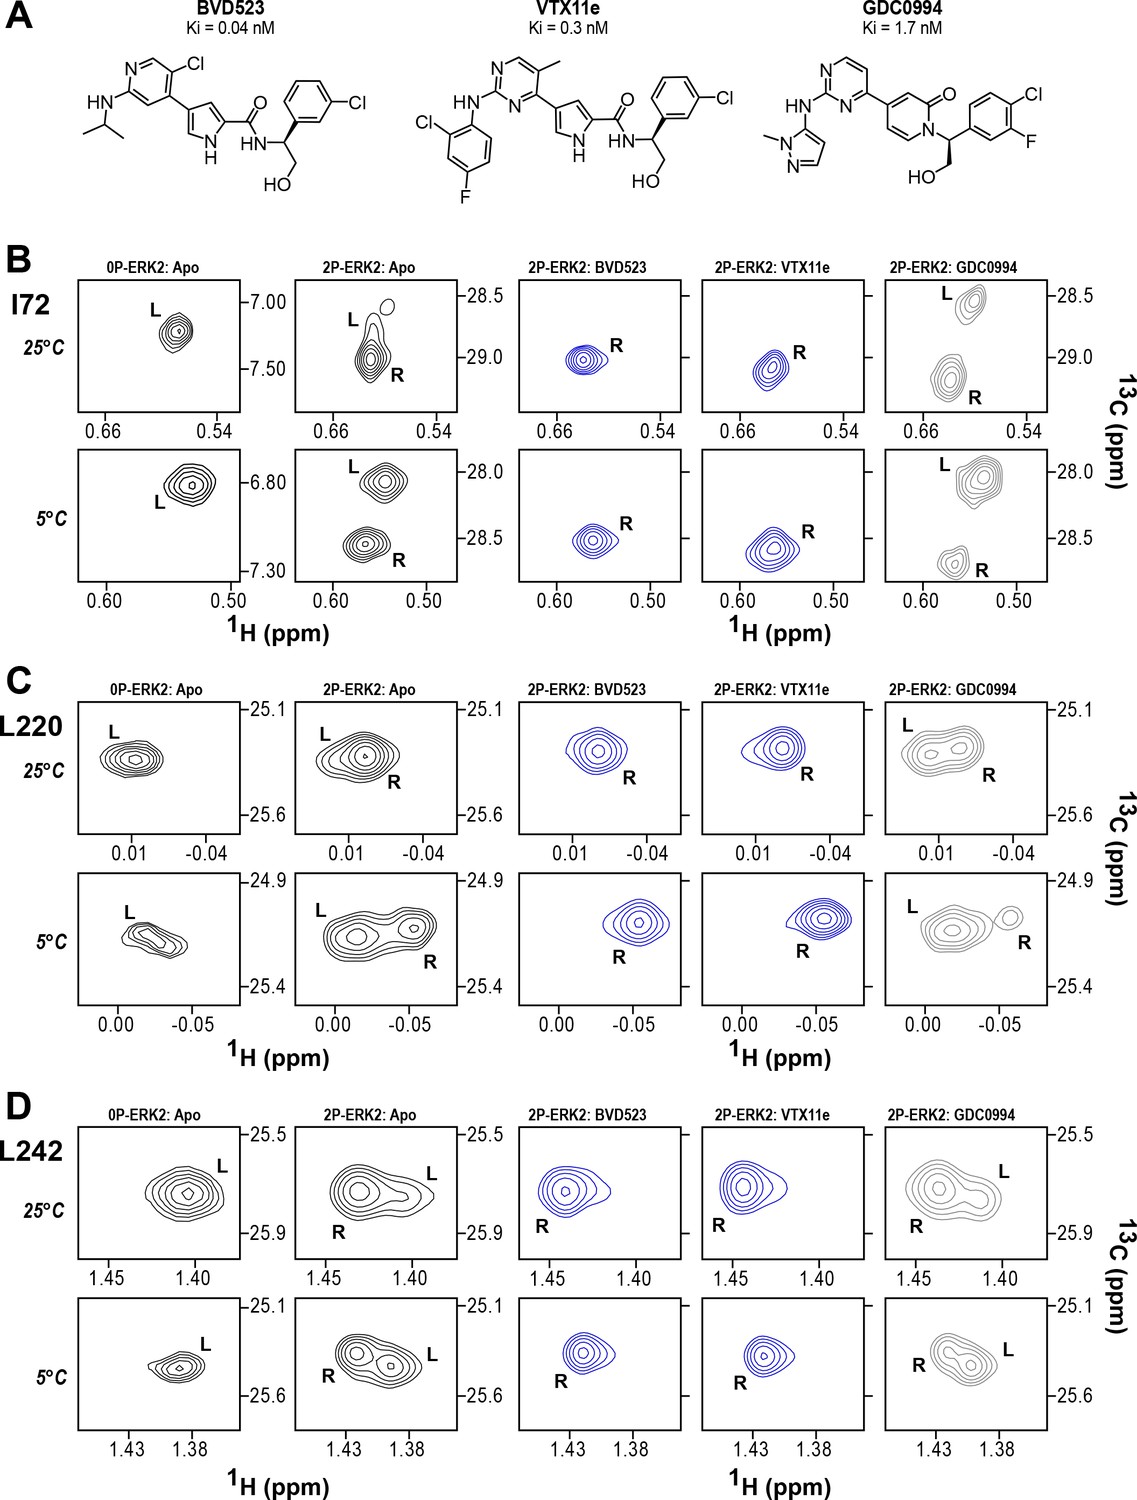
BVD523 and Vertex-11e (VTX11e) stabilize the R-state in 2P-ERK2.
(A) Chemical structures of the ATP-competitive ERK1/2 inhibitors, BVD523, VTX11e and GDC0994. (B–D) 2D-HMQC spectra collected at 25°C and 5°C ([ERK2]:[inhibitor]=1.0:1.2), showing [methyl-13C,1H] peaks of residues (B) I72, (C) L220 and (D) L242, which report R and L conformers. Their locations in the ERK2 structure are shown in Figure 1. 2P-ERK2 complexed with BVD523 and VTX11e (shown in blue) shift to 100% R at all temperatures, while 2P-ERK2 complexed with GDC0994 (shown in gray) retains conformational exchange between R:L populations of 80:20, similar to the apoenzyme. Previous studies show that 0P-ERK2 complexed with all inhibitors retains the L conformer seen in the apoenzyme (Pegram et al., 2019). Full NMR spectra are shown in Figure 2—figure supplement 1 and Figure 2—figure supplement 2. Titration of 2P-ERK2 with VTX11e and GDC0994 to demonstrate binding saturation is shown in Figure 2—figure supplement 3 and Figure 2—figure supplement 4.
Figure 2—figure supplement 1
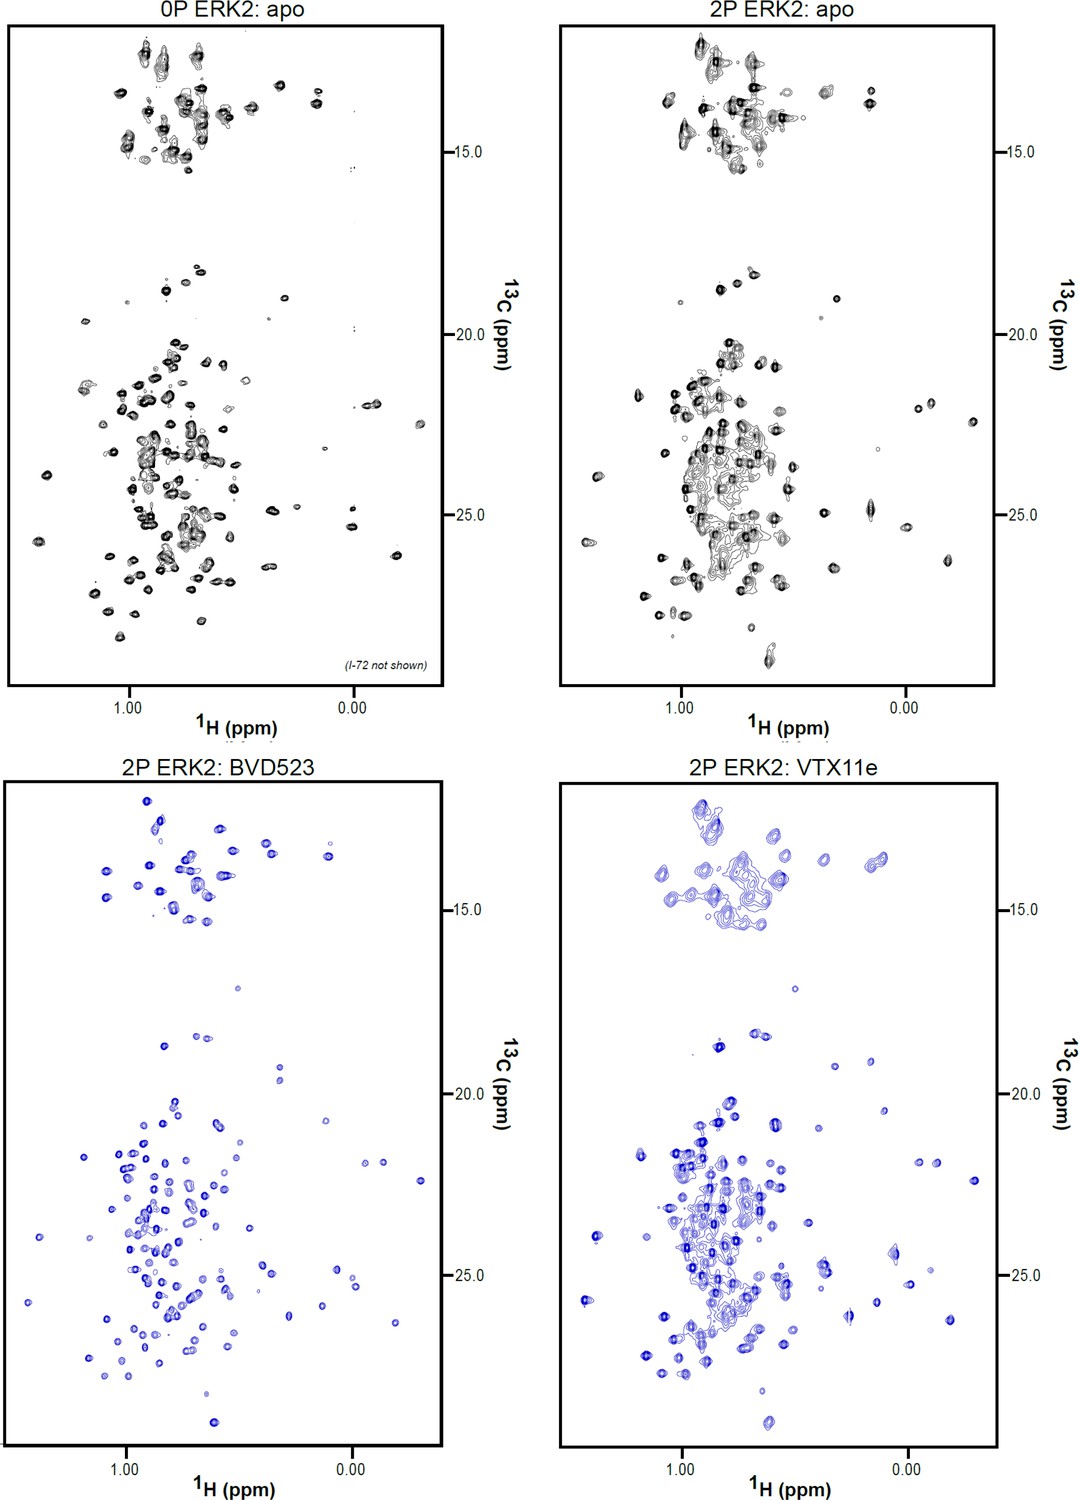
2D-HMQC NMR spectra of apoenzyme and inhibitor-bound extracellular signal-regulated kinase-2 (ERK2).
2D [13C,1H] HMQC spectra for apo 0P-ERK2, apo 2P-ERK2, 2P-ERK2:BVD523, and 2P-ERK2:VTX11e. Each complex was formed from 150 μM ERK2 and 180 μM inhibitor, yielding binding saturation at concentration ratios [2P-ERK2]:[inhibitor]=1.0:1.2.
Figure 2—figure supplement 2
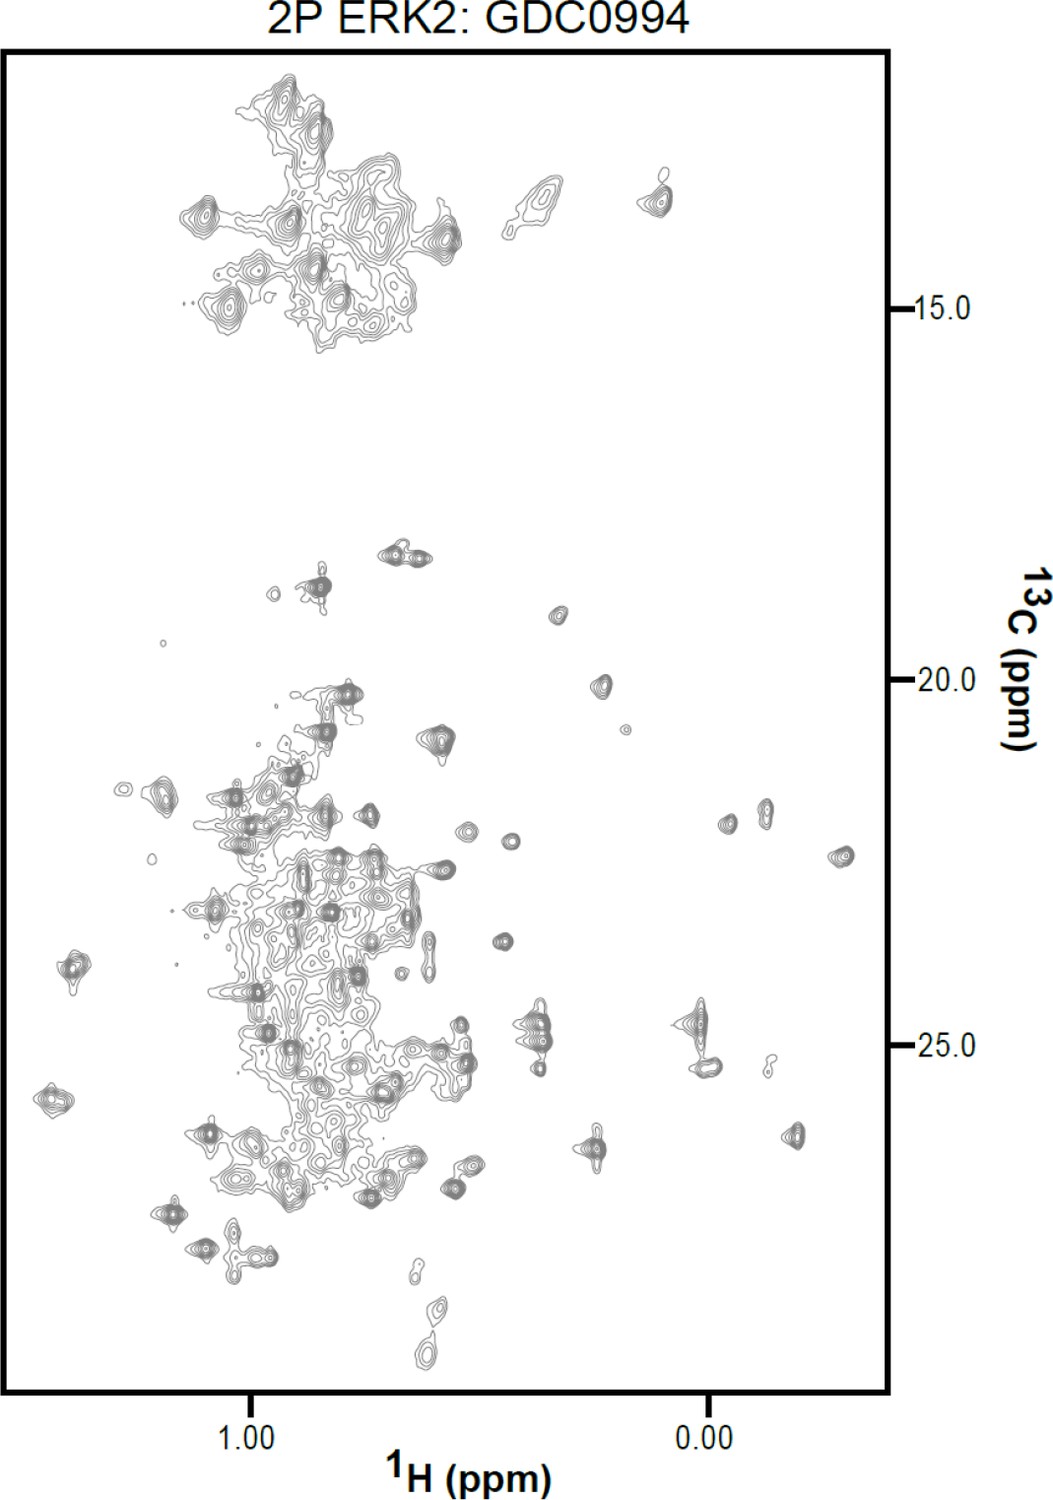
2D-HMQC NMR spectra of apoenzyme and inhibitor-bound extracellular signal-regulated kinase-2 (ERK2).
2D [13C,1H] HMQC spectra for 2P-ERK2:GDC0994. The complex was formed from 150 μM ERK2 and 180 μM inhibitor, yielding binding saturation at a concentration ratio [2P-ERK2]:[inhibitor]=1.0:1.2.
Figure 2—figure supplement 3
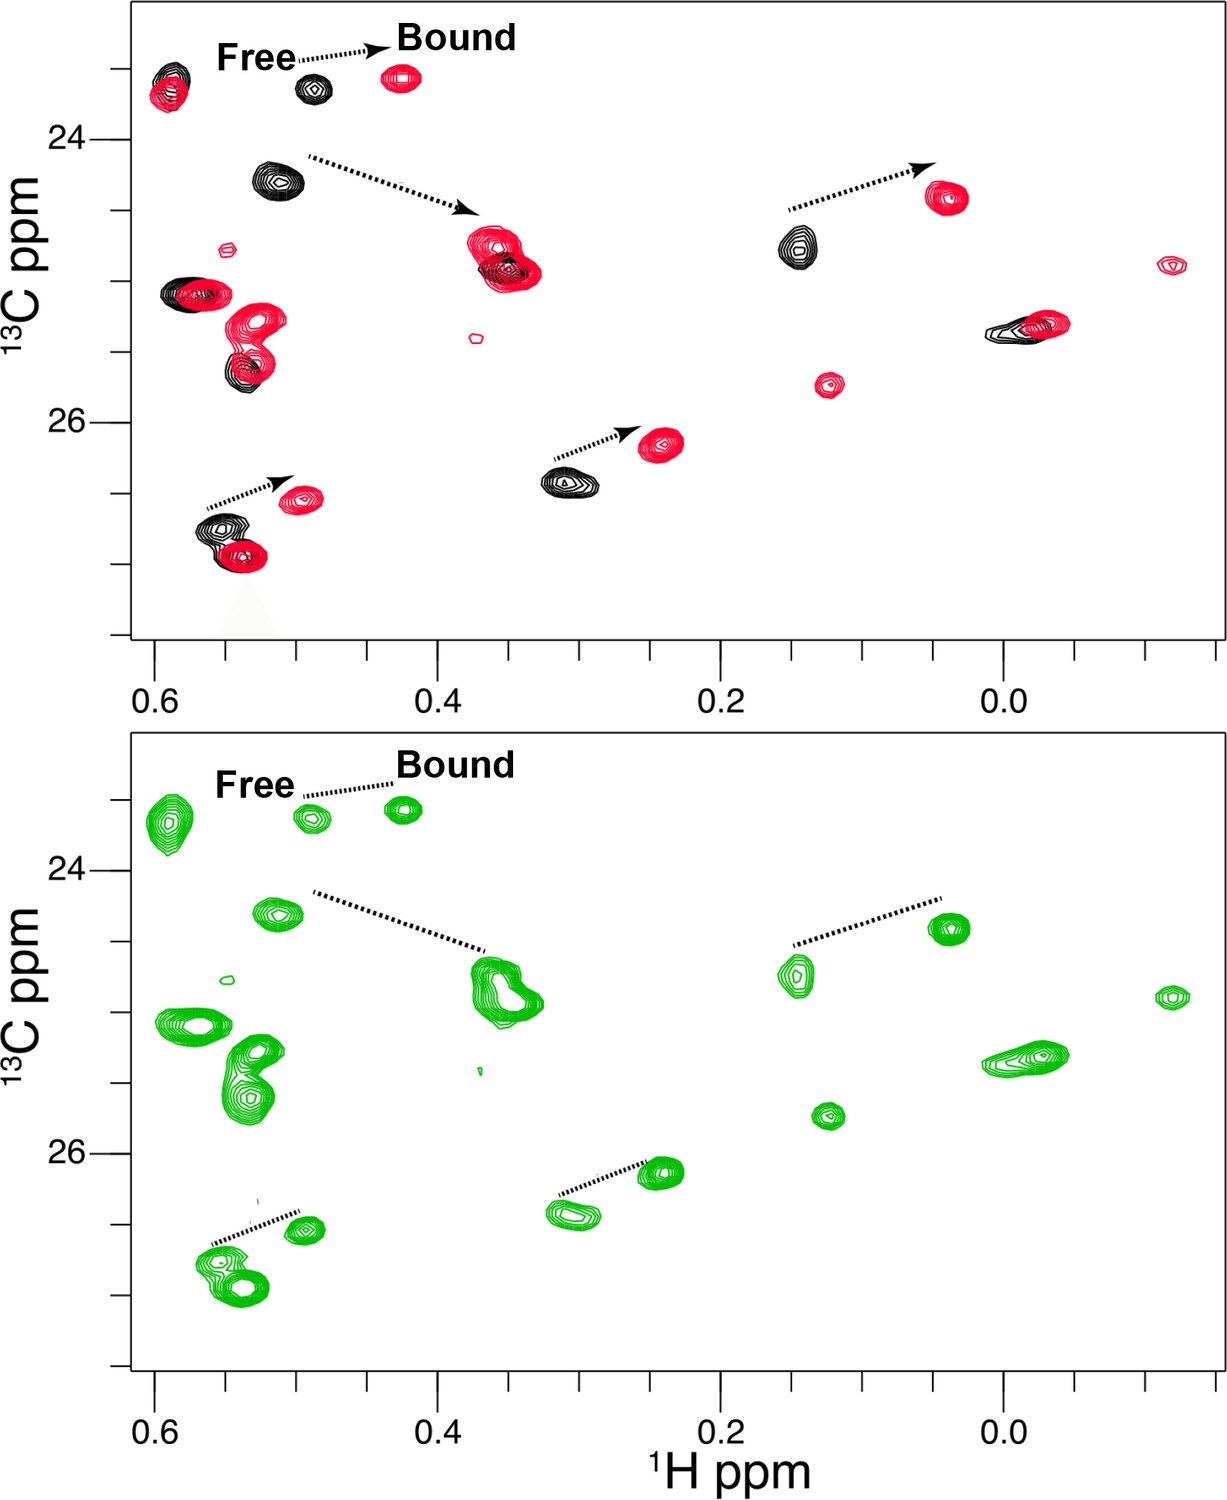
Titration of Vertex-11e (VTX11e) binding to 2P-ERK2.
2D [13C,1H] HMQC spectra reveal residues in slow exchange that report saturation binding with increasing inhibitor concentration. NMR spectra of VTX11e complexed with 2P-ERK2. Black: 2P-ERK2 apoenzyme; Green: 50% bound, [2P-ERK2]:[VTX11e]=1.0:0.5; Red: 100% bound, [2P-ERK2]:[VTX11e]=1.0:1.3. Arrows show the shifts between free and bound forms of methyl peaks. The results illustrate that binding saturation is confirmed when peaks reflecting unbound extracellular signal-regulated kinase-2 (ERK2) are undetectable.
Figure 2—figure supplement 4
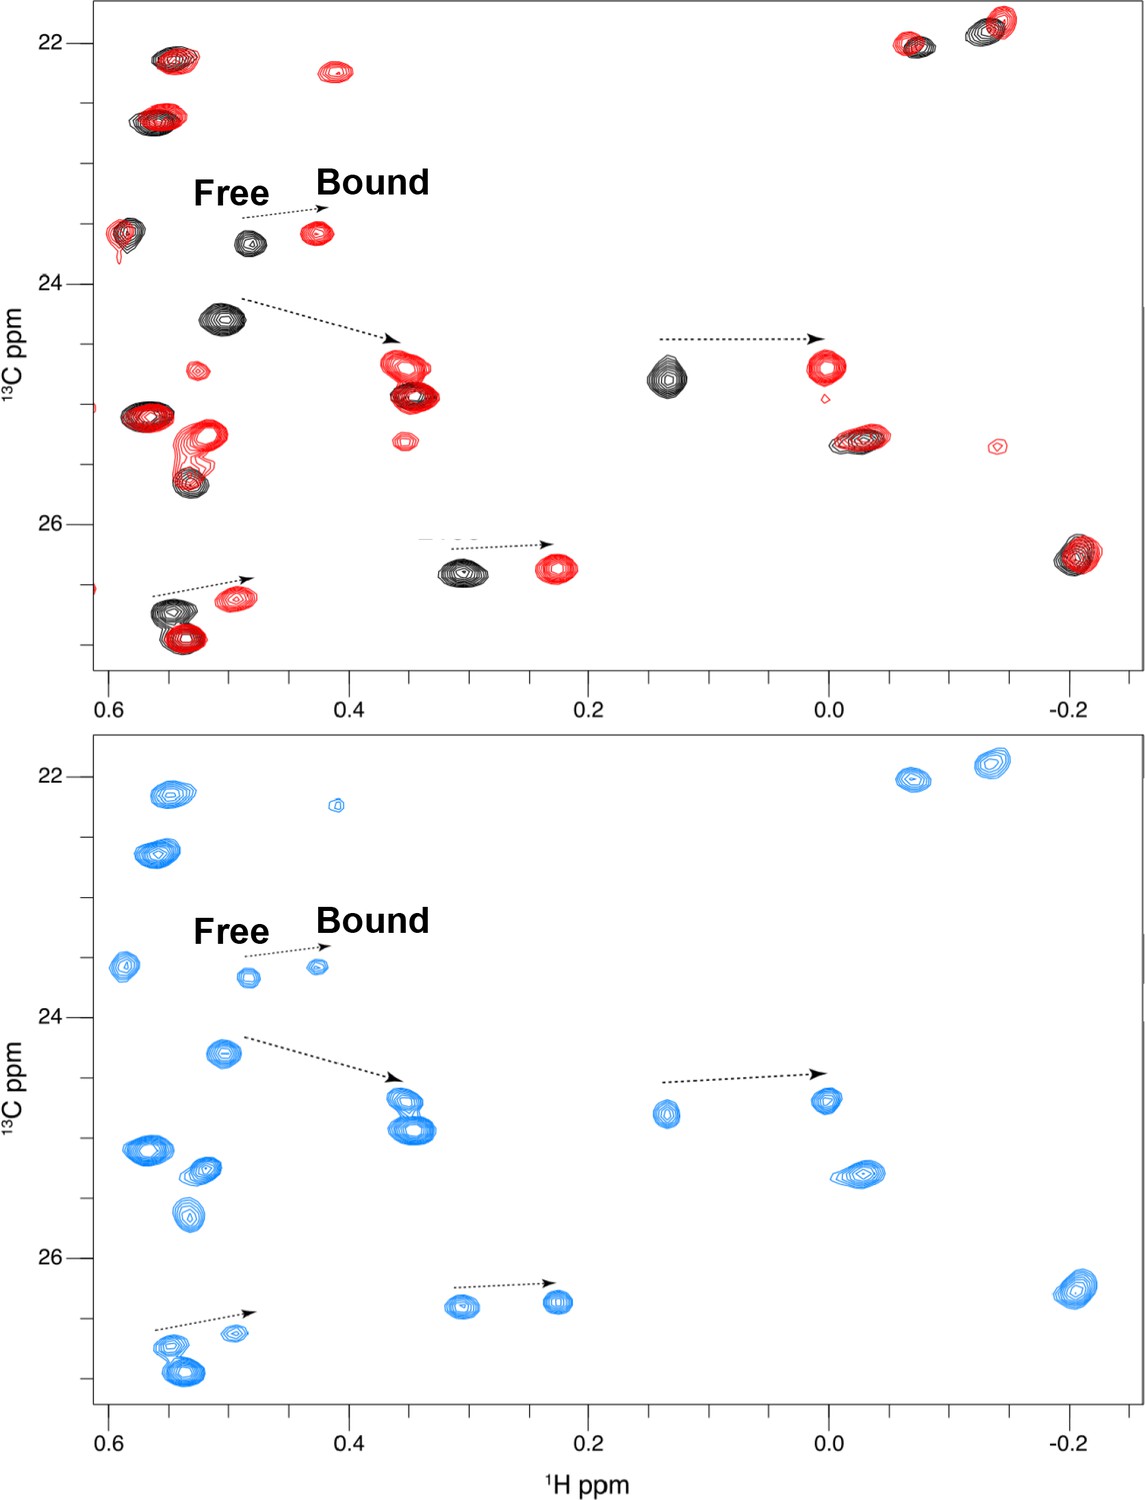
Titration of GDC0994 binding to 2P-ERK2.
2D [13C,1H] HMQC spectra reveal residues in slow exchange that report saturation binding with increasing inhibitor concentration. NMR spectra of GDC0994 complexed with 2P-ERK2. Black: 2P-ERK2 apoenzyme; Blue: 50% bound, [2P-ERK2]:[GDC0994]=1.0:0.5; Red: 100% bound, [2P-ERK2]:[GDC0994]=1.0:1.3. Arrows show the shifts between free and bound forms of methyl peaks. The results illustrate that binding saturation is confirmed when peaks reflecting unbound extracellular signal-regulated kinase-2 (ERK2) are undetectable.
Figure 3 with 4 supplements
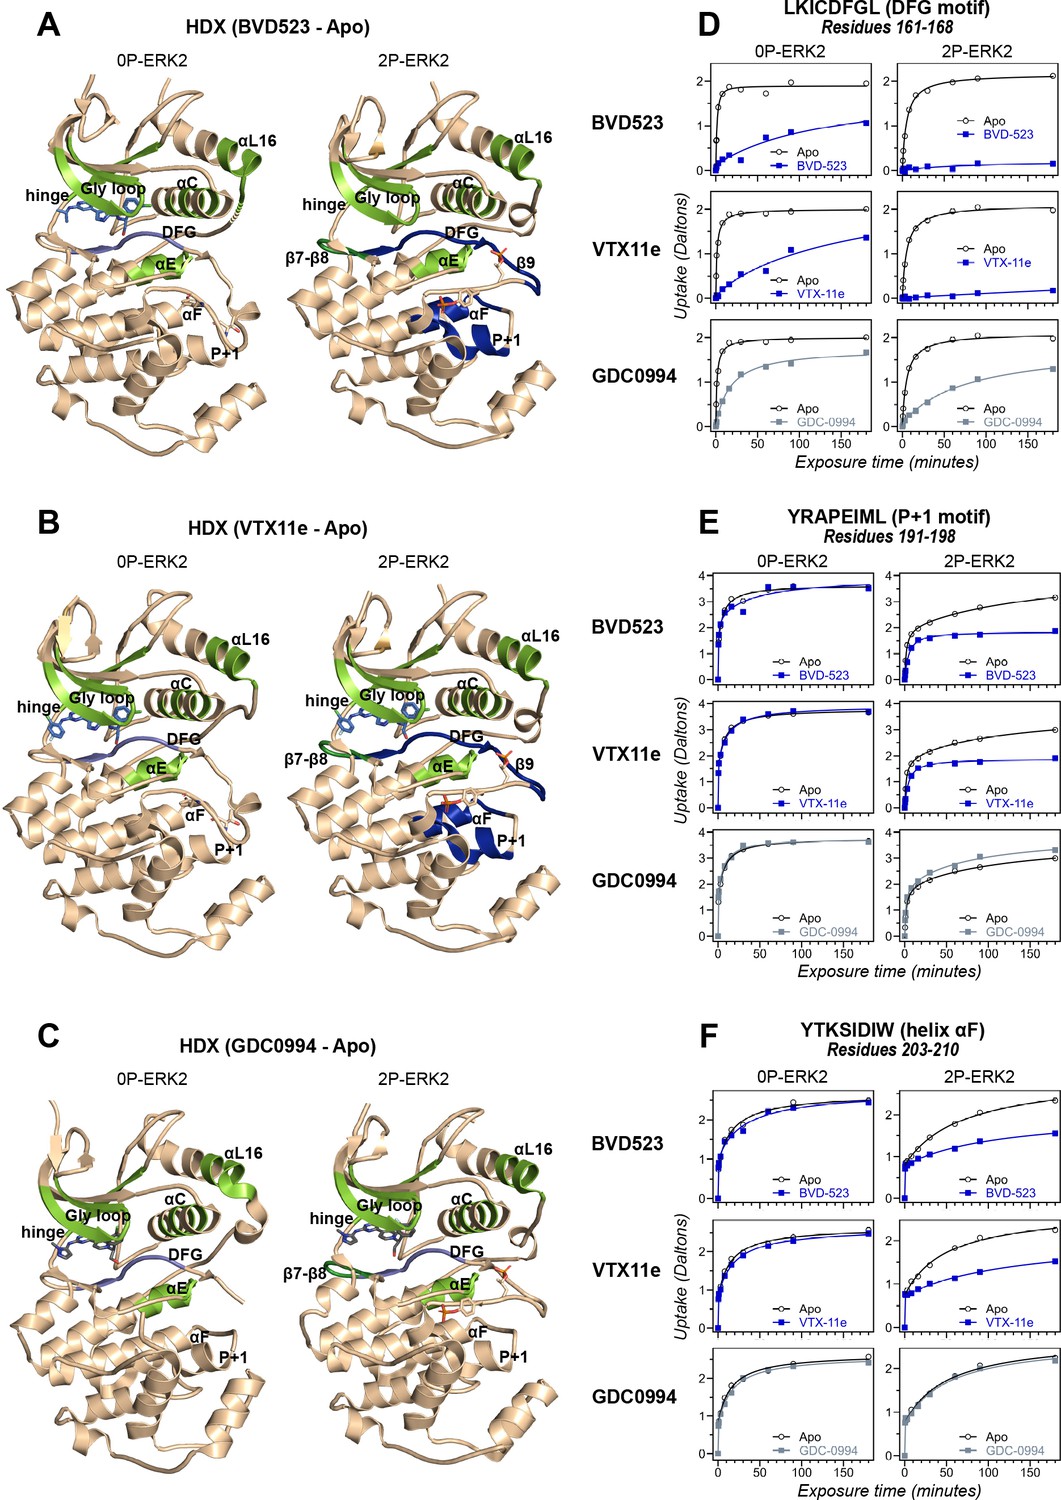
Binding of R-state inhibitors reveals allosteric coupling between the active site and the activation loop.
(A–C) Summary of hydrogen-deuterium exchange (HDX) experiments indicating regions that change in deuterium uptake upon binding of (A) BVD523, (B) Vertex-11e (VTX11e), and (C) GDC0994. (D–F) HDX time courses showing effects of inhibitors on deuterium uptake at the (D) DFG motif (peptide 161–168: LKICDFGL), (E) P+1 segment (peptide 191–198, YRAPEIML), and (F) helix αF (peptide 203–210: YTKSIDIW). Colored segments in panels A–C indicate regions where HDX decreases or increases upon binding each inhibitor at saturating concentration ([ERK2]:[inhibitor]=1.0:1.2). Full peptide coverage and locations of segments that undergo changes in HDX with inhibitor binding are shown in Figure 3—figure supplement 1 and Figure 3—figure supplement 2. Highlighted in light green in panels A–C are regions where a similar degree of HDX protection is seen with all inhibitors in both 0P-ERK2 and 2P-ERK2 (Gly loop, hinge, helices αC, αE, and αL16). HDX protection is similar with all inhibitors in strands β7-β8 (dark green) in 2P-ERK2, but not 0P-ERK2. Time courses for these peptides are shown in Figure 3—figure supplement 3. Highlighted in light blue are regions where BVD523, VTX11e, or GDC0994 lead to decreased HDX uptake around the DFG motif, in 0P-ERK2 or 2P-ERK2. Highlighted in dark blue are regions where BVD523 and VTX11e lead to increased HDX protection, compared to GDC0994. These occur only in 2P-ERK2, and include the DFG motif and adjacent strand β9, as well as the P+1 segment and helix αF. Time courses for strand β9 are shown in Figure 3—figure supplement 4. Full HDX datasets for all inhibitors are presented in Figure 1. Crystal structures shown in panels A–C are (A) PDBID: 6GDQ (left) and 2ERK (right); (B) PDBID: 4QTE (left) and 6OPK (right); (C) PDBID: 5K4I (left); and 6OPH (right).
Figure 3—figure supplement 1
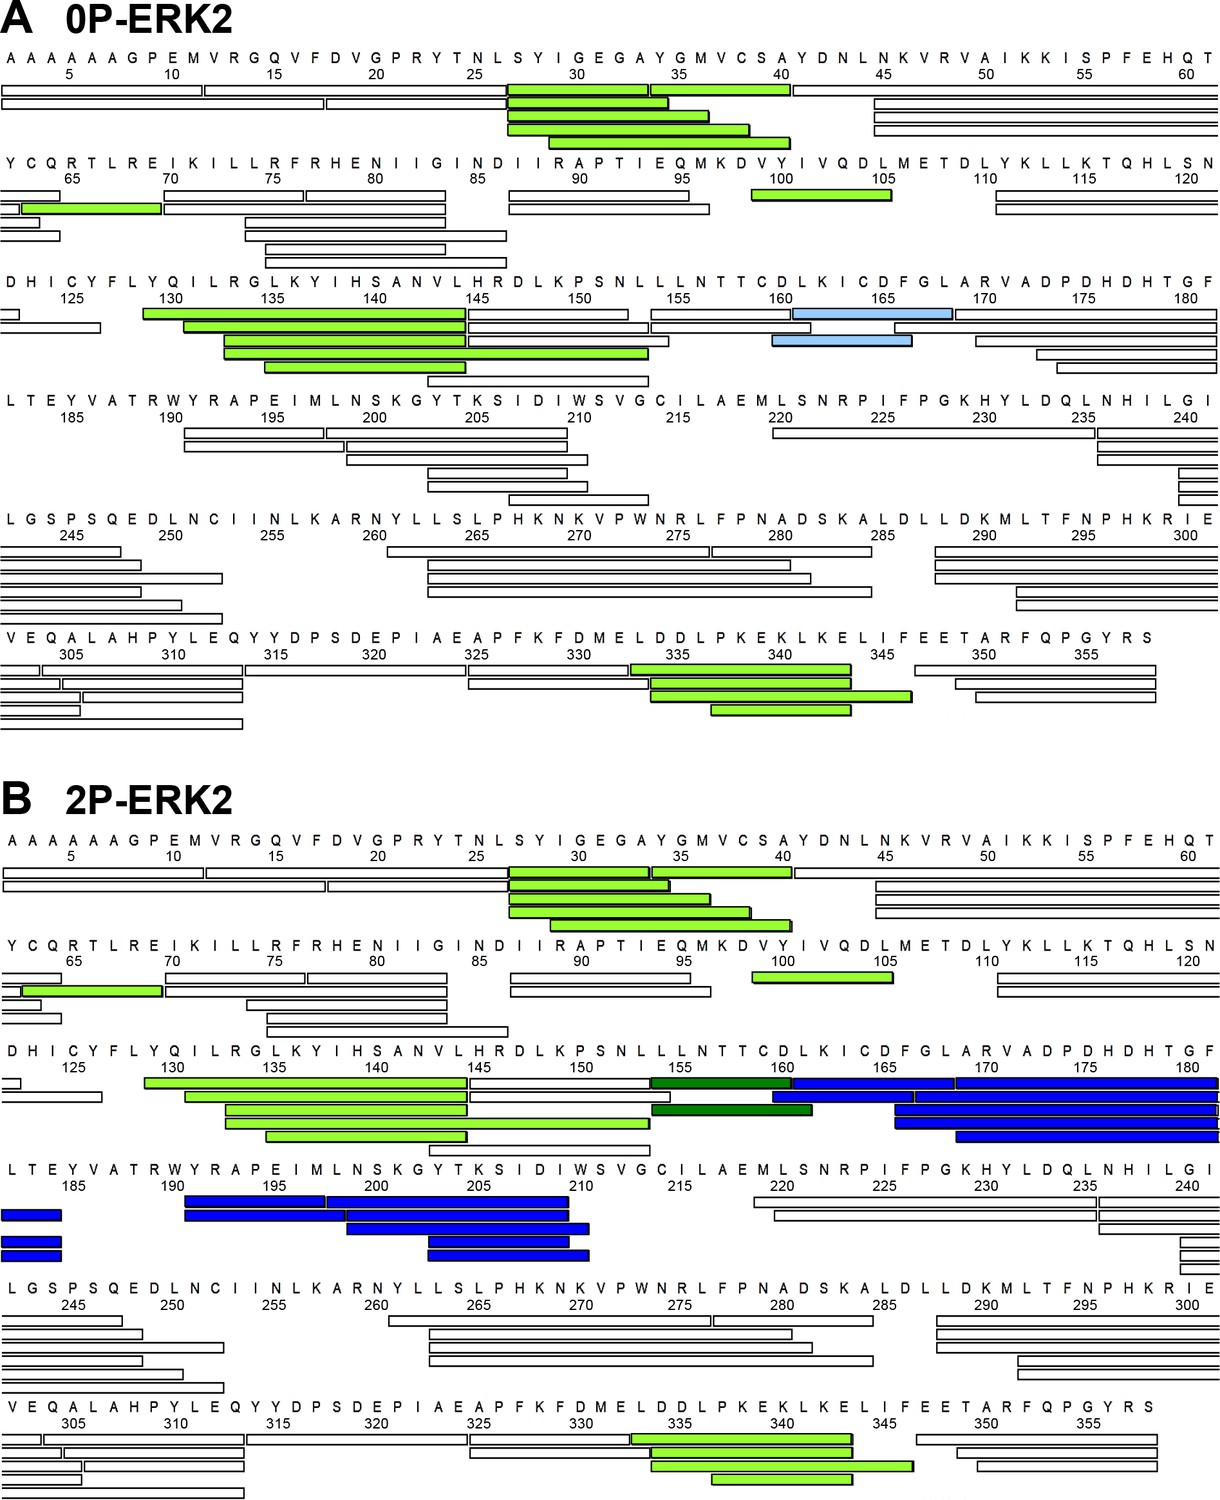
Proteolytic peptides analyzed by hydrogen-deuterium exchange mass spectrometry (HDX-MS).
Peptides produced by pepsin digestion yielded 90% and 91% coverage of exchangeable amides in (A) 0P-ERK2 and (B) 2P-ERK2, respectively. Colors indicate regions where ligand binding alters HDX uptake. Light green indicates peptides where binding of Vertex-11e (VTX11e), BVD523, and GDC0994 induce a similar degree of HDX protection (i.e. decreased deuterium uptake) in both 0P-ERK2 and 2P-ERK2. Deep green indicates peptides where all inhibitors induce a similar degree of HDX protection, but only in 2P-ERK2. Deep blue indicates peptides where VTX11e and BVD523 induce greater HDX protection compared to GDC0994 in 2P-ERK2. Light blue indicates peptides that show HDX protection by all inhibitors around the DFG motif in 0P-ERK2, but to a lower amount compared to BVD523 or VTX11e in 2P-ERK2.
Figure 3—figure supplement 2
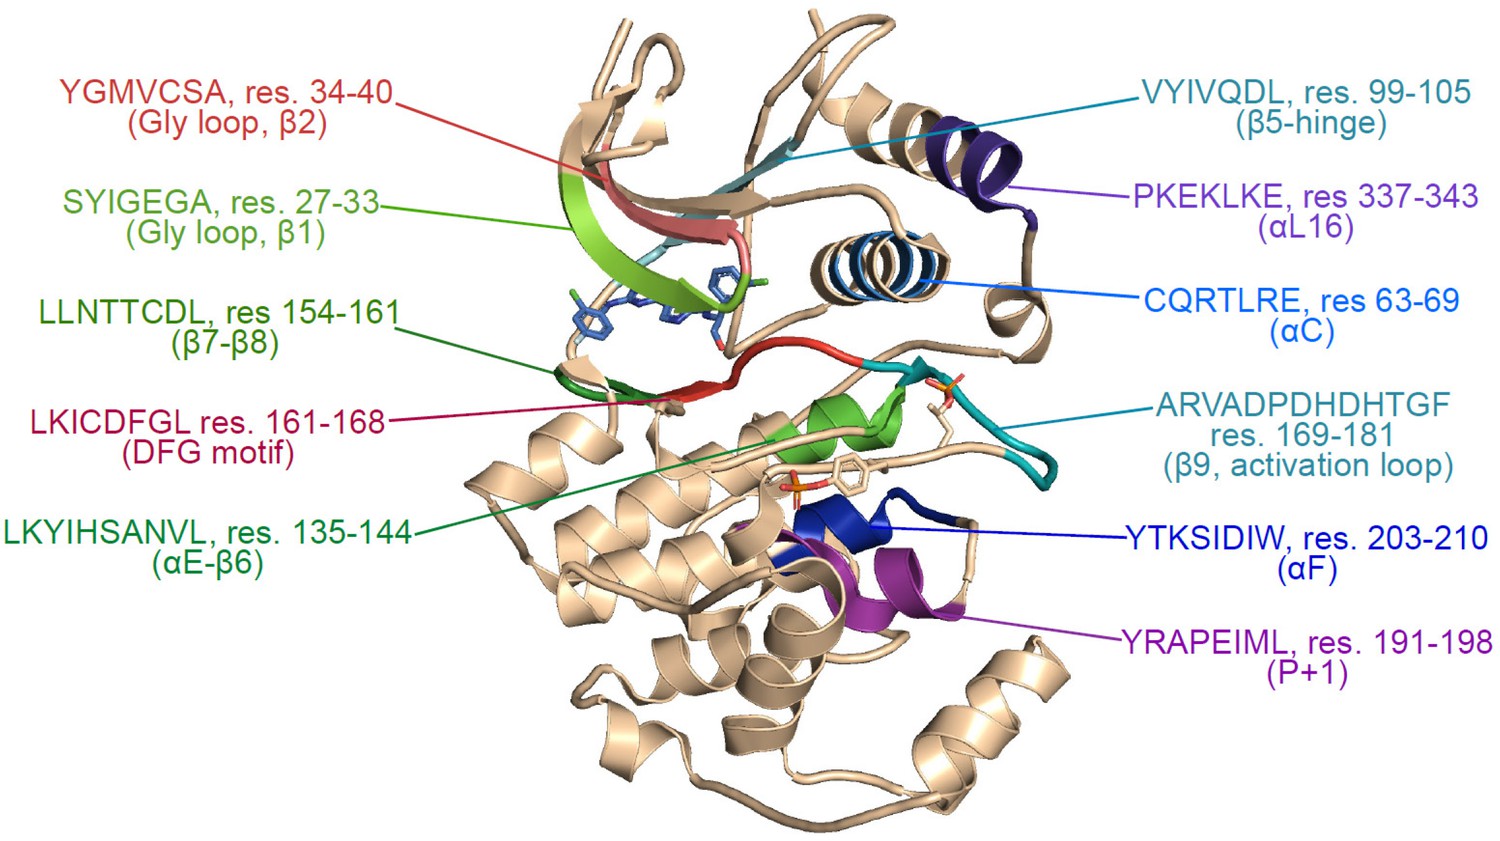
Structural map of regions showing hydrogen-deuterium exchange (HDX) responses to inhibitor binding.
Structure of 2P-ERK2 (PDBID:6OPK), indicating the locations of peptides where binding of Vertex-11e (VTX11e), BVD523, or GDC0994 alter HDX behavior, as highlighted in Figure 3—figure supplement 1.
Figure 3—figure supplement 3
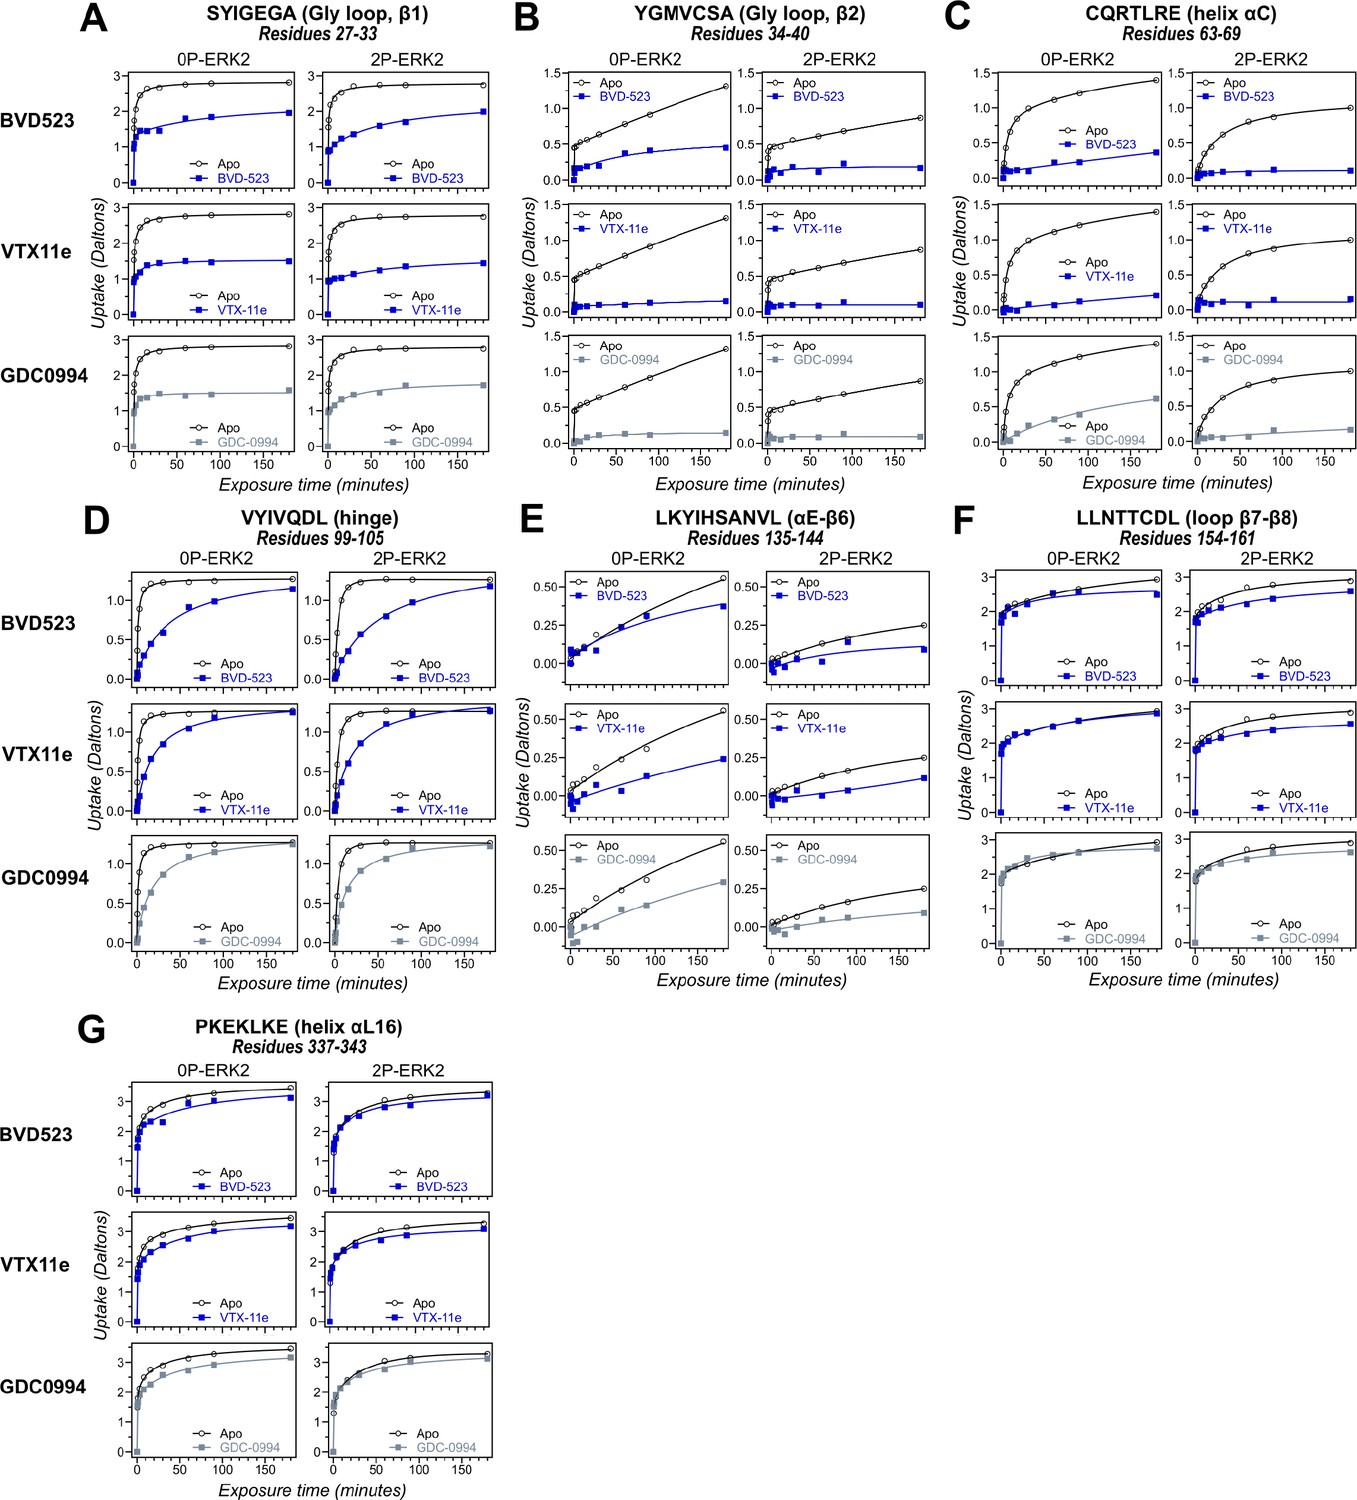
Hydrogen-deuterium exchange (HDX) time courses of regions with comparable responses to different inhibitors.
HDX time courses for key peptide segments in extracellular signal-regulated kinase-2 (ERK2), including (A, B) the Gly loop (peptide 29–33, SYIGEGA; peptide 34–40, YGMVCSA), (C) helix αC (peptide 63–69, CQRTLRE), (D) the hinge (peptide 99–105, VYIVQDL), (E) helix αE-β6 (peptide 135–144, LKYIHSANVL), (F) loop β7-β8 (peptide 154–161, LLNTTCDL), and (G) helix αL16 (peptide 337–343, PKEKLKE). Open symbols show deuterium uptake in 0P- or 2P-ERK2 apoenzymes. Closed symbols show deuterium uptake in 0P- or 2P-ERK2 complexed with BVD523, VTX11e (blue), or GDC0994 (gray). In these regions, deuterium uptake decreases by a similar degree upon binding each of the three inhibitors.
Figure 3—figure supplement 4
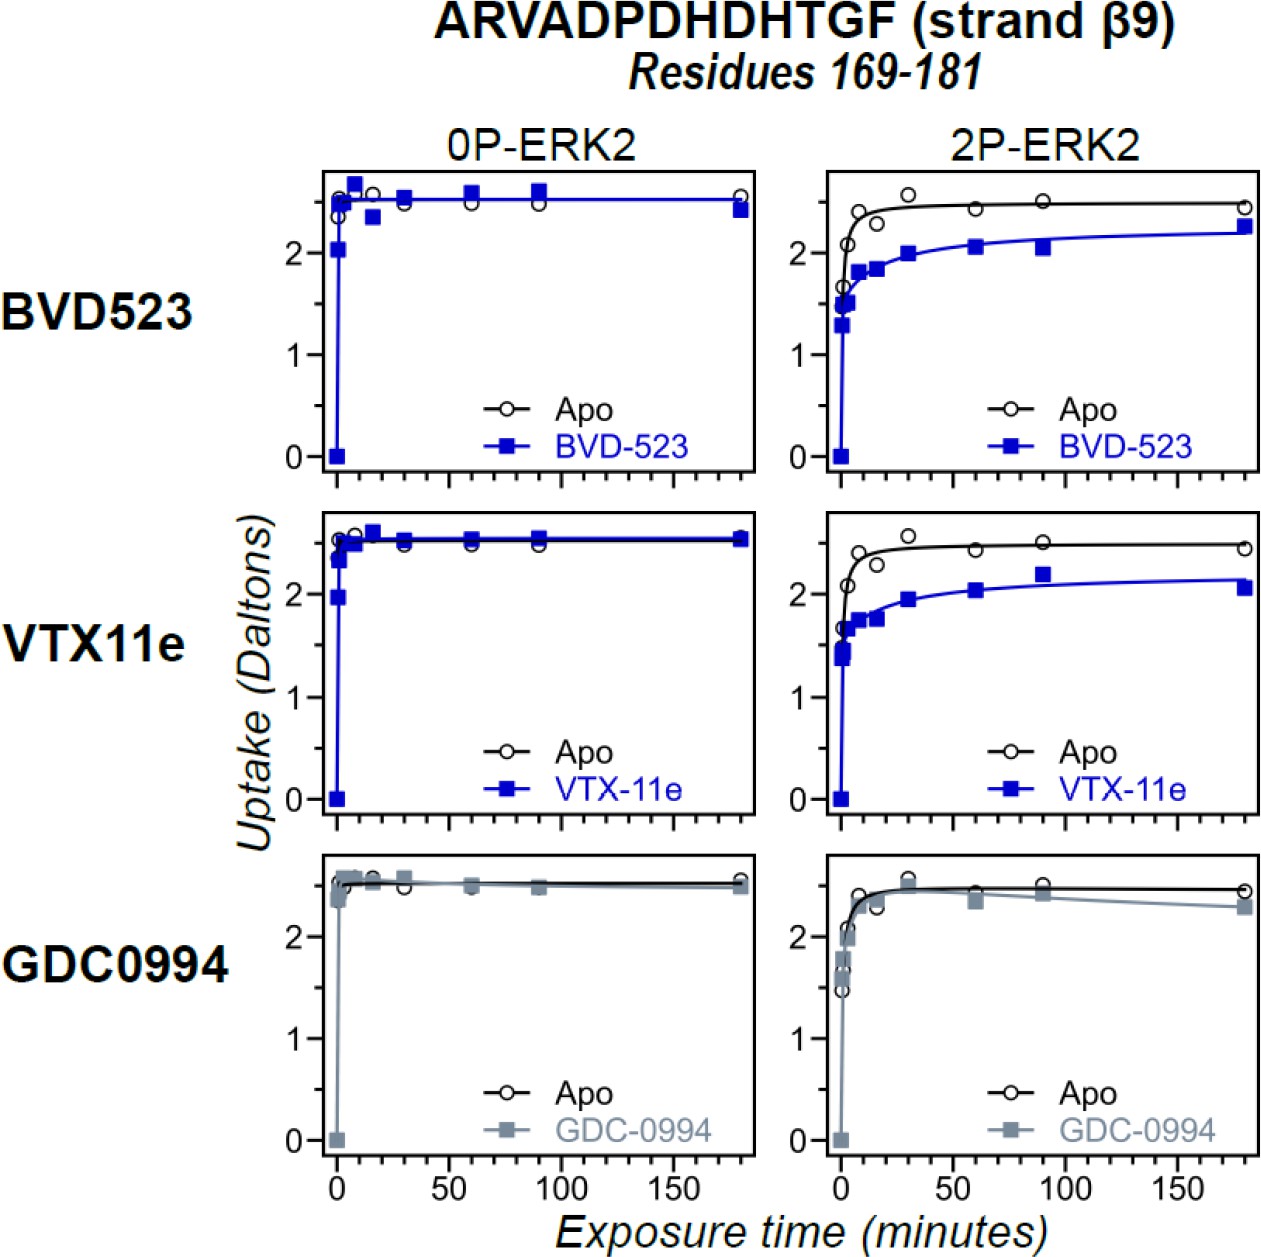
Hydrogen-deuterium exchange (HDX) time courses with differential responses to inhibitor binding.
HDX time courses for strand β9 (peptide 169–181, ARVADPDHDHTGF) located adjacent to the DFG motif. Open symbols show deuterium uptake in 0P- or 2P-ERK2 apoenzymes. Closed symbols show deuterium uptake in 0P- or 2P-ERK2 complexed with BVD523, Vertex-11e (VTX11e) or GDC0994. Deuterium uptake in these regions decreases by a larger degree upon binding VTX11e or BVD523 (blue) compared to GDC0994 (gray), as also seen in the DFG motif, P+1, and helix αF (Figure 3).
Figure 4
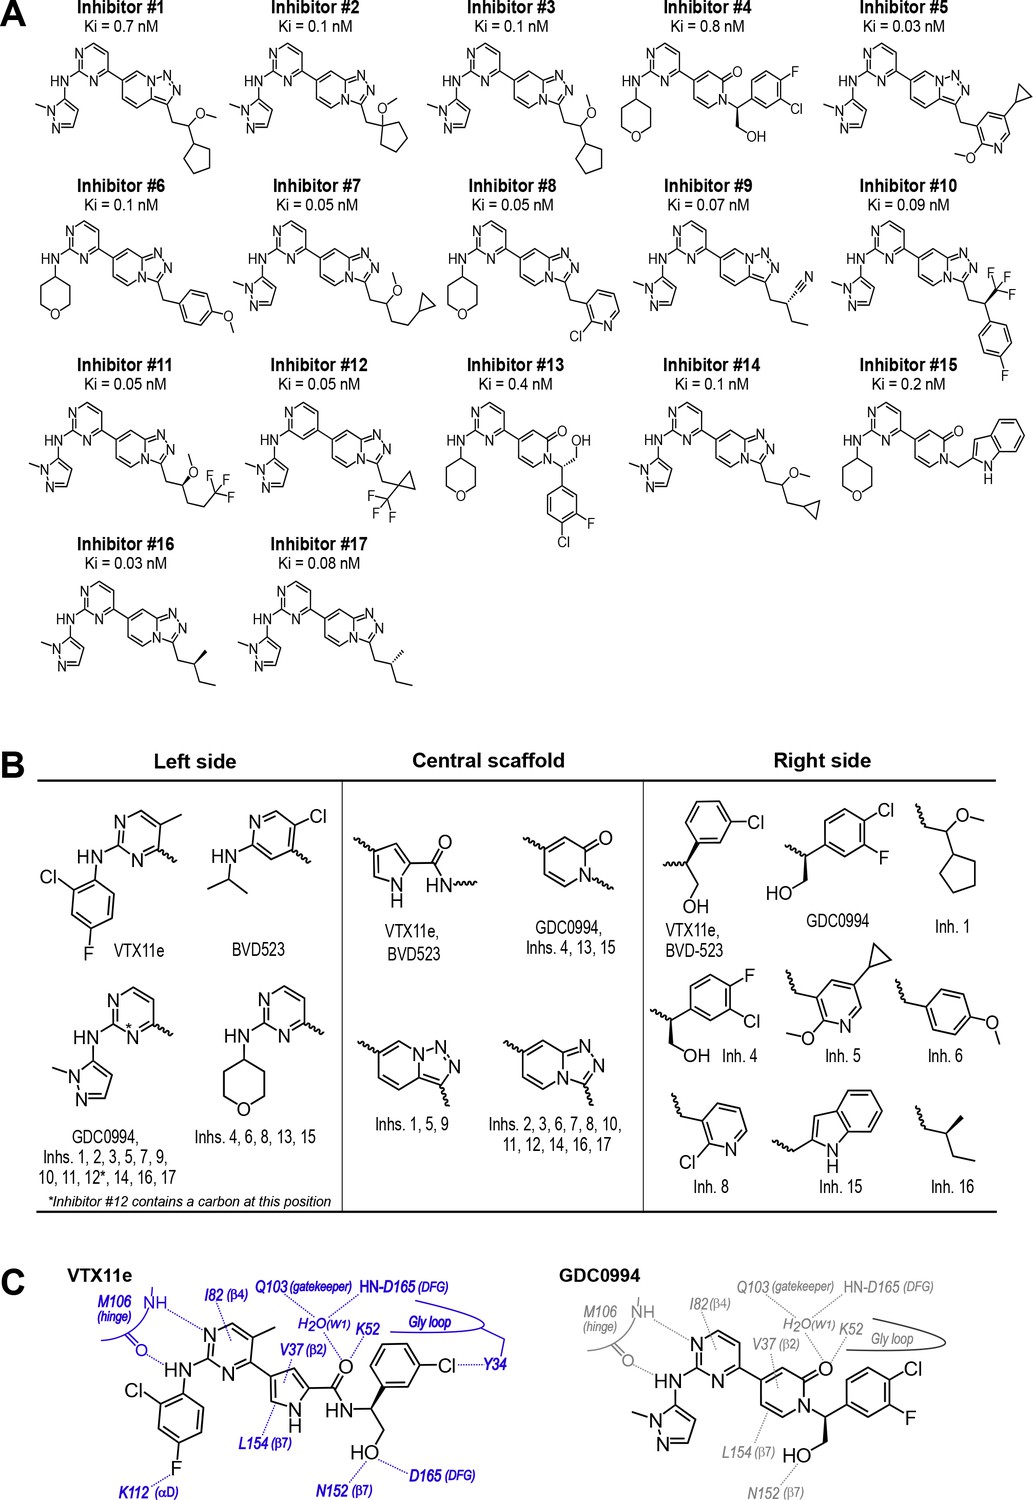
Novel ATP-competitive inhibitors of ERK1/2.
(A) A panel of 17 novel ERK1/2 inhibitors was surveyed in this study. Estimates of Ki were measured using kinase assays for phosphorylation of Omnia peptide substrate (Invitrogen). (B) Variations among ERK1/2 inhibitors in their left-side, central scaffold, and a sampling of right-side substituents. (C) Contacts formed by VTX11e and GDC0994 with active site residues in 2P-ERK2, based on published X-ray structures (PDBID:6OPK, PDBID:6OPH).
Figure 5 with 2 supplements
Hydrogen-deuterium exchange (HDX) assays survey conformation selection among compounds in the extracellular signal-regulated kinase-2 (ERK) inhibitor panel.
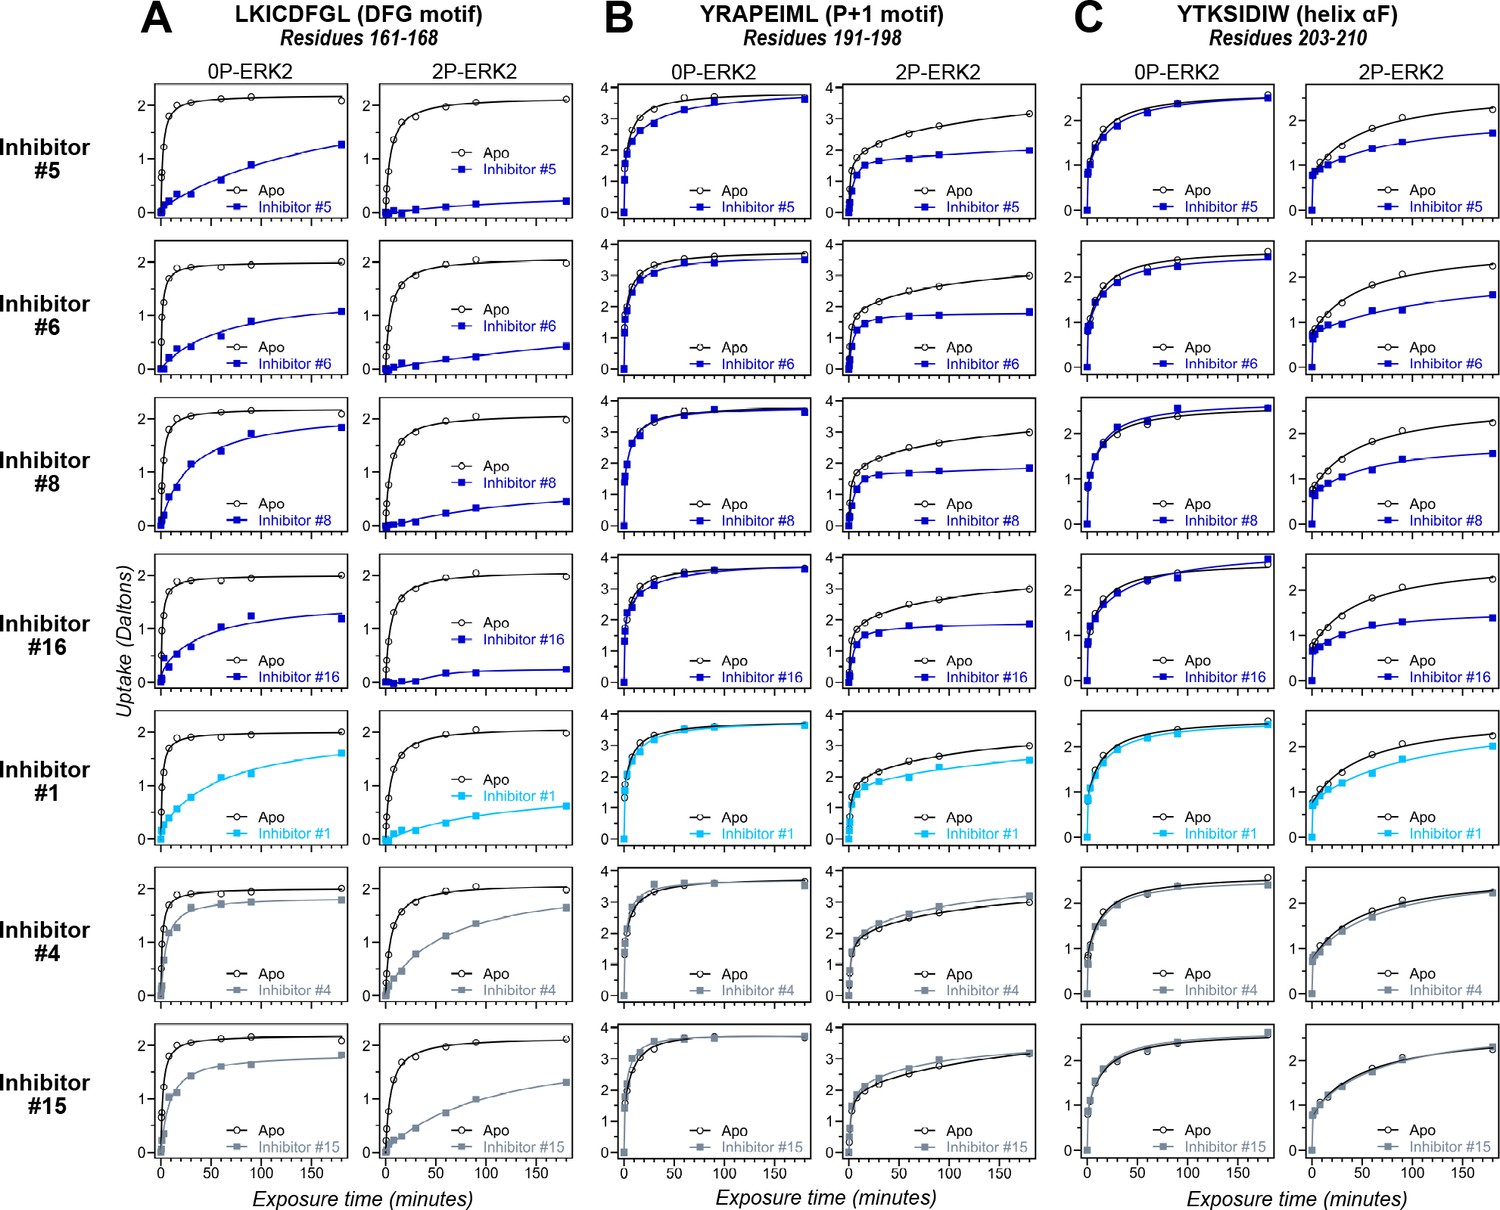
HDX measurements were performed with representative inhibitors shown in Figure 4, chosen for variations in their left-side, central scaffold, and right-side substituents. Time courses show deuterium uptake at the (A) DFG motif (peptide 161–168: LKICDFGL), (B) P+1 segment (peptide 191–198, YRAPEIML), and helix αF (peptide 203–210: YTKSIDIW). Enhanced HDX protection (strongly decreased uptake) in each segment by inhibitors #5, #6, #8, and #16 (blue) suggest properties of conformation selection for the R-state, while lower protection by inhibitors #4 and #15 (gray) suggest retention of conformational exchange. Inhibitor #1 (cyan) shows HDX properties intermediate to these two groups. HDX time courses for the full set of 17 inhibitors are shown in Figure 5—figure supplement 1 and Figure 5—figure supplement 2.
Figure 5—figure supplement 1
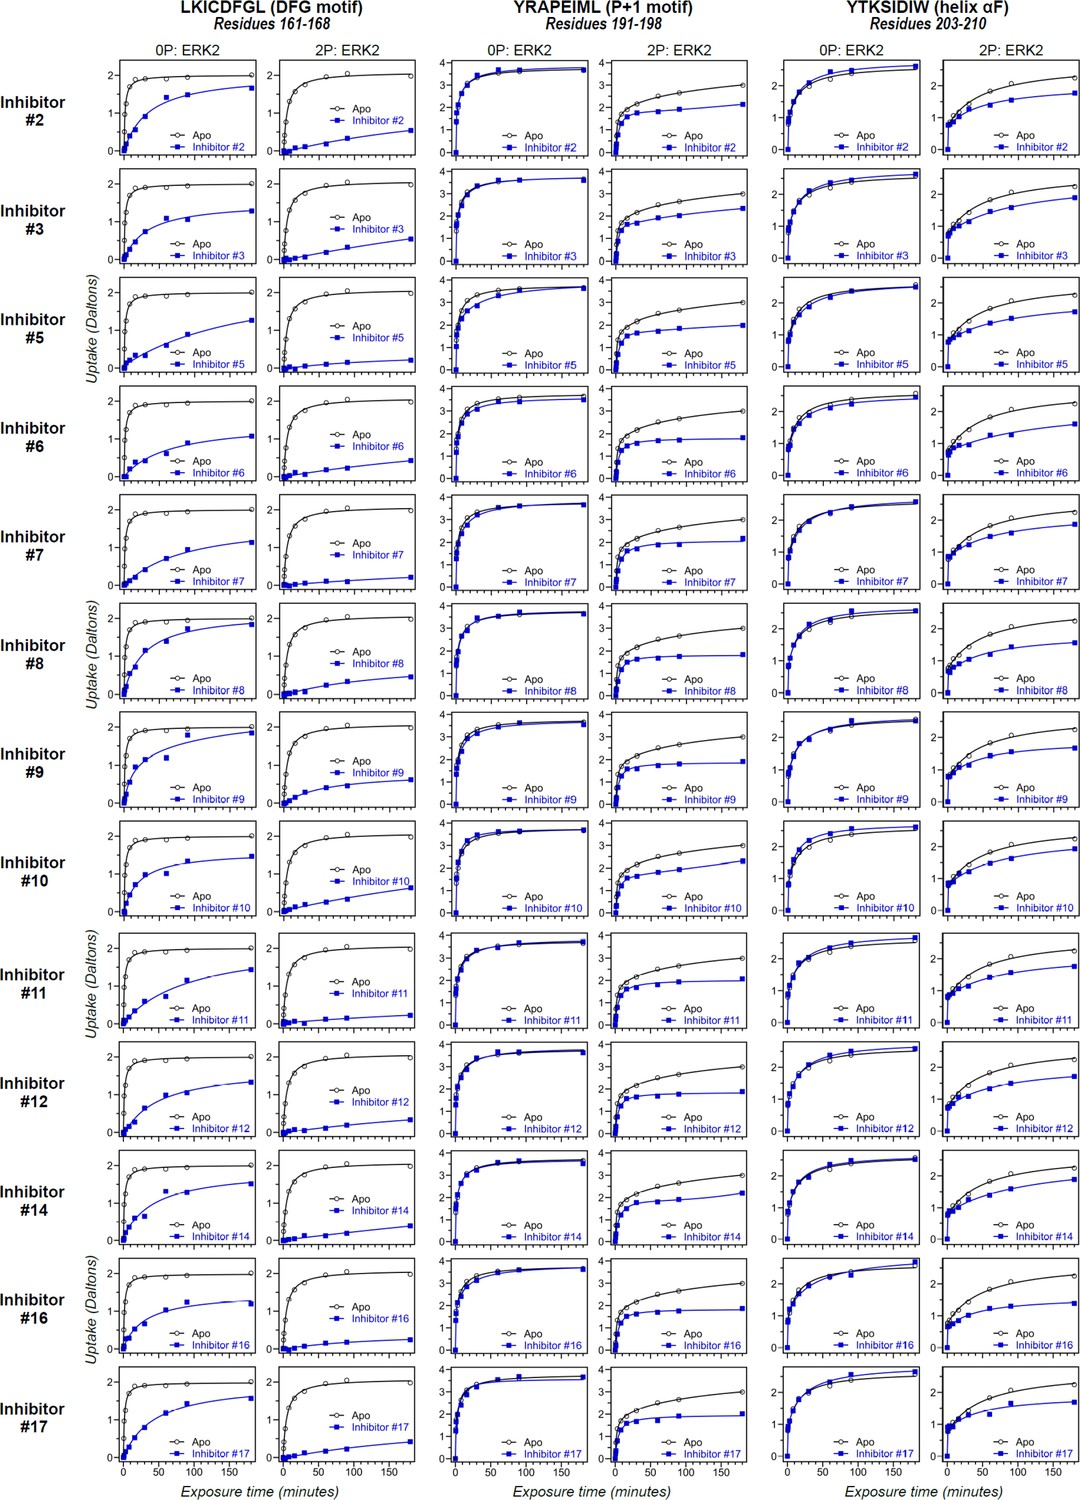
Differential hydrogen-deuterium exchange (HDX) responses to new inhibitors were surveyed in this study.
Effects of binding the full set of inhibitors #1-#17 on deuterium uptake into the DFG motif (peptide 161–168: LKICDFGL), P+1 segment (peptide 191–198, YRAPEIML), and helix αF (peptide 203–210: YTKSIDIW), expanding the selected subset in Figure 5. Open symbols show deuterium uptake in 0P- or 2P-ERK2 apoenzymes. Closed symbols show deuterium uptake in 0P- or 2P-ERK2 complexed with inhibitors. Thirteen inhibitors (#2, #3, #5–12, #14, #16, and #17; blue) show HDX uptake patterns for 2P-ERK2 that are similar to Vertex-11e (VTX11e) and BVD523, suggesting conformation selection for the R-state.
Figure 5—figure supplement 2
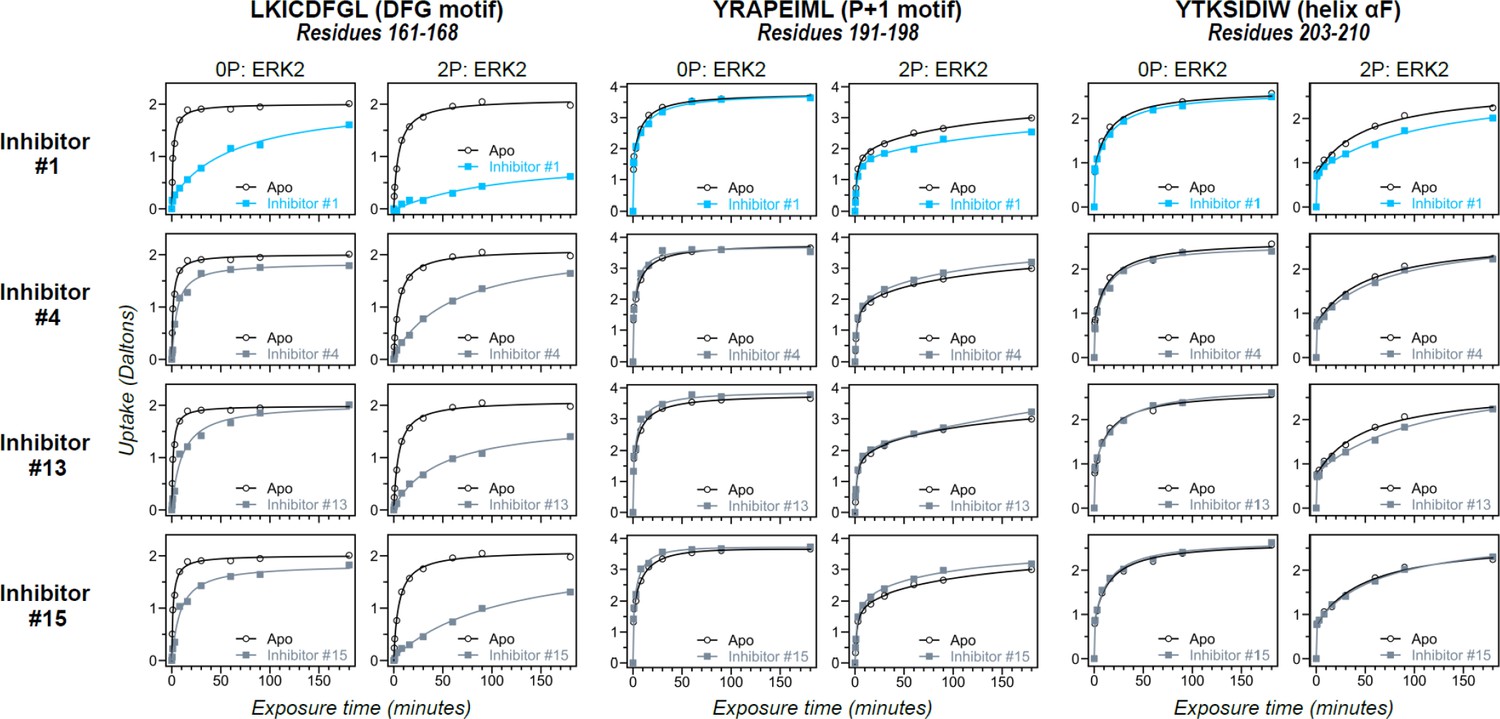
Differential hydrogen-deuterium exchange (HDX) responses to new inhibitors were surveyed in this study.
Effects of binding the full set of inhibitors #1-#17 on deuterium uptake into the DFG motif (peptide 161–168: LKICDFGL), P+1 segment (peptide 191–198, YRAPEIML), and helix αF (peptide 203–210: YTKSIDIW), expanding the selected subset in Figure 5. Open symbols show deuterium uptake in 0P- or 2P-ERK2 apoenzymes. Closed symbols show deuterium uptake in 0P- or 2P-ERK2 complexed with inhibitors. Three inhibitors (#4, #13, #15; gray) show HDX patterns similar to GDC0994, consistent with R↔L exchange. One inhibitor (#1; cyan) shows significant HDX protection in the DFG motif, but only marginal protection in the P+1 segment or helix αF, suggesting behavior intermediate between Vertex-11e (VTX11e)/BVD523 and GDC0994.
Figure 6
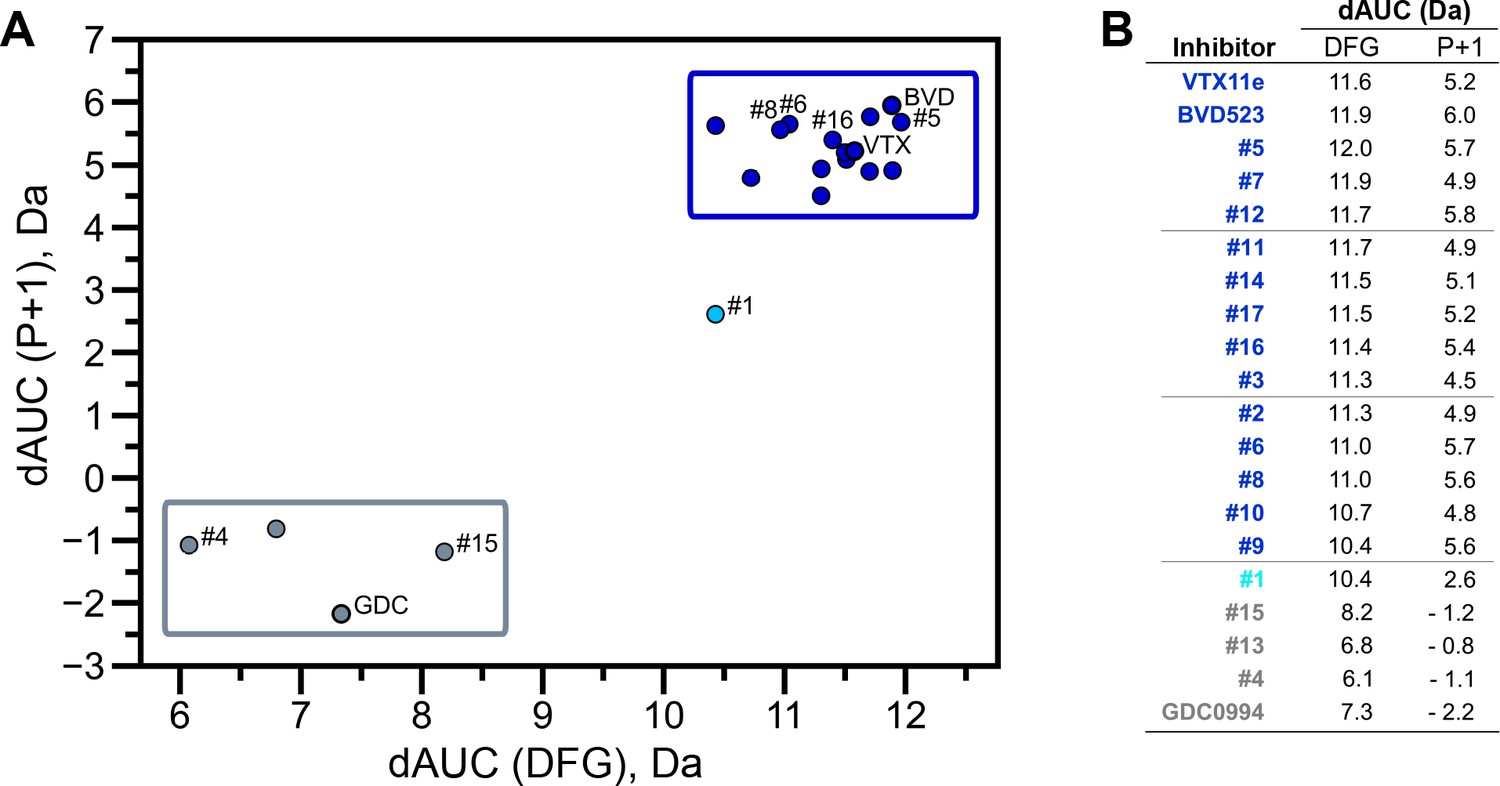
Extracellular signal-regulated kinase (ERK) inhibitors differentially cluster with Vertex-11e (VTX11e)/BVD523 or GDC0994.
Effects of inhibitors on hydrogen-deuterium exchange (HDX) were quantified by a difference AUC measurement, which calculates dAUC = Σt(HDXApo- HDXInhibitor)t over all time points. (A) Plot comparing dAUC for the DFG motif (peptide 161–168) vs P+1 segment (peptide 191–198) reveals 13 inhibitors clustered with VTX11e/BVD523, 3 inhibitors clustered with GDC0994, and one inhibitor with intermediate properties. Labels mark the representative set of inhibitors shown in Figure 4. (B) Difference area measurement (dAUC) values for each inhibitor.
Figure 7 with 2 supplements
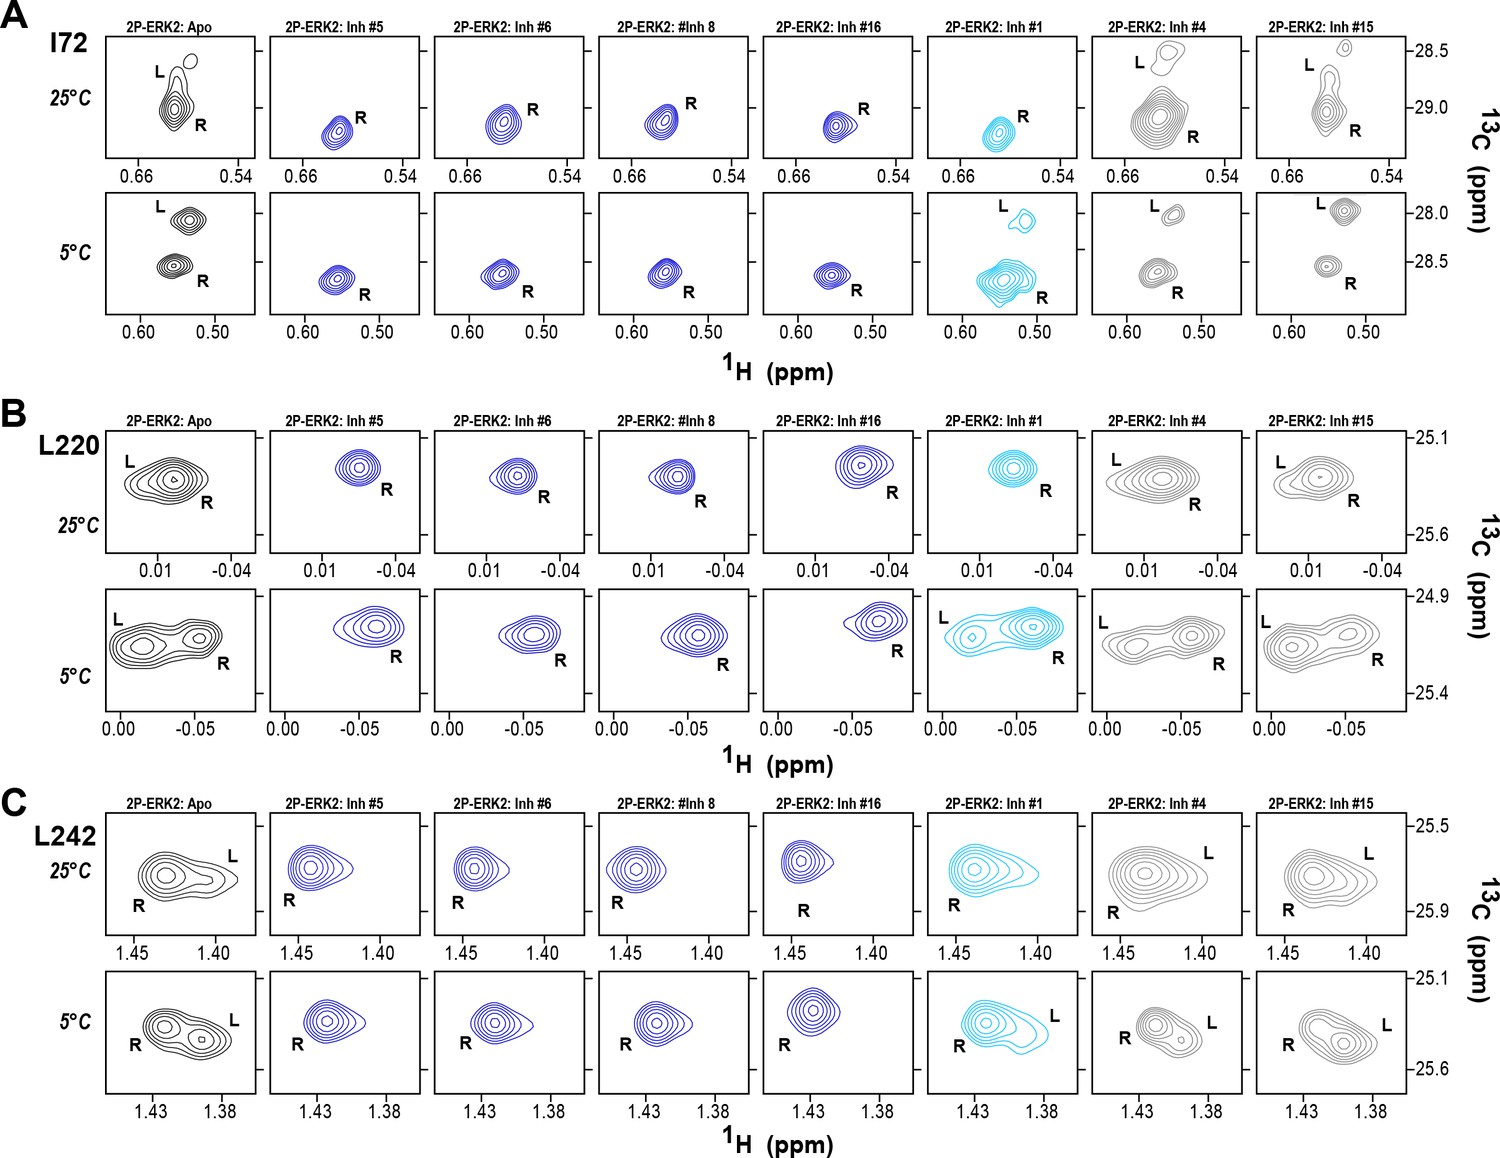
2D-HMQC NMR confirms R-state selection by extracellular signal-regulated kinase (ERK) inhibitors.
2D-HMQC NMR spectra were collected on 2P-ERK2 at 25°C and 5°C. Effects on [methyl 13C,1H] peaks of residues (A) I72, (B) L220, and (C) L242 are shown for the representative set of inhibitors in Figure 5. Inhibitors #5, #6, #8, and #16 (shown in blue) shifted the R↔L equilibrium to 100% R at all temperatures, confirming R-state selection as suggested by their HDX behaviors in Figure 5 and Figure 6. Inhibitors #4 and #15 (in gray) retained R:L populations comparable to those with GDC0994. Inhibitor #1 (in cyan) showed partial selection for the R state but retained conformational exchange, as evidenced by an L-state population present at 5 °C. Full NMR spectra are shown in Figure 7—figure supplement 1 and Figure 7—figure supplement 2.
Figure 7—figure supplement 1
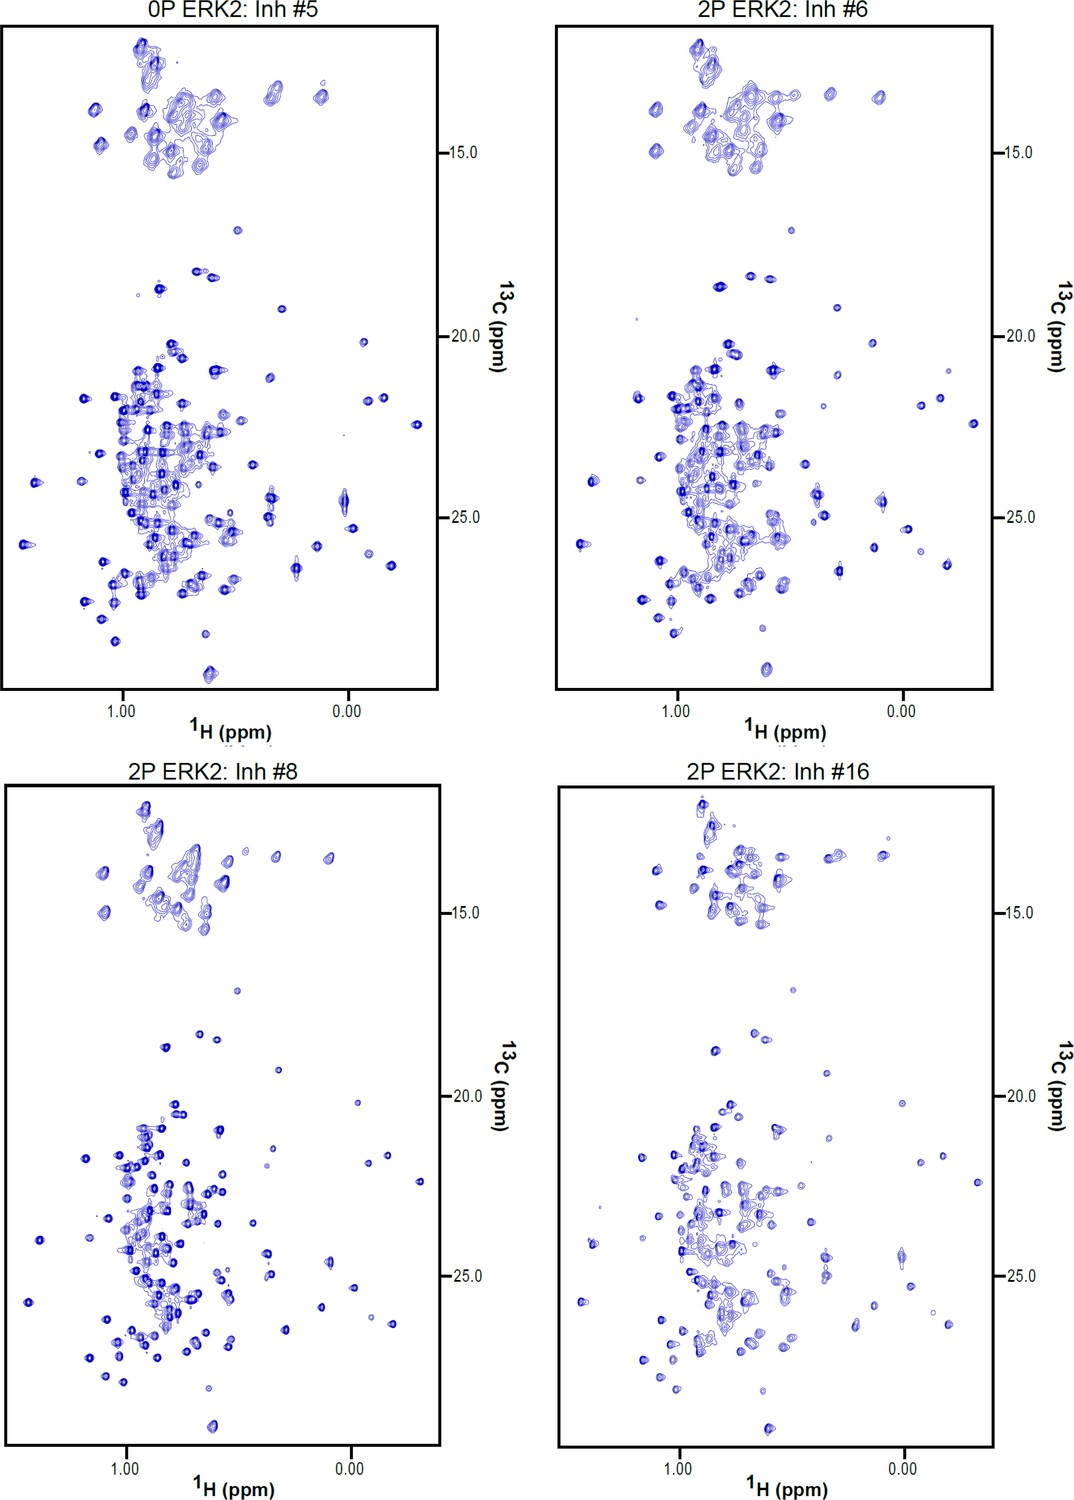
2D-HMQC NMR spectra of inhibitor-bound 2P-ERK2.
2D [13C,1H] HMQC spectra for 2P-ERK2:Inh#5, 2P-ERK2:Inh#6, 2P-ERK2:Inh#8, 2P-ERK2:Inh#16. Each complex was formed from 150 μM extracellular signal-regulated kinase-2 (ERK2) and 180 μM inhibitor.
Figure 7—figure supplement 2
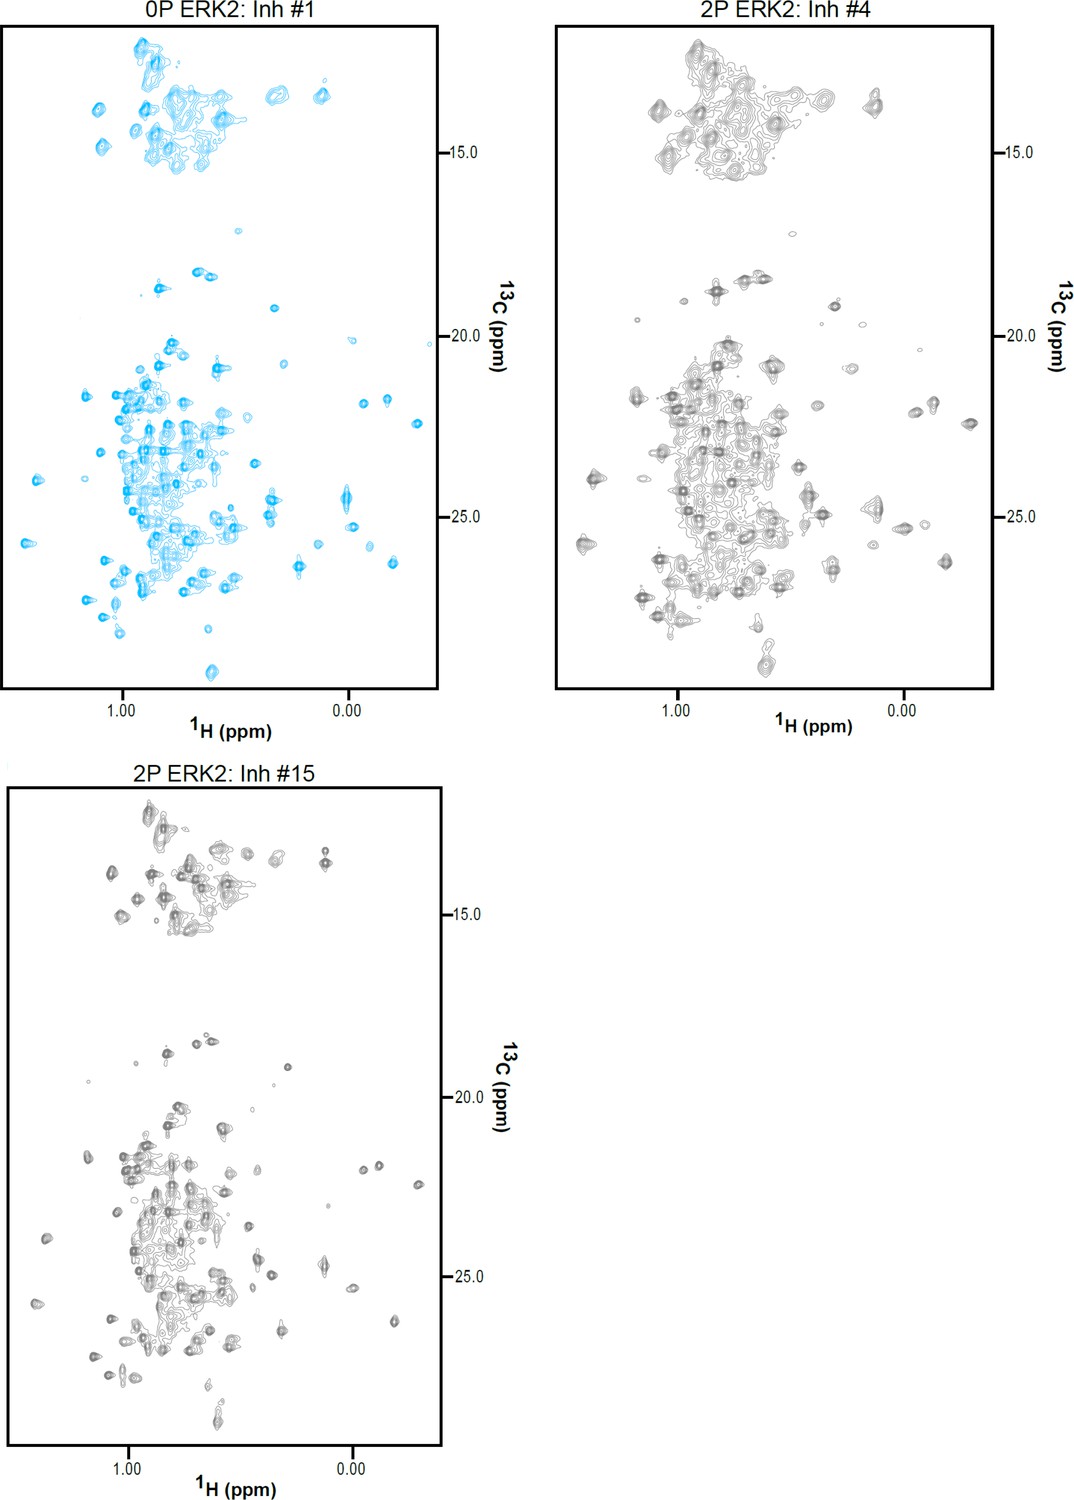
2D-HMQC NMR spectra of inhibitor-bound 2P-ERK2.
2D [13C,1H] HMQC spectra for 2P-ERK2:Inh#1, 2P-ERK2:Inh#4, and 2P-ERK2:Inh#15. Each complex was formed from 150 μM extracellular signal-regulated kinase-2 (ERK2) and 180 μM inhibitor.
Figure 8 with 1 supplement
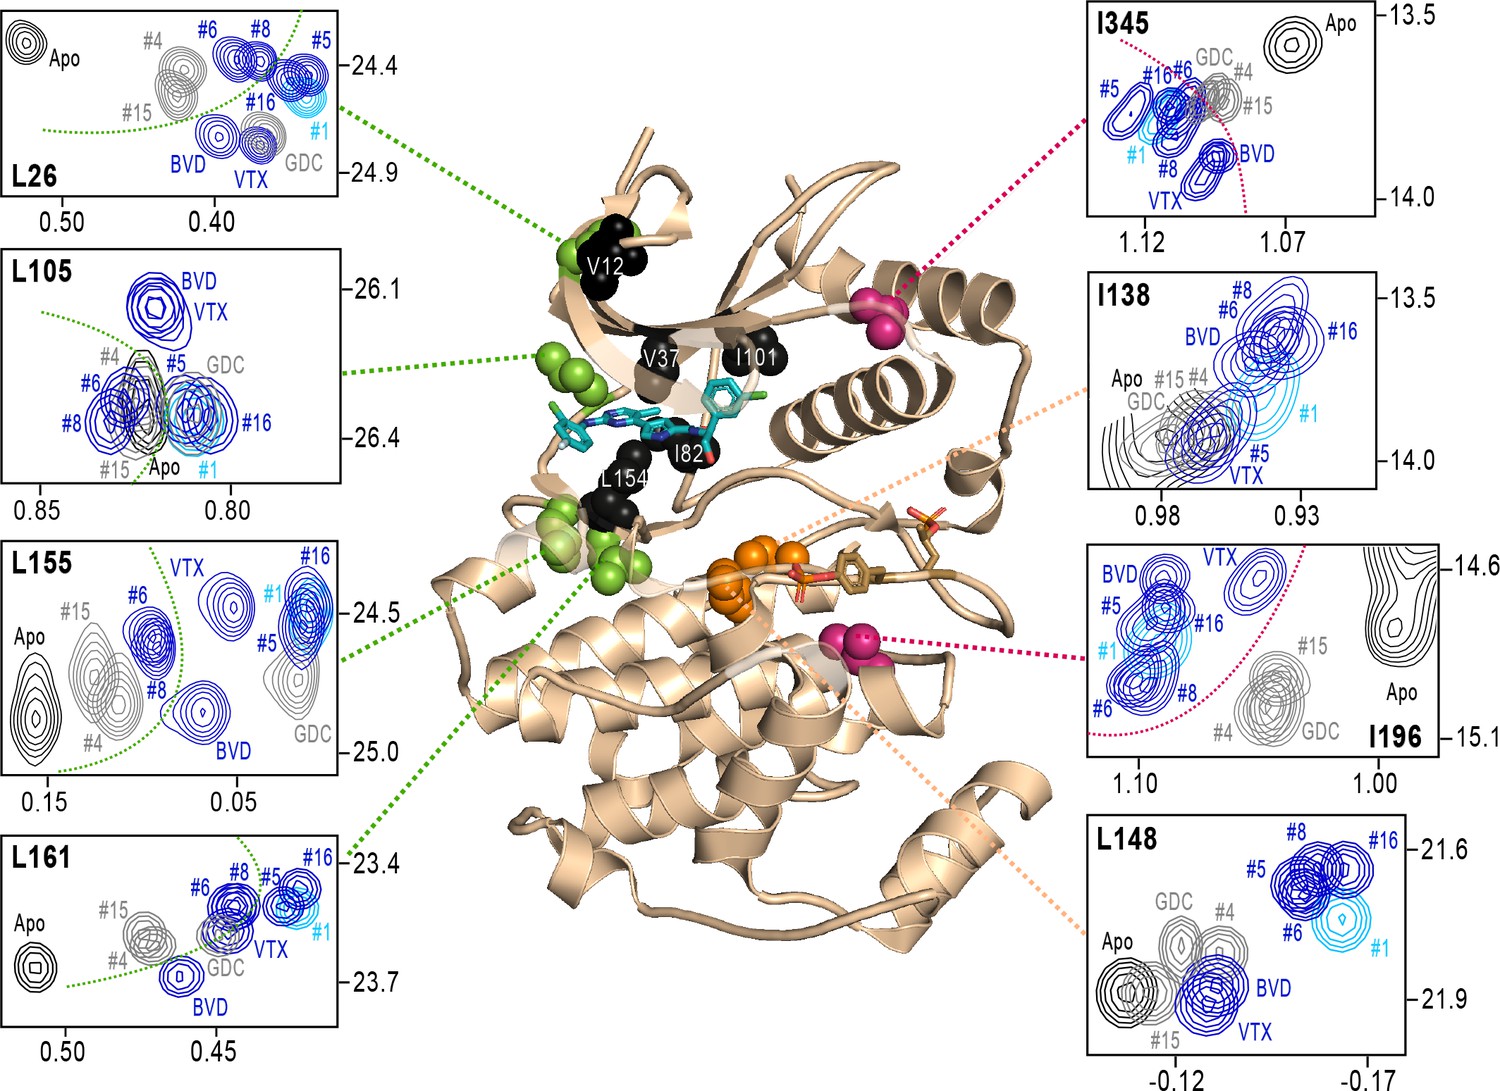
NMR chemical shift patterns reveal long-distance perturbations by R-state inhibitors.
2D-HMQC NMR spectra of 2P-ERK2 at 25 °C showing [methyl 13C,1H] peaks with significant changes in chemical shift upon binding extracellular signal-regulated kinase (ERK) inhibitors. NMR peaks colored blue correspond to inhibitors characterized as R-state selective (Vertex-11e : VTX11e, BVD523, #5, #6, #8, #16). Peaks colored gray correspond to inhibitors that allow conformational exchange (GDC0994, #4, #15). Peaks in cyan correspond to inhibitor #1, which shows partial R-state selection. Shown in red spheres on the X-ray structure (PDBID:6OPK) are residues (I196, I345) that separate the R-state selective inhibitors from those that allow exchange. Green spheres are residues (L26, L105, L155, L161) that separate inhibitors with left-side tetrahydropyran (#4, #6, #8, #15) from other substituents. Black spheres are residues that broaden upon binding all inhibitors (I82, L154), or all inhibitors except VTX11e (V12, V37, I101); These together with residues in orange (I138, L148) reflect first- and second-sphere regions of contact around the binding site. Chemical shifts and chemical shift perturbations (Δδ) for all assigned residues are shown in Figure 8—figure supplement 1 and Supplementary file 2.
Figure 8—figure supplement 1
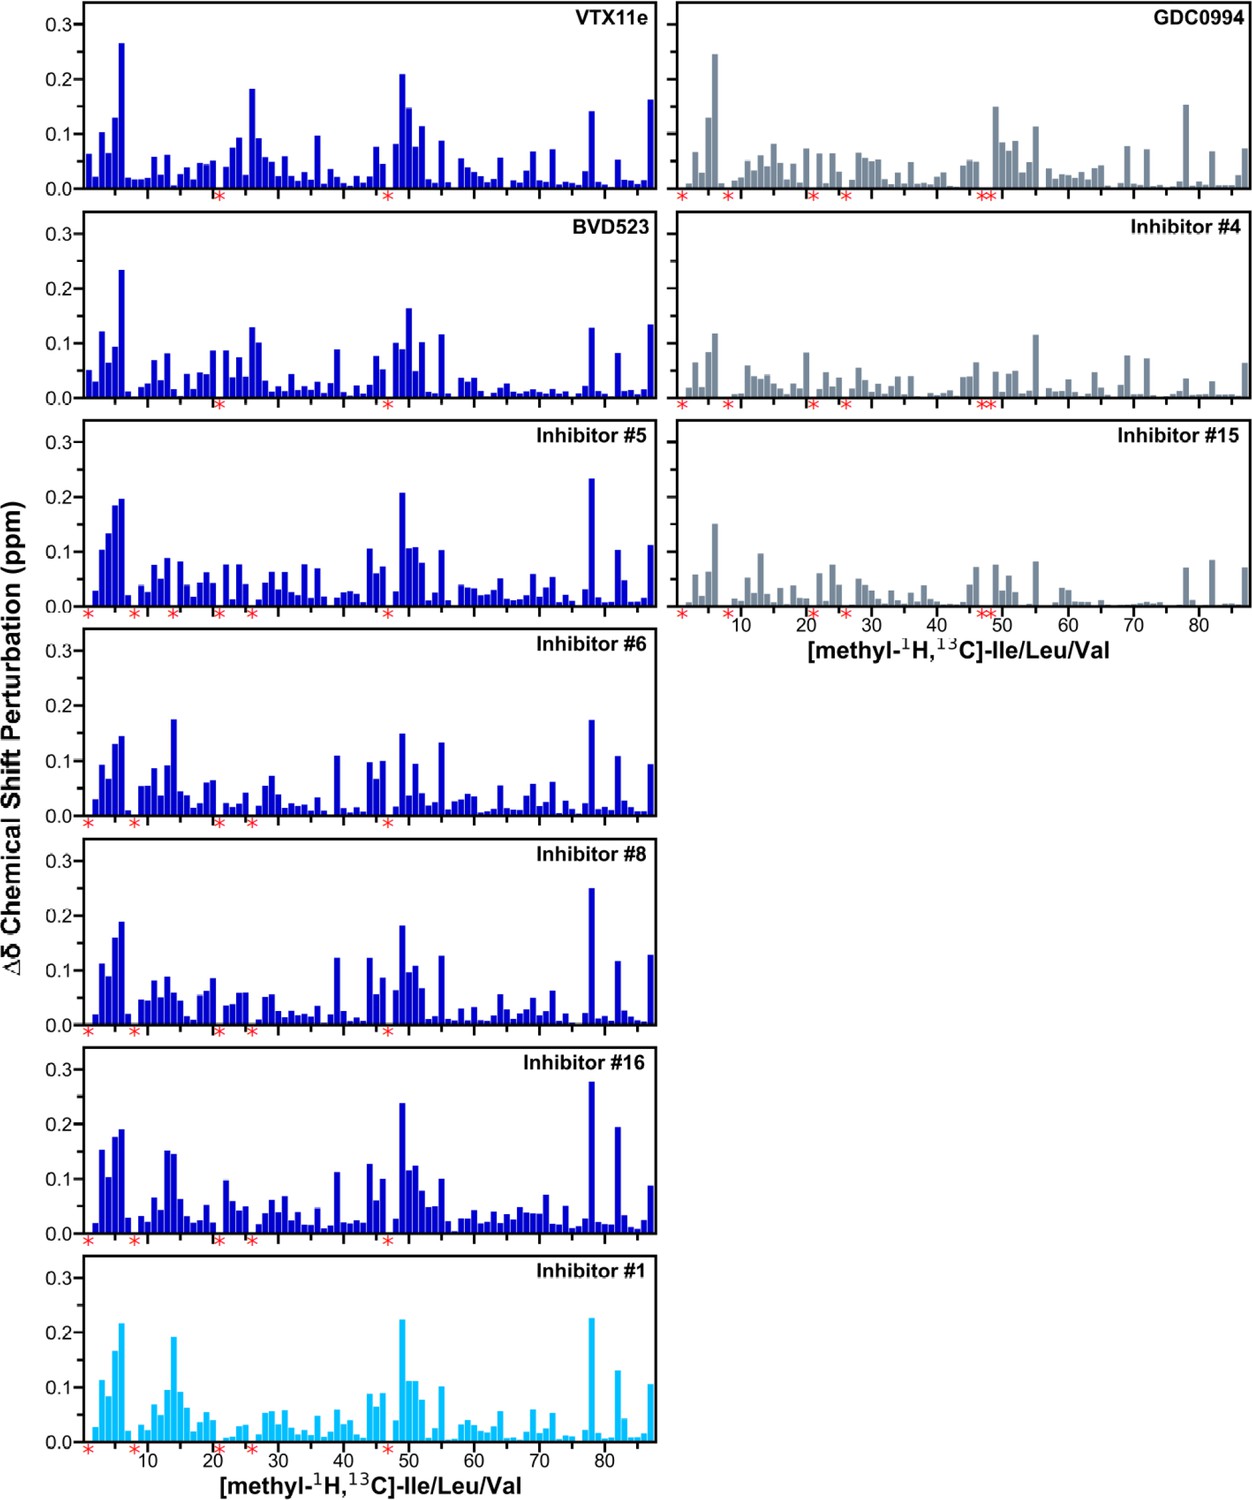
Chemical shift changes induced by inhibitor binding to 2P-ERK2.
2D-HMQC spectra collected on [methyl-13C,1H]-ILV labeled 2P-ERK2 complexed with Vertex-11e (VTX11e), BVD523, GDC0994, and the selected subset of seven inhibitors in Figure 7. Chemical shift perturbations (CSP) were calculated by the equation: Δδ (ppm)=SQRT[(δH2 + 0.20(δC2))], and plotted for each Ile, Leu, and Val (ILV) residue methyl. Red asterisks below the x-axes indicate methyl peaks that could not be traced in the ligand-bound state, ascribed to peak broadening. Numberings of methyl assignments, their chemical shifts, and chemical shift perturbation (CSP) calculations are listed in Supplementary file 2.
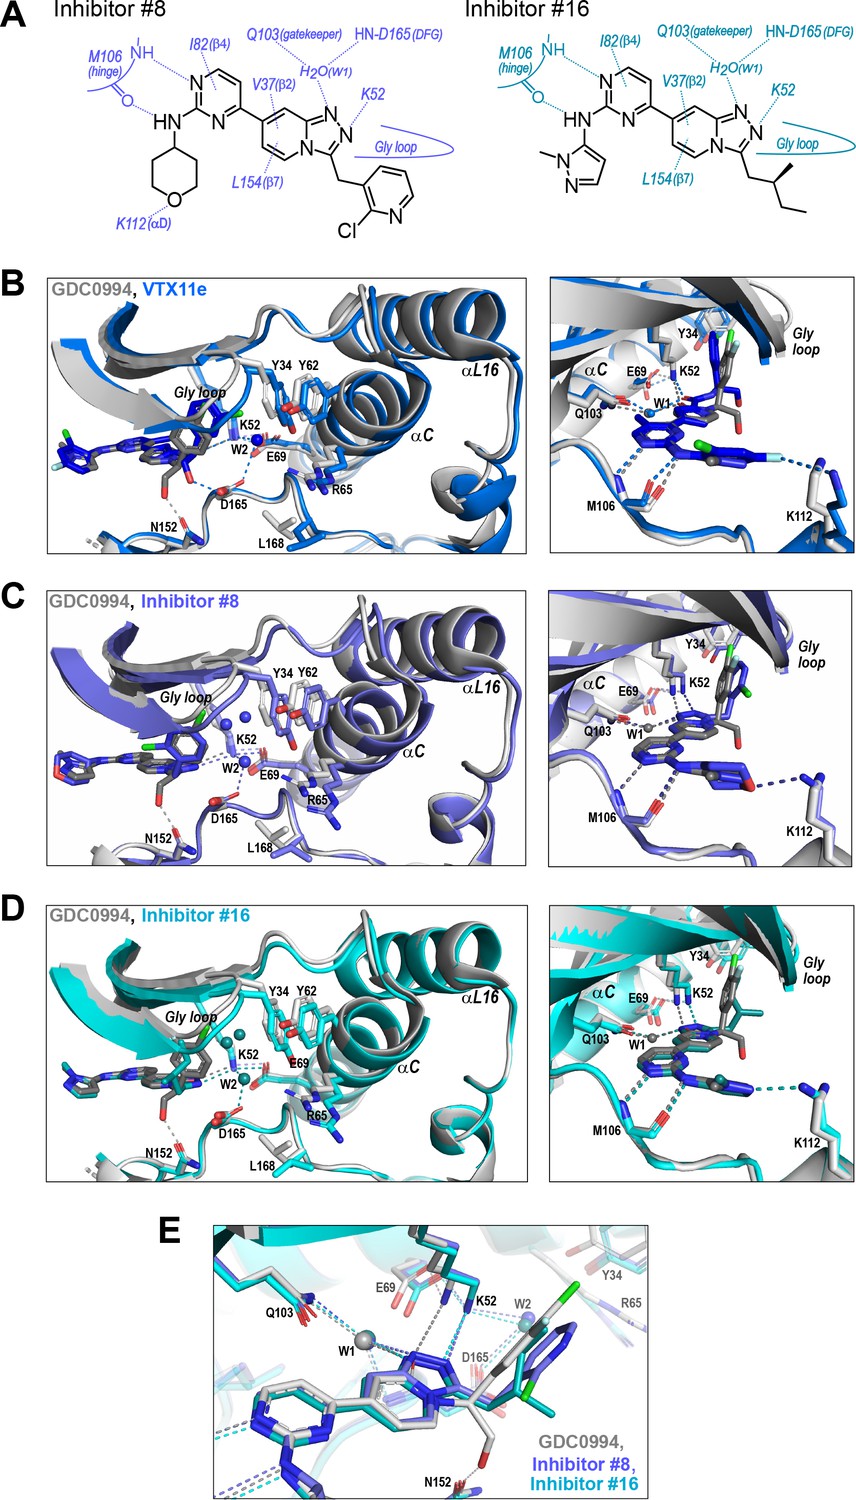
Figure 9
R-state inhibitors promote outward movements of N-lobe structural elements.
(A) Summary of contacts formed by inhibitors #8 and #16 with active site residues in co-crystal structures with 2P-ERK2 (PDBID: 8U8K and 8U8J). (B) The active site of 2P-ERK2 complexed with GDC0994 (PDBID:6OPH, gray) and Vertex-11e (VTX11e) (PDBID:6OPK, blue) (Pegram et al., 2019). Left panel: Front view showing the movement of the Gly loop, helix αC, and helix αL16 in an ‘outward’ direction (away from the inhibitor) upon binding of VTX11e (blue), relative to GDC0994 (gray). The movement can be attributed to the right-side 3-chlorobenzyl substituent in VTX11e which interacts with theπ orbital of Y34 in the Gly loop (Cl-π distance, 3.5 Å). In turn, π−π stacking interactions between Y34 and Y62 couples movements of the Gly loop to helix αC. Right panel: Side view showing left-side hydrogen bond contacts with main chain atoms of hinge residue M106, as typical of ATP-competitive kinase inhibitors. (C, D) Active site of 2P-ERK2 complexed with GDC0994 (PDBID:6OPH, gray) and (C) inhibitor #8 (PDBID:8U8K, slate), or (D) inhibitor #16 (PDBID:8U8J, cyan). Like VTX11e, inhibitors #8 and #16 move the Gly loop, helix αC, and helix αL16 outward, relative to GDC0994. Right panels (B–D) show that all inhibitor complexes share a bound water (W1) bridging the central scaffold to the gatekeeper residue in ERK2 (Q103). Left panels show that a bound water (W2) bridges active site residues K52 and D165 in complexes with VTX11e, inhibitor #8, and inhibitor #16, but not GDC0994. (E) Overlay of GDC0994 (gray), inhibitor #8 (slate) and inhibitor #16 (cyan). The relative N-lobe movements in panels (C) and (D) may be explained by the differential hydrogen bonding of K52 and W1 to the triazolopyridine central scaffold of inhibitors #8 and #16, distinct from the pyridone scaffold of GDC0994. The position of the hydrogen bond of the triazole nitrogen with K52 relative to the pyridone oxygen moves the K52-E69 salt bridge in an outward direction in inhibitors #8 and #10 relative to GDC0994. Structures were superpositioned by aligning Cα atoms within the C-terminal domain (residues 109–141, 205–245, 272–310).
Figure 10 with 1 supplement
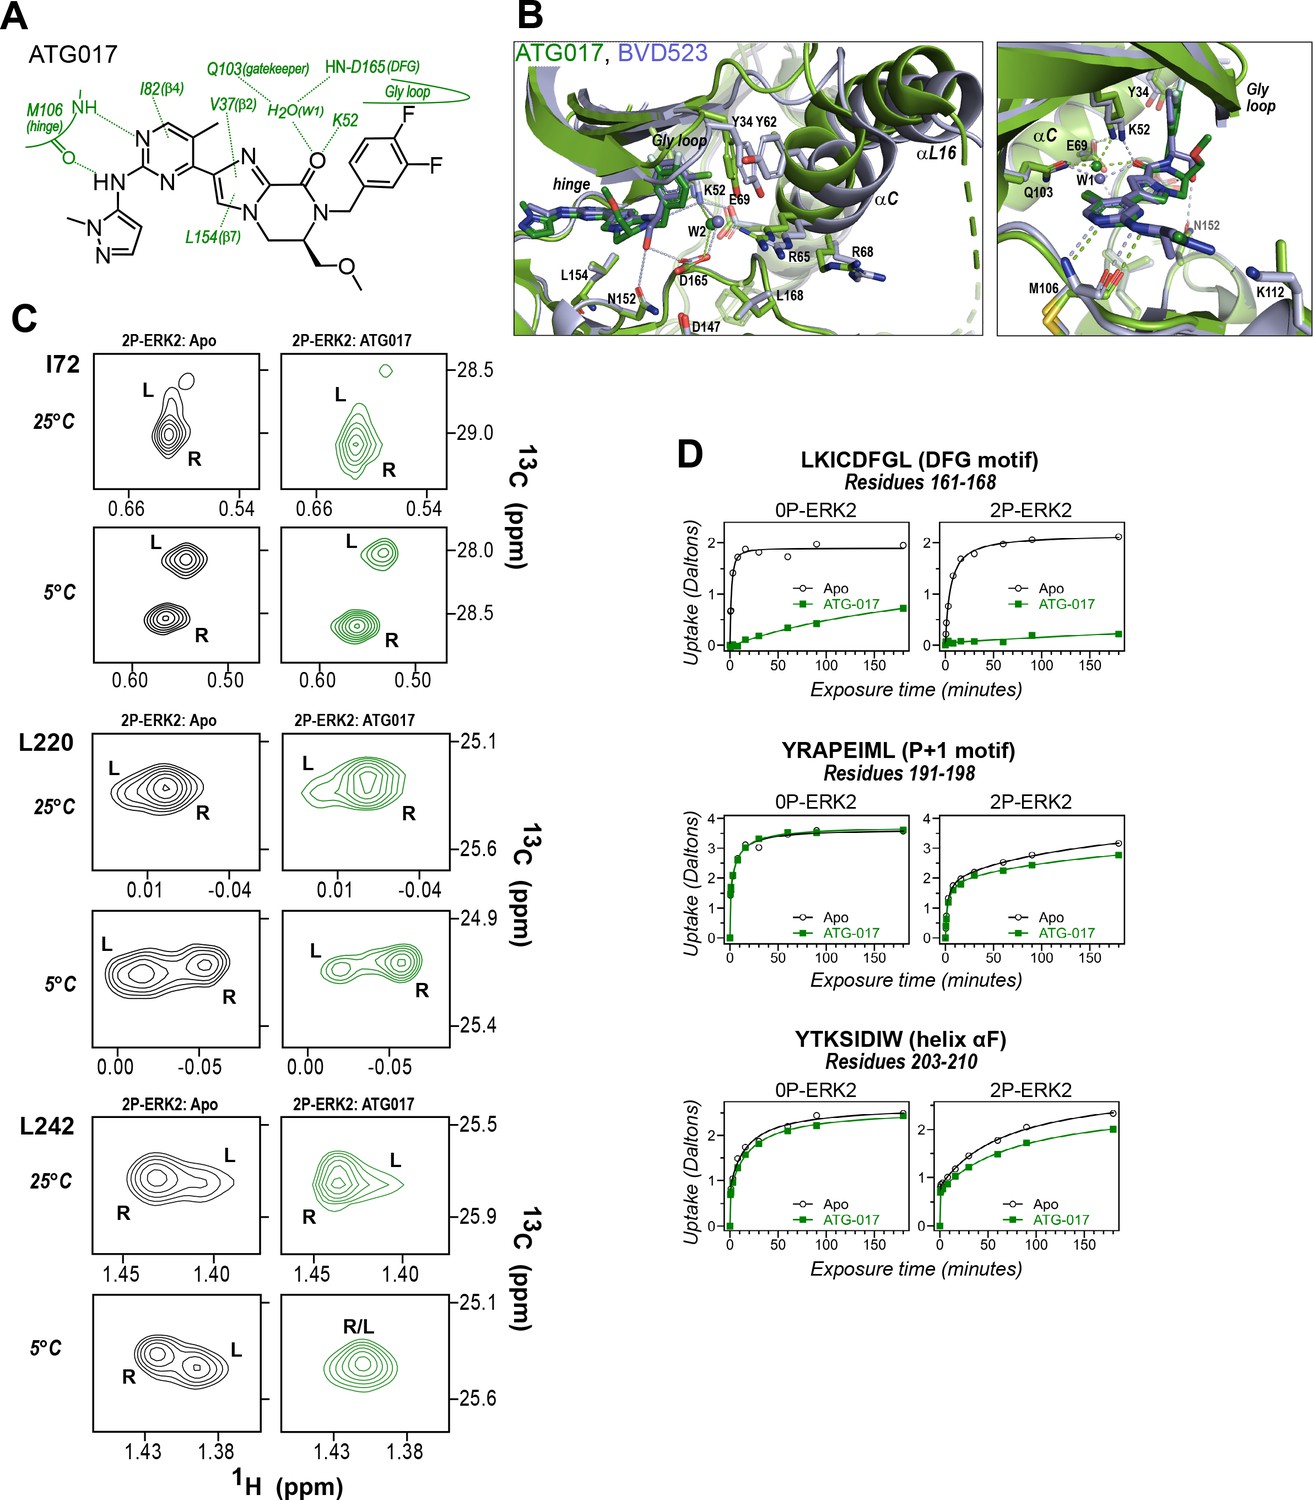
ATG017 promotes Gly loop opening and inward movement of N-lobe elements.
(A) Summary of contacts formed by inhibitor ATG017 with active site residues in a co-crystal structure with 0P-ERK2 (PDBID:6SLG). (B) The active site of 0P-ERK2 complexed with ATG017 (PDBID:6SLG, green) and BVD523 (PDBID:6GDQ, light blue). Left panel: Front view showing movement of the Gly loop, helix αC, and helix αL16 in an outward direction by BVD523, attributed to the close proximity between the right-side chlorobenzyl substituent and theπ orbital of Y34 in the Gly loop (Cl-π distance, 3.3 Å). Right panel: View showing left-side hydrogen bonds with main chain atoms of hinge residue M106. (C) 2D-HMQC spectra of 2P-ERK2 complexed with ATG017 at 25°C and 5°C, showing [methyl 13C,1H] peaks of residues I72, L220 and L242. Unlike 2P-ERK2 complexed with BVD523, the ATG017 complex retains R↔L exchange resembling that of GDC0994 (Figure 1). (D) Hydrogen-deuterium exchange (HDX) time courses with ATG017 measuring deuterium uptake at the DFG motif, P+1 segment, and helix αF. Time courses for strand β9 are shown in Figure 10—figure supplement 1. Enhanced HDX protection by ATG017 binding is observed at the DFG and adjacent β9 segments, but minimally at the P+1 and helix αF, similar to that seen with GDC0994. The results suggest that allosteric coupling between the ligand binding pocket and distal regions surrounding the activation loop, but not the DFG motif or β9, are characteristic of R-state inhibitors. Structures were superpositioned by aligning Cα atoms within the C-terminal domain (residues 109–141, 205–245, 272–310).
Figure 10—figure supplement 1
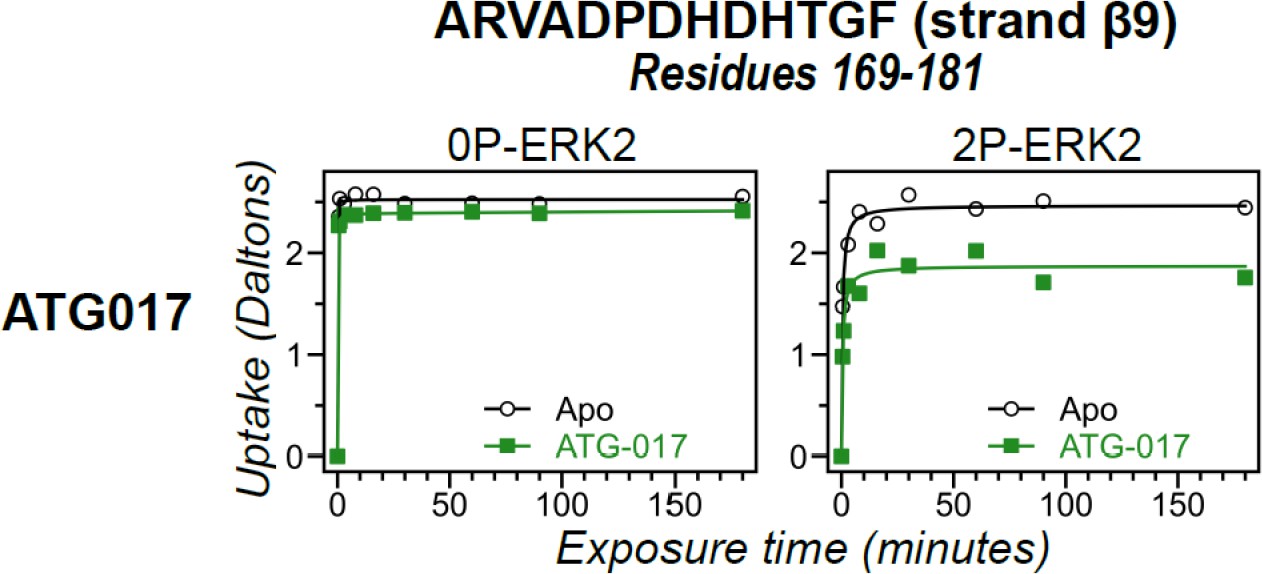
Hydrogen-deuterium exchange (HDX) time courses responsive to ATG017 binding.
HDX time courses for strand β9 (peptide 169–181, ARVADPDHDHTGF). Open symbols show deuterium uptake in 0P- or 2P-ERK2 apoenzymes. Closed symbols show deuterium uptake in 0P- or 2P-ERK2 complexed with ATG017 (green). ATG017 decreases HDX uptake into strand β9 to a larger degree compared to GDC0994, similar to the behavior of the DFG motif, P+1, and helix αF (Figure 10D).
Figure 11 with 1 supplement
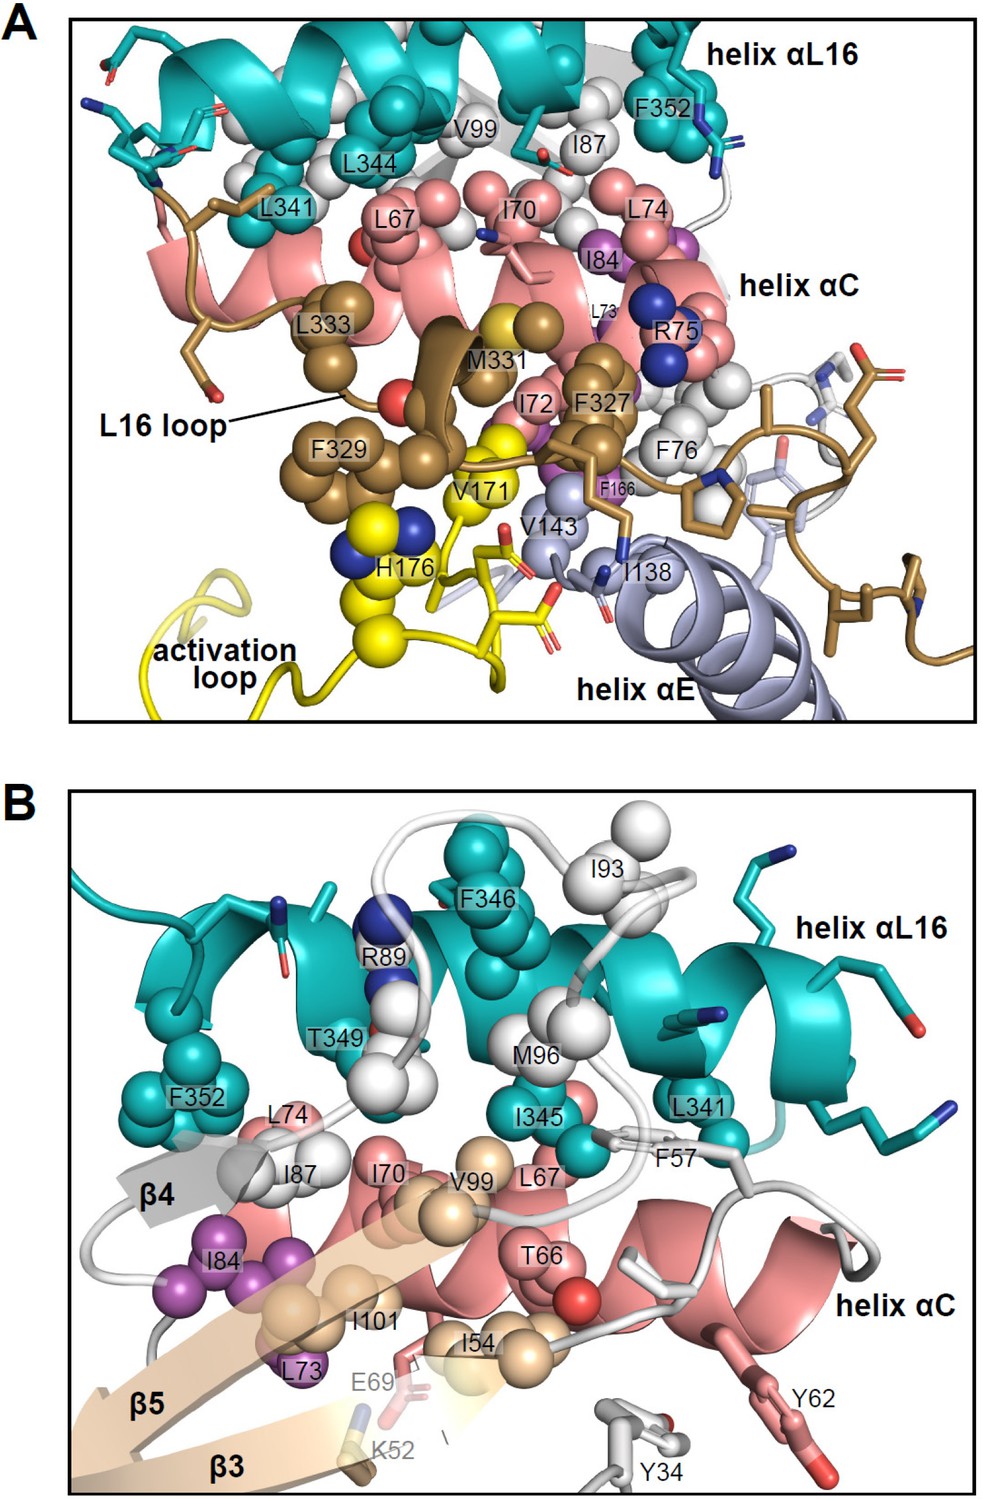
Interactions of L16 and helix αL16 with N-lobe elements.
Views of 2P-ERK2 (PDBID:2ERK), showing hydrophobic residue interactions between (A) loop L16 (M331, F327) and helices αC and αE (I72, R75, F76, I138). Residues in helix αC in turn form second sphere interactions with residues nearby catalytic residues in β3 (I54, nearby K52), β8-β9 (F166, DFG motif), and β6 (V143, nearby HRD). (B) Residue interactions showing close connections between helix αL16 (I345, F346, T349, F352), and helix αC (I54, F57, T66, L67, I70, L74, I84, I87) and loop β4-β5 (R89, I93, M96, V99). Residues in magenta (L73, I84, F166) participate in the R-spine in ERK2.
Figure 11—figure supplement 1
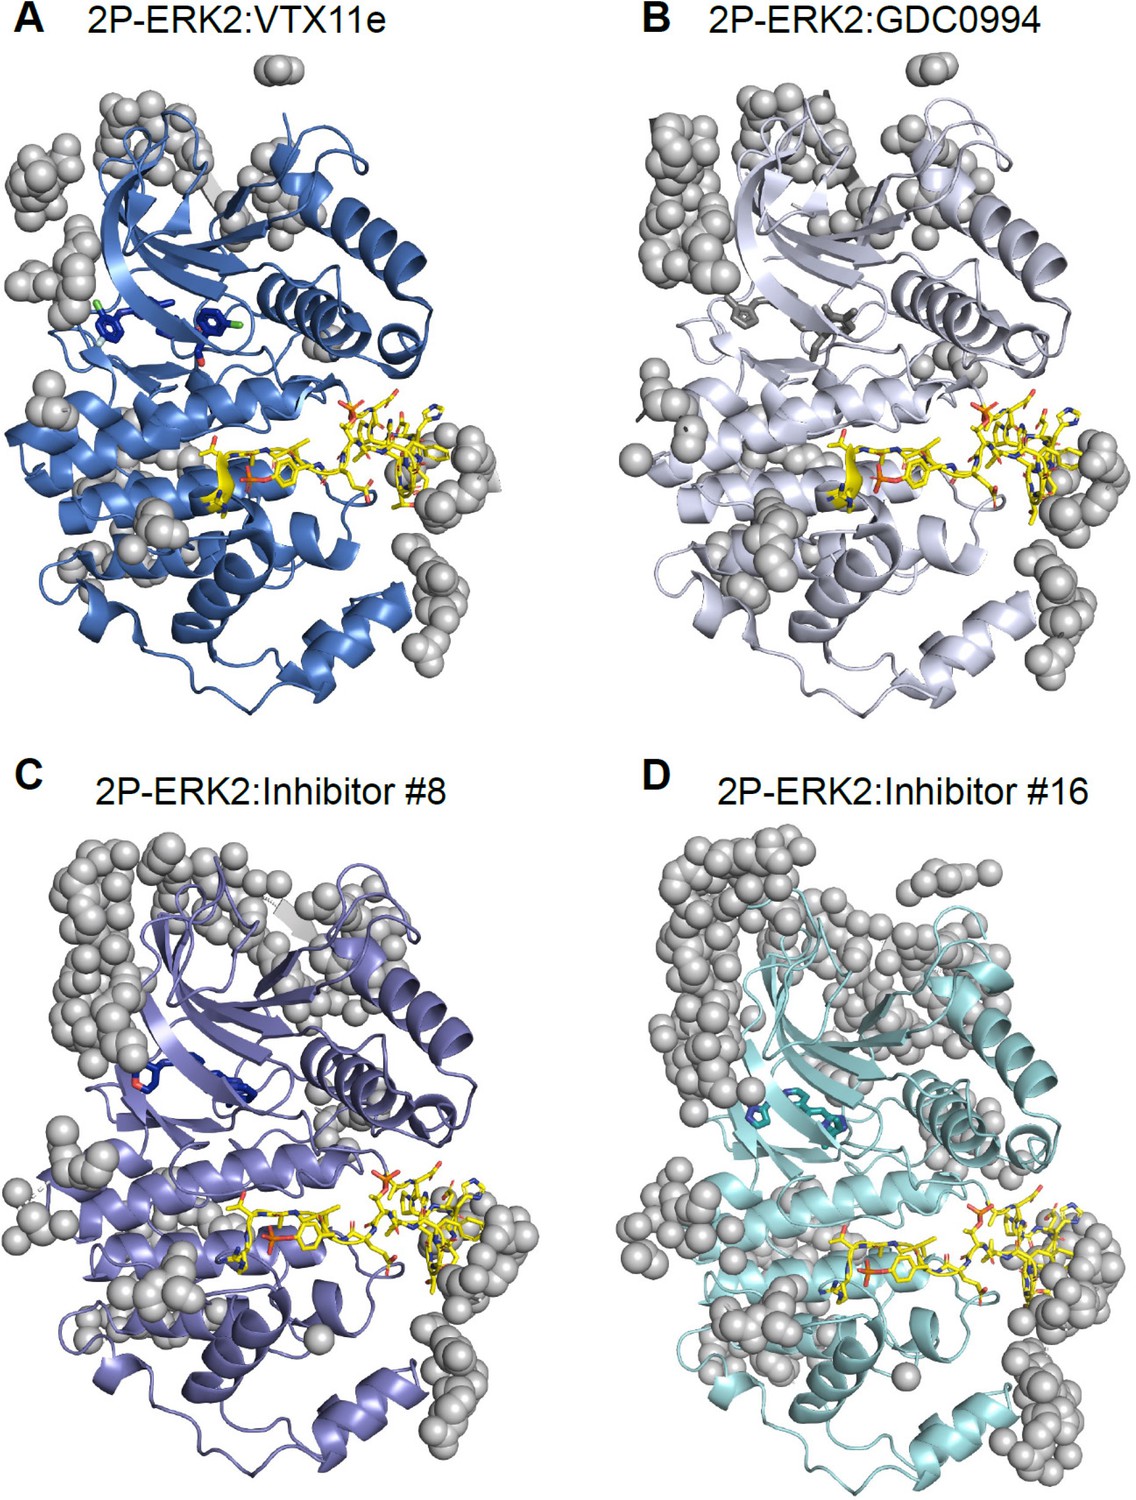
Crystal contacts with the activation loop in X-ray structures of extracellular signal-regulated kinase-2 (ERK2).
Structures of (A) 2P-ERK2:VTX11e (PDBID:6OPK), (B) 2P-ERK2:GDC0994 (PDBID:6OPH), (C) 2P-ERK2:Inhibitor#8 (PDBID:8U8K), and (D) 2P-ERK2:Inhibitor#16 (PDBID:8U8J). The activation loop is rendered in yellow, and atoms to the asymmetric unit from protein neighbors within 5 Å are shown as gray spheres.
Tables
Author response table 1
SPR estimates of Kd for selected inhibitors ranged between 0.
03-3 nM. All HDX time courses involved prebinding of 20 µM inhibitor and 17 µM ERK2 for 30 min (predicted occupancy 99.9%), followed by deuteration time courses with 20 µM inhibitor and 1.7 µM ERK2. Estimated rates of dissociation were ~0.0003-0.007 s-1 and rates of binding were 20-100 s-1 for the inhibitors tested. Because the binding rates are faster than the intrinsic H-D exchange rate at pD 7 (~1 s-1), we expect ligands to rebind and form the enzyme:ligand complex faster than the free enzyme undergoes exchange. Therefore, HDX rates should mostly reflect deuteration of the inhibitor-bound enzyme for all inhibitors.
| 2P-ERK2 | 0P-ERK2 | |||||
|---|---|---|---|---|---|---|
| kon (M–1s –1) | koff (s –1) | kd (nM) | kon (M–1s –1) | koff (s –1) | kd (nM) | |
| Inh#13 | 4.9 E+06 | 7.4 E-03 | 1.5 | 0.83 E+06 | 2.5 E-03 | 3.0 |
| Inh#15 | 1.4 E+06 | 0.30 E-03 | 0.21 | 0.70 E+06 | 0.62 E-03 | 0.88 |
| Inh#6 | 3.2 E+06 | 0.67 E-03 | 0.31 | 1.60 E+06 | 3.0 E-03 | 1.9 |
Additional files
-
Supplementary file 1
Deuterium uptake time courses for all HDX-MS experiments.
- https://cdn.elifesciences.org/articles/91507/elife-91507-supp1-v1.xlsx
-
Supplementary file 2
NMR chemical shifts and perturbations by selected inhibitors.
- https://cdn.elifesciences.org/articles/91507/elife-91507-supp2-v1.xlsx
-
Supplementary file 3
X-ray data collection and refinement parameters.
- https://cdn.elifesciences.org/articles/91507/elife-91507-supp3-v1.docx
-
MDAR checklist
- https://cdn.elifesciences.org/articles/91507/elife-91507-mdarchecklist1-v1.pdf
Download links
A two-part list of links to download the article, or parts of the article, in various formats.
Downloads (link to download the article as PDF)
Open citations (links to open the citations from this article in various online reference manager services)
Cite this article (links to download the citations from this article in formats compatible with various reference manager tools)
Conformation selection by ATP-competitive inhibitors and allosteric communication in ERK2
eLife 12:RP91507.
https://doi.org/10.7554/eLife.91507.3


