Rapid translocation of NGR proteins driving polarization of PIN-activating D6 protein kinase during root gravitropism
- Institute of Science and Technology Austria, Austria
Figures
Figure 1 with 1 supplement
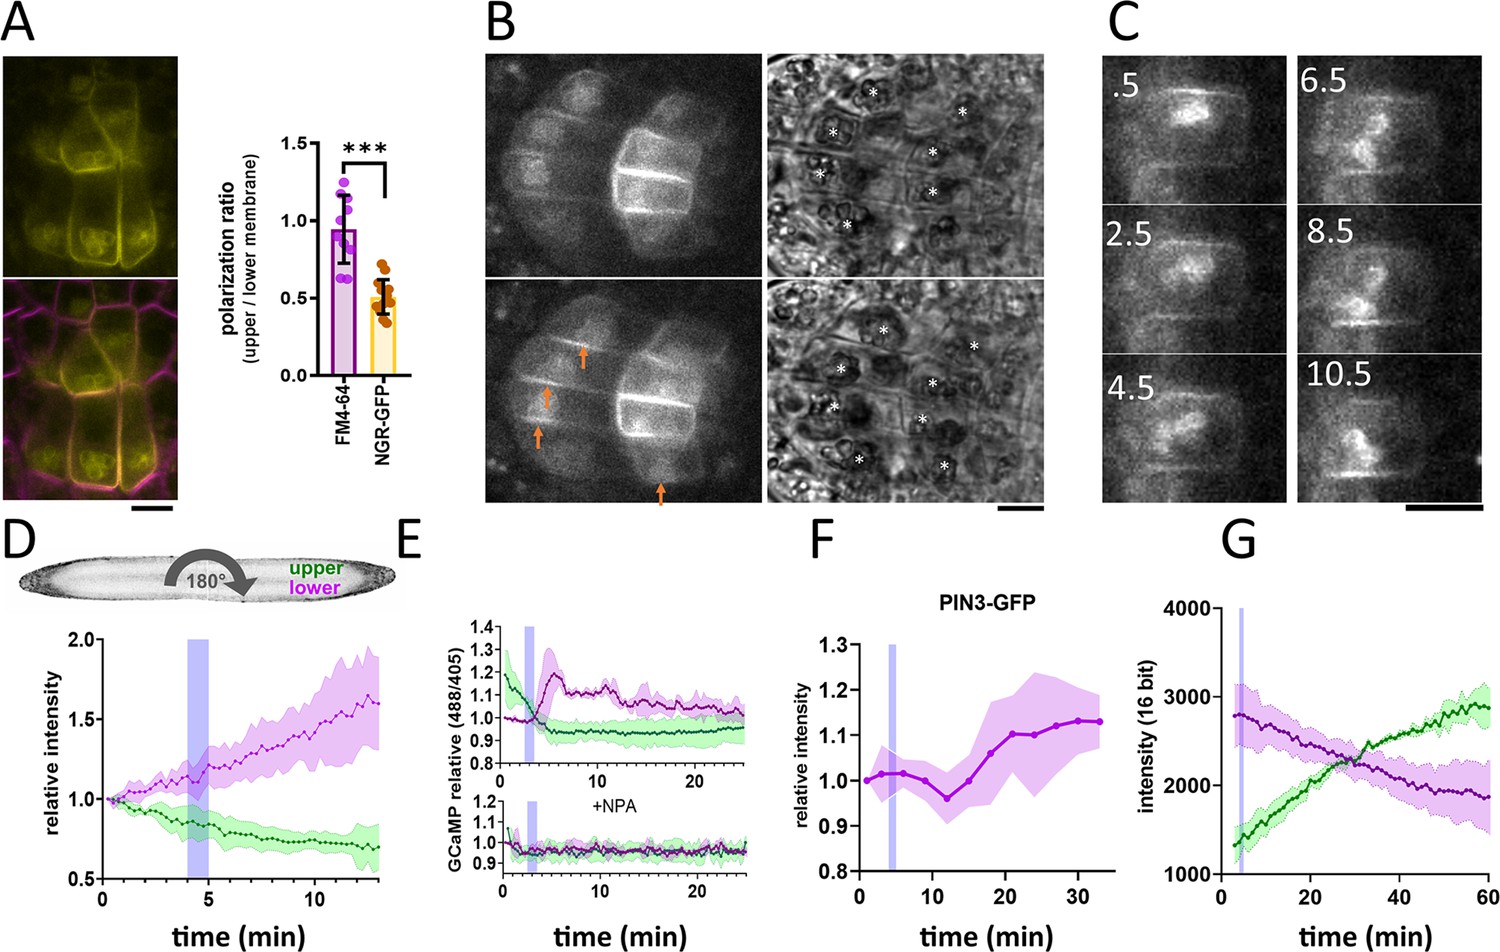
NGR1-GFP relocalization in the root columella.
(A) Colocalization of NGR1-GFP (yellow) with membrane stain FM4-64 (magenta). The statolith periphery is also decorated by the NGR1-GFP signal. NGR1-GFP is significantly polarized to the bottom area as quantified using upper/lower signal ratio (1=even distribution). (B) NGR1-GFP~30 s and 5 min after gravitropic bending. Orange arrows depict areas where the signal increased after contact with the statoliths. White stars in the transmission channel depict statoliths. (C) Time course of individual columella cell expressing NGR1-GFP. Numbers depict minutes from the 180° rotation. (D) Top: schematic depiction of the experiment design (valid for D-G). Bottom: Quantification of the NGR1-GFP signal at the lower and upper membranes. Similar setup was used for E. and F. Blue stripes in D-F represent intervals at which statoliths touched the bottom membrane. Average of five biological replicas. Shaded regions depict standard deviation (SD). (E) GCaMP signal after root gravitropic bending without (top) and with 20 µM NPA (bottom). The data represent three technical replicates, and three additional biological replicates were conducted, yielding similar results. Shaded regions depict SD.(F) PIN3 enrichment at the bottom of the central columella cells. The average is based on data from five biological replicas. Shaded regions depict SD.(G) DII Venus signal changes after root gravitropic bending. The average is calculated from three biological replicas. Shaded regions depict SD. Blue lines represent approximate time of statolith contact with the new bottom membrane. Bars = 10 µm.
-
Figure 1—source data 1
Data used for generating the graphs in the figure.
- https://cdn.elifesciences.org/articles/91523/elife-91523-fig1-data1-v1.xlsx
Figure 1—figure supplement 1
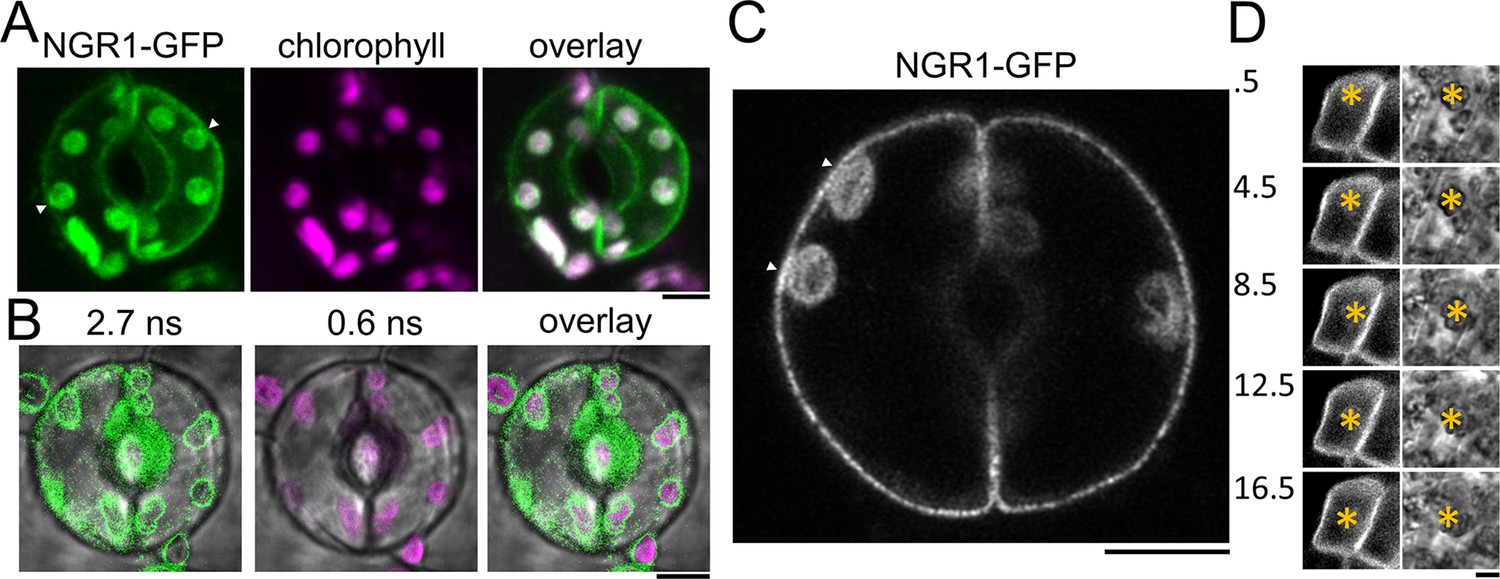
NGR1 localization in columella and guard cells.
(A) 35Sp::NGR1-GFP colocalization with chloroplasts in guard cells. Contact sites with PM are depicted by white arrowheads. (B) 35Sp::NGR1-GFP colocalization with chloroplasts in guard cells performed by fluorescence lifetime imaging to separate chlorophyll autofluorescence from GFP. (C) 35Sp::NGR1-GFP in guard cells imaged using airyscan superresolution. White arrowheads point to areas of contact with the PM. (D) NGR1p::NGR1-GFP localization in the columella cell rotated from vertical position upside down (180°). Numbers indicate minutes after rotation. Bars = 5 µm.
-
Figure 1—figure supplement 1—source data 1
Data used for generating the graphs in the figure.
- https://cdn.elifesciences.org/articles/91523/elife-91523-fig1-figsupp1-data1-v1.xlsx
Figure 2 with 1 supplement
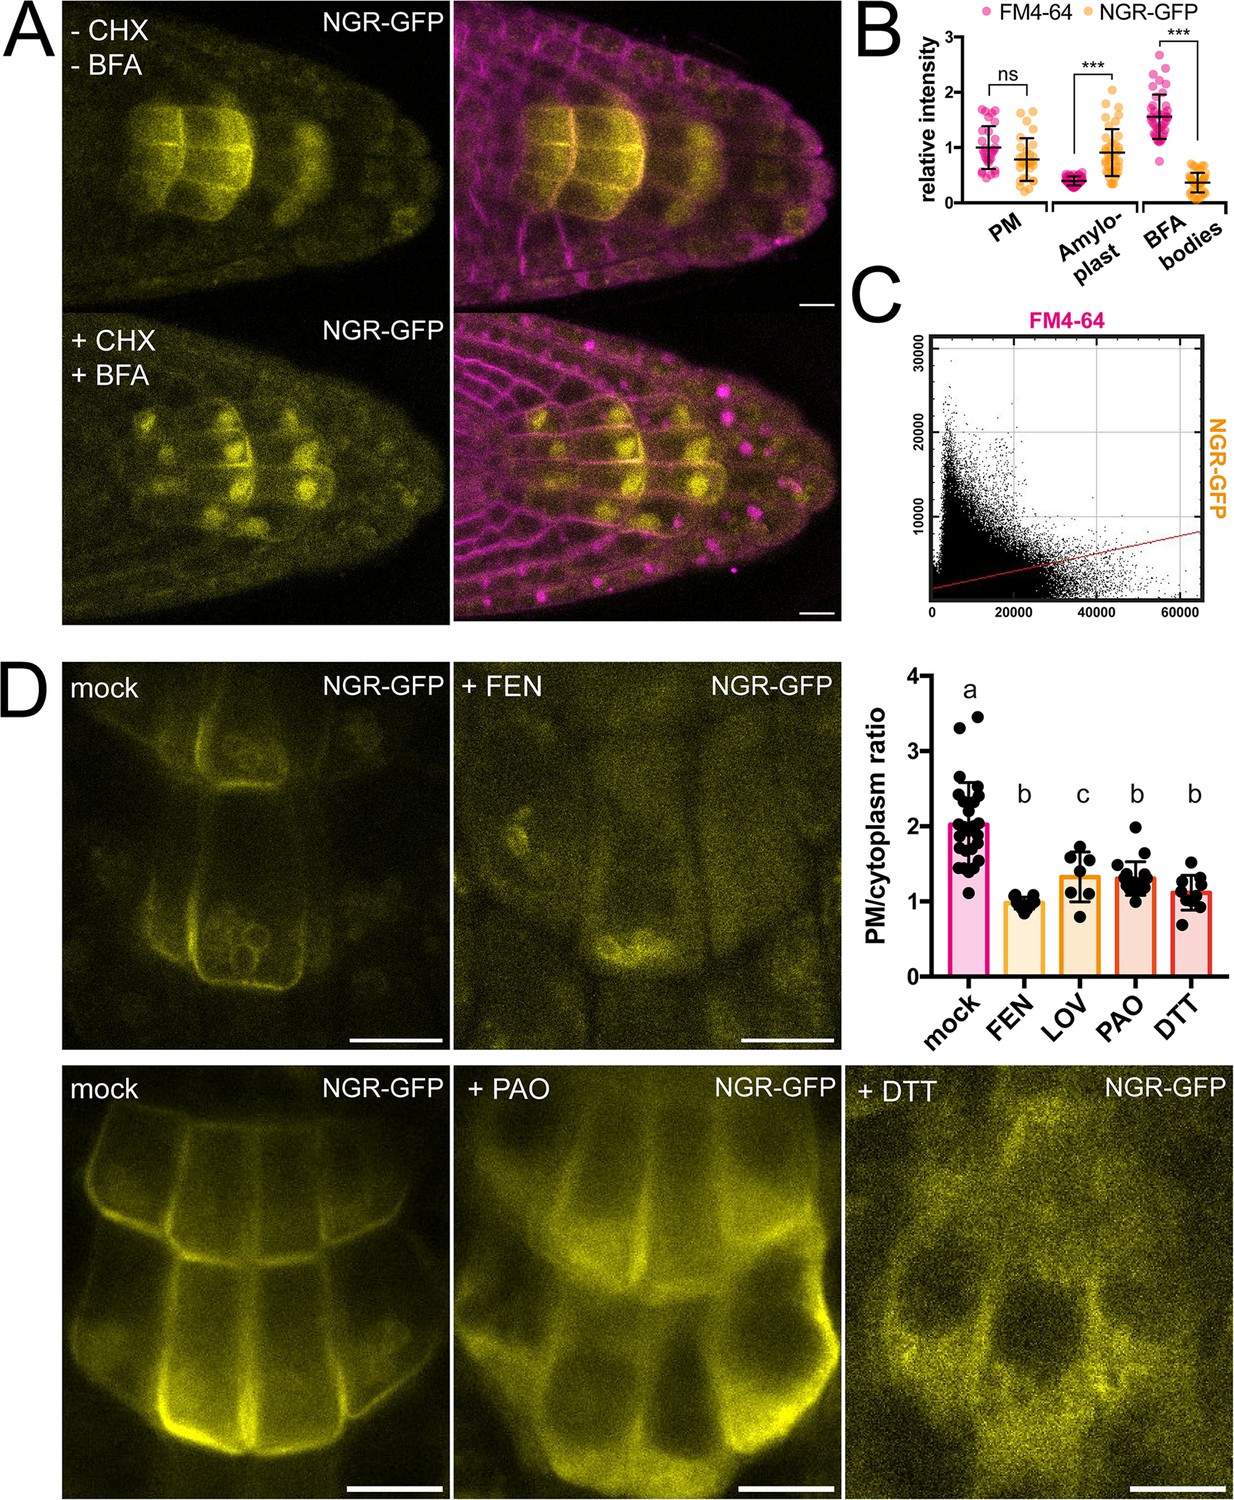
Role of trafficking and PM composition in NGR1 localization.
(A) Representative images of NGR1p::NGR1-GFP roots treated with 50 µM CHX, 50 µM BFA, and 2 µM FM4-64; mock: DMSO; NGR1-GFP in yellow, FM4-64 in magenta. Three biological replicas were made with similar results. Error bars represent SD. (B) Fluorescence intensity of FM4-64 and NGR1-GFP at the PM (n=29), amyloplasts (n=39) and BFA bodies (n=42) normalized to the average fluorescence intensity of FM4-64 at the PM. Data is pooled from columella cells of the representative experiment shown in A. n equals measured points. Statistical measurements were done with one-way ANOVA; *** equals adj. p-value of <0.0001. (C) Cytofluorogram of colocalization of FM4-64 and NGR1-GFP from the A using Pearson’s coefficient. (D) NGR1p::NGR1-GFP roots treated with FEN, PAO, and DTT. PM/cytoplasm ratio was calculated for mock (n=26), FEN (n=11), LOV (n=7), PAO (n=18), and DTT (n=10) treated seedlings. n equals the number of cells evaluated. Using one-way ANOVA, b is significantly different from a with an adj. p-value of <0.0001, c is significantly different from a with an adj. p-value of 0.006. Bars = 10 µm.
-
Figure 2—source data 1
Data used for generating the graphs in the figure.
- https://cdn.elifesciences.org/articles/91523/elife-91523-fig2-data1-v1.xlsx
Figure 2—figure supplement 1
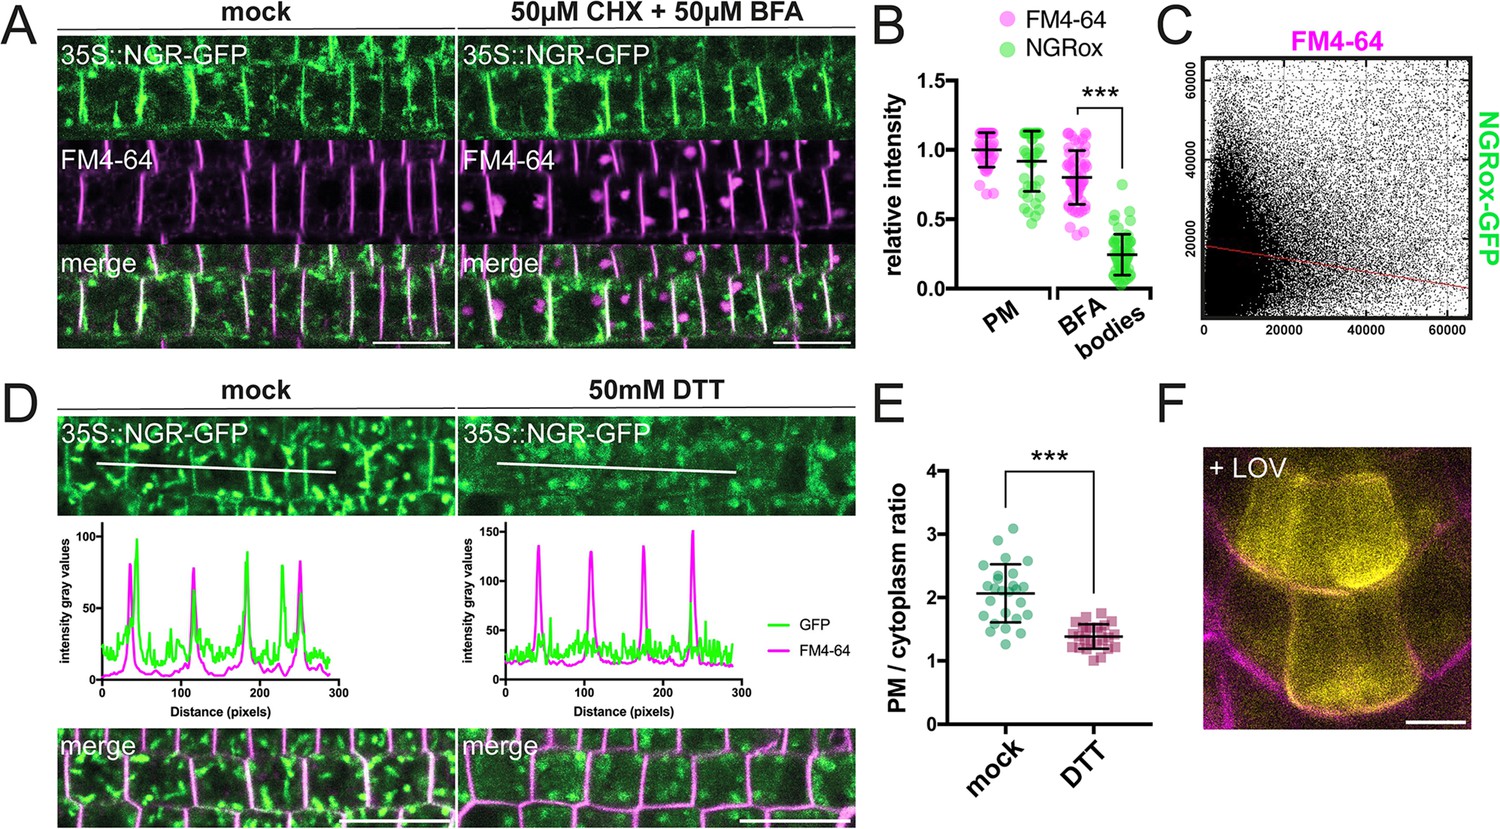
Pharmacological treatments of 35Sp::NGR1-GFP seedlings.
(A) Representative images of BFA treated 35Sp::NGR1-GFP seedlings: pretreatment with 50 µM CHX, followed by treatment with 50 µM BFA for 90 min and 2 µM FM4-64 for 10 min. mock: DMSO. Three additional biological replicas were made with similar results. Bars = 20 µm (B) BFA treatment of 35Sp::NGR1-GFP seedlings: fluorescence intensity of FM4-64 and 35Sp::NGR1-GFP at PM (n=40) and BFA bodies (n=54) normalized to average intensity of FM4-64 at the PM (=1); statistical analysis with one-way ANOVA: *** equals p-value <0.0001 (C) Cytofluorogram of JACoP colocalization analysis; intensity of pixels of FM4-64 on x-axis and 35Sp::NGR1-GFP on y-axis. Data is derived from the experiment shown in Figure 2—figure supplement 1. (D) 50 mM DTT treatment of 35Sp::NGR1-GFP plants for 3 hr followed by 10 min co-treatment with 2 µM FM4-64; intensity profile measured along white line. Three additional biological replicas were made with similar results. Bars = 20 µm (E) PM/cytoplasm signal ratio for untreated (n=26) and 50 mM DTT treated (n=25) 35Sp::NGR1-GFP seedlings; n represents number of cells evaluated. Statistical analysis with unpaired t-test; *** equals p-value <0.0001 (F) Representative image of 1 µM LOV treated NGR1p::NGR1-GFP seedlings; NGR1p::NGR1-GFP in yellow, FM4-64 in magenta. Bars = 10 µm.
-
Figure 2—figure supplement 1—source data 1
Data used for generating the graphs in the figure.
- https://cdn.elifesciences.org/articles/91523/elife-91523-fig2-figsupp1-data1-v1.xlsx
Figure 3 with 2 supplements
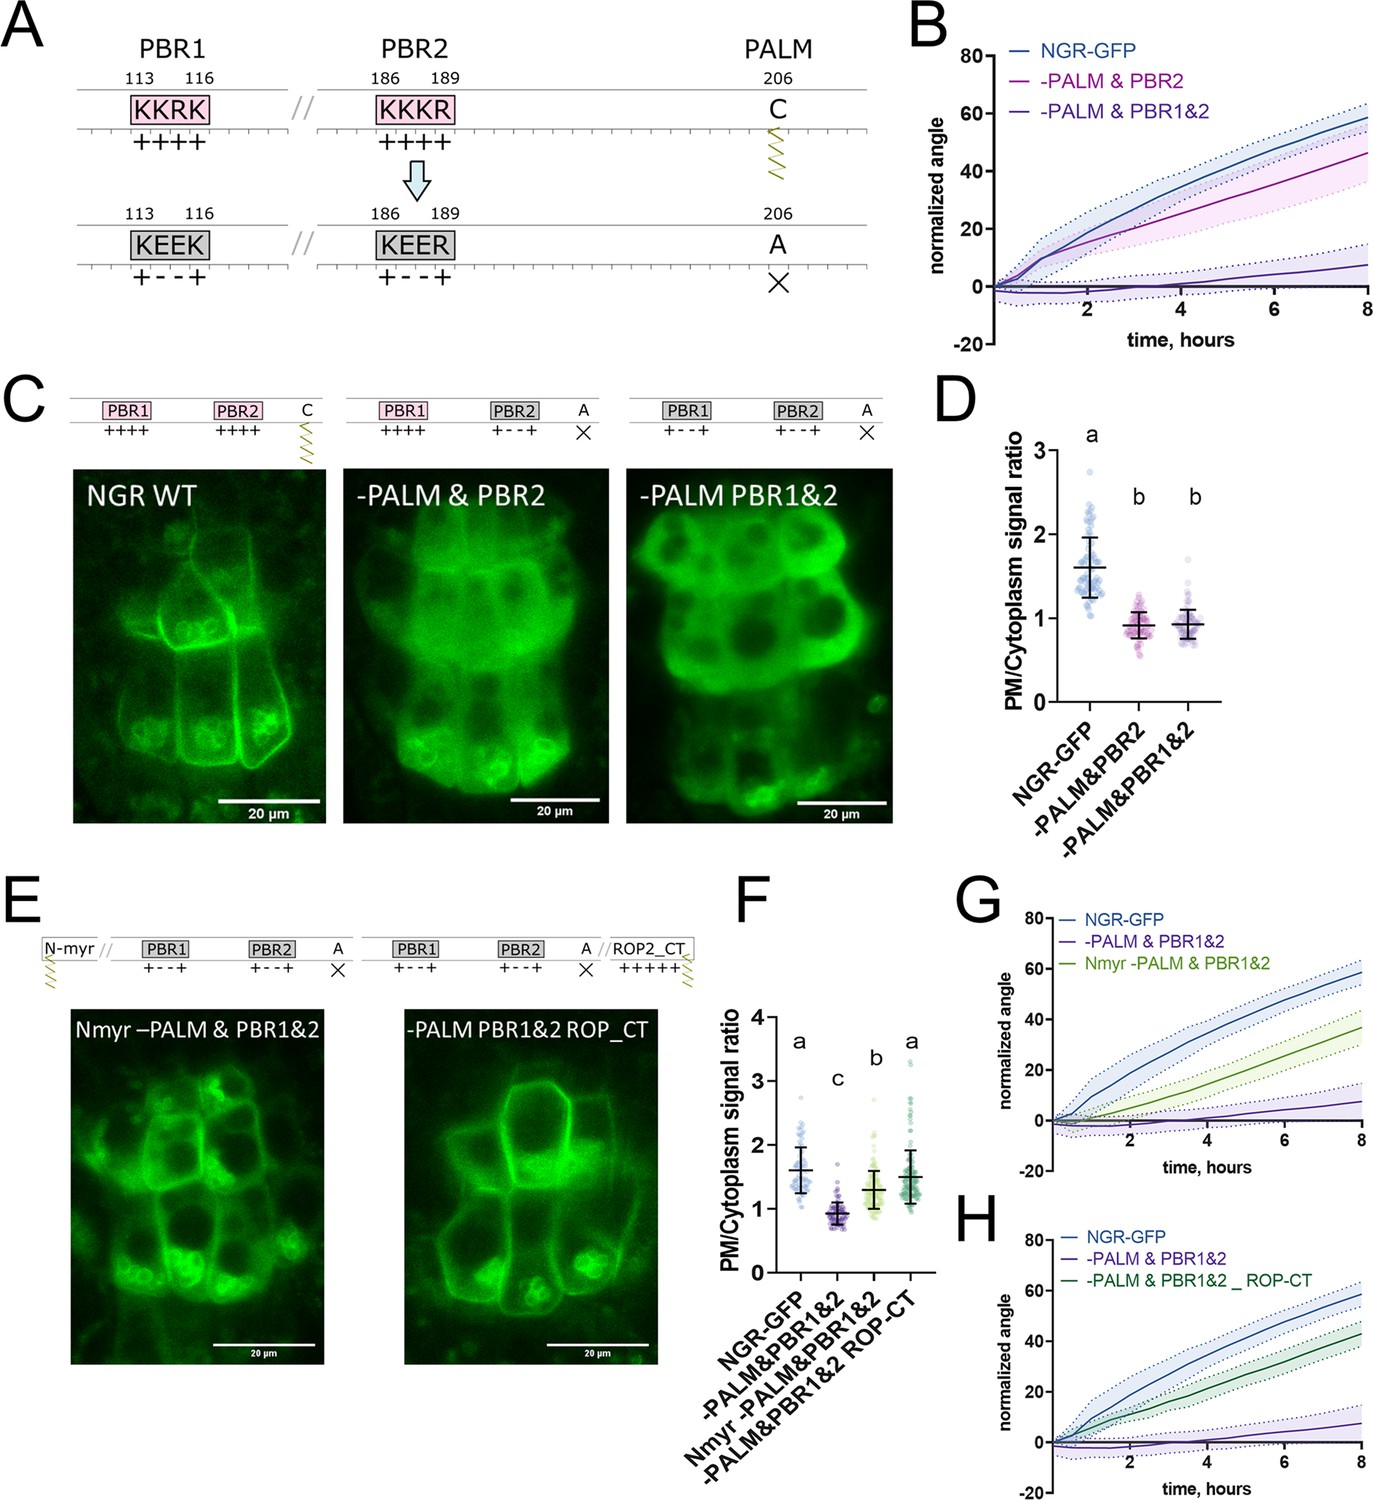
Polybasic regions and a palmitoylation site mediate NGR1 membrane localization.
(A) Scheme of mutagenesis. K114E&R115E (-PBR1), K187E&K188E (-PBR2), and C206A (-PALM) were introduced to disrupt NGR1 polybasic regions and palmitoylation site. Different combinations of mutations were tested. (B) Main root angle restoration upon reorientation in the vertical scanner setup of the ngr1/2/3 triple mutant complemented with NGR1p::NGR1-PALM&PBR2-GFP and NGR1p::NGR1-PALM&PBR1&2-GFP in comparison to NGR1p::NGR1WT-GFP, Col-0 and ngr1/2/3 triple mutant. (C) Representative confocal microscopy images of the root columella cells of NGR1p::NGR1-GFP, NGR1p::NGR1-PALM&PBR2-GFP, and NGR1p::NGR1-PALM&PBR1&2-GFP. (D) PM/cytoplasm signal ratio for NGR1p::NGR1-GFP, NGR1p::NGR1-PALM&PBR2-GFP, and NGR1p::NGR1-PALM&PBR1&2-GFP variants. Mutation in the polybasic region and palmitoylation site leads to the dissociation of NGR1 protein from the PM. For statistical analysis one-way ANOVA test was used, ‘a’ is significantly different from ‘b’ with a p-value <0.0001. The difference between the PM/Cytoplasm signal ratio of NGR1p::NGR1-PALM&PBR2-GFP and NGR1p::NGR1-PALM&PBR1&2-GFP is not statistically significant. (E) Representative pictures of the root columella cells of NGR1Nmyr -PALM&PBR1&2-GFP and NGR1-PALM&PBR1&2 ROP-CT-GFP. Membrane localization of NGR1-PALM&PBR1&2-GFP is restored upon the addition of LZY1 N-terminal myristoylation site (left) or C-terminal region of ROP2 bearing polybasic region and geranyl-geranylation site (right). (F) PM/cytoplasm ratio quantified for the versions with another acylation site. Different letters designate the statistically significant difference with p<0.0001 in a one-way ANOVA test. For each genotype >35 cells were quantified. (G) Rescued main root angle restoration upon reorientation in the vertical scanner setup of the NGR1p::NGR1Nmyr -PALM&PBR1&2-GFP in ngr1/2/3 line, after the addition of LZY1 N-myristoylation site to the NGR1 version with mutated polybasic regions and palmitoylation site. (H) Rescued gravitropic response of the NGR1p::NGR1-PALM&PBR1&2 ROP-CT-GFP in ngr1/2/3, with the addition of the C-terminus of the ROP2 after the GFP tag. For all the mutant variants more than five separate transgenic lines were observed with similar results. 8–15 roots were quantified for each gravitropic bending experiment. Shaded regions depict SD.
-
Figure 3—source data 1
Data used for generating the graphs in the figure.
- https://cdn.elifesciences.org/articles/91523/elife-91523-fig3-data1-v1.xlsx
Figure 3—figure supplement 1
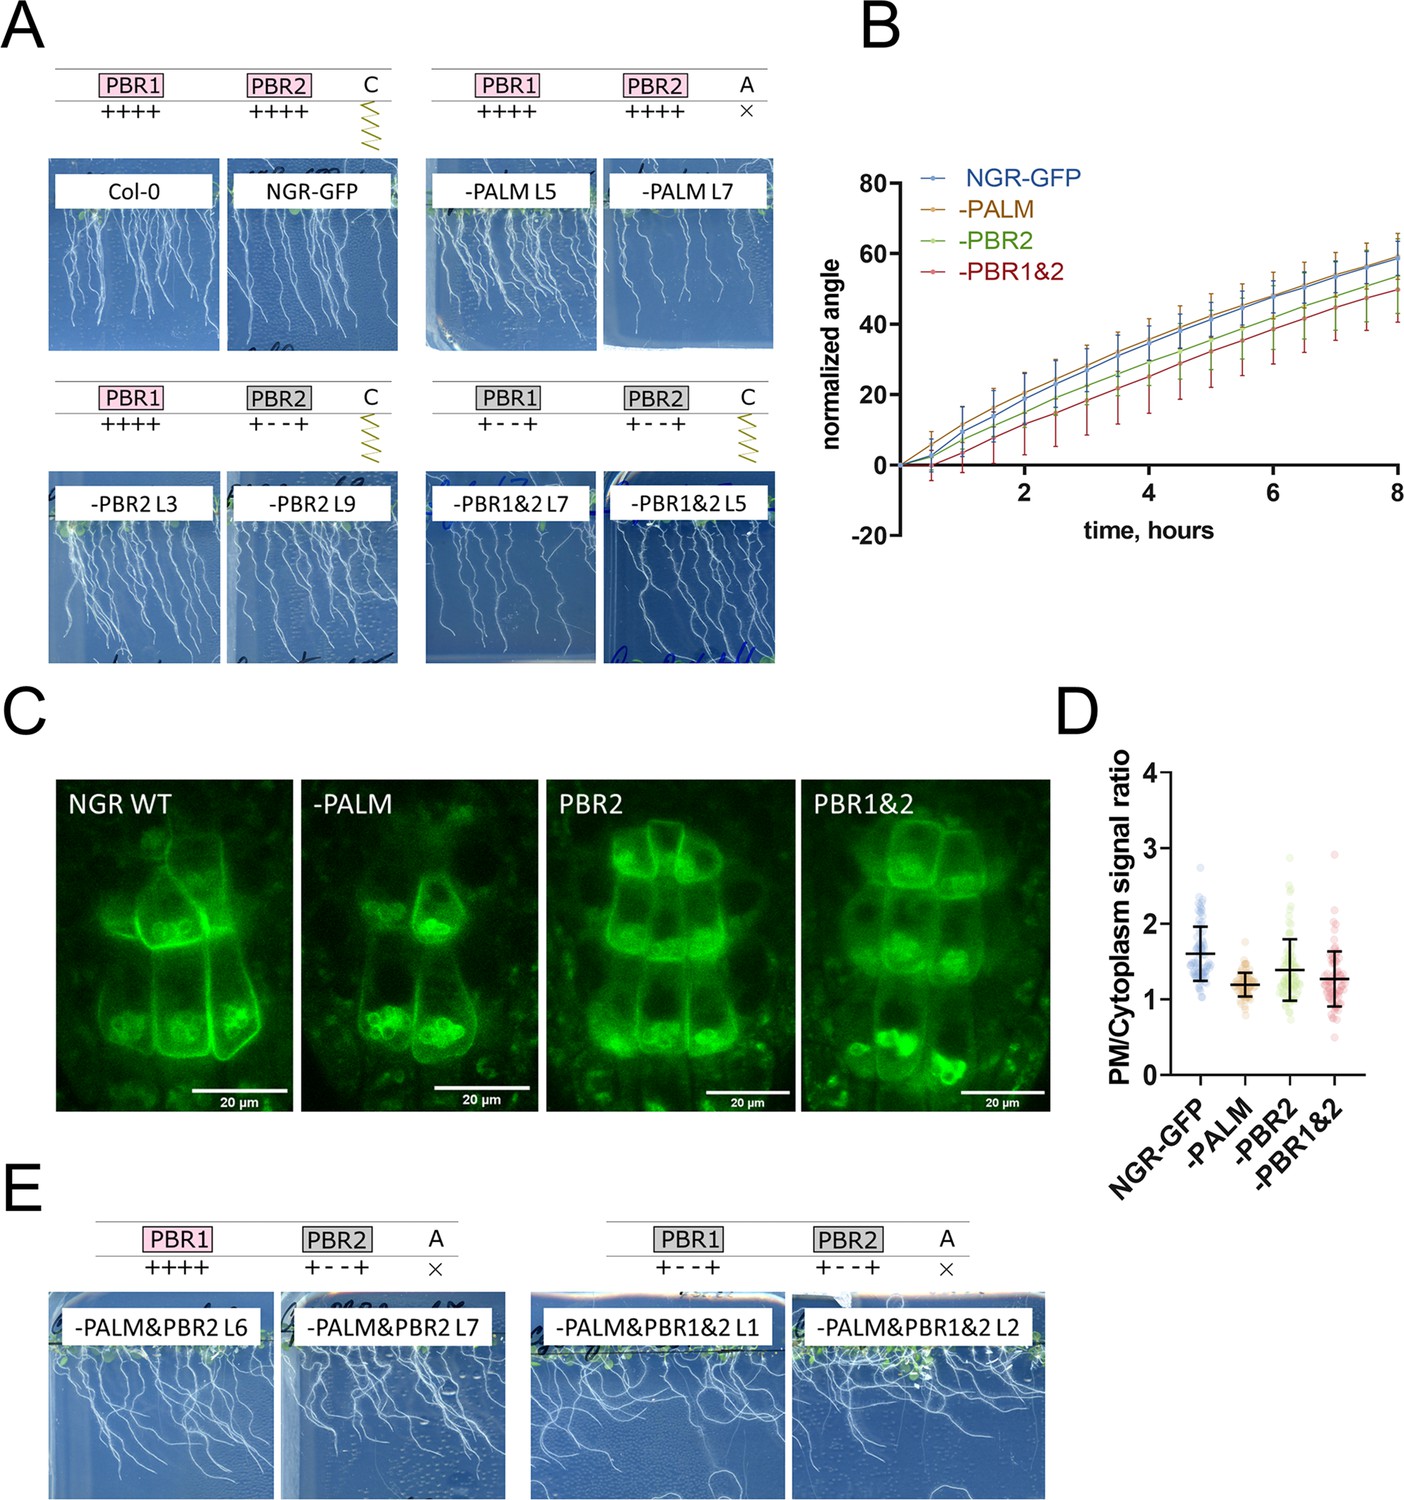
Mutations only in PALM site or PBRs are insufficient to disrupt NGR1 function and localization.
(A) Phenotypes of the 5 d.o. seedlings of ngr1/2/3 complemented with NGR1p::NGR1-GFP, NGR1p::NGR1-PALM-GFP, NGR1p::NGR1-PBR2-GFP, NGR1p::NGR1-PBR1&2-GFP. (B) Restoration of the main root angle upon reorientation in the vertical scanner setup. (C) Representative pictures of the root columella cells expressing different versions of NGR1p::NGR1mut-GFP. (D) Quantification of the PM/cytoplasm ratio for NGR1p::NGR1mut-GFP variants. More than 44 cells per genotype were quantified. (E) Phenotypes of the 5 d.o. seedlings of the NGR1p::NGR1-PALM&PBR2-GFP in ngr1/2/3 and NGR1p::NGR1-PALM&PBR1&2-GFP in ngr1/2/3.
-
Figure 3—figure supplement 1—source data 1
Data used for generating the graphs in the figure.
- https://cdn.elifesciences.org/articles/91523/elife-91523-fig3-figsupp1-data1-v1.xlsx
Figure 3—figure supplement 2
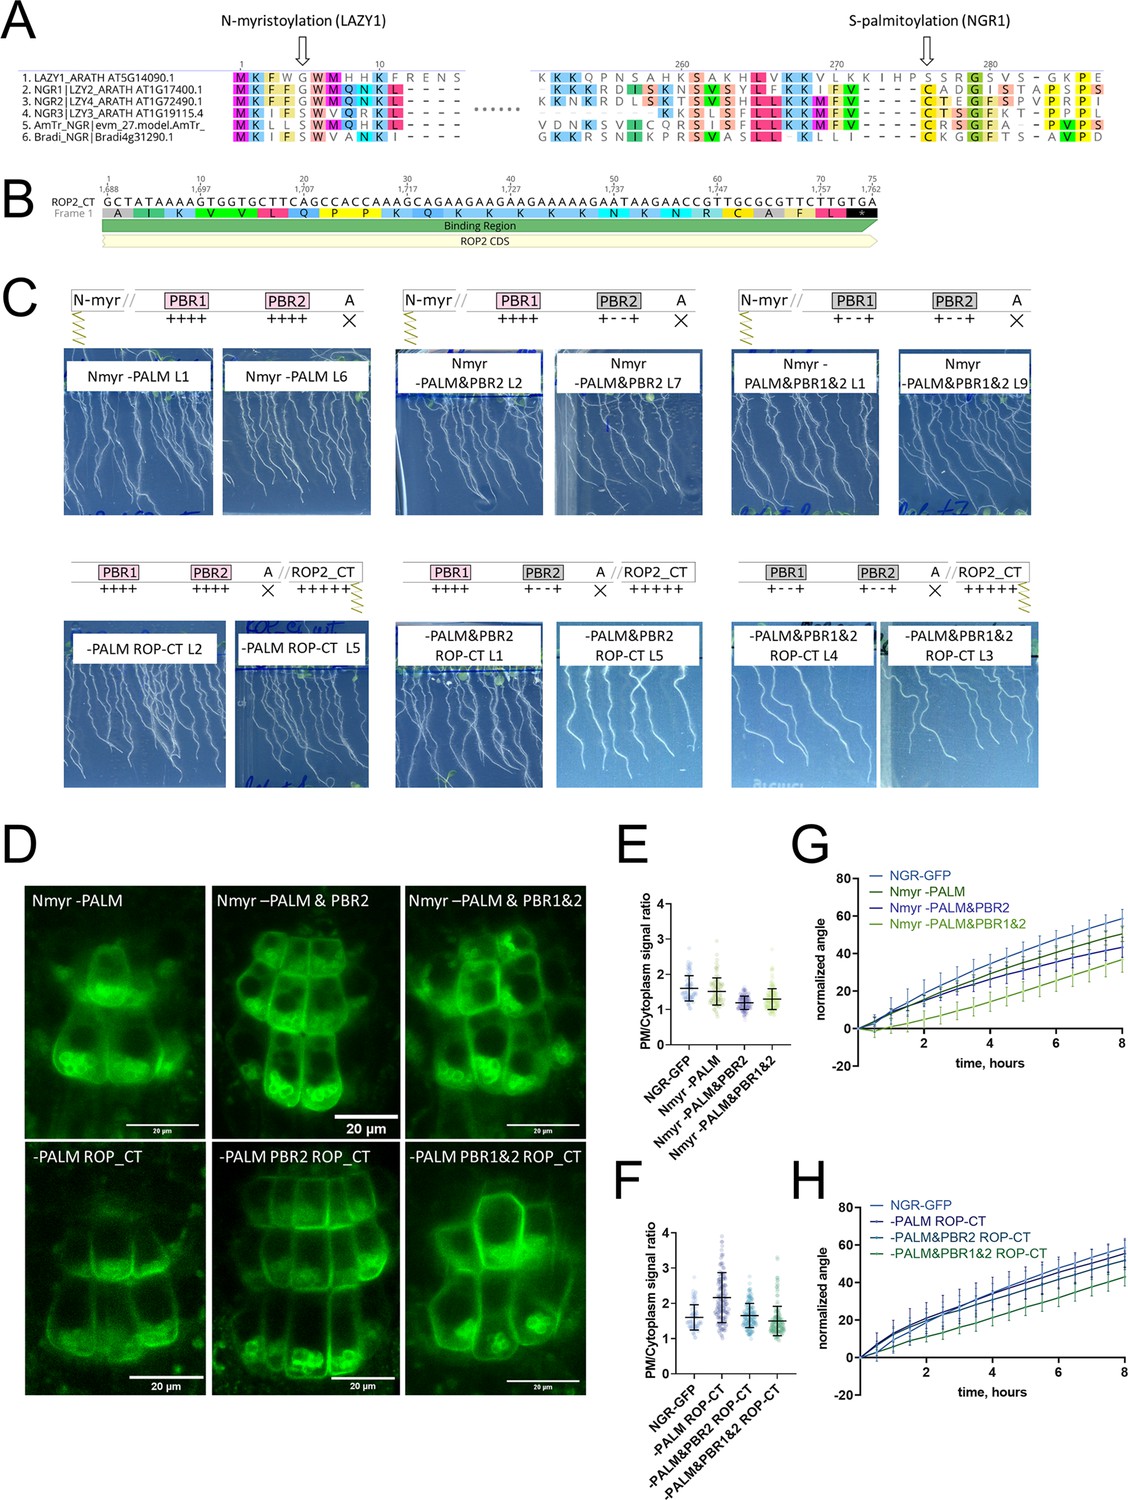
Recovery of NGR1mut-GFP function and localization upon addition of another acylation site.
(A) Alignment of NGR/LZY homologs. LZY1 has the unique N-terminal myristoylation motif. Palmitoylated Cys conserved in other NGRs is not present in LZY1. (B) The sequence of the ROP2 C-terminus with a polybasic region and geranyl-geranylation site. (C) Phenotypes of the plants. ngr1/2/3 complemented with different versions of NGR1p::NGR1mut-GFP with additional LZY1 N-myristoylation site (upper row) or ROP2 C-terminus under native NGR1 promoter (lower row). (D) Representative pictures of the root columella cells expressing different versions of NGR1p::NGR1mut-GFP with additional LZY1 N-myristoylation site (upper row) or ROP2 C-terminus (lower row). (E) Quantification of the PM/Cyt ratio for NGR1p::NGR1Nmyr-mut-GFP variants. More than 44 cells per genotype were quantified. (F) Quantification of the PM/Cyt ratio for NGR1p::NGR1mut ROP-CT-GFP variants. More than 44 cells per genotype were quantified. (G) Gravitropic response of the NGR1p::NGR1Nmyr-mut-GFP in ngr1/2/3 variants with added N-myristoylation site. The restoration of the main root angle upon reorientation in the vertical scanner setup. (H) Gravitropic response in the vertical scanner setup of ngr1/2/3 complemented with the NGR1p::NGR1mut ROP-CT-GFP variants with added ROP2 C-terminus. For all the mutant variants, more than five separate transgenic lines were observed with similar results. Eight to 15 roots were quantified for each gravitropic bending experiment. Error bars depict SD.
-
Figure 3—figure supplement 2—source data 1
Data used for generating the graphs in the figure.
- https://cdn.elifesciences.org/articles/91523/elife-91523-fig3-figsupp2-data1-v1.xlsx
Figure 4
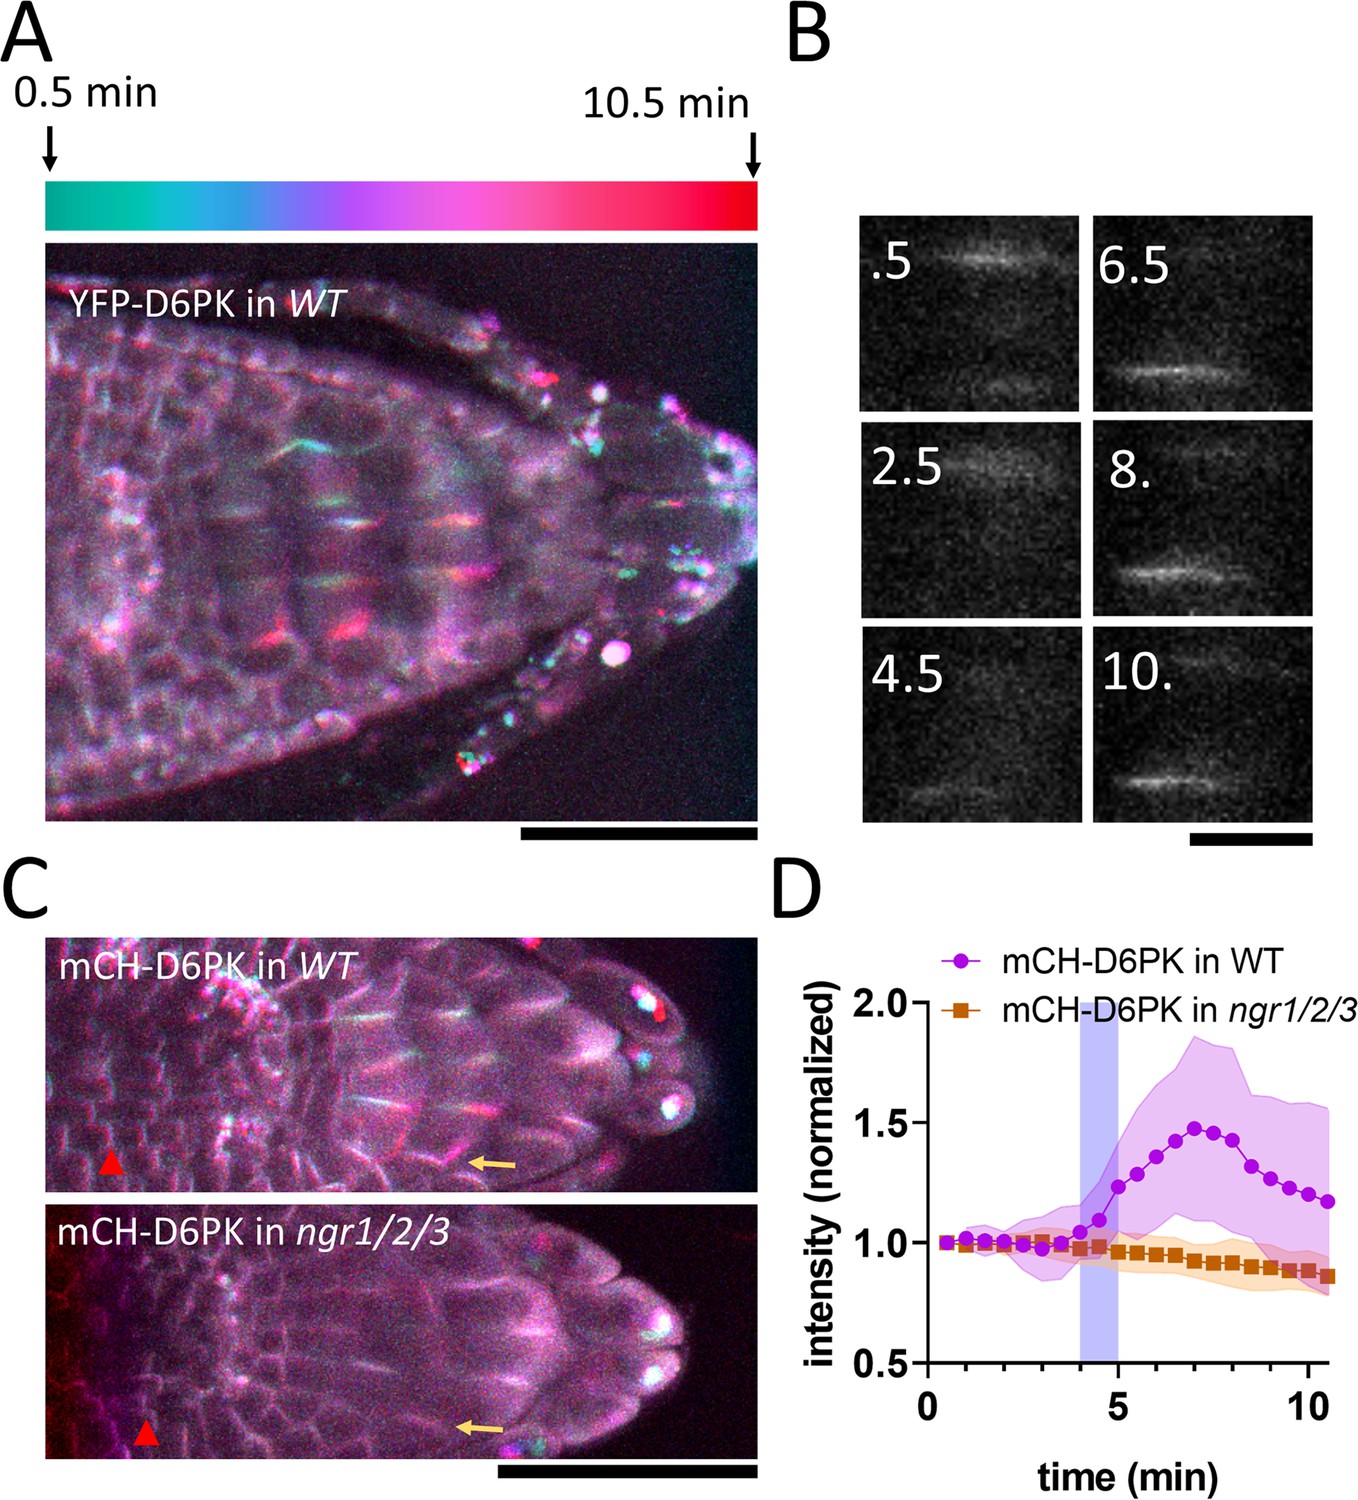
NGR-dependent D6 protein kinase translocation.
(A) Temporal color-coded image of YFP-D6PK translocation induced by 180° rotation. (B) Single gravistimulated (180°) columella cell undergoing YFP-D6PK translocation. White numbers indicate time after rotation (min). (C) mCH-D6PK 10 min after gravistimulation in WT and ngr1/2/3 triple mutant, same temporal color code as in A. Yellow arrow depicts the new bottom membrane. Red arrowhead depicts meristematic cells, which displayed basal D6PK polarity in both genotypes. (D) Quantification of D6PK signal at the columella cell bottom PM upon 180° rotation. Blue strip depicts approximate time of statolith contact with the bottom PM. Bars = 50 µm (A,C) 10 µm (B). Ten cells out of three roots were quantified. Experiment was replicated three times with similar results. Shaded regions depict SD.
-
Figure 4—source data 1
Data used for generating the graphs in the figure.
- https://cdn.elifesciences.org/articles/91523/elife-91523-fig4-data1-v1.xlsx
Videos
Video 1
NGR-GFP protein localizes in the vicinity of statoliths during the course of root gravitropic bending.
Video 2
mCHERRY-D6PK in WT and ngr1/2/3 mutant upon gravitropic stimulus.
Video 3
Summary of the timing of gravitropic bending for YFP-D6PK, PIN3, calcium transients, and DII-Venus responses during a series of 180° flips.
Additional files
Download links
A two-part list of links to download the article, or parts of the article, in various formats.
Downloads (link to download the article as PDF)
Open citations (links to open the citations from this article in various online reference manager services)
Cite this article (links to download the citations from this article in formats compatible with various reference manager tools)
Rapid translocation of NGR proteins driving polarization of PIN-activating D6 protein kinase during root gravitropism
eLife 12:RP91523.
https://doi.org/10.7554/eLife.91523.3


