Structural and biophysical analysis of a Haemophilus influenzae tripartite ATP-independent periplasmic (TRAP) transporter
- Biomolecular Interaction Centre, Maurice Wilkins Centre for Biodiscovery, MacDiarmid Institute for Advanced Materials and Nanotechnology, and School of Biological Sciences, University of Canterbury, New Zealand
- Department of Biochemistry and Biophysics, Stockholm University, Sweden
- Department DiBEST (Biologia, Ecologia, Scienze della Terra) Unit of Biochemistry and Molecular Biotechnology, University of Calabria, Italy
- Biological Sciences and Biomedical Engineering, Bindley Bioscience Center, Purdue University West Lafayette, United States
- Department of Chemistry and Molecular Biology, Biochemistry and Structural Biology, University of Gothenburg, Sweden
- Centre for Antibiotic Resistance Research (CARe) at University of Gothenburg, Sweden
- Biomolecular Interaction Centre, Digital Life Institute, Maurice Wilkins Centre for Molecular Biodiscovery, and School of Biological Sciences, University of Auckland, New Zealand
- Biochemistry Department, School of Biomedical Sciences, University of Otago, New Zealand
- ARC Centre for Cryo-electron Microscopy of Membrane Proteins, Bio Molecular Science and Biotechnology Institute, Department of Biochemistry and Pharmacology, University of Melbourne, Australia
- Department of Chemistry and Biochemistry, University of Montana, United States
- Department of Chemistry and Biochemistry, University of Lethbridge, Canada
- Biological Sciences Division, SLAC National Accelerator Laboratory, United States
- Department of Structural Biology, Stanford University School of Medicine, United States
- CNR Institute of Biomembranes, Bioenergetics and Molecular Biotechnologies (IBIOM), Italy
- School of Medical Sciences, Faculty of Medicine and Health, University of Sydney, Australia
Figures
Figure 1
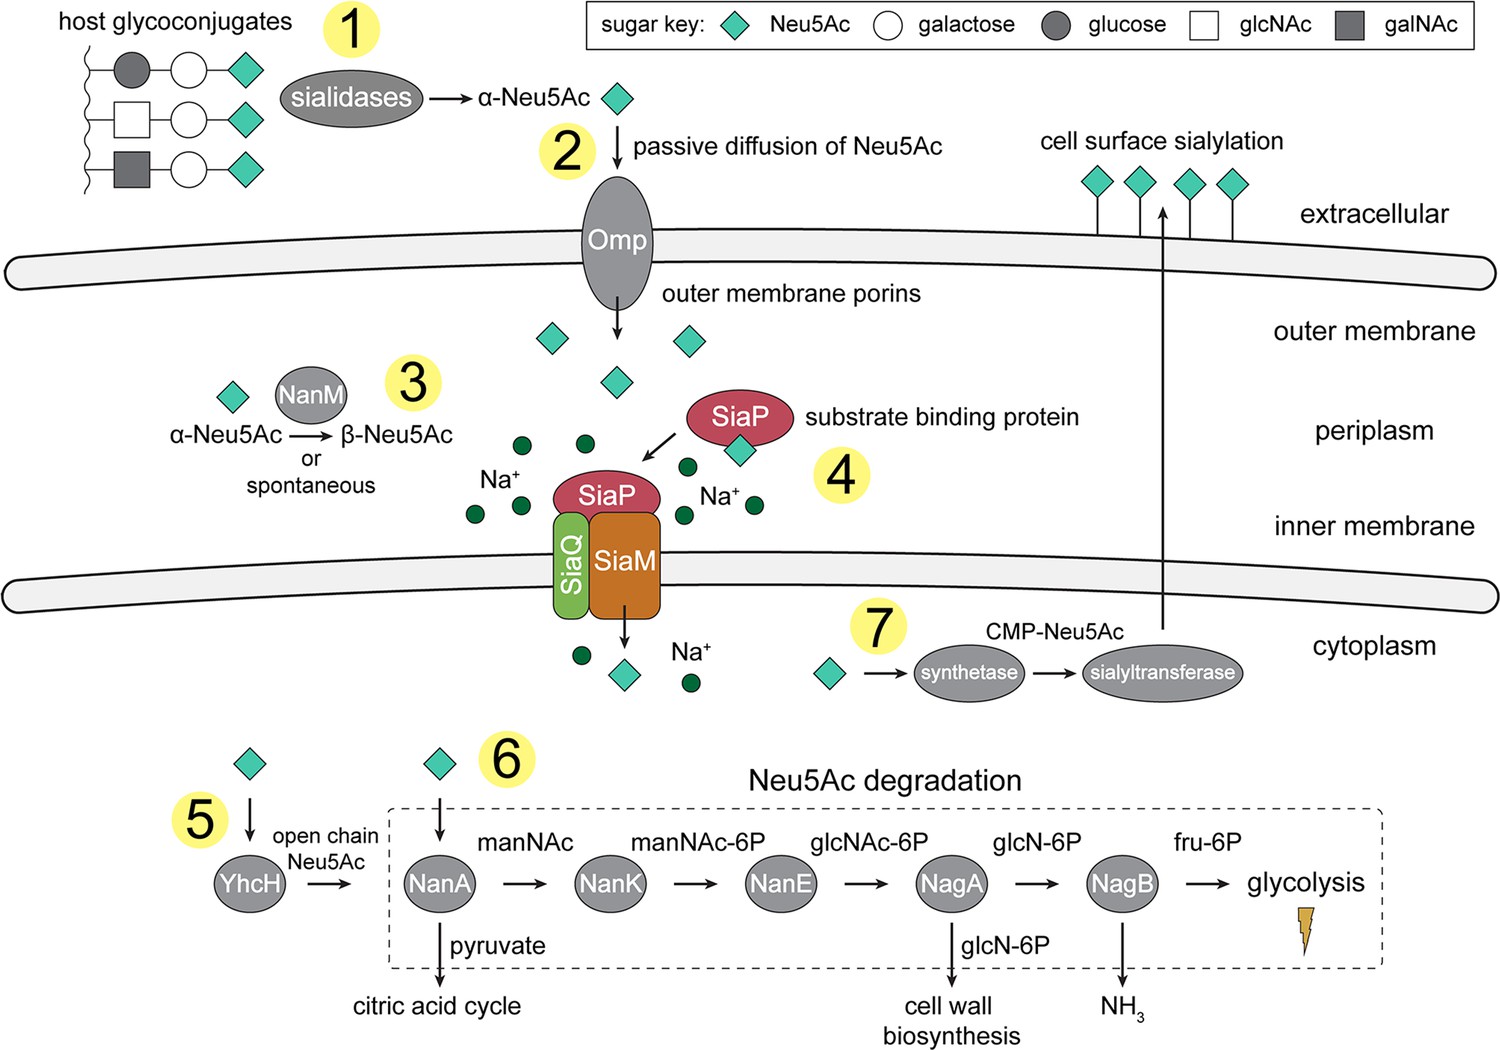
An overview of Neu5Ac metabolism in H. influenzae.
(1) H. influenzae is sialidase negative and relies on environmental sialidases to hydrolyse and release terminal Neu5Ac from human glycoconjugates. (2) Outer membrane porins facilitate diffusion of Neu5Ac into the periplasm. (3) A mutarotase, NanM, catalyses the formation of β-Neu5Ac from α-Neu5Ac to prepare for active transport across the inner membrane. (4) Neu5Ac is captured by the high-affinity substrate-binding protein, SiaP. SiaP delivers Neu5Ac to the SiaQM TRAP transporter, which uses a Na+ electrochemical gradient to drive transport. H. influenzae cannot synthesise Neu5Ac and relies solely on SiaPQM for obtaining environmental Neu5Ac. (5) Cytoplasmic processing of Neu5Ac by an anomerase, YhcH, generates the unfavourable open chain form in preparation for use by the first enzyme of the Neu5Ac degradation pathway, NanA. (6) Neu5Ac is sequentially degraded into cell wall constituents or fructose-6-phosphate, which can enter glycolysis. Five conserved enzymes (an aldolase, NanA; kinase, NanK; epimerase, NanE; deacetylase, NagA; and deaminase, NagB) are involved in this pathway which provides H. influenzae with carbon, nitrogen, and energy. (7) Alternatively, Neu5Ac can be activated by cytidine monophosphate and a sialic acid synthetase and added to lipooligosaccharides by a sialyltransferase. Neu5Ac, N-acetylneuraminate; manNAc, N-acetylmannosamine; manNAc-6P, N-acetylmannosamine-6-phosphate; glcNAc, N-acetylglucosamine; glcNAc-6P, N-acetylglucosamine-6-phosphate; glcN-6P, glucosamine-6-phosphate; fru-6P, fructose-6-phosphate; galNAc, N-acetylgalactosamine; CMP, cytidine monophosphate; Omp, outer membrane porin; NanM, Neu5Ac mutarotase; YhcH, Neu5Ac anomerase; NanA, Neu5Ac lyase; NanK, manNAc kinase; NanE, manNAc-6P epimerase; NagA, glcNAc-6P deacetylase; NagB, glcN-6P deaminase.
Figure 2 with 3 supplements
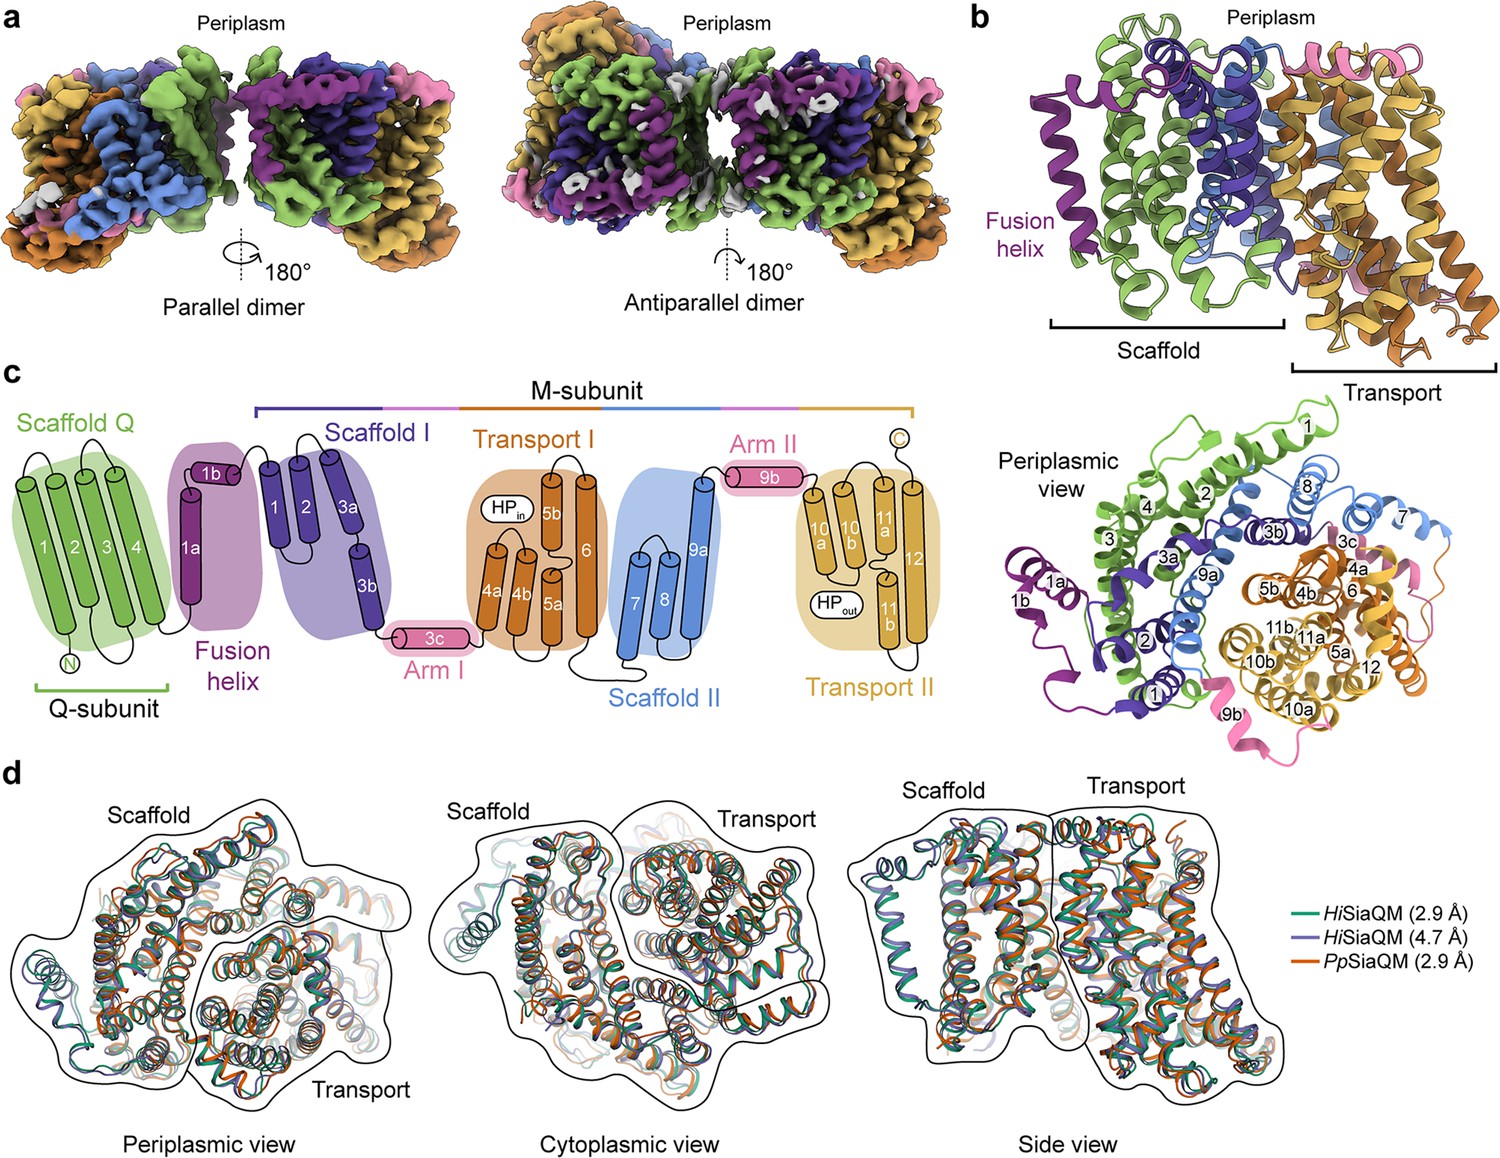
The structure of HiSiaQM.
(a) Coulomb maps for the parallel (3.36 Å) and antiparallel (2.99 Å) HiSiaQM homodimers. The periplasmic surfaces of the monomers are facing the same direction for the parallel dimer (PDB: 8THI), whereas the periplasmic surface of one monomer is rotated 180° for the antiparallel dimer (PDB: 8THJ). The transport domain (orange and gold) is in the ‘elevator down’ conformation in all four monomers. The dimeric interface in both maps is distanced and neither has significant protein–protein interactions. The maps are coloured according to the topology in (c). Density consistent with phospholipids is coloured grey and is particularly present in the dimer interface of the higher resolution antiparallel dimer map. (b) Structural model of the HiSiaQM monomer. The transport domain is in the ‘elevator down’ conformation with the substrate-binding site facing the cytoplasm. (c) The topology of HiSiaQM is the same as the non-fused PpSiaQM with the addition of the fusion helix. The M-subunit forms the transport domain (orange and gold) and bracing arm helices (pink) as well as a large portion of the scaffold (purple and blue). The Q-subunit is entirely used as a scaffold for the elevator transport mechanism. The fusion helix (purple) connects the scaffold and adds to its size. It also forms a short horizontal helix, similar to the arm helices of the M-subunit. (d) A structural overlay of HiSiaQM (2.9 Å structure, green; 4.7 Å structure, purple) and PpSiaQM (2.9 Å structure, orange) shows that the helices of the structures are well aligned, and all three structures are in the same conformation.
Figure 2—figure supplement 1
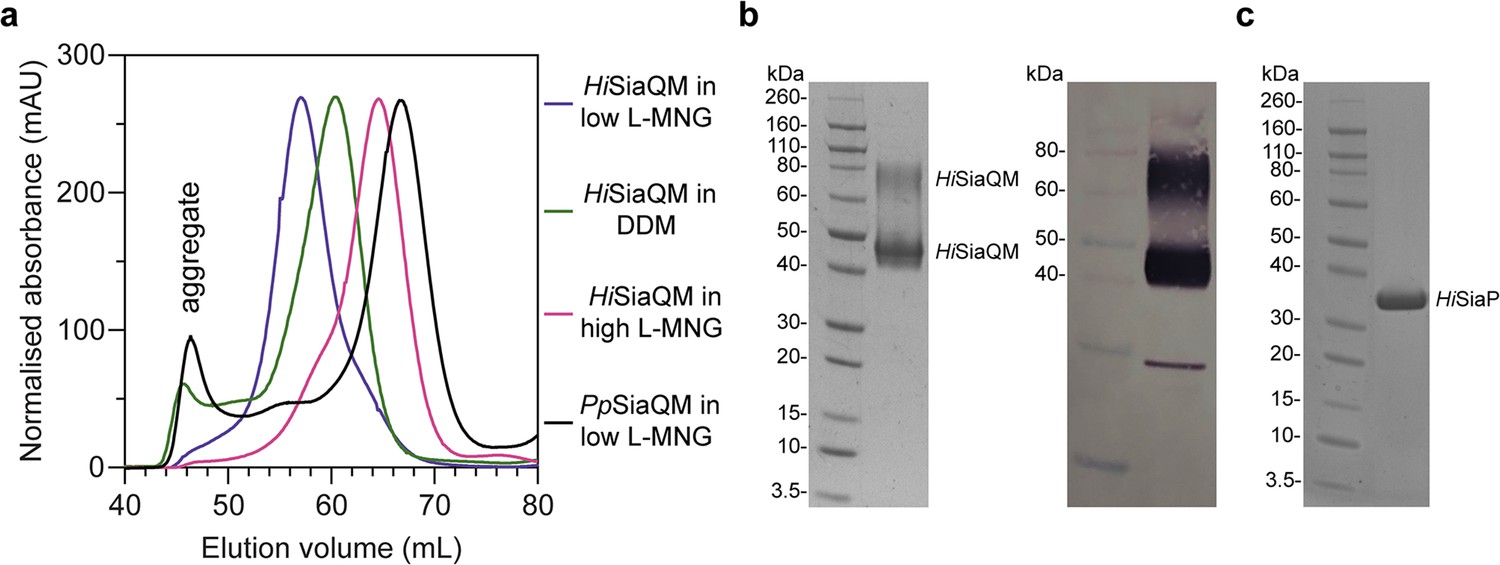
Size-exclusion chromatography traces of SiaQM transporters suggests that HiSiaQM exists as multiple species in detergent.
(a) HiSiaQM purified in dodecyl-β-d-maltoside (DDM) (green trace) results in significant aggregation at 45–50 mL, which is not apparent when solubilised in lauryl maltose neopentyl glycol (L-MNG) (blue and pink traces). HiSiaQM purified in a low concentration of L-MNG (blue trace) results in a higher order species with a peak at 57 mL compared to HiSiaQM purified in a high concentration of L-MNG (pink trace), which has a peak at 65 mL. At a similar protein concentration (~5 mg/mL) in DDM, HiSiaQM elutes as a single peak between these volumes at 60 mL (green trace). For comparison, non-fused SiaQM from P. profundum expressed with the same purification tag and purified in a low concentration of L-MNG (black trace) has a dominant peak at 67 mL, characteristic of a monomer, and this greatly contrasts against HiSiaQM in low L-MNG (blue trace). (b) SDS-PAGE gel (left) of L-MNG purified HiSiaQM that consistently ran as two bands (~45 and ~75 kDa). Protein of this purity (>95%) in L-MNG was used for all subsequent experiments, including for further reconstitution into amphipol or nanodiscs. Western blot (right) with anti-Xpress primary antibody identifies both large bands that appear on SDS-PAGE following purification to be HiSiaQM. A small amount of a lower molecular weight contaminant or degradation product was also present. (c) SDS-PAGE gel demonstrating the purity of HiSiaP. A single band at ~35 kDa indicates that HiSiaP is greater than 95% pure. Protein of this purity (>95%) was used for all subsequent experiments.
-
Figure 2—figure supplement 1—source data 1
Original files for the gel and western blot analysis in Figure 2—figure supplement 1b and c.
- https://cdn.elifesciences.org/articles/92307/elife-92307-fig2-figsupp1-data1-v2.zip
-
Figure 2—figure supplement 1—source data 2
Image containing Figure 2—figure supplement 1b and c and original files for the gel and western blot analysis with highlighted bands and sample labels.
- https://cdn.elifesciences.org/articles/92307/elife-92307-fig2-figsupp1-data2-v2.zip
Figure 2—figure supplement 2

Cryo-electron microscopy (cryo-EM) workflow for structure determination.
The two classes were determined as 36% of the particles (antiparallel dimer) and 36% (parallel dimer).
Figure 2—figure supplement 3

Representative density of the helices of HiSiaQM.
Clear side-chain densities are present for almost all of the residues of HiSiaQM. Density for the antiparallel dimer is shown as it is higher resolution and was used for the structural analysis in this work.
Figure 3 with 4 supplements
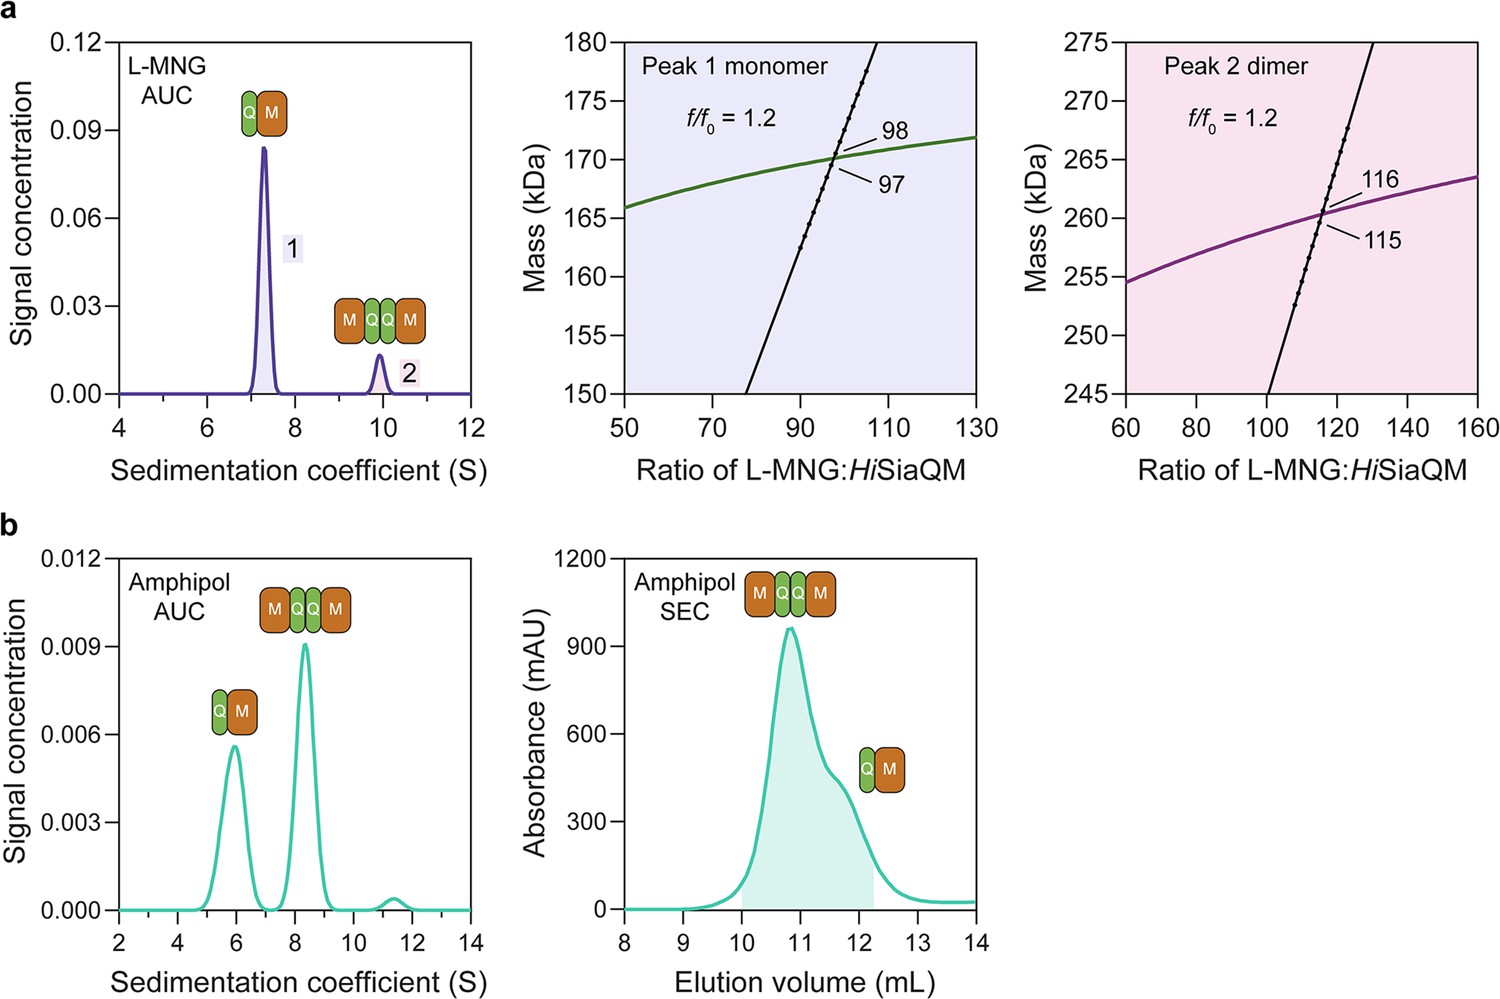
HiSiaQM self-association in lauryl maltose neopentyl glycol (L-MNG) and amphipol.
(a) Sedimentation velocity analytical ultracentrifugation (SV-AUC) analysis of HiSiaQM in L-MNG (left panel). Two well-resolved species exist at 7.3S (diffusion coefficient, D = 4.8 × 10⁻⁷ cm2/s) and 9.9S (D = 4.2 × 10⁻⁷ cm2/s), with the larger peak constituting 85% of the signal. The species at 7.3S (peak 1, blue shading) is most consistent with HiSiaQM as a monomer with ~98 molecules of L-MNG bound (middle panel; green = measured mass, black = theoretical mass), calculated from the experimental sedimentation and diffusion coefficients. These calculations suggest that peak 1 existing as a dimer is unlikely, as the dimeric protein would only have ~14 molecules of L-MNG bound. Additionally, the calculated f/f0 of a monomer for peak 1 is 1.2, consistent with a protein in a detergent micelle. The species at 9.9S (peak 2, pink shading) is most consistent with HiSiaQM as a dimer with ~116 molecules of L-MNG bound (calculated) (right panel; purple = measured mass, black = theoretical mass); peak 2 existing as a monomer is not possible, as the protein clearly has a smaller species in peak 1 and cannot be divided further than a monomer, and a trimer is also unlikely as the trimeric protein would only have ~32 molecules of L-MNG bound (calculated). Additionally, the calculated f/f0 of a dimer for peak 2 is also 1.2, again consistent with a protein in a detergent micelle. These calculations do not account for bound lipid molecules. (b) Left panel: SV-AUC analysis of amphipol-solubilised HiSiaQM (initially purified in L-MNG) shows two distinct species present at 5.9S and 8.3S. These are monomeric and dimeric species as L-MNG-solubilised protein exists as these oligomeric states at 7.3S and 9.9S as in (a). Right panel: representative size-exclusion chromatogram of amphipol-solubilised HiSiaQM favouring the dimeric state. The main peak at ~10.8 mL contains dimeric HiSiaQM and the shoulder at ~11.8 mL contains monomeric HiSiaQM. The sample used for structure determination is shaded turquoise.
Figure 3—figure supplement 1

HiSiaQM self-association in dodecyl-β-d-maltoside (DDM).
Sedimentation velocity analytical ultracentrifugation (SV-AUC) analysis of HiSiaQM in DDM (left panel). Two well-resolved species exist at 7.6S (diffusion coefficient, D = 5.0 × 10⁻⁷ cm2/s) and 10.3S (D = 5.0 × 10⁻⁷ cm2/s), with the larger peak constituting 62% of the signal. Due to the presence of protein aggregation in DDM (Figure 2—figure supplement 1a, green trace), SV-AUC for this sample was performed at 4°C (instead of 20°C for lauryl maltose neopentyl glycol [L-MNG]) to prevent HiSiaQM from forming larger order species, although even at this temperature larger species are still evident at 12–18S and extend to ~40S (not shown). This observed heterogeneity was a significant reason for our use of L-MNG in all other experiments. The species at 7.6S (peak 1, blue shading) is most consistent with HiSiaQM as a monomer with ~216 molecules of DDM bound (middle panel; green = measured mass, black = theoretical mass), calculated from the experimental sedimentation and diffusion coefficients. These calculations suggest that peak 1 existing as a dimer is unlikely, as the dimeric protein would only have ~31 molecules of DDM bound. Additionally, the calculated f/f0 of a monomer for peak 1 is 1.1, consistent with a protein in a detergent micelle. The species at 10.3S (peak 2, pink shading) is most consistent with HiSiaQM as a dimer with ~171 molecules of DDM bound (calculated) (right panel; purple = measured mass, black = theoretical mass); peak 2 existing as a monomer is not possible as the protein clearly has a smaller species in peak 1 and cannot be divided further than a monomer, and a trimer is also unlikely as the experimental data suggests that no DDM would be bound (calculated). Additionally, the calculated f/f0 of a dimer for peak 2 is 1.0, roughly consistent with a protein in a detergent micelle. These calculations do not account for bound lipid molecules.
Figure 3—figure supplement 2
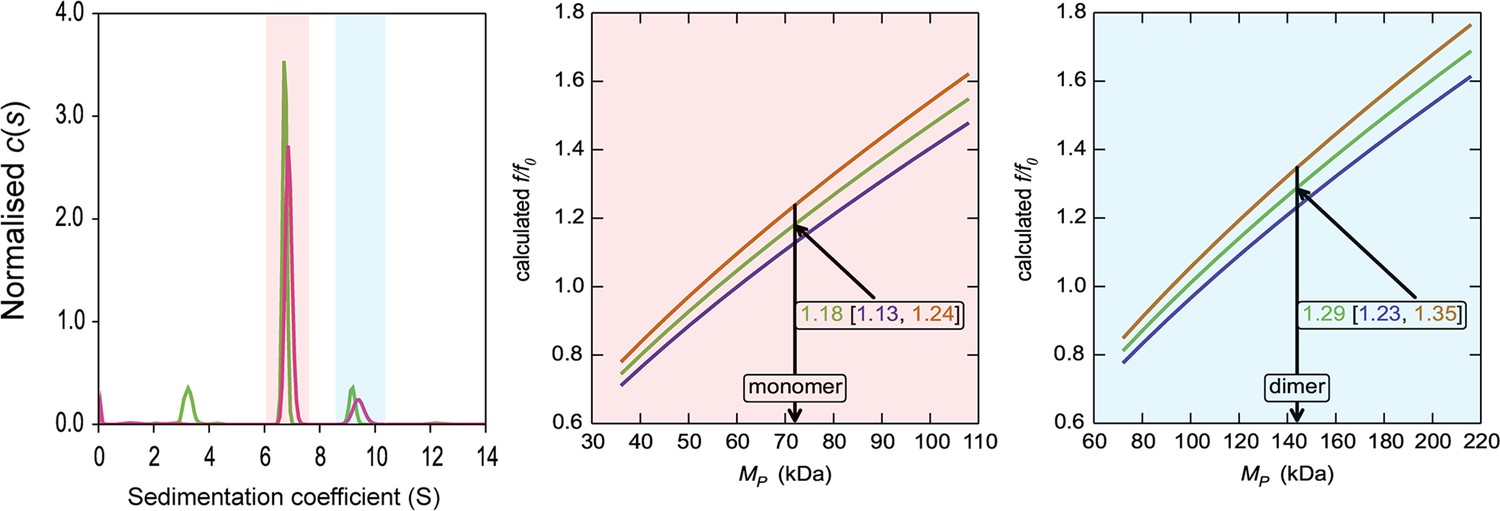
HiSiaQM self-association in lauryl maltose neopentyl glycol (L-MNG) (interference analysis).
Sedimentation of HiSiaQM in L-MNG (left panel) with absorbance data (pink) and interference data (green). Two well-resolved species exist at 6.7S and 9.4S, with the smaller species constituting greater than 80% of the signal. The oligomeric state of the two species was verified using the membrane protein calculations function of GUSSI (Brautigam, 2015), as described previously (Ebel, 2011; le Maire et al., 2008; Le Roy et al., 2015; Salvay et al., 2007). Free L-MNG micelles are seen only with interference data at ~3.2S. The peak at 6.7S is most consistent with a HiSiaQM monomer (middle panel). After determining the amount of L-MNG bound to the protein with the interference data, frictional ratios (f/f0) can be calculated to test the hypothesised oligomeric state. The calculated f/f0 for a monomer for the major species (red shading) is 1.2 (1σ error = 1.13–1.24), consistent with a single HiSiaQM in a detergent micelle. A dimer is unlikely since the calculated f/f0 for a dimer for the major species is 1.9 (1σ error = 1.79–1.96) (not shown). On the right panel, the calculated f/f0 for a dimer for the minor species (blue shading) is 1.3 (1σ error = 1.23–1.35), again consistent with dimeric HiSiaQM in a detergent micelle. A monomer is unlikely, since the calculated f/f0 for a monomer for the 9.4S species is 0.8 (1σ error = 0.78–0.85) (not shown). With the detergent bound to the sedimenting protein now known alongside the mass of the detergent monomers, it can be estimated that approximately 90 (monomer) and 150 (dimer) molecules of L-MNG are bound to the protein.
Figure 3—figure supplement 3
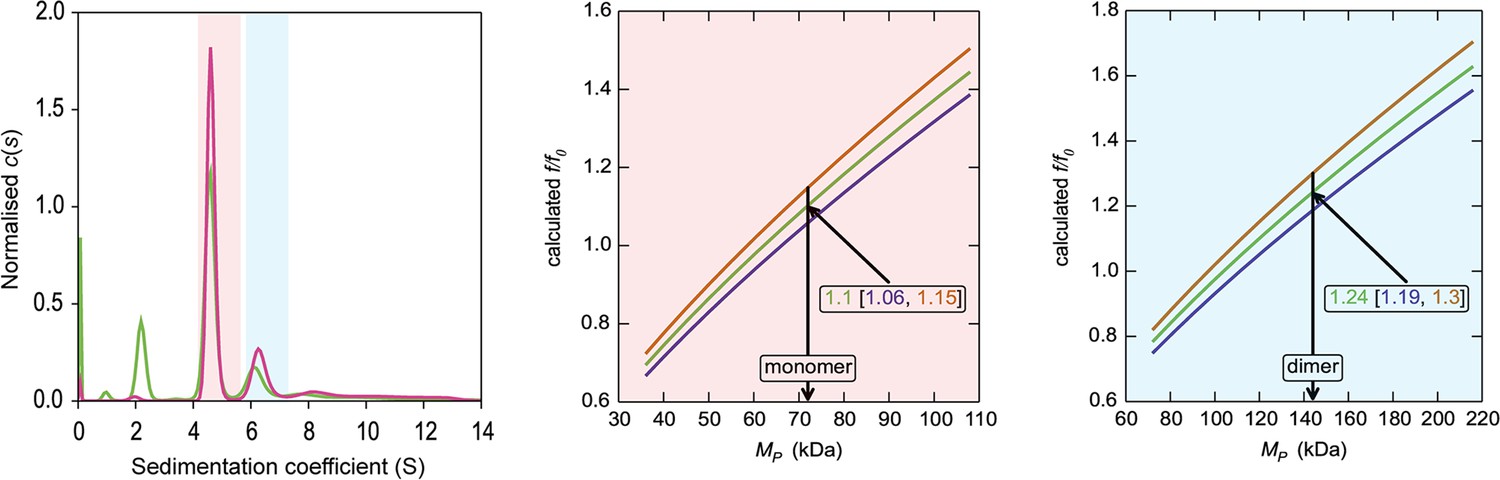
HiSiaQM self-association in dodecyl-β-d-maltoside (DDM) (interference analysis).
Sedimentation of HiSiaQM in DDM (left panel) with absorbance data (pink) and interference data (green). Two main species exist at ~4.5S and ~6.2S, with the smaller species constituting greater than 60% of the signal. The oligomeric state of the two species was verified using the membrane protein calculations function of GUSSI (Brautigam, 2015), as described previously (Ebel, 2011; le Maire et al., 2008; Le Roy et al., 2015; Salvay et al., 2007). Free DDM micelles are seen only with interference data at ~2.1S. Due to the presence of protein aggregation in DDM (Figure 2—figure supplement 1a, green trace), sedimentation velocity analytical ultracentrifugation (SV-AUC) for this sample was performed at 4°C (instead of 20°C for the sample in lauryl maltose neopentyl glycol [L-MNG]) to prevent the protein from forming larger order species, although even at this temperature some larger species are still evident at ~8–12S. These sedimentation coefficients are not corrected for the lower temperature so appear smaller than all other values reported for HiSiaQM. The species at 4.5S (red shading) is consistent with a monomer in DDM, f/f0 = 1.1 (1σ error = 1.06–1.15) (middle panel). In contrast, a dimer species is unlikely given the unrealistic f/f0 = 1.8 (1σ error = 1.68–1.82) (not shown). The larger species at 6.5S (blue shading) is consistent with a dimer in DDM, f/f0 = 1.2 (1σ error = 1.19–1.3) (right panel), whereas the monomer provides an unrealistic f/f0 = 0.8 (1σ error = 0.75–0.82) (not shown). With the detergent bound to the sedimenting protein now known alongside the mass of the detergent monomers, it can be estimated that approximately 220 (monomer) and 380 (dimer) molecules of DDM are bound to the protein.
Figure 3—figure supplement 4
Solubilisation of HiSiaQM in nanodiscs.
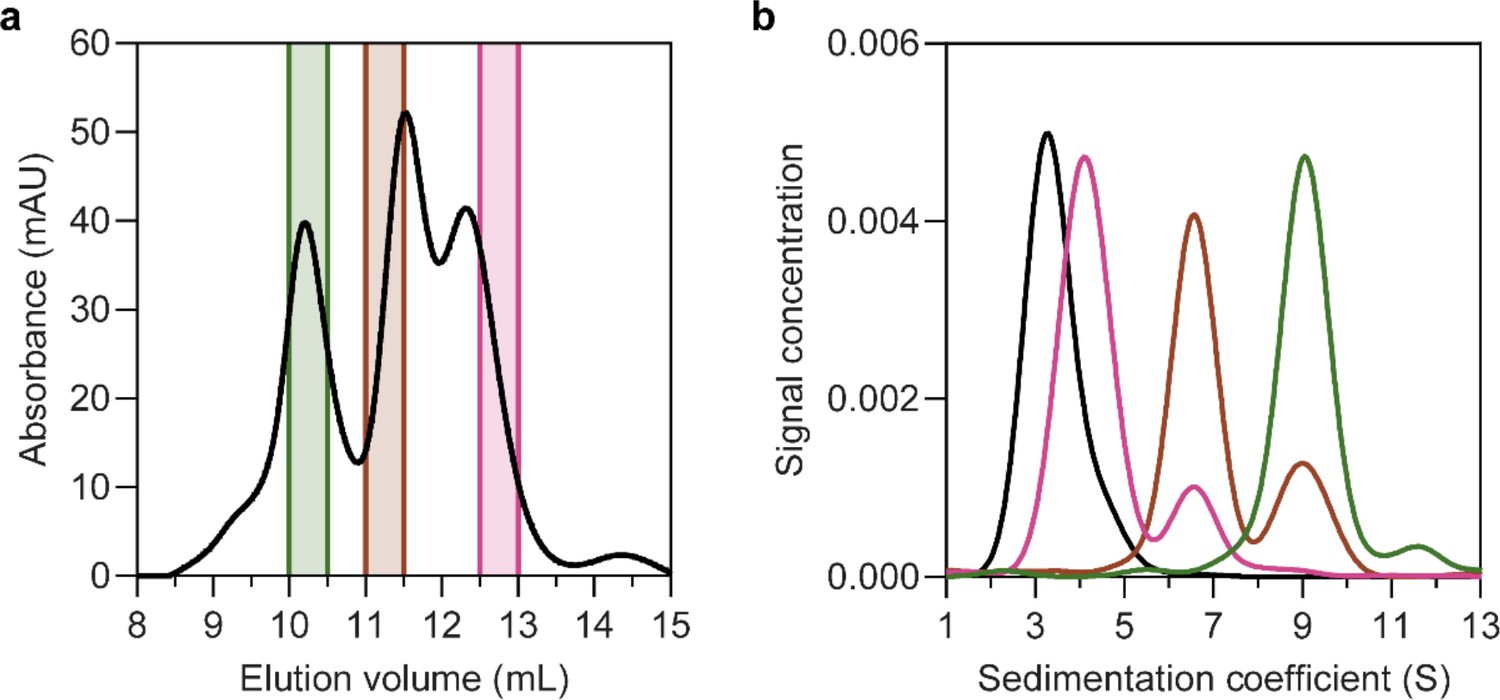
(a) The size-exclusion chromatogram following nanodisc reconstitution with a 1:4:80 ratio of HiSiaQM:MSP:lipid identifies the presence of multiple species. Three fractions across the elution profile were analysed with sedimentation velocity analytical ultracentrifugation (SV-AUC) (shown by the coloured bars). (b) SV-AUC analysis of nanodisc solubilised HiSiaQM (pink, brown, and green) and empty nanodiscs (black) shows that later eluted fractions gave a main species consistent with empty nanodiscs (pink, 4.0S), middle eluted fractions gave a main species consistent with a monomer incorporated (brown, 6.8S) and earlier eluted fractions gave a larger 9.0S main species (green). The larger species at 9.0S is most likely a dimer of HiSiaQM in a nanodisc as it has been shown to exist as a dimer in both detergent and amphipol. The dimer can just fit by physical constraints as the MSP forms ~11 nm nanodiscs and the size of the HiSiaQM dimer is ~10 nm at the widest point. While physically possible, the number of reconstituted lipids would be low.
Figure 4 with 2 supplements
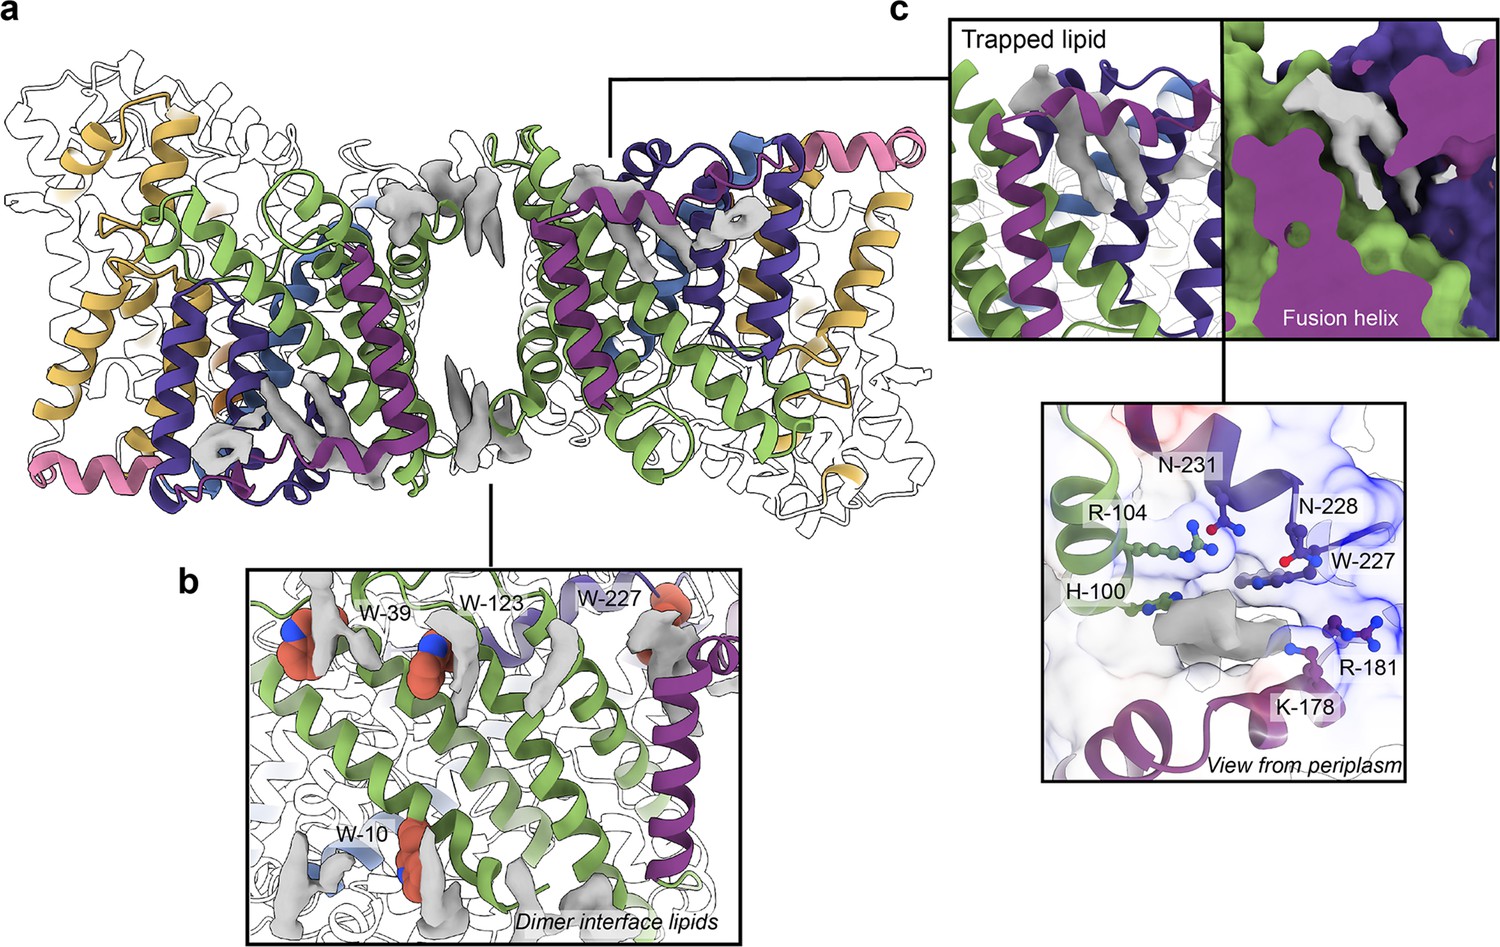
Phospholipids bound to HiSiaQM.
(a) The dimer has well-defined areas of density (grey) that correspond to bound phospholipids. Two mechanistically important areas are the dimer interface and fusion helix pocket. (b) Phospholipids are present at the dimer interface, including in close contact with the anchoring tryptophan residues (shown as spheres) of the Q-subunits that provide stability to the scaffold domain. (c) A single phospholipid is trapped in a pocket formed by the fusion helix (protein model surface shown in colour, EM density in grey). The lipid is on the periplasmic side of the transporter and the headgroup appears to be coordinated by residues surrounding the top of the pocket, which have a generally positive character.
Figure 4—figure supplement 1
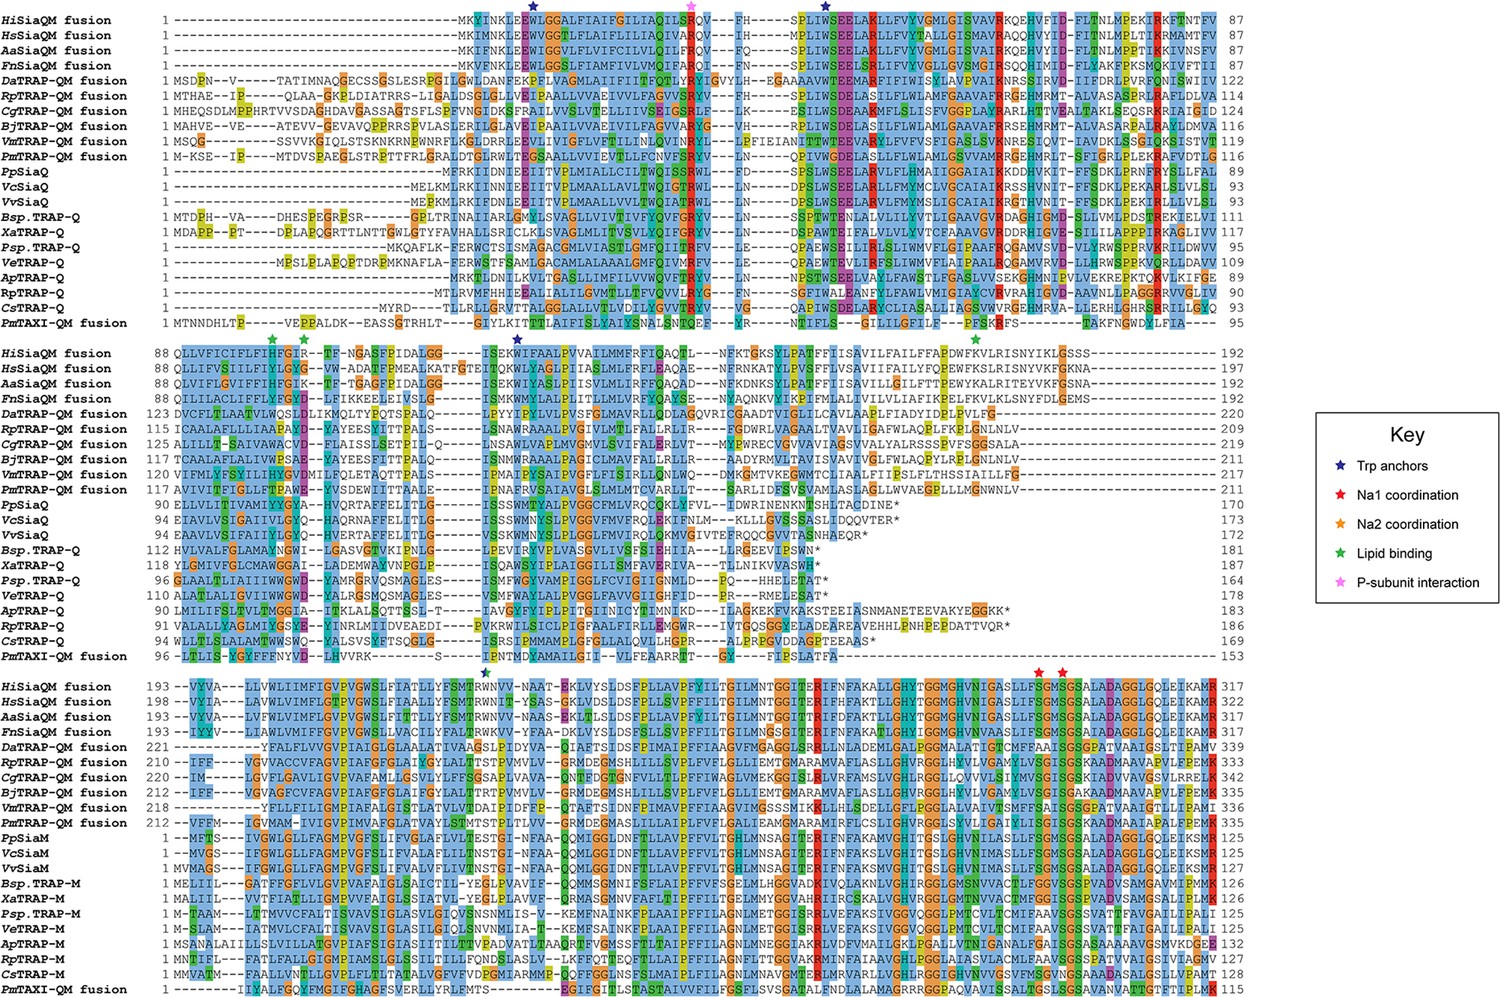
Protein sequence alignment of tripartite ATP-independent periplasmic (TRAP) transporter QM-subunits.
Protein sequences were obtained from the National Center for Biotechnology Information, aligned using Kalign (Lassmann, 2019) and coloured in Jalview (Waterhouse et al., 2009) with Clustal X colouring. Anchoring tryptophan residues (blue stars), Na1 coordinating residues (red stars), Na2 coordinating residues (orange stars), predicted lipid-binding residues (green stars), and expected P-subunit interacting residues (pink stars) are annotated. SiaQM protein sequences from Haemophilus influenzae (Hi, WP_005694432), Histophilus somni (Hs, WP_249962964), Aggregatibacter actinomycetemcomitans (Aa, WP_005592763), Fusobacterium nucleatum (Fn, WP_060798477), Photobacterium profundum (Pp, WP_011218955/WP_011218954), Vibrio vulnificus (Vv, WP_001889698/WP_000233105), and Vibrio cholerae (Vc, WP_011081661/BAC97226) were aligned with TRAP-QM protein sequences from Desulfovibrio alaskensis (Da, WP_011367273), Rhodopseudomonas palustris (Rp, WP_011441572), Caballeronia grimmiae (Cg, WP_052006082), Bradyrhizobium japonicum (Bj, WP_248883330), Virgibacillus massiliensis (Vm, WP_051739028), Pseudomonas mandelii (Pm, WP_033060252), Bradyrhizobium sp. BTAi1 (Bsp., WP_011942649/WP_011942650), Xanthobacter autotrophicus (Xa, ABS68596/ABS68595), Polaromonas sp. JS666 (Psp., WP_011482802/WP_011482801), Verminephrobacter eiseniae (Ve, ABM59662/WP_011811650), Anaerococcus prevotii (Ap, WP_015778303/WP_015778302), Rhodopseudomonas palustris (Rp, WP_011442208/WP_011442207), and Chromohalobacter salexigens (Cs, WP_011505968/ABE58023) and the TAXI-TRAP-QM protein sequence from Proteus mirabilis (Pm, WP_004242632).
Figure 4—figure supplement 2
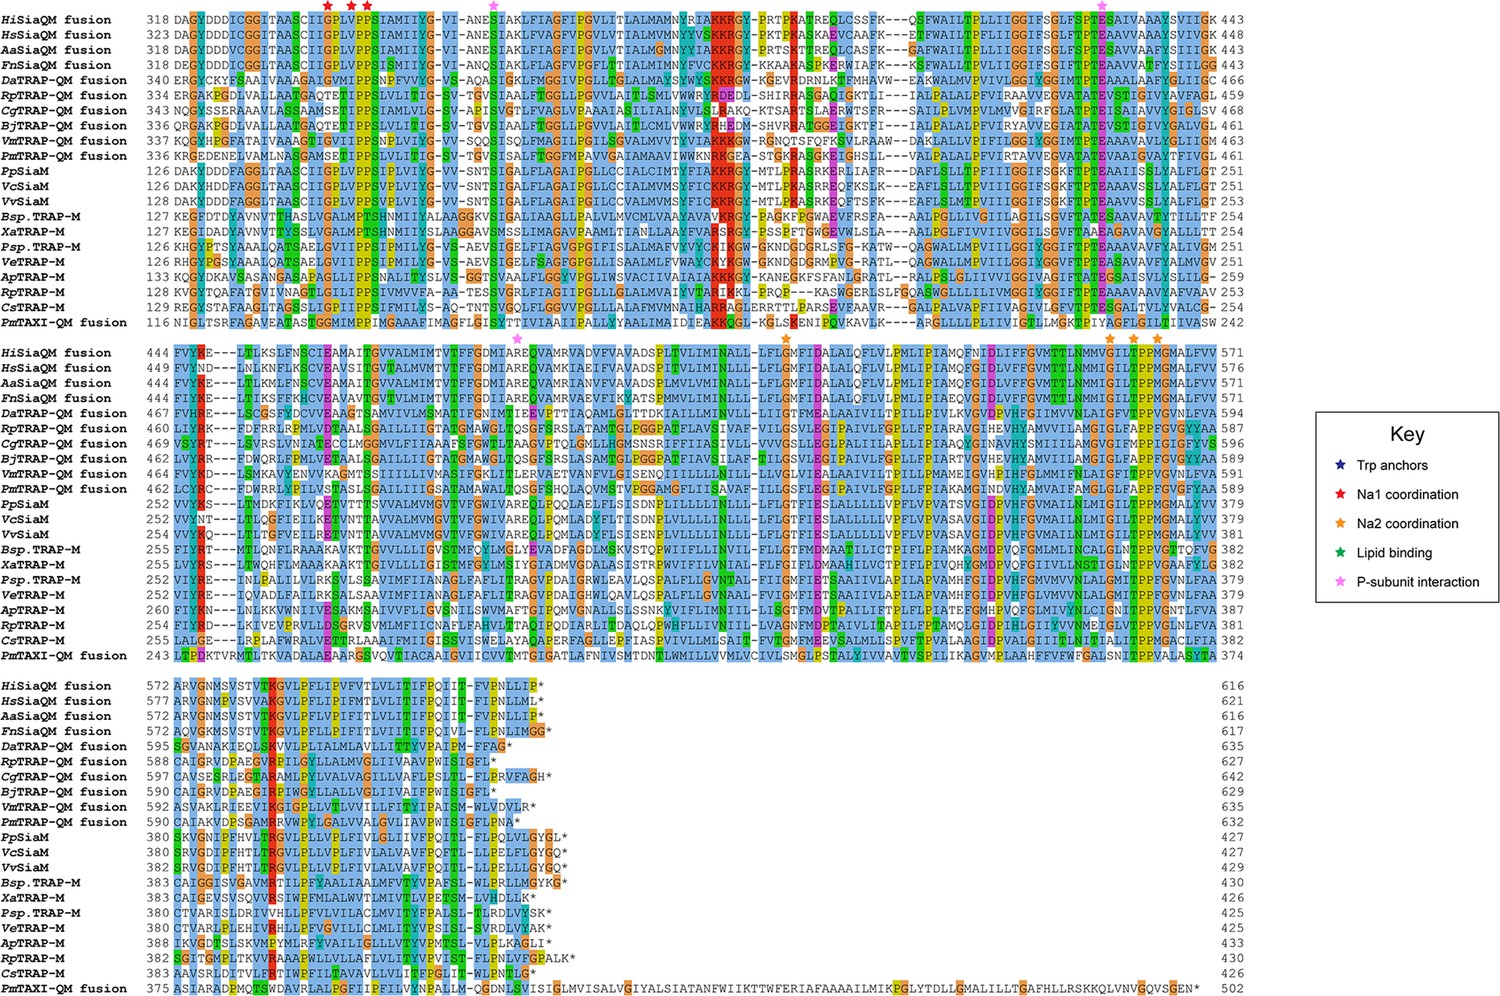
Protein sequence alignment of tripartite ATP-independent periplasmic (TRAP) transporter QM-subunits.
Protein sequences were obtained from the National Center for Biotechnology Information, aligned using Kalign (Lassmann, 2019) and coloured in Jalview (Waterhouse et al., 2009) with Clustal X colouring. Anchoring tryptophan residues (blue stars), Na1 coordinating residues (red stars), Na2 coordinating residues (orange stars), predicted-lipid binding residues (green stars), and expected P-subunit interacting residues (pink stars) are annotated. SiaQM protein sequences from Haemophilus influenzae (Hi, WP_005694432), Histophilus somni (Hs, WP_249962964), Aggregatibacter actinomycetemcomitans (Aa, WP_005592763), Fusobacterium nucleatum (Fn, WP_060798477), Photobacterium profundum (Pp, WP_011218955/WP_011218954), Vibrio vulnificus (Vv, WP_001889698/WP_000233105), and Vibrio cholerae (Vc, WP_011081661/BAC97226) were aligned with TRAP-QM protein sequences from Desulfovibrio alaskensis (Da, WP_011367273), Rhodopseudomonas palustris (Rp, WP_011441572), Caballeronia grimmiae (Cg, WP_052006082), Bradyrhizobium japonicum (Bj, WP_248883330), Virgibacillus massiliensis (Vm, WP_051739028), Pseudomonas mandelii (Pm, WP_033060252), Bradyrhizobium sp. BTAi1 (Bsp., WP_011942649/WP_011942650), Xanthobacter autotrophicus (Xa, ABS68596/ABS68595), Polaromonas sp. JS666 (Psp., WP_011482802/WP_011482801), Verminephrobacter eiseniae (Ve, ABM59662/WP_011811650), Anaerococcus prevotii (Ap, WP_015778303/WP_015778302), Rhodopseudomonas palustris (Rp, WP_011442208/WP_011442207), and Chromohalobacter salexigens (Cs, WP_011505968/ABE58023) and the TAXI-TRAP-QM protein sequence from Proteus mirabilis (Pm, WP_004242632).
Figure 5 with 1 supplement
Transport assays demonstrate that lauryl maltose neopentyl glycol (L-MNG)-solubilised HiSiaQM is functional.
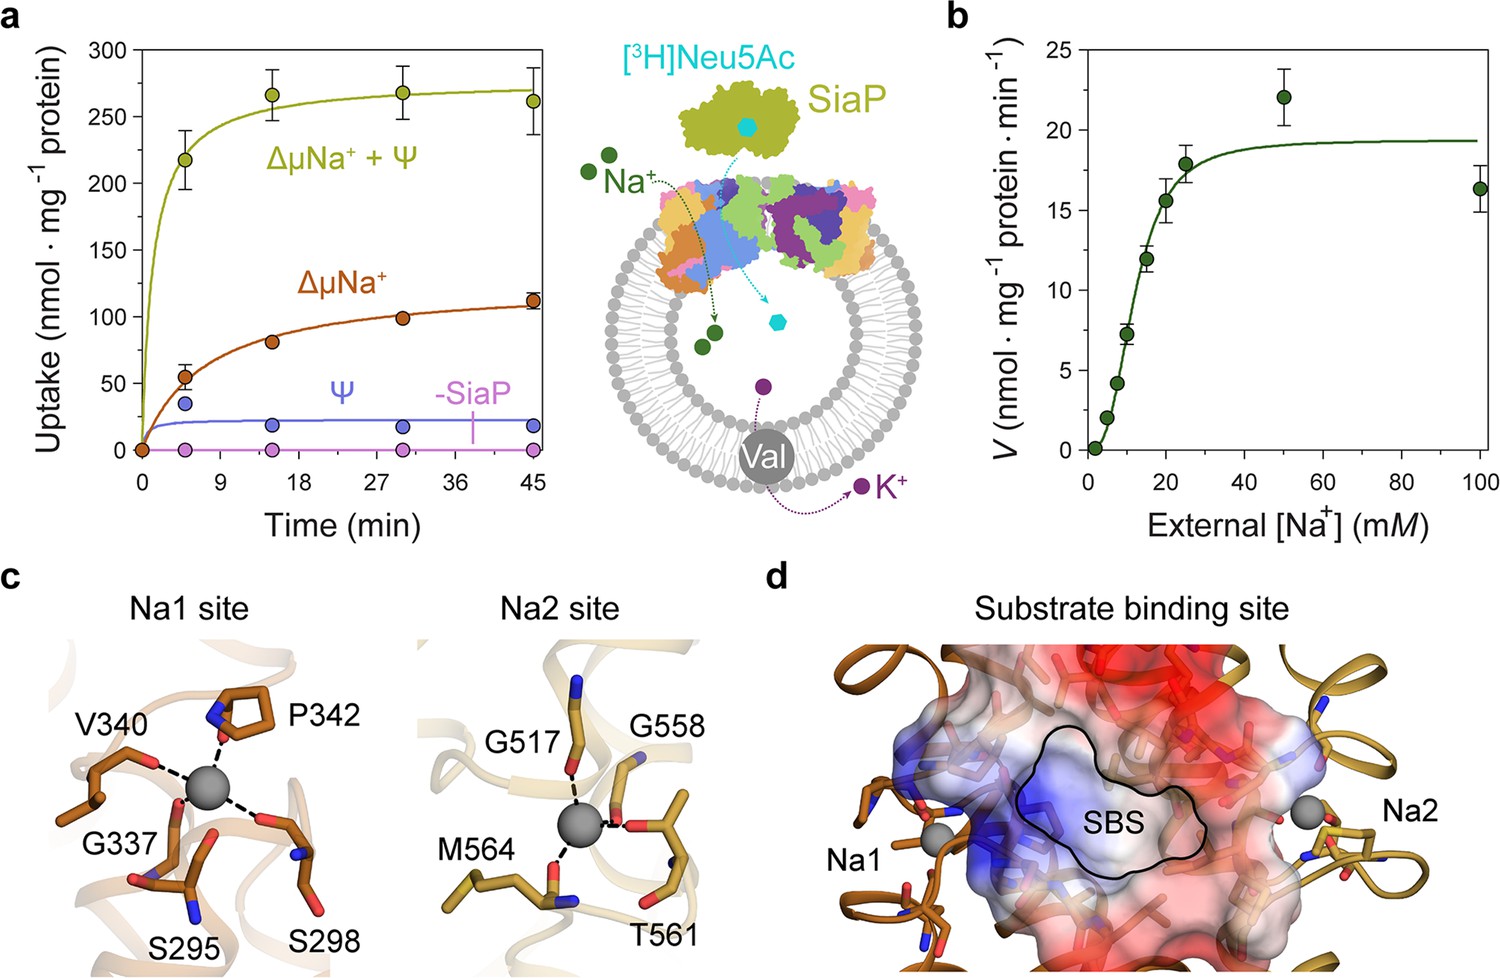
(a) [3H]-Neu5Ac uptake was measured at multiple time intervals under each condition and used to calculate transport rates. HiSiaQM had the highest activity in the presence of HiSiaP, a membrane potential and a Na+ gradient (green circles). Approximately one-third of this rate was present without a membrane potential (orange circles). Transport was low in the absence of Na+ (blue circles) and negligible without HiSiaP (pink circles). Error bars represent the standard error of the mean (SEM) for three technical replicates, except without HiSiaP, which has two replicates. The assay diagram contains the parallel HiSiaQM structure, coloured by topology as in Figure 2a and c. This is for visual presentation; it is not known if the transporter exists as a dimeric species in the assay. (b) The rate of transport is dependent on the concentration of Na+, showing a sigmoidal response (Hill coefficient = 2.9 [95% C.I. 2.2–3.9]). The KM for Na+ is 12 mM (95% C.I. 10–14 mM). The displayed response shows that HiSiaPQM operates close to its maximum measured rate at a reasonably low external Na+ concentration (25 mM). Error bars represent the SEM of five technical replicates. (c) Two Na+-binding sites (Na1 and Na2) were identified in HiSiaQM. These sites share highly similar coordinating residues with PpSiaQM. At the Na1 site, a Na+ ion (grey) is coordinated by the carbonyl groups of S298, G337, V340 and P342 (orange sticks, coordination shown as black dashes). S295 is also shown but its carbonyl is positioned just outside the coordination distance in our structure. At the Na2 site, a Na+ ion (grey) is coordinated by the carbonyl groups of G517, G558, and M564, and the side-chain hydroxyl of T561 (gold sticks, coordination shown as black dashes). (d) A putative substrate-binding site (SBS, outlined) is located in the transport domain of HiSiaQM (orange and gold). The mostly hydrophobic binding site (shown as sticks and electrostatic surface) exists between the two Na+-binding sites and is large enough to bind Neu5Ac.
Figure 5—figure supplement 1

The Na+ and substrate-binding sites of HiSiaQM.
(a) Closeup views of the cryo-electron microscopy (cryo-EM) density (blue) at the Na1 and Na2 sites of the antiparallel HiSiaQM dimer. Density is present for both Na+ ions (green spheres). Na+-binding residues are shown as sticks and Na+ coordination as black dashes. The density map was automatically sharpened using Phenix (Terwilliger et al., 2018) and the radii of the Na+ ions have been reduced to show the density more clearly. (b) A comparison of the Na+-binding sites of HiSiaQM from the 2.9 Å structure (green) and the 4.7 Å structure (purple). The Na+ ions of the 2.9 Å structure are shown as green spheres and are well positioned to coordinate the identified binding residues in the ‘clamshell’ loops. The positions of these loops are different between the two structures. (c) A comparison of the putative Neu5Ac-binding sites of HiSiaQM from the 2.9 Å structure (green) and the 4.7 Å structure (purple). The higher resolution structure shows that a defined binding pocket exists at the centre of the transport domain.
Figure 6 with 3 supplements
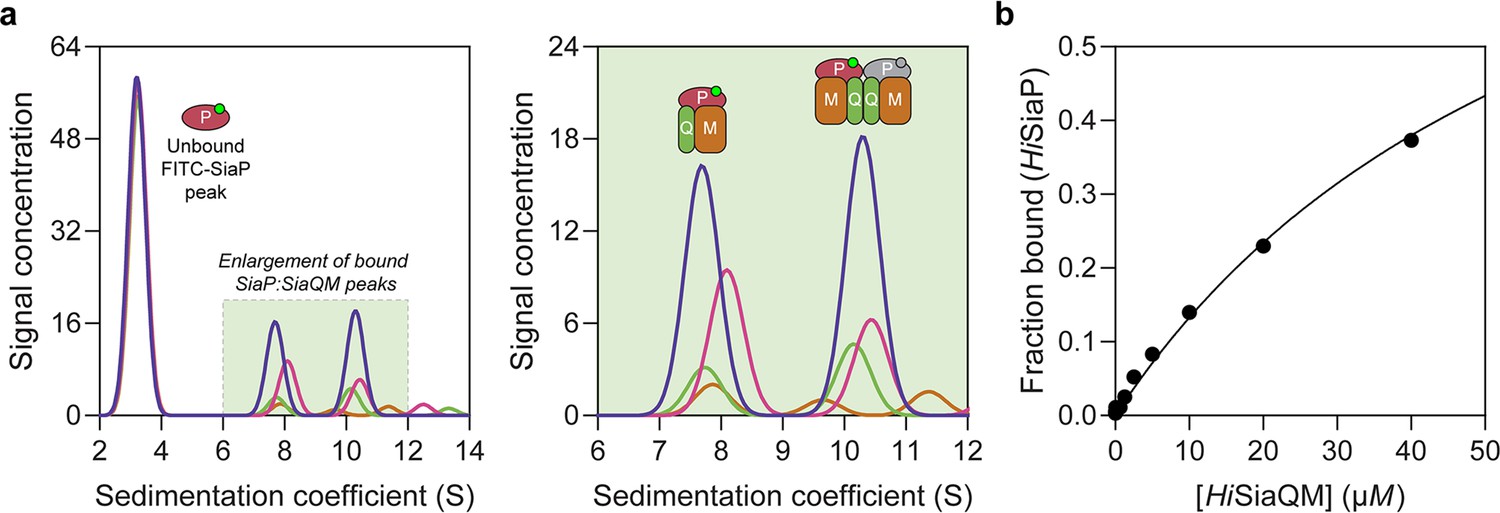
Sedimentation velocity analytical ultracentrifugation (AUC) analysis of the interaction between HiSiaQM and HiSiaP in lauryl maltose neopentyl glycol (L-MNG) detergent.
(a) Titrating increasing concentrations of HiSiaQM (blue, 40 µM [2.88 mg/mL]; pink, 20 µM; green, 10 µM; brown, 5 µM; other concentrations omitted for clarity) against fluorescently labelled FITC-HiSiaP (10 nM) identifies a shift in the signal for HiSiaP from 3S to ~7.5S and ~10.5S. This shift demonstrates binding to HiSiaQM and identifies two bound species with different sedimentation coefficients. The two species are annotated with the most likely binding stoichiometries (one or two HiSiaP monomers [red and grey] may be binding the dimeric species). (b) Fitting a binding model to the data (fraction bound = [P]total/[P]total + KD) estimates a KD of 65 µM (95% C.I. = 62–69 µM, R2 = 0.99).
Figure 6—figure supplement 1
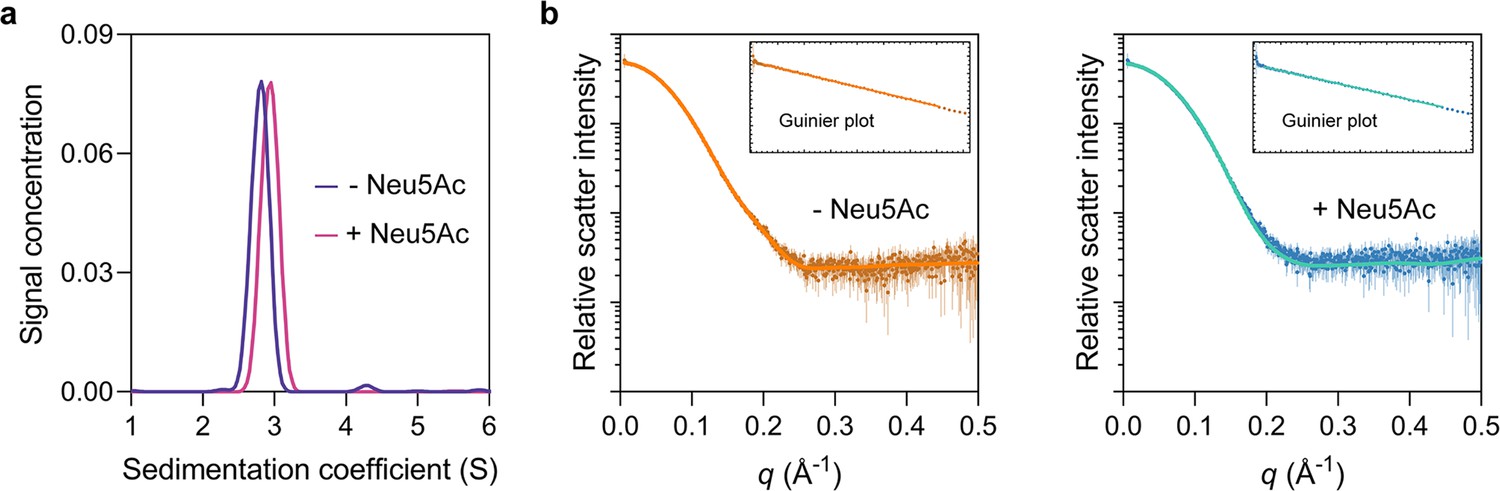
HiSiaP is monomeric.
(a) Analytical ultracentrifugation experiments of HiSiaP (expressed in the periplasm) without Neu5Ac or with 5 mM Neu5Ac resulted in sedimentation coefficients of ~2.8S without Neu5Ac (blue) and ~3.0S with Neu5Ac (pink), consistent with a monomeric oligomeric state. The samples had calculated masses of 39 and 35 kDa, indicating that HiSiaP exists as a monomer in both a ligand bound and unbound state. (b) Small-angle X-ray scattering (SAXS) analysis of HiSiaP without Neu5Ac (left, brown) and with 5 mM Neu5Ac (right, blue) at a considerably higher protein concentration than analytical ultracentrifugation (360 µM) resulted in a radius of gyration (Rg) of 20.9 Å and a maximum particle dimension (Dmax) of 64 Å without Neu5Ac and 20 Å and 63 Å with 5 mM Neu5Ac. CRYSOL was used to fit the predicted scatter from monomeric crystal structures to the observed scatter (Manalastas-Cantos et al., 2021). Fitting HiSiaP without Neu5Ac (PDB: 2CEY) (left, orange) results in Χ2 = 0.32. Fitting HiSiaP with Neu5Ac (PDB: 3B50) (right, teal) results in Χ2 = 0.66. Fitting the incorrect structures results in Χ2 values of 4.91 (without Neu5Ac data to 3B50) and 2.36 (with Neu5Ac data to 2CEY). These SAXS analyses of HiSiaP are all consistent with the sizes of the monomers from crystallography (Müller et al., 2006; Johnston et al., 2008).
Figure 6—figure supplement 2
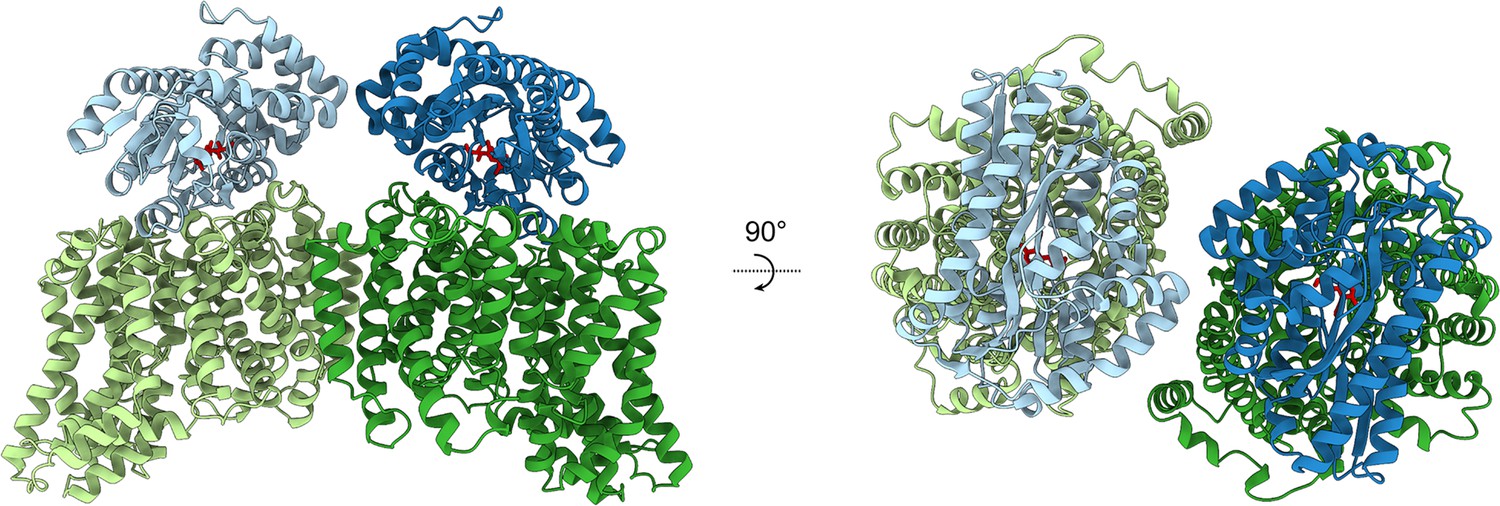
Modelling the HiSiaPQM complex.
AlphaFold2 was used to model the complex of two HiSiaP monomers (PDB: 3B50) bound to the parallel HiSiaQM dimer from this work (PDB: 8THI). The HiSiaQM monomers are shown in two shades of green and the HiSiaP monomers (ligand bound, closed form) are shown in two shades of blue. Neu5Ac bound to HiSiaP (red sticks) is positioned directly over top of the interface between the scaffold and transport domains of each HiSiaQM monomer. The predicted binding mode of the complex allows for the formation of two complete tripartite HiSiaPQM systems without significant steric clashes.
Figure 6—figure supplement 3
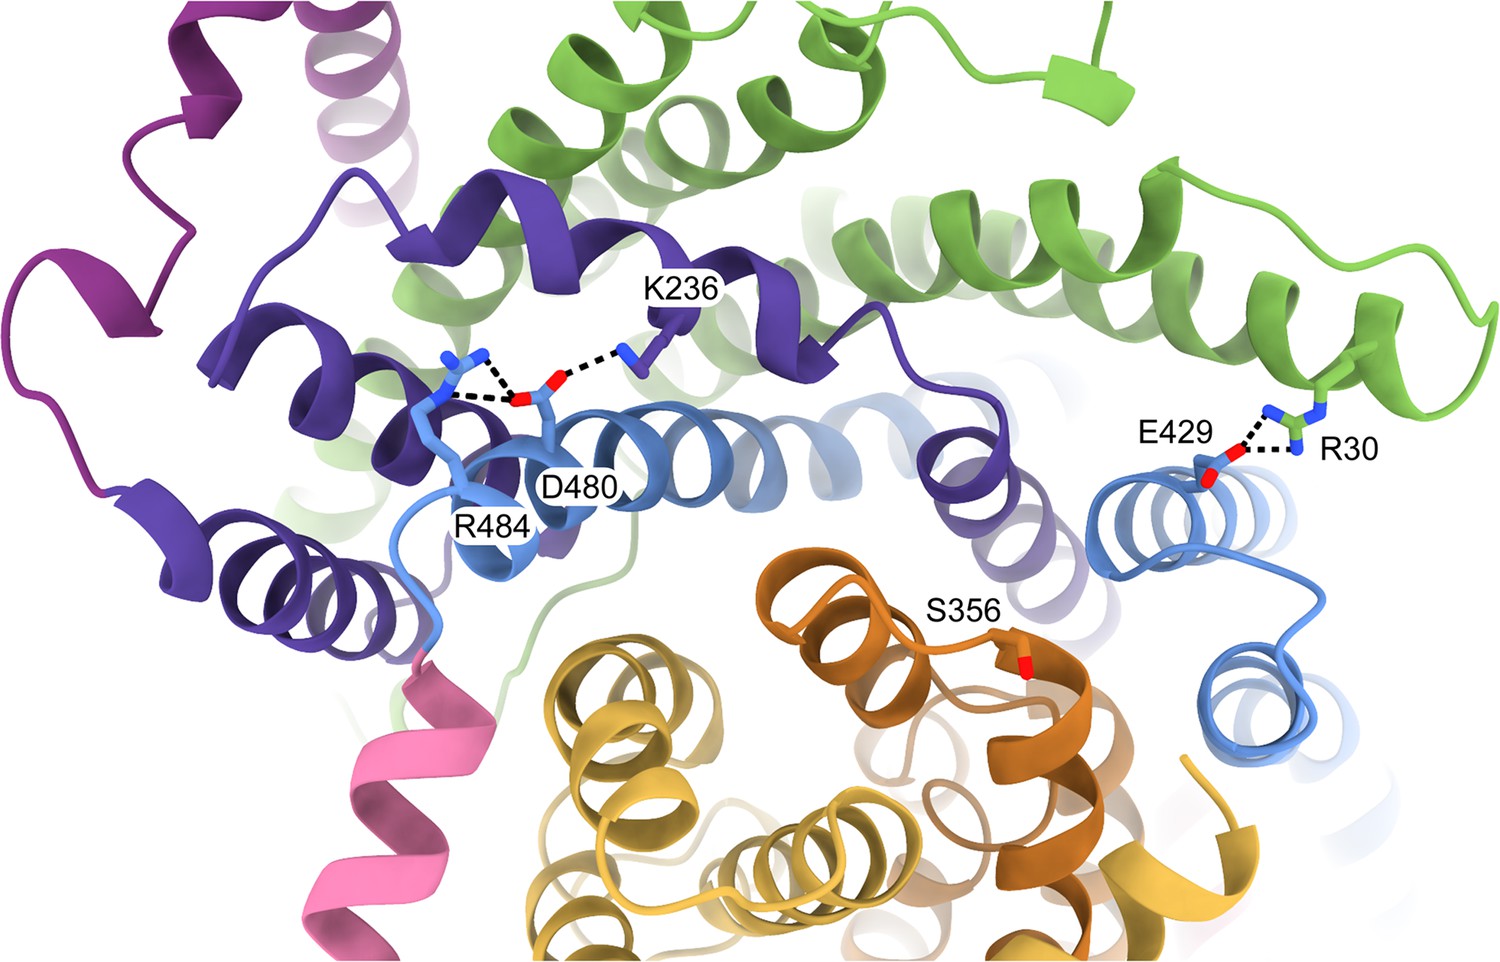
Residues involved in scaffold stabilisation and the interaction with SiaP.
The resolution of the HiSiaQM structure (coloured as in Figure 2c) shows the positions of R30, S356, E429, and R484 as viewed from the periplasm. R30 (SiaQ, helix 1) forms a salt bridge with E429 (SiaM, helix 8) to connect two helices of the scaffold and SiaQ and SiaM. S356 is located on the loop between helices 5b and 6 of SiaM in the transport domain. R484 (SiaM, helix 9a) forms a salt bridge with D480 (SiaM, helix 9a), which interacts with K236 (SiaM, helix 3a) to connect two helices of the scaffold.
Figure 7
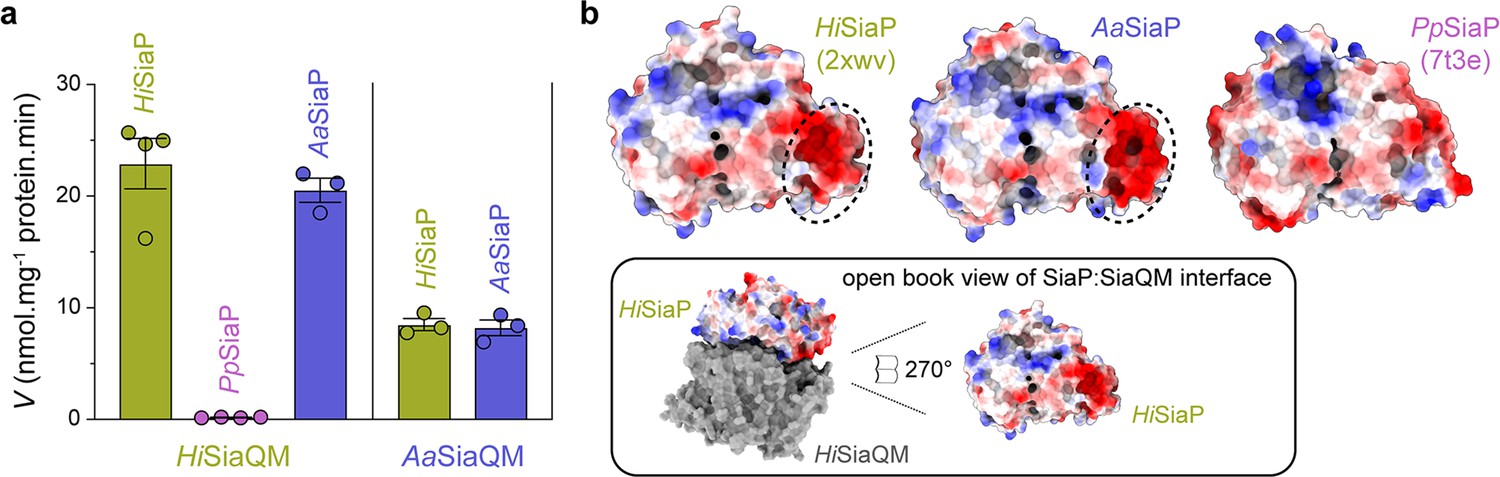
Subunit substitution transport assays.
(a) Transport was measured with subunit substitution of HiSiaPQM with the fused SiaPQM from A. actinomycetemcomitans (Aa) and the non-fused SiaPQM from P. profundum (Pp). Transport activity was measured in the presence of a membrane potential and a Na+ gradient. The mean activity is shown as bars with SEM error from at least three technical replicates (n = 3 or 4). (b) Electrostatic surface comparison of the putative SiaQM interaction surfaces of HiSiaP, AaSiaP and PpSiaP. The SiaP proteins of the two fused systems have a greater area of negatively charged residues (red, circled) at the N-terminal lobe than in the non-fused system.
Videos
Video 1
Three-dimensional variability analysis of our HiSiaQM reconstructions shows only very subtle motion at the dimer interface and does not show any global elevator motions in the final reconstruction.
Tables
Key resources table
| Reagent type (species) or resource | Designation | Source or reference | Identifiers | Additional information |
|---|---|---|---|---|
| Gene (Haemophilus influenzae Rd KW20) | SiaP; SiaQM | UniProt | P44542, P44543 | |
| Strain, strain background (Escherichia coli) | BL21 (DE3); TOP10 | Invitrogen | Chemically competent cells | |
| Antibody | Anti-Xpress IgG (mouse monoclonal) | Invitrogen | WB (1:2500) | |
| Antibody | Anti-mouse IgG (rabbit) | Sigma-Aldrich | WB (1:15000) | |
| Recombinant DNA reagent | pET22b(+) (plasmid) | GenScript | Provides pelB leader sequence | |
| Recombinant DNA reagent | pBAD/HisA (plasmid) | Thermo Fisher Scientific | ||
| Peptide, recombinant protein | cNW11 | Now Scientific | Covalent nanodisc protein |
Additional files
-
Supplementary file 1
Cryo-EM data collection, processing, refinement, and validation statistics.
- https://cdn.elifesciences.org/articles/92307/elife-92307-supp1-v2.docx
-
Supplementary file 2
Protein sequences of HiSiaQM and HiSiaP expressed and purified in this work.
- https://cdn.elifesciences.org/articles/92307/elife-92307-supp2-v2.docx
-
MDAR checklist
- https://cdn.elifesciences.org/articles/92307/elife-92307-mdarchecklist1-v2.docx
Download links
A two-part list of links to download the article, or parts of the article, in various formats.
Downloads (link to download the article as PDF)
Open citations (links to open the citations from this article in various online reference manager services)
Cite this article (links to download the citations from this article in formats compatible with various reference manager tools)
Structural and biophysical analysis of a Haemophilus influenzae tripartite ATP-independent periplasmic (TRAP) transporter
eLife 12:RP92307.
https://doi.org/10.7554/eLife.92307.3


