A remarkable genetic shift in a transmitted/founder virus broadens antibody responses against HIV-1
- Bacteriophage Medical Research Center, Department of Biology, The Catholic University of America, United States
- Henry M. Jackson Foundation for the Advancement of Military Medicine, United States
- Laboratory of Adjuvant and Antigen Research, U.S. Military HIV Research Program, Walter Reed Army Institute of Research, United States
- Department of Molecular Genetics and Microbiology, Duke University, United States
- Department of Biological Sciences, Purdue University, United States
- Department of Chemistry Education, Sunchon National University, Republic of Korea
- Department of Advanced Components and Materials Engineering, Sunchon National University, Republic of Korea
- Department of Computer Science, Purdue University, United States
Figures
Figure 1
Experimental design.
(A) Phylogenetic analysis of longitudinal env sequences isolated from four acutely infected participants in the RV217 study. (B) Selection of V1V2-specific escape variants and their fusion to the C-terminus of bacteriophage T4 small terminase protein, gp16, to generate gp16-V1V2 nanoscaffolds representing various escape mutations. (C) Expression of gp16-V1V2 escape mutants in GnTi mammalian cells to produce dodecameric nanoscaffolds displaying variant immunogens. (D) Immunization of mice with V1V2 variant nanoscaffolds and evaluation of immunogenicity. (E) Design of combinatorial V1V2 mutant immunogens and evaluation of their immunogenicity and breadth of immune responses in a successive immunization study.
Figure 2 with 2 supplements
Viral escape mutations in RV217 participants during the acute stage of HIV infection.
(A) Mutations observed in the RV217 participants – 7, 61, 94, and 100 are placed on HIV-1 BG505 pre-fusion trimer structure (PDB ID: 4TVP). Surface model showing dominant mutations (blue) falling on the solvent-exposed regions of the Env (gray) but not on the non-exposed or buried region (red). Modeling was done with PyMol (ver. 1.74) molecular visualization software and surface-exposed residues were defined as all residues that had >5 Å2 exposure to the solvent. (B) Mutational hotspots in the env sequence based on the genetic diversification of T/F viruses from all four participants. Total number of mutations in a particular region is plotted on the y-axis against residue positions on the env sequence (x-axis), with reference to HXB2 strain. The Env regions (labeled on top) with gray background showed high frequency of mutations. (C) Phylogenetic tree displaying T/F07 virus evolution in participant_7. The evolutionary tree was constructed by the neighbor-joining method, rooted to the T/F07 virus sequence. The viruses are designated corresponding to the time post-infection; 1 wk, 1 month (4 wks) or 6 month (24 wks) at the nodes of the branches. Prominent diverging mutations are labeled on the respective branches of the tree in red (V1V2 region) and gray (another region). (D) Dominant mutations that occurred until 24 wk post-infection in participant_7 are modeled on a ribbon model of the T/F07 trimer, generated through homology modeling using BG505 trimer (PDB ID: 4TVP) as a template. The zoomed-in image of V1V2 domain is shown to highlight the positions of V2-specific mutations, H173Y (red) and 3-residue deletion, DSV (blue). Deletion in the variable, V4 region is depicted in bright green and mutation in the conserved C2 region, K236T substitution, is shown in magenta. (E) A color-coded 4–5 β-stranded (A–D) conserved Greek-key motif structure of V1V2 domain is represented showing residue 173 on the C β-strand. (F) Snapshot of V1V2 sequences of T/F viruses from each RV217 participant under study. Major structural features of V1V2 region; semi-conserved four β-strands (A, B, C and D) and hypervariable V1 and V2 loops are labeled on top of the sequence. Prominent V1V2-specific mutation sites (observed in >50% of circulating viruses) until 24 wks are highlighted in red in the respective T/F virus sequence isolated from participants – 7, 61, 94, and 100.
Figure 2—figure supplement 1
Longitudinal viral load analysis over a course of infection in the participant 7.
Viral load values (log10) are plotted on y-axis, against the number of weeks since the first HIV-positive reaction with nucleic acid test on the x-axis. A typical pattern of curve with a peak, nadir, and set point in viral load was observed in this patient representing early captured infection. The set point is the viral load of a person infected with HIV, which stabilizes after a period of acute HIV infection.
-
Figure 2—figure supplement 1—source data 1
Data used for generating graph in Figure 2—figure supplement 1.
- https://cdn.elifesciences.org/articles/92379/elife-92379-fig2-figsupp1-data1-v1.xlsx
Figure 2—figure supplement 2

Phylogenetic trees showing evolution of transmitted/founder viruses.
(A–C) Phylogenetic trees depicting the divergence of T/F61 (A), T/F94 (B) and T/F100 (C) viruses from the time of infection until 6 month post-infection. The trees are constructed with T/F virus sequence as root using neighbor-end joining method in CLC Mains Workbench with parameters as described in Materials and methods. Dominant mutations resulting in divergence of the viruses are labeled on the branches of the tree. T/F61 viruses lacked any predominant mutations and had conserved V1V2 region.
Figure 3 with 1 supplement
A H173Y mutation in T/F07 HIV-1 Env led to virus escape in the participant 7.
(A) SPR binding curves showing reactivity of purified recombinant gp16-T/F07 (green), gp16-H173Y (red), gp16-ΔDSV (magenta) and gp16-H173Y+ΔDSV (blue) V1V2 proteins with a series of longitudinal plasma samples collected from participant 7 (shown on x-axis). The samples from wk 0 (pre-infection) until wk 144 (post-infection) were tested. The amount of binding is proportional to the response units (RU) plotted on the y-axis. The corresponding time points for each peak of antibodies are indicated. An early wave of V2-specific antibody represented by first peak at 6-month time-point recognized the gp16-T/F07 and gp16-ΔDSV variants [H173 variants] but not the gp16-H173Y and gp16-H173Y+ΔDSV variants [Y173 variants]. The second and third peaks of antibodies were found to be reactive to both the variants. (B–D) H173Y mutants poorly react to CH59 and CH58 antibodies. Immunoblot of the purified gp16 T/F07 V1V2 mutants (labeled on the top) showing respective binding with V2 mAbs, CH59 and CH58. Recognition by Strep-tag (purification tag) antibody served as a protein loading control (B). Binding curves of gp16-T/F07 (green), gp16-H173Y (red), gp16-ΔDSV (magenta), gp16-H173Y+ΔDSV (blue) V1V2-proteins, and gp16 scaffold only (negative control) (black) showing reactivity to CH59 (C) and CH58 (D) mAbs, as determined by ELISA performed with three technical replicates.
-
Figure 3—source data 1
Uncropped Western blot images.
- https://cdn.elifesciences.org/articles/92379/elife-92379-fig3-data1-v1.zip
-
Figure 3—source data 2
Data used for generating graphs in Figure 3A and C-D.
- https://cdn.elifesciences.org/articles/92379/elife-92379-fig3-data2-v1.zip
Figure 3—figure supplement 1
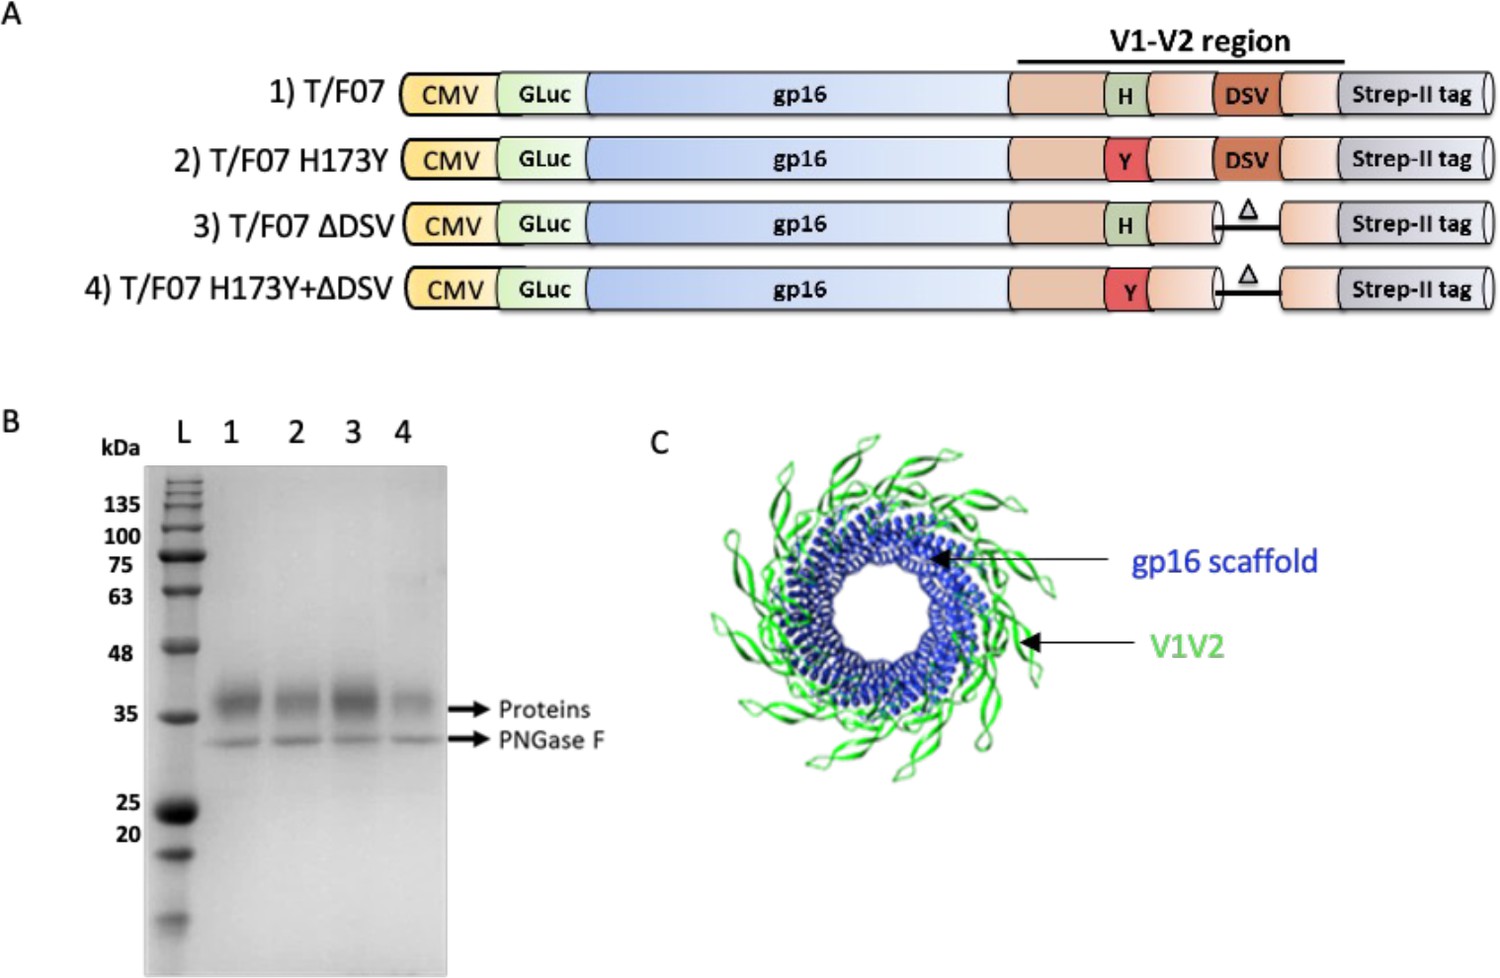
gp16-V1V2 construct design and purification.
(A) gp16-V1V2 constructs corresponding to the T/F07 virus sequence, and the V1V2-specific mutations accumulated until 24 weeks of infection in participant 7. The V1V2 sequence (light orange) amplified from the T/F07 Env (gp160) sequence was fused in-frame to the C-terminus of gp16 scaffold (blue). Each construct was cloned under the control of the CMV promoter and contained an N-terminal signal peptide (GLuc) for secretion of these recombinant proteins into the medium, and a C-terminal Twin Strep-tag II (gray) for affinity purification. The 24-week V2 mutations were introduced in the C β-strand (H173Y, red) and the hypervariable V2 loop (3 residue deletion-ΔDSV) indicated by a small triangle in the parental T/F07 construct to generate single and double mutants. (B) SDS-PAGE profile of gp16-V1V2 variant scaffolds of T/F07 expressed in HEK293S (GnTi) cells and purified through StrepTactin affinity chromatography. These recombinant glycoproteins were deglycosylated by PNGase F (band labeled on the gel) to obtain sharper bands on the gel for the purpose of quantification. (C) Dodecameric model of gp16-V1V2 showing gp16-scaffold in blue and fused V1V2 domain in bright green.
Figure 4
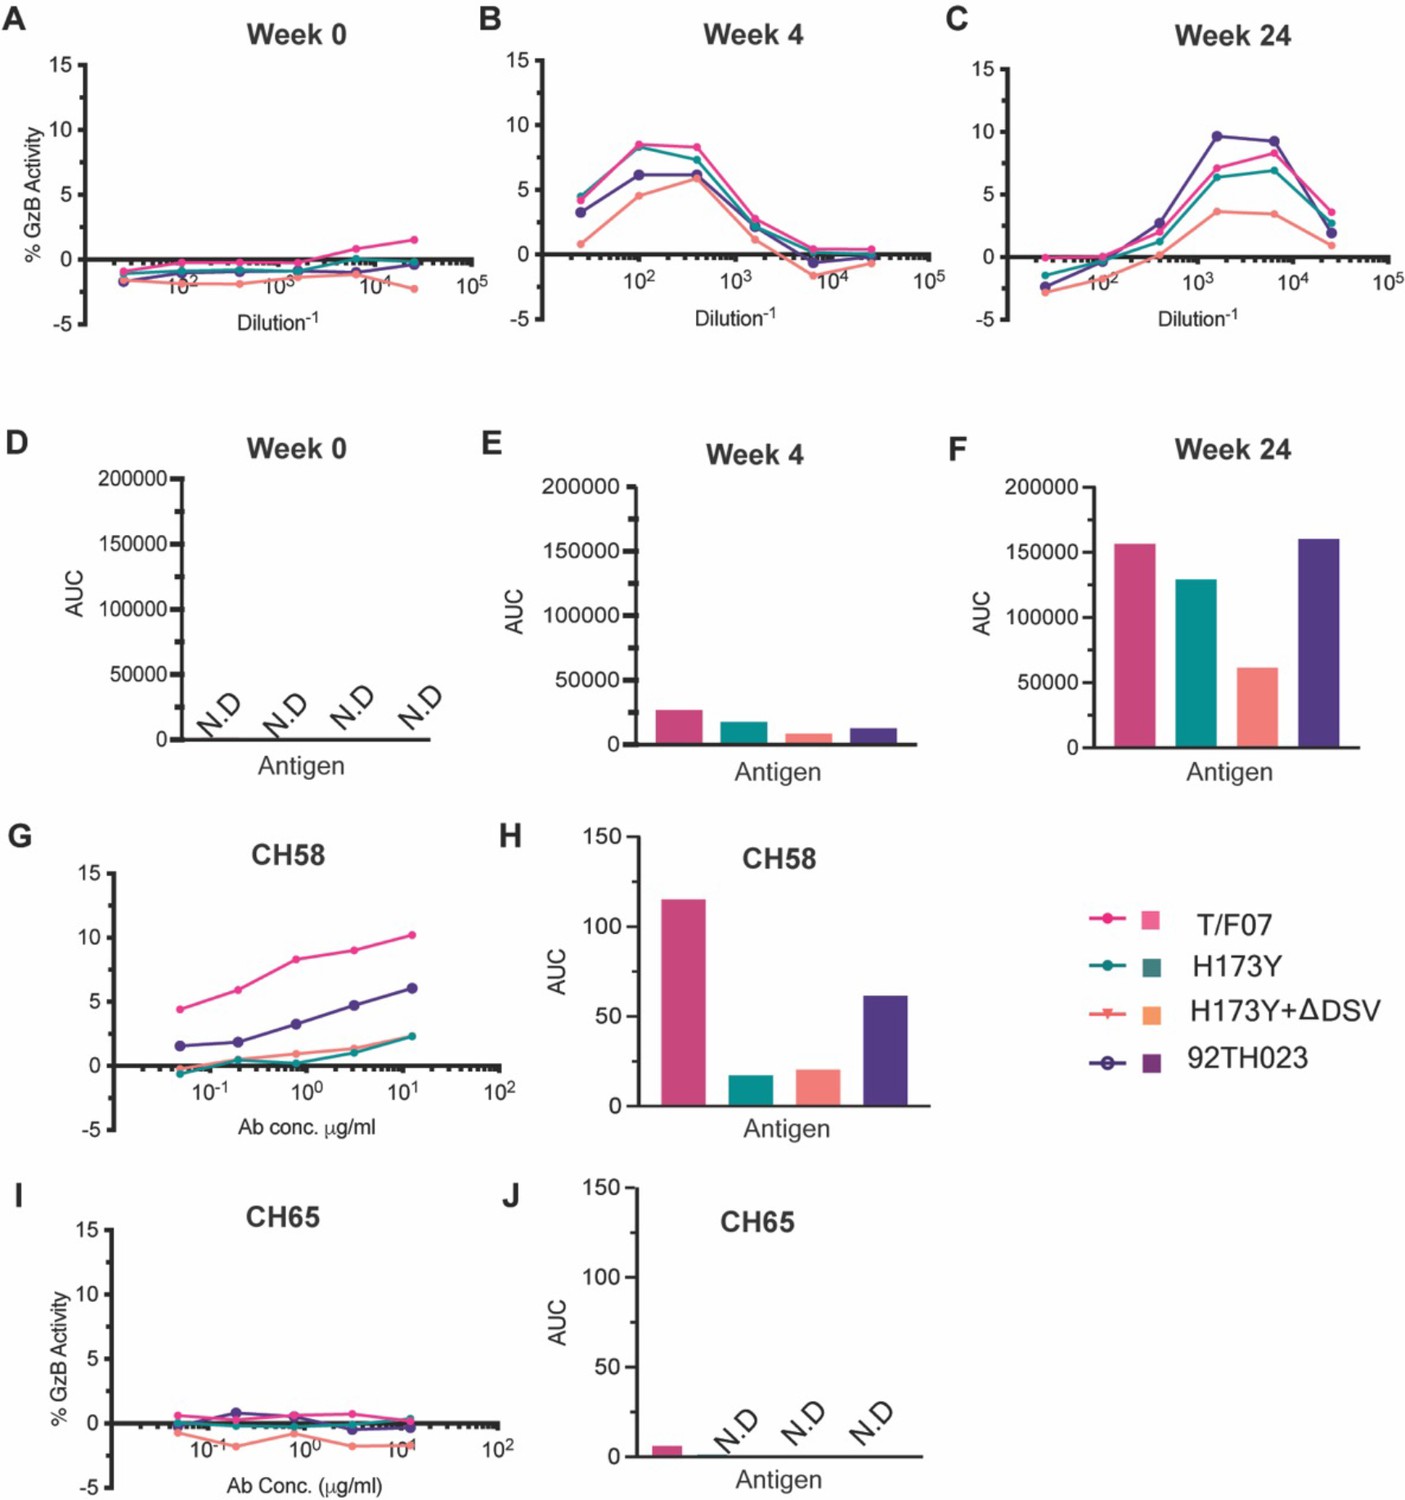
ADCC responses in longitudinal plasma samples of participant 7.
(A–C) ADCC responses at wk 0 (A, pre-infection), 4 wks post-infection (B), 24 wks post-infection (C) of participant 7 plasma samples measured as percentage Granzyme activity (y-axis), against gp120-T/F07 (pink), gp120-H173Y (teal), gp120-H173Y+ΔDSV (orange) and control antigen, gp120-92TH023 (violet) coated target cells. (D–F) The corresponding area under curve (AUC) values for A-C graphs are shown for each curve. (G–J) V2-specific CH58 positive control antibody, (G–H) and Flu-specific CH65 negative control antibody, (I–J) mediated ADCC responses are shown with corresponding AUC values. For CH65 and CH58 mAbs, 4-fold serial dilutions starting at 12.5 µg/ml concentration were used as shown on the x-axis. Participant 7 plasma samples from each visit were 5-fold serially diluted to determine the ADCC responses. N.D is not detected.
-
Figure 4—source data 1
Data used to generate graphs in Figure 4.
- https://cdn.elifesciences.org/articles/92379/elife-92379-fig4-data1-v1.xls
Figure 5 with 1 supplement
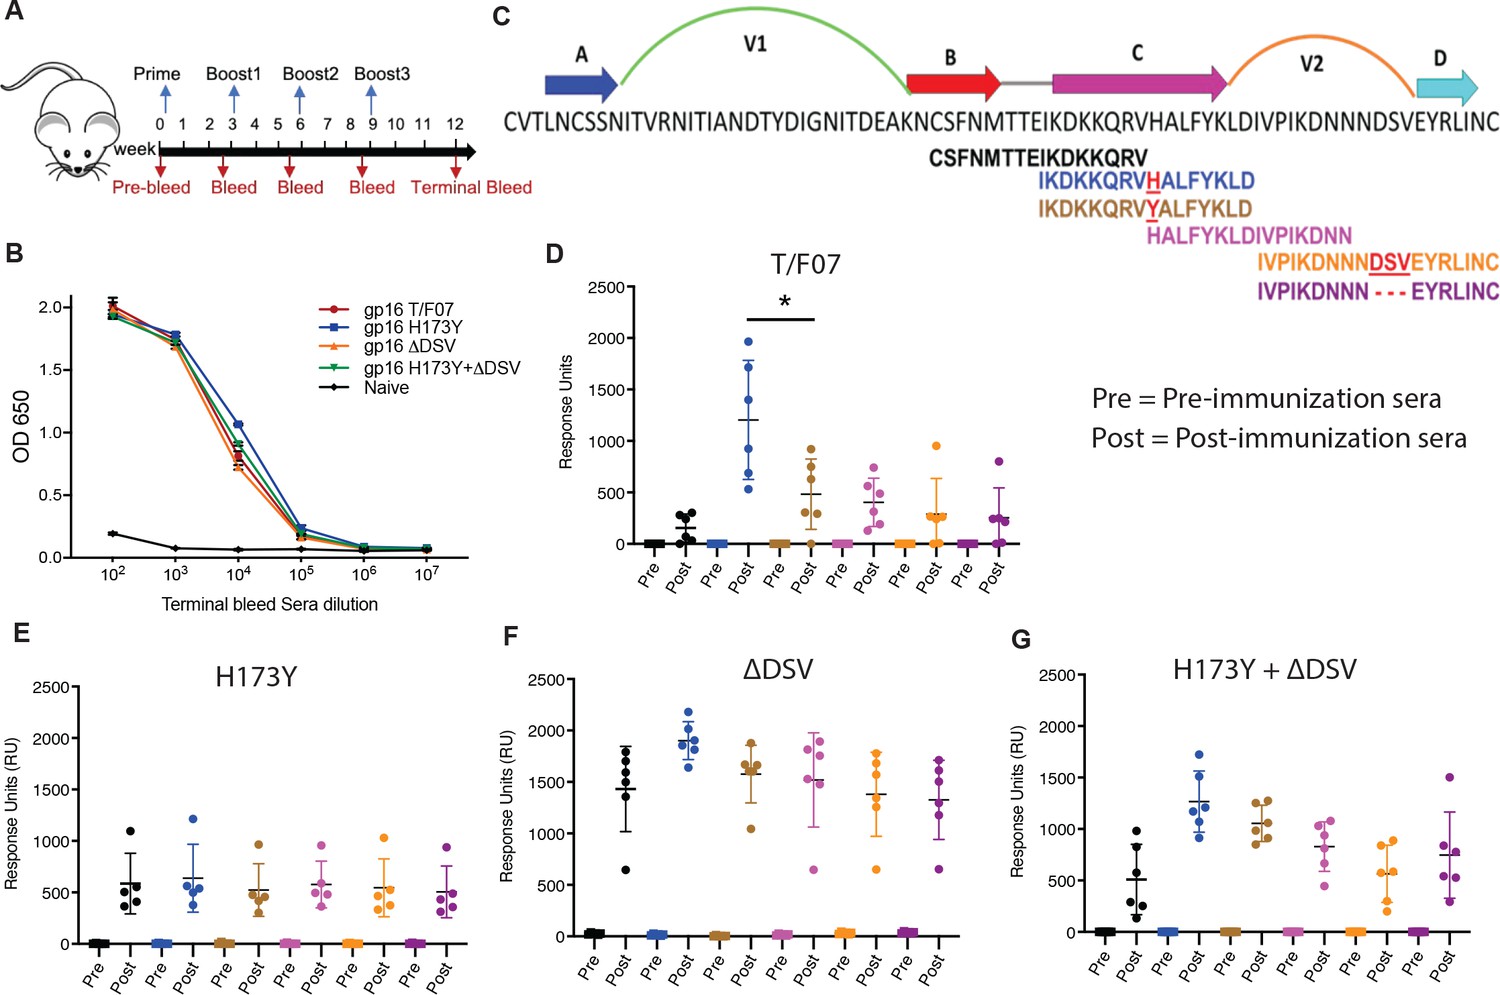
Binding patterns of V1V2 variant-immunized mice sera with overlapping V2-peptides.
(A) Immunization scheme. Prime plus 3-boost immunizations were performed at an interval of three wks. Pre-bleed sera were collected prior to immunizations. (B) V1V2-specific responses in different immunized groups after the last immunization (terminal bleed). Binding curves for each group are color-coded, as shown on the right side of the graph. (C) Schematic showing T/F07-V1V2 sequence labeled on top for A-D β-strands and hypervariable V1 and V2 loops. The overlapping V2 peptides used for SPR binding analysis with immunized mice sera are shown in different colors. (D–G) SPR binding responses shown for gp16-T/F07 (D), gp16-H173Y (E), gp16-ΔDSV (F), gp16-H173Y+ΔDSV (G) groups determined 2 weeks post-immunization (post) of the last boost with specific V2 peptides represented by the corresponding color of the peptides shown in (C). Pre-bleed sera prior to immunization sera were used as negative controls. The assay was performed with four technical replicates. Each dot represents individual mouse sera. The binding signal is estimated as Response Units (RU) shown on the y-axis. p-Value was determined through unpaired t-test, p-value = 0.0252.
-
Figure 5—source data 1
Data used to generate graphs in Figure 5D-G.
- https://cdn.elifesciences.org/articles/92379/elife-92379-fig5-data1-v1.xls
Figure 5—figure supplement 1

V1V2-specific antibody titers.
(A–E) Comparative titers of V1V2 antibodies ranging from the first (prime) to the last immunization (Boost 3) in mice groups immunized with gp16- T/F07 (A) H173Y (B) ΔDSV (C) H173Y+ΔDSV (D), and Naive group (no antigen) (E) are shown. Respective pre-immune sera (collected before first immunization) from each group were also used as negative control. The antibody titers were determined by ELISA. Respective purified recombinant soluble gp140-T/F07, -H173Y, -ΔDSV and -H173Y+ΔDSV Env glycoproteins with matching V1V2 region were used as coating antigens (1 μg/ml). Triplicate absorbance (OD 650 nm) readings are used to generate binding curves for each sample. A color-coded key is provided on the top-right corner for each curve.
Figure 6 with 1 supplement
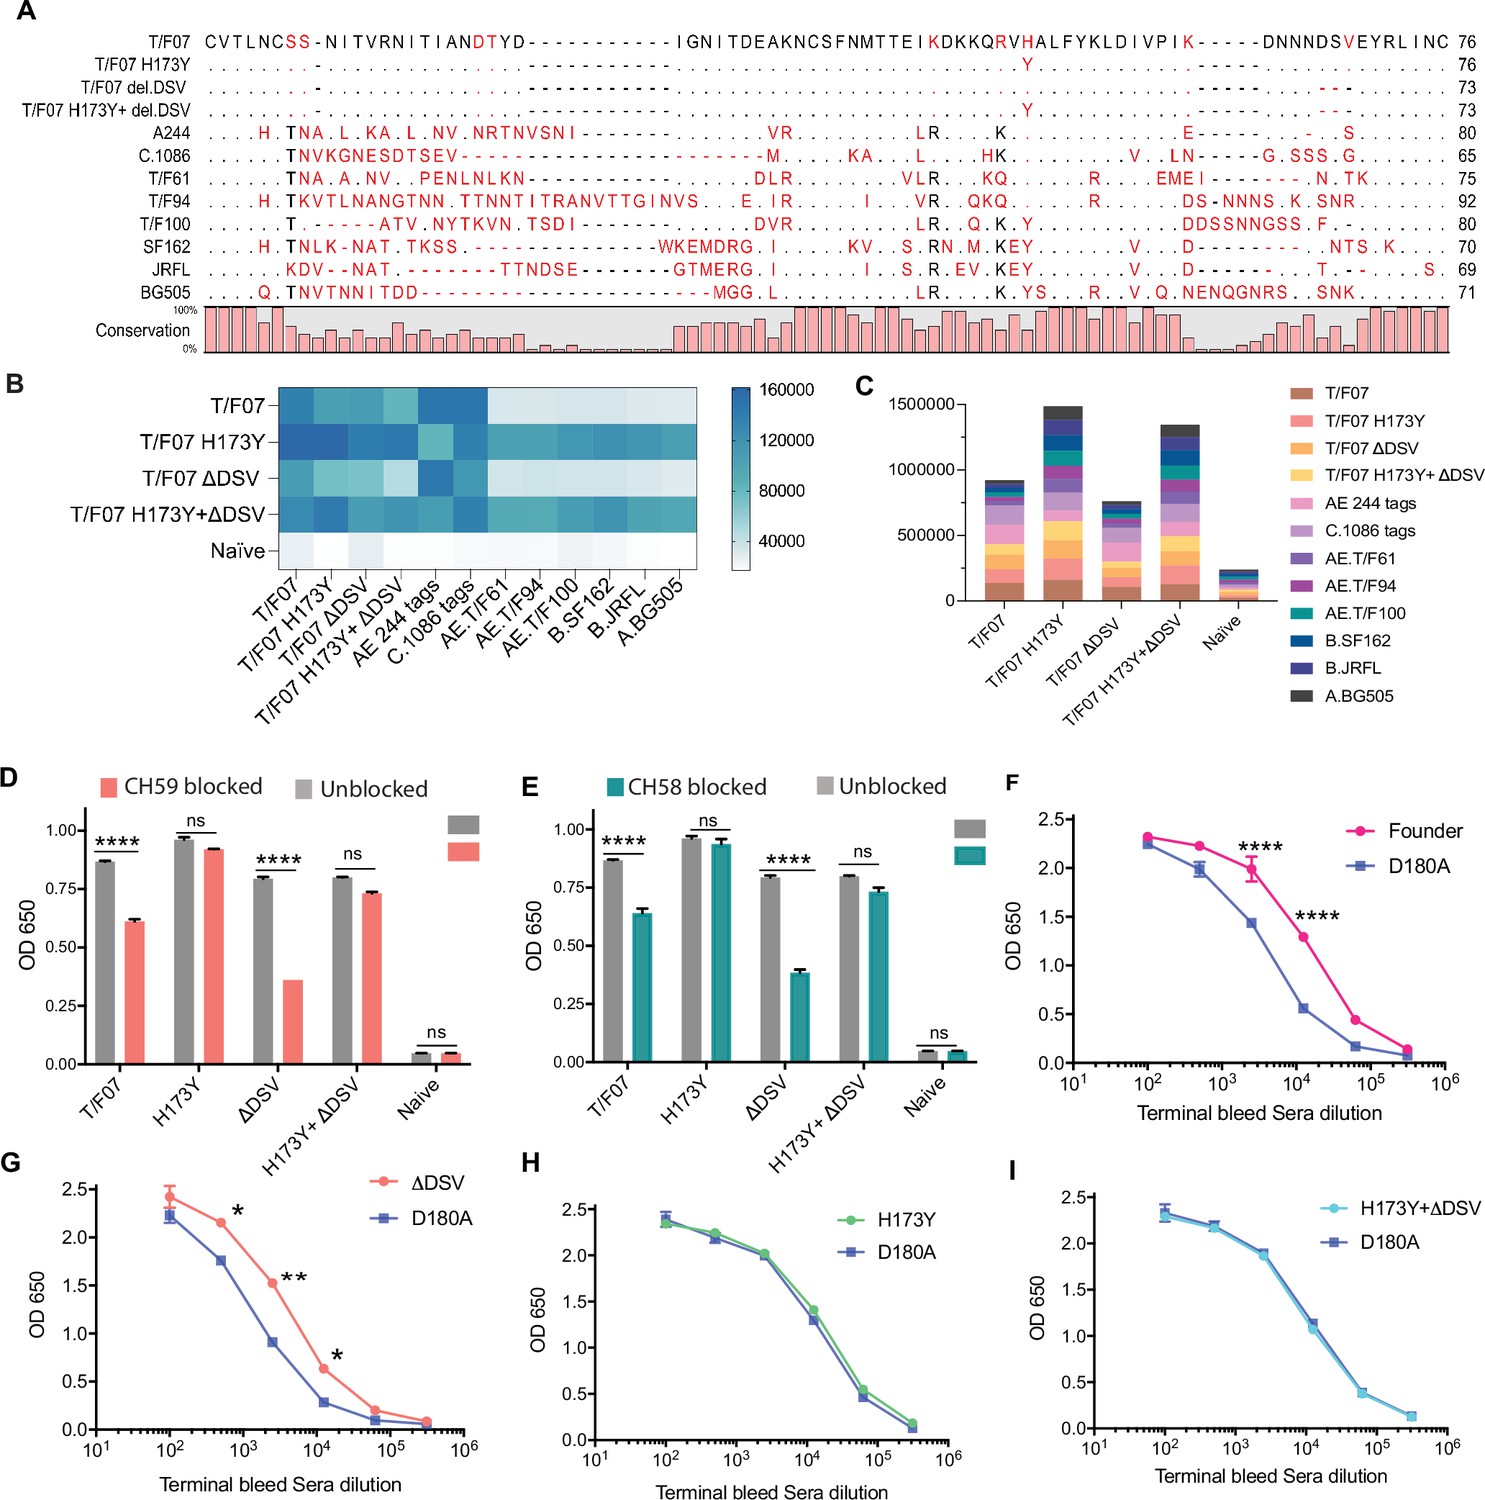
The H173 and Y173 V2-variants induce distinct antibody responses.
(A) Sequence alignment of V1V2 region of all the antigens used in the cross-reactivity ELISA experiment. The sequences are compared with T/F07 V1V2 (top-most) sequence. T/F07 matching residues are shown as dots and different residues are highlighted in red. Difference in the lengths of hypervariable loops is shown by dashed lines (gaps). Degree of conservation is depicted graphically at the bottom of the sequence alignment. (B) Heat-map showing cross-reactivity for each immunized group. The map is generated based on AUC values calculated from the binding curves shown in Figure 6—figure supplement 1 for each immunized group. The antigens used in the binding experiment are labeled horizontally at the bottom of the heat-map. The immunization groups are labeled vertically on the left-side of the heat map. The color gradient scale on the right side shows the degree of reactivity with corresponding numerical values. (C) Cumulative AUC values are plotted to display the summarized or total response of each immunization group towards all the antigens, calculated from the binding curves shown in Figure 6—figure supplement 1. Each antigen is depicted as a small rectangle colored with respect to the key provided at the side of the graph. Binding to each antigen corresponds to the area of rectangle in the bar graph. (D–E) In an antibody blocking assay, significant reduction in sera reactivity was observed in gp140 T/F07 coated wells pre-incubated/blocked with purified mAbs, CH59 (D, orange), and CH58 antibodies (E, teal), for gp16-T/F07 or ΔDSV (H173 variants) but not gp16-H173Y or H173Y+ΔDSV (Y173 variants) immunized mice groups, compared with the unblocked wells (gray). Titrated and optimized sera dilution was used for each group in this assay performed with three technical replicates. (F–I) Sensitivity to D180A mutation. Binding curves showing reactivity of gp16-T/F07 (F), H173Y (G), ΔDSV (H) and H173Y+ΔDSV (I) immunized sera to respective autologous T/F07-gp140 (with matching V2 mutations) coating antigens (color-coded curves) versus T/F07 gp140-D180A mutant (blue curves). Binding is determined by ELISA performed with two technical replicates. Absorbance (OD 650 nm) readings were used to generate binding curves. p-values were determined through unpaired t-test, ****=p < 0.00001, ***=p < 0.0001, **=p < 0.001 and *=p < 0.01.
-
Figure 6—source data 1
Data used to generate graphs in Figure 6B-I.
- https://cdn.elifesciences.org/articles/92379/elife-92379-fig6-data1-v1.zip
Figure 6—figure supplement 1
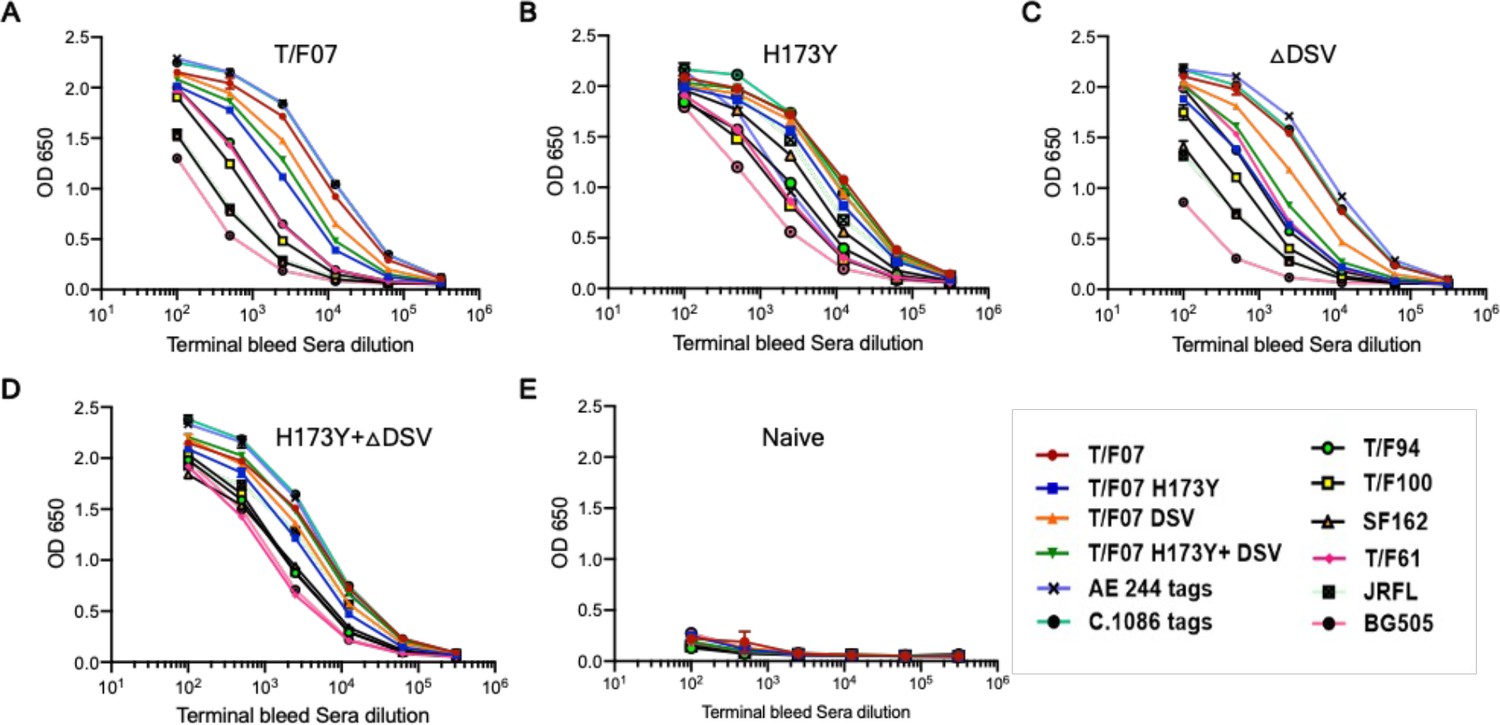
Antibody breadth analysis of the H173 and Y173 V2 variants-immunized mice sera.
(A–E) Breadth was evaluated by assessing binding with a set of purified autologous and heterologous Env proteins (soluble gp140s and V1V2 tags). Respective antigen binding curves are plotted against the serial dilutions of the terminal bleed sera from each group immunized with T/F07 (A), H173Y (B), ∆DSV (C), H173Y+∆DSV (D), and PBS (Naïve, negative control) (E). Binding curves are color-coded with respect to the antigen coated as shown at the bottom right of the graph. The binding was determined through ELISA and duplicate absorbance (OD 650 nm) readings were used to generate the binding curves.
-
Figure 6—figure supplement 1—source data 1
Data used to generate graphs in Figure 6—figure supplement 1.
- https://cdn.elifesciences.org/articles/92379/elife-92379-fig6-figsupp1-data1-v1.xlsx
Figure 7
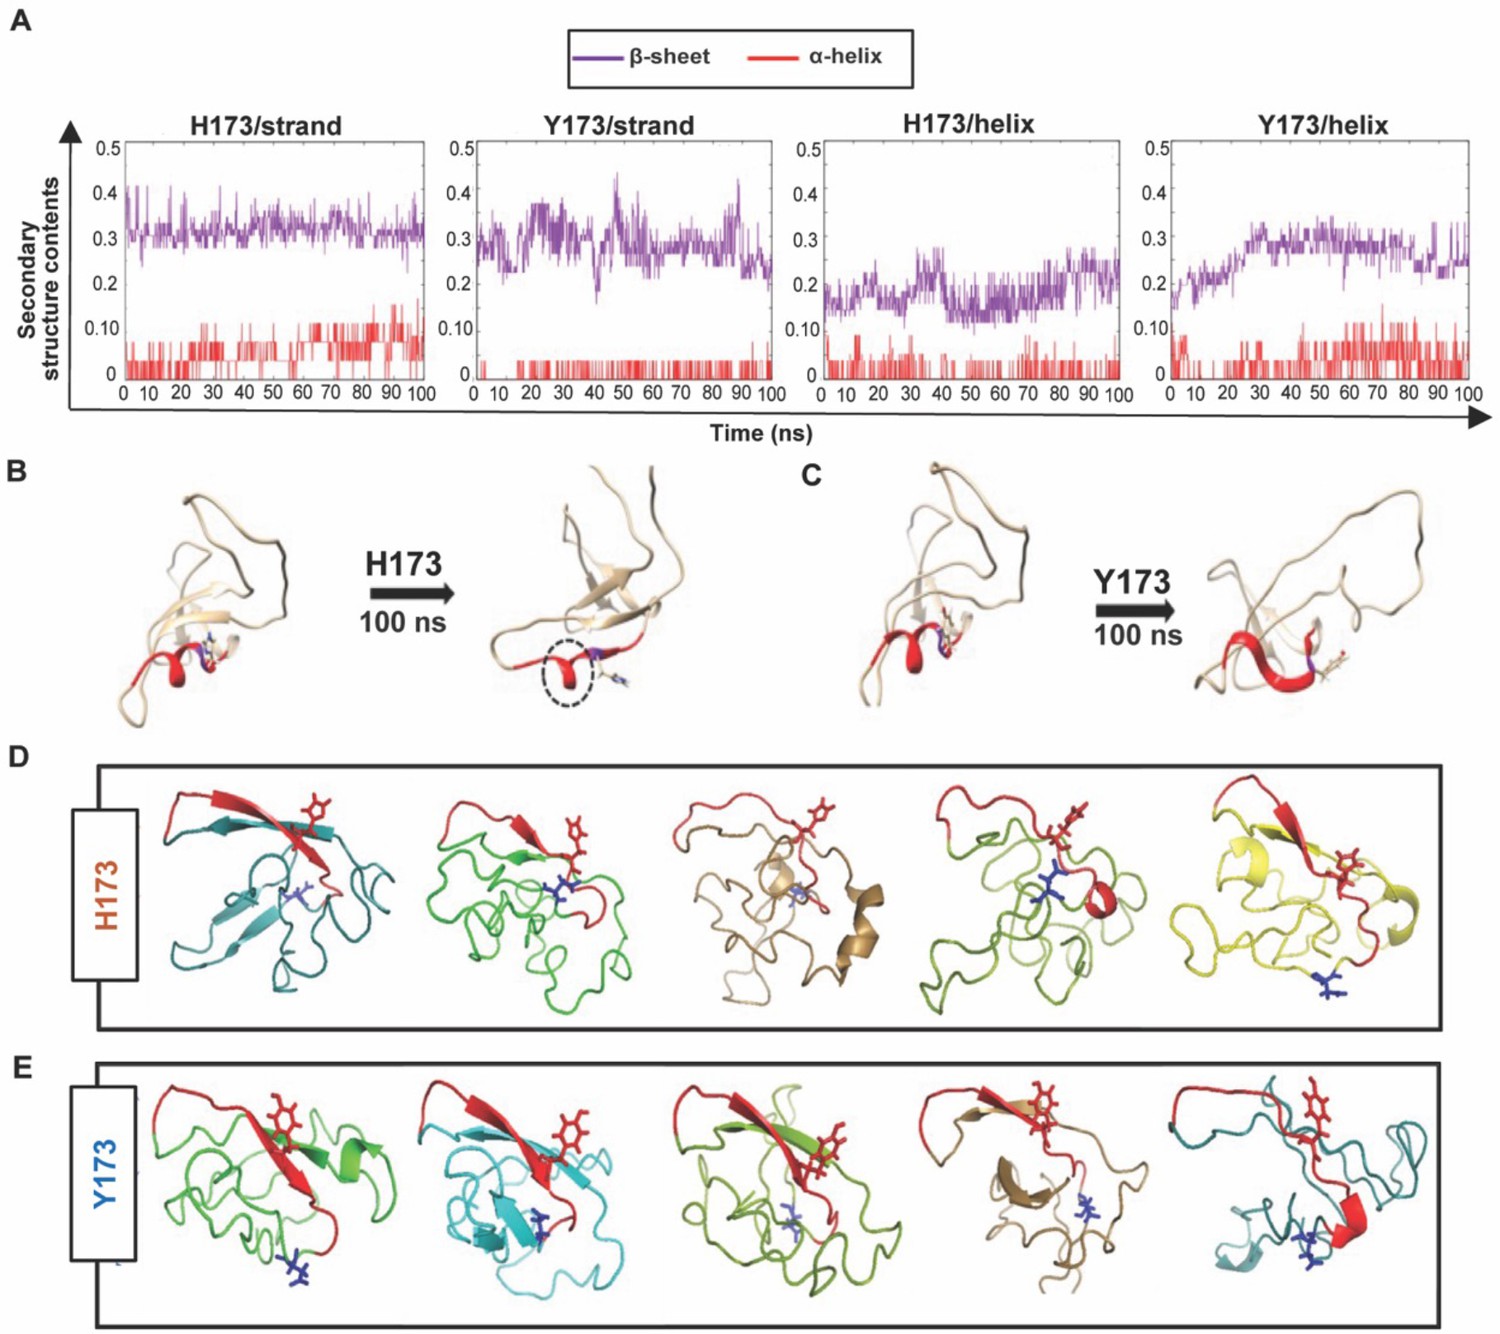
Structural analyses of H173 and Y173 variant V1V2 domains.
(A) Secondary-structure content variation as a function of time in nanoseconds (ns) initiated with V2/strand conformation (left) and V2/helix conformation (right) of H173 and Y173 V1V2 models during MD simulation. The β-sheet content (purple) and α-helix content (red) changes are depicted over the 100 ns time-course of simulation. (B–C) Initial (left) and final (right) structures of the V2/helix trajectory for H173 (B) Y173 (C) V1V2 models. Histidine and tyrosine side chains are shown in the model with C strand highlighted in red. A portion of the helix remains stable (encircled by black dashed lines) at the end of 100 ns simulation time in H173/helix trajectory. (D–E) Ab initio structure modeling of H173 and Y173 variant V1V2 domains. Five models were generated through QUARK modeling tool for H173-V1V2 (D) Y173-V1V2 (E). C strand is colored in red with sidechain shown for residue 173. Sidechain for residue 180 (critical for helix/coil V2-conformation recognizing CH58/59 like antibodies) is shown in blue.
Figure 8 with 4 supplements
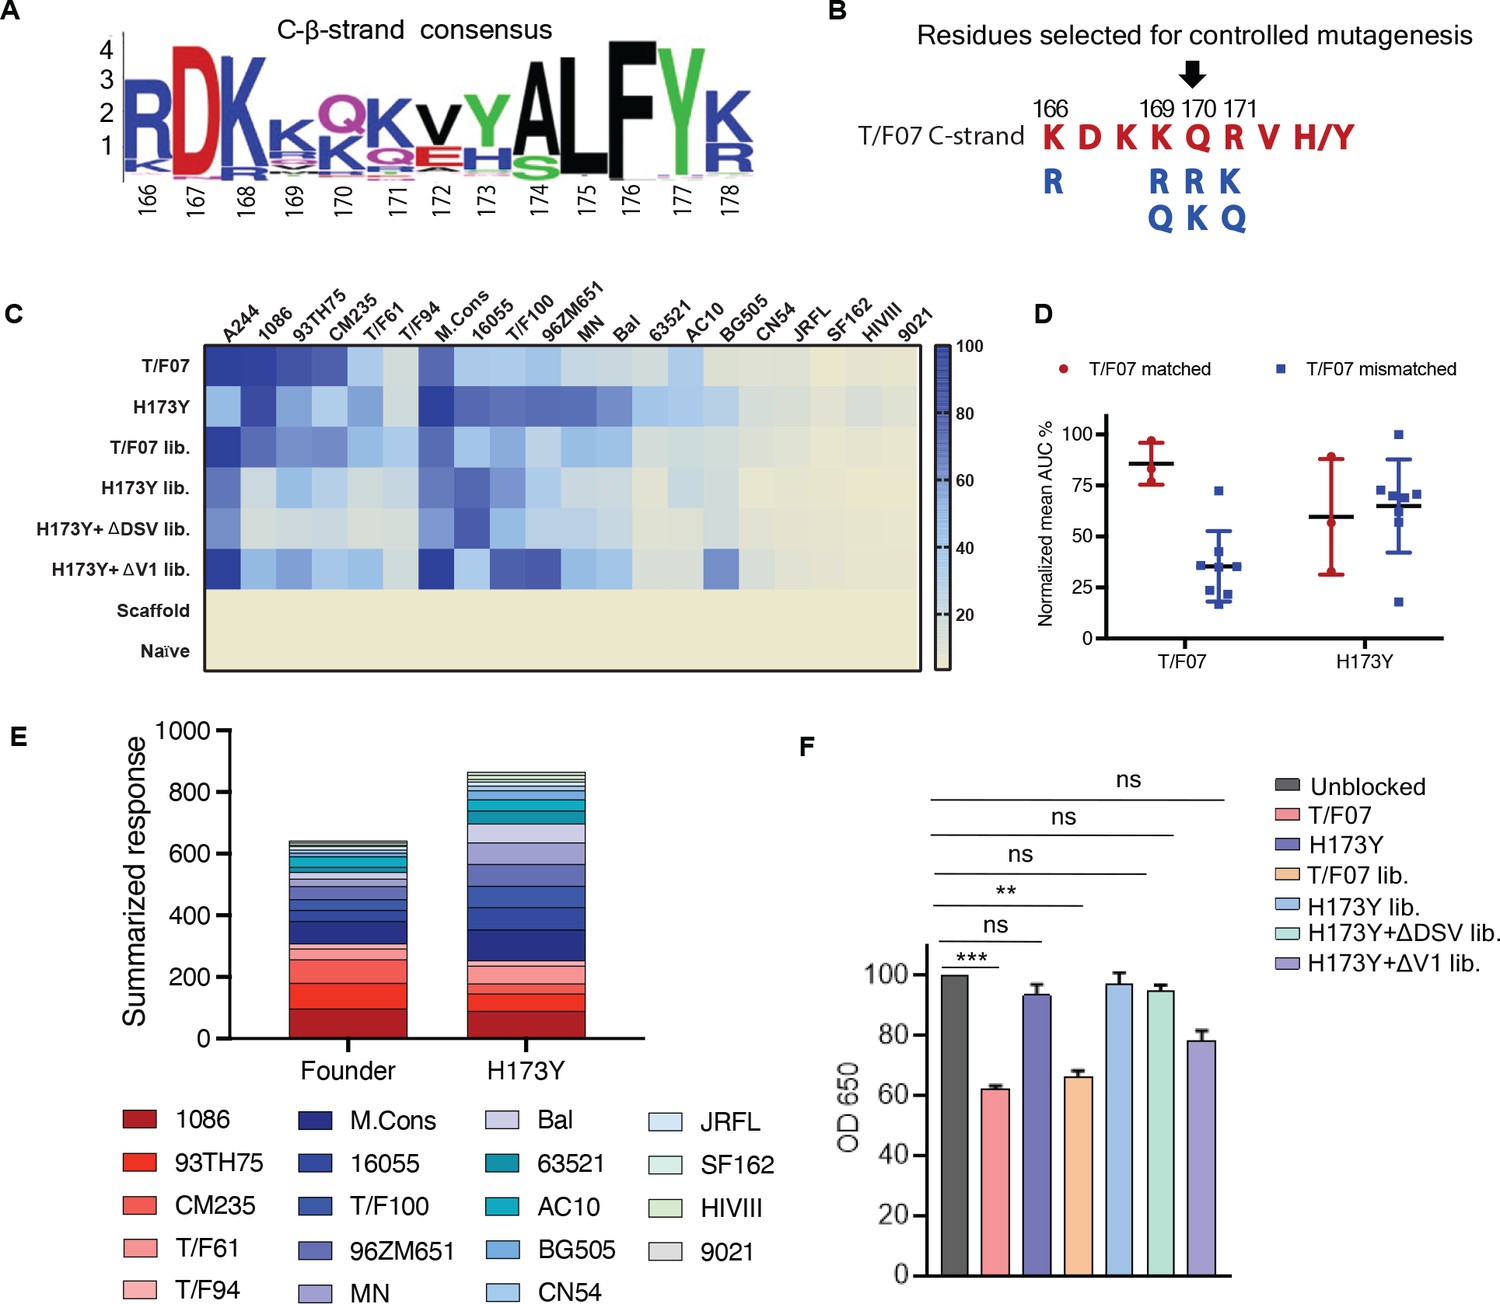
Combinatorial V2-immunogens induce broad antibody responses.
(A) Consensus logo of C β-strand (residue 166–178) of the V1V2 region generated using 100 env sequences each of clades A, B, C, D, and AE. The size of the letter depicting the residue in the logo is proportional to its conservation across viral sequences under analysis. (B) Four highly variable residue positions (166, 169, 170, and 171) were selected for combinatorial mutagenesis with additional substitutions shown in blue to generate V2 combinatorial libraries. (C) Heat-map showing binding of sera from different immunized mice groups to diverse HIV-1 Env antigens. Percent AUC values derived from the binding curves and normalized to autologous antigen binding response were used to generate the heat-map. The antigens used in the binding experiment are labeled horizontally at the top of the heat-map. The immunized mice groups are labeled vertically on the left side of the heat-map. The color gradient scale on the right side shows the degree of reactivity with corresponding AUC percent values. (D) Effect of C strand sequence variation on the binding of T/F07 and H173Y immunized groups’ sera. Scatter plot showing significant difference in the reactivity of gp16-T/F07 but not H173Y immunized sera with Env antigens having C strand sequence closely matching (red circles) versus mismatching (blue squares) to T/F07. Normalized mean AUC (%) values are plotted on the y-axis estimated from the binding curve for each antigen represented as sphere or square in the graph (each circle or square represents different antigen). (E) Cumulative AUC values are plotted for T/F07 and H173Y groups to display the summarized or total response from all the diverse antigens in the library. Each antigen is depicted as a small rectangle colored with respect to the key provided at the bottom of the graph. Binding to each antigen corresponds to the area of rectangle in the bar graph. (F) CH58 antibody blocking assay data. Significant reduction in sera reactivity was observed for T/F07 and T/F07 library groups when gp140 T/F07 coated wells in duplicates were pre-incubated/blocked with purified mAb, CH58 (grey) compared to unblocked (pink). No statistically significant inhibition of binding signal was observed for any H173Y-based immunogen groups. p Values determined using unpaired t-test, **=p < 0.01 and ***=p < 0.001 (significant difference).
-
Figure 8—source data 1
Data used to generate graphs in Figure 8C-E and F.
- https://cdn.elifesciences.org/articles/92379/elife-92379-fig8-data1-v1.zip
Figure 8—figure supplement 1
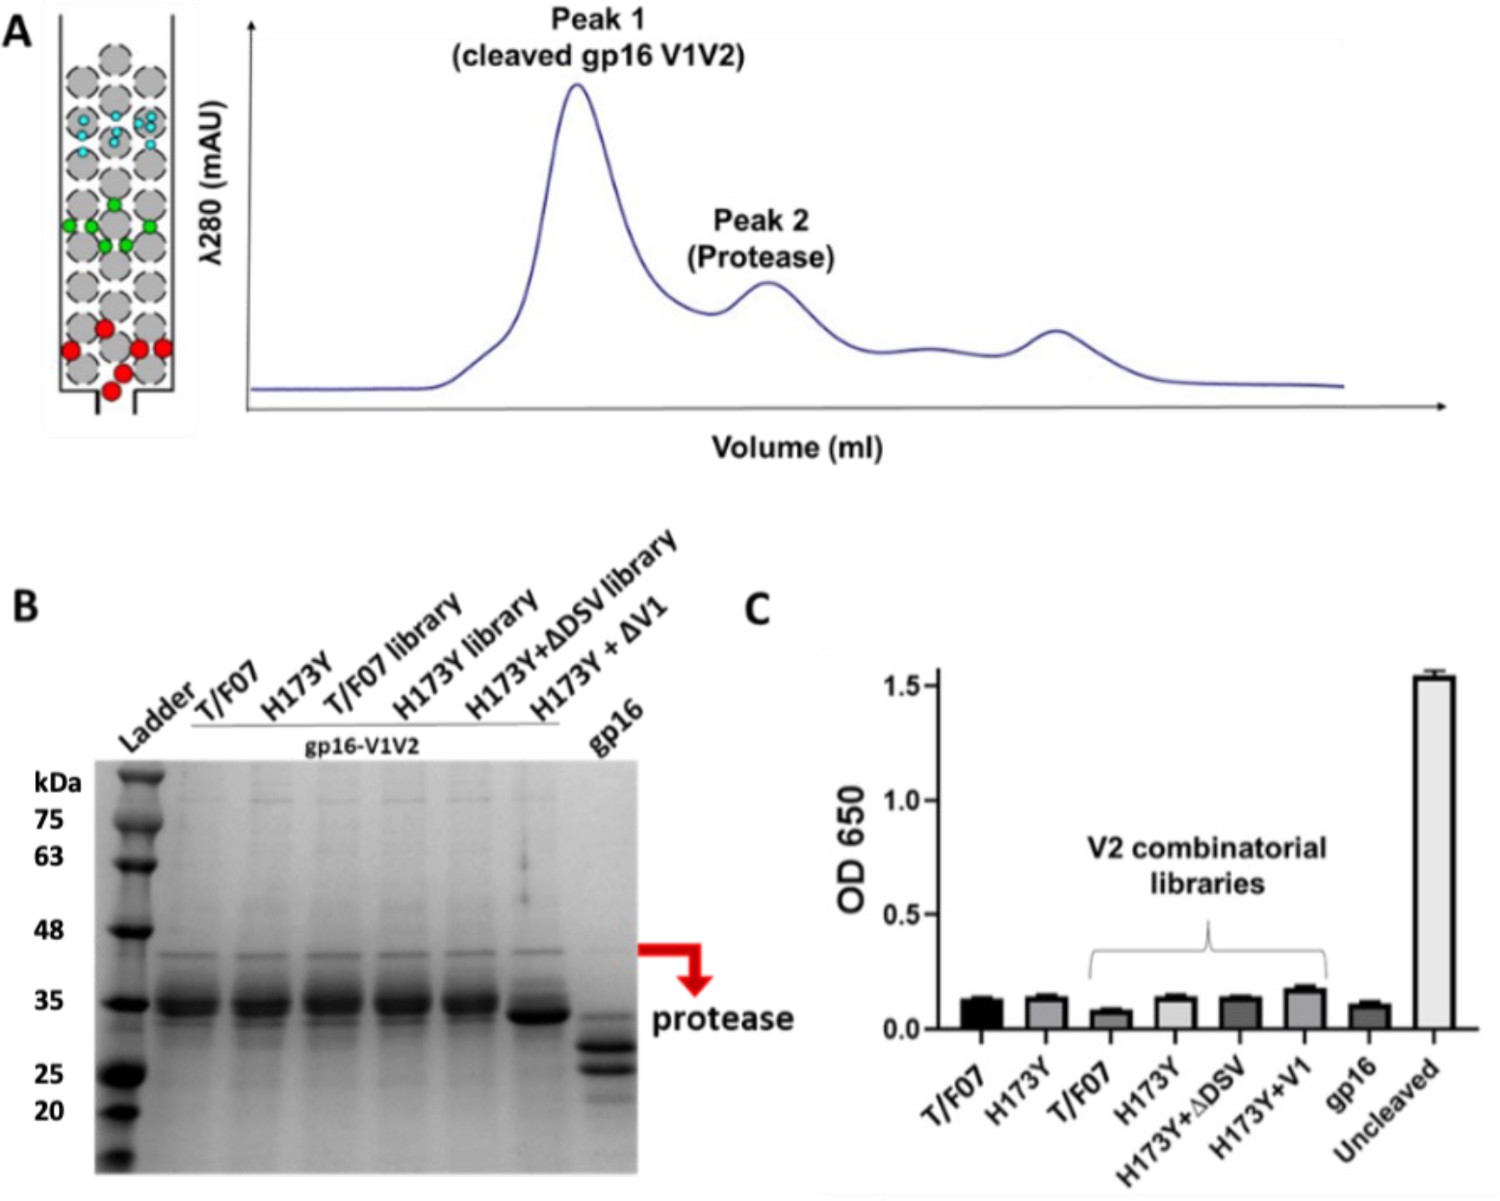
Purification of tag-free V1V2 immunogens.
(A) Size exclusion chromatography (SEC) fractionation profile of cleaved gp16-V1V2 proteins (peak 1) depicting separation of HRV3C protease (peak 2). Elution volume is plotted on the x-axis while the y-axis shows UV absorbance of the fractions. (B) Reducing SDS-PAGE profile of purified and concentrated gp16-V1V2 immunogens. Presence of very small fraction of the protease (marked by a red arrow) was detected. Appearance of smeary pattern or doublet bands are due to the presence of glycoforms. (C) ELISA showed no significant detection of α-StrepTag response in the final preparation of twin StrepTag cleaved immunogens. Uncleaved (with twin-strep tag) gp16-V1V2 was used a positive control.
Figure 8—figure supplement 2

V1V2-specific binding responses in the terminal bleed sera.
V1V2-antibodies were detected in mice groups immunized with buffer (no antigen, Naïve group), gp16-scaffold only (no V1V2 control), gp16-V1V2- T/F07, H173Y, T/F07 library, H173Y library, H173Y+ΔDSV library and H173Y+∆V1 library. A color-coded key is provided on the right side of the graph for each binding curve. Both naive and gp16-scaffold only groups showed no non-specific reactivity toward the coating antigen. The antibody titers are determined through ELISA done with two technical replicates. Respective purified recombinant soluble gp140-T/F07, -H173Y, -ΔDSV, -H173Y+ΔDSV, and –H173Y+∆V1 Env glycoproteins were used as coating antigens (1 μg/ml) matching the V1V2 region (parental template mutations for combinatorial libraries). Absorbance (OD 650 nm) readings are used to generate the binding curves.
-
Figure 8—figure supplement 2—source data 1
Data used to generate graph in Figure 8—figure supplement 2.
- https://cdn.elifesciences.org/articles/92379/elife-92379-fig8-figsupp2-data1-v1.xlsx
Figure 8—figure supplement 3
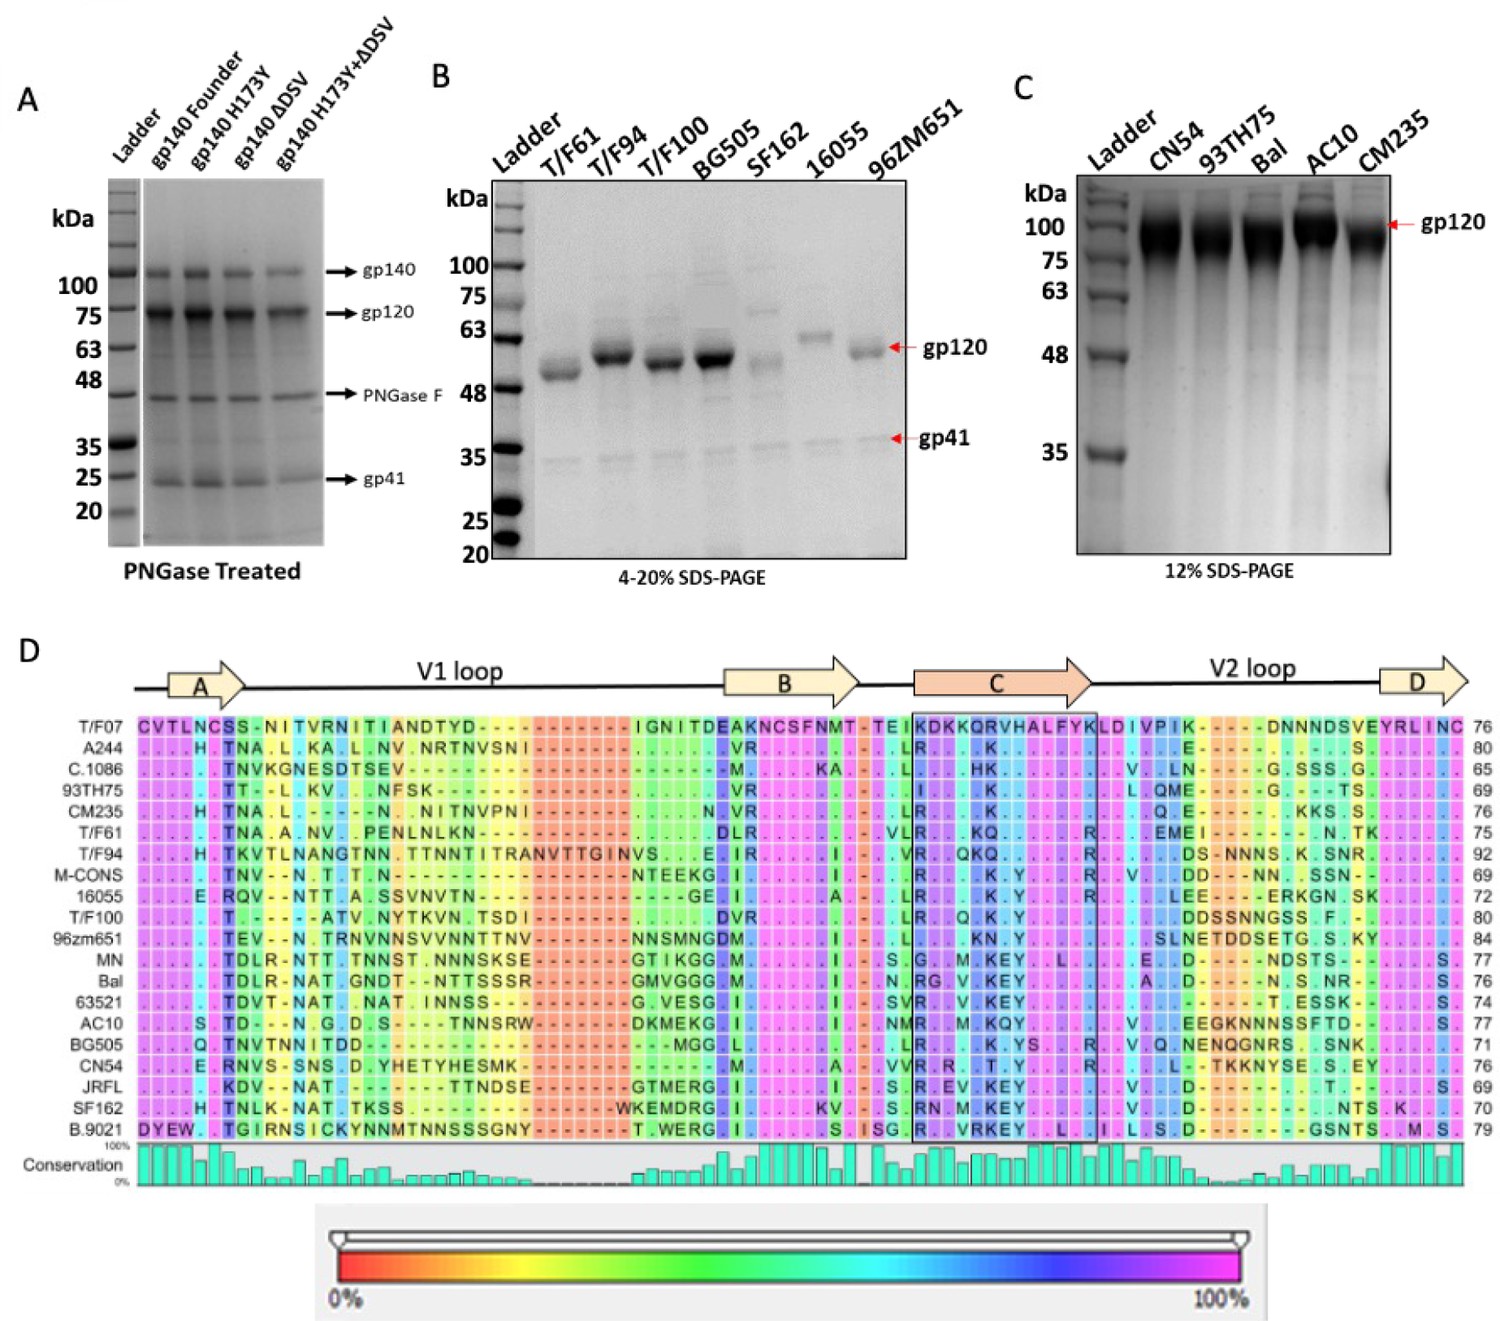
Recombinant construction and purification of diverse HIV-1 Env proteins to determine cross-reactive responses and breadth.
(A–C) Reducing SDS-PAGE profile of GnTi-expressed recombinant His-tagged Env proteins, gp140-T/F07 (Founder) and its V2 mutants (A); gp140s (cleaved into gp120 and gp41 subunits) (B); and gp120s (C) of different HIV-1 subtypes used as heterologous Env antigens. (D) V1V2 sequences of the diverse HIV-1 subtypes included in the heterologous Env protein library used to determine breadth. Degree of conservation (0–100%) at each residue position is depicted graphically at the bottom of the alignment. Variability in the V1V2 region of the chosen Env antigens is shown with background color gradient (red to pink) showing conservation on a scale of 0–100%.
Figure 8—figure supplement 4
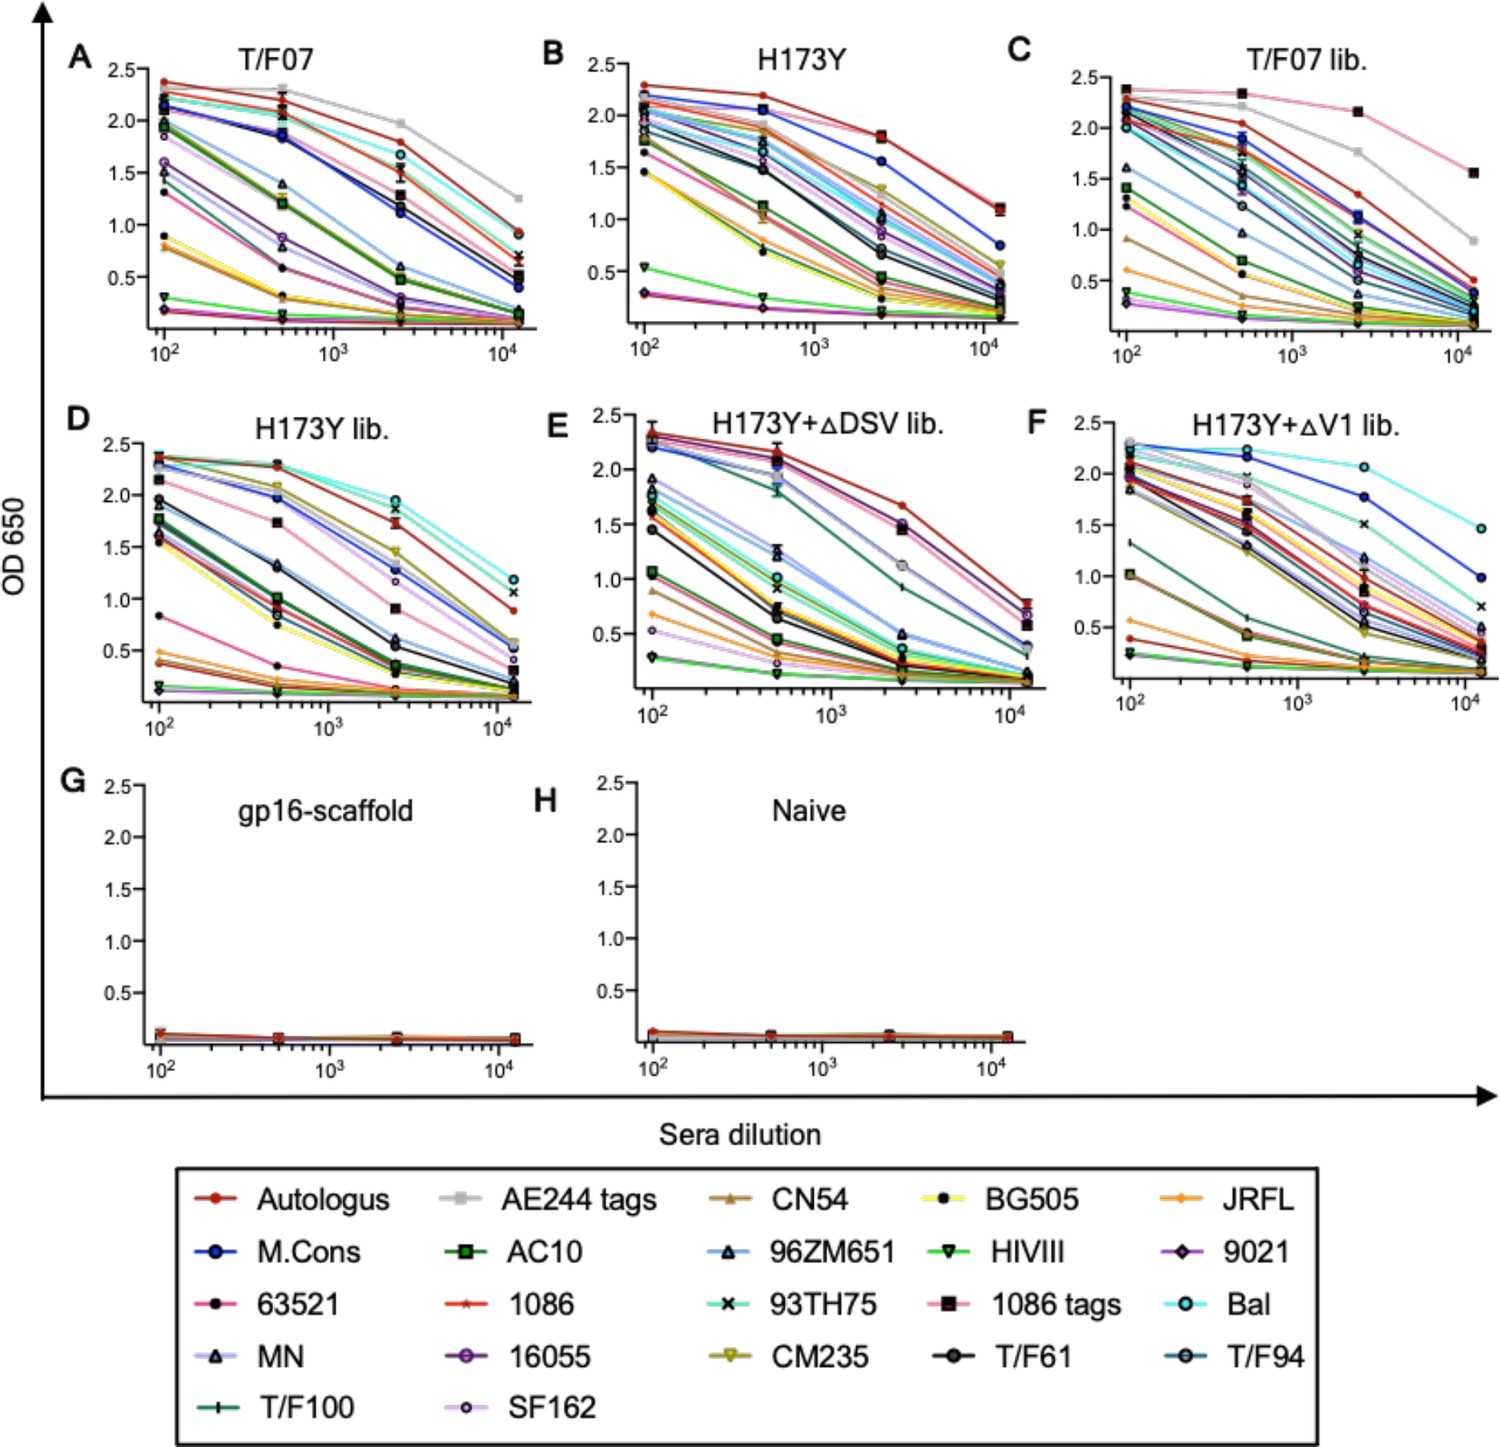
Breadth analysis of V2 combinatorial library immunogens using heterologous Env antigen library.
(A–H) ELISA generated binding curves showing the reactivity of sera of mice groups immunized with T/F07 (A) H173Y (B) and combinatorial V2 libraries (lib.); (C) T/F07 (D) H173Y (E) H173Y+∆DSV (F) H173Y+∆V1 groups (G) gp16-scaffold (H) and Naive (I) groups sera were used as negative controls. The experiments were performed with five fold serially diluted pooled sera from each group with duplicate wells. Curves are color-coded for the respective antigen as shown in the box at the bottom.
-
Figure 8—figure supplement 4—source data 1
Data used to generate graphs in Figure 8—figure supplement 4.
- https://cdn.elifesciences.org/articles/92379/elife-92379-fig8-figsupp4-data1-v1.xlsx
Tables
Table 1
List of reagents obtained from the NIH Reagent Program.
| Catalog # | Description |
|---|---|
| 4961 | HIV-1 BaL gp120 recombinant protein |
| 7749 | HIV-1 CN54 gp120 recombinant protein |
| 10080 | HIV-1 96ZM651 gp120 recombinant protein |
| 11556 | HIV-1 JR-CSF Fc-gp120 recombinant protein |
| 11784 | HIV-1 IIIB gp120 recombinant protein |
| 12063 | HIV-1 UG037 gp140 recombinant protein |
| 12064 | HIV-1 CN54 gp140 recombinant protein |
| 12569 | AE.A244 D11 gp120 recombinant protein |
| 12570 | B.MN D11 gp120 recombinant protein |
| 12571 | B.9021 D11gp120 recombinant protein |
| 12572 | B.6240 gp140C recombinant protein |
| 12574 | B.63521 D11 gp120 mutC recombinant protein |
| 12576 | M.CON-S D11 gp120 recombinant protein |
| 12581 | C.1086 gp140C recombinant protein |
| 13055 | HIV-1 AC10.29 gp120 Avi His recombinant protein |
| 13342 | HIV-1 93TH975 gp120 recombinant protein |
| 12567 | HIV-1 Env V1V2 recombinant protein (AE.A244 V1V2 tags) |
| 12568 | HIV-1 Env V1V2 recombinant protein (C.1086 V1V2 tags) |
| 8660 | HIV-1 96ZM651.8 gp140 optimized expression vector |
| 12806 | HIV-1 CM235 gp120 expression vector |
| 12957 | HIV-1 AC10.29 gp120 Avi His optimized expression vector |
| 13348 | HIV-1 BaL gp120 His expression vector |
| 13349 | HIV-1 93TH975 gp120 His expression vector |
| 13350 | HIV-1 CN54 gp120 His expression vector |
| 12551 | CH59 mAb |
| 12550 | CH58 mAb |
Additional files
Download links
A two-part list of links to download the article, or parts of the article, in various formats.
Downloads (link to download the article as PDF)
Open citations (links to open the citations from this article in various online reference manager services)
Cite this article (links to download the citations from this article in formats compatible with various reference manager tools)
A remarkable genetic shift in a transmitted/founder virus broadens antibody responses against HIV-1
eLife 13:RP92379.
https://doi.org/10.7554/eLife.92379.3


