Haplotype function score improves biological interpretation and cross-ancestry polygenic prediction of human complex traits
- Shanghai Mental Health Center, Shanghai Jiao Tong University School of Medicine, School of Bioengineering, Shanghai Jiao Tong University, China
- Bio-X Institutes, Key Laboratory for the Genetics of Developmental and Neuropsychiatric Disorders (Ministry of Education), Collaborative Innovation Center for Brain Science, Shanghai Jiao Tong University, China
- Biomedical Sciences Institute of Qingdao University (Qingdao Branch of SJTU Bio-X12 Institutes), Qingdao University, China
Figures
Figure 1 with 3 supplements
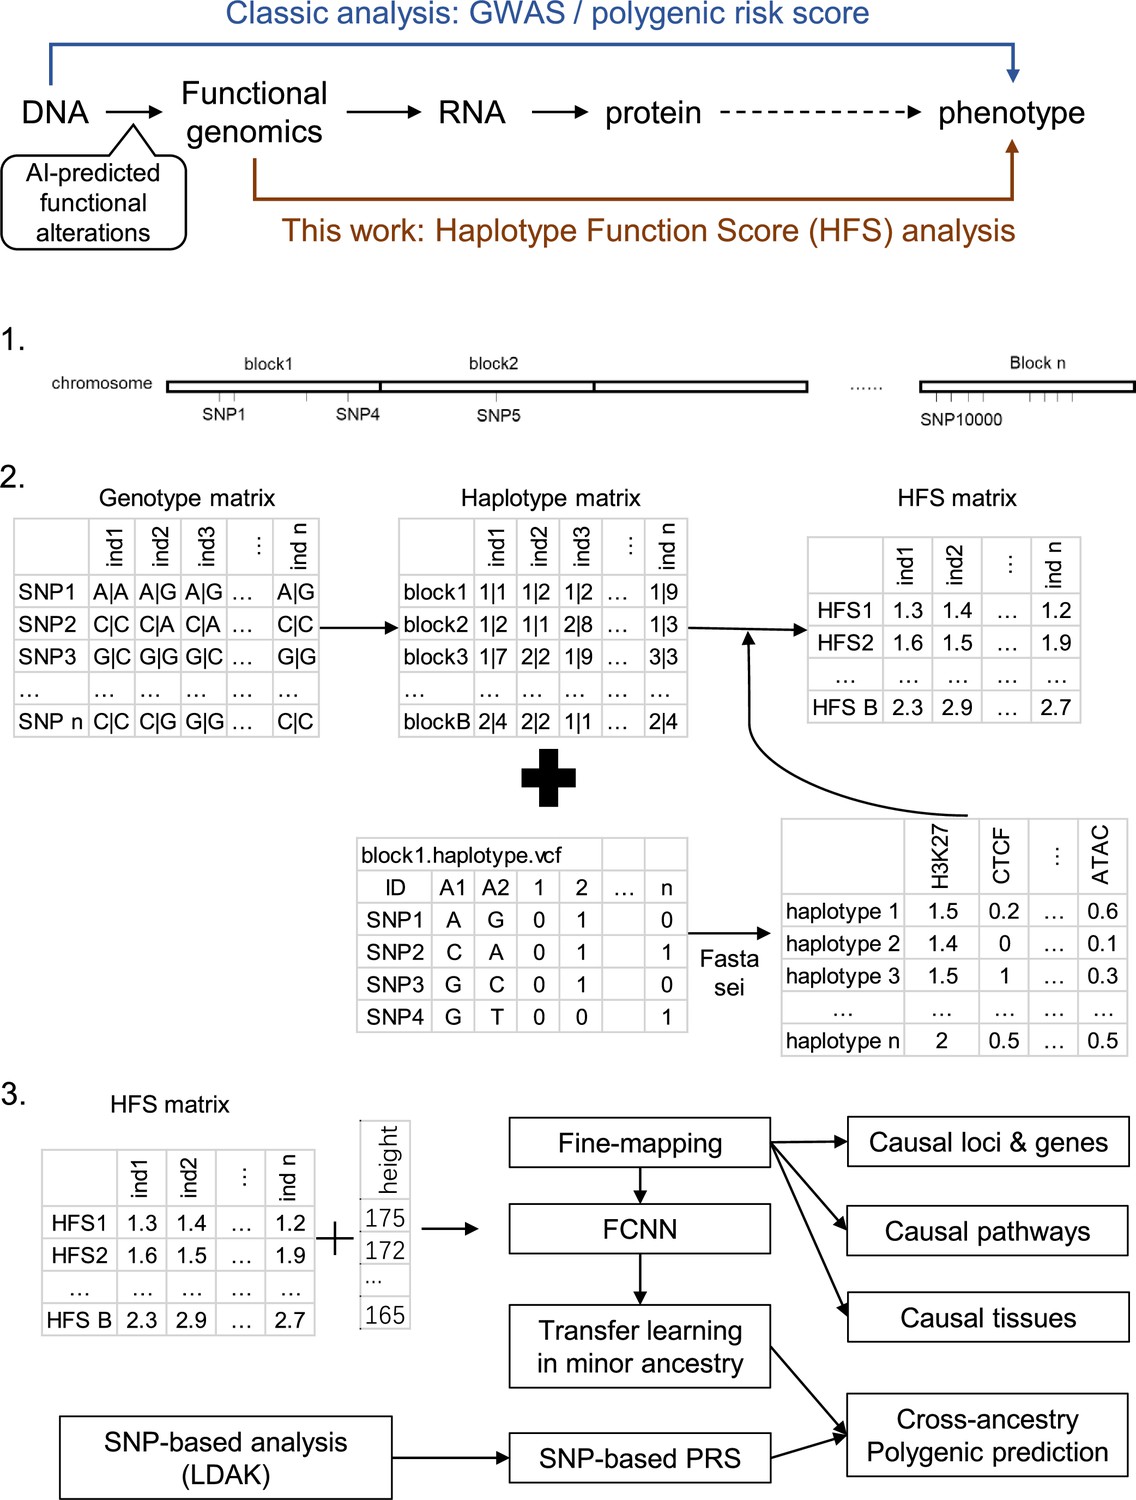
Flowchart of the study.
Ind: individual.
Figure 1—figure supplement 1

Distribution of number of haplotypes per locus.
Figure 1—figure supplement 2

Linkage disequilibrium (LD) among Haplotype Function Score (HFS).
(A) Distribution of R2 of HFS from adjacent loci. (B) Comparison of R2 of adjacent loci HFS (y-axis) and median LD of SNP from the same adjacent loci (x-axis). (C) Same as B, but y-axis corresponded to HFS without rare variants.
Figure 1—figure supplement 3

Comparison of inflation factor between Haplotype Function Score (HFS) and SNP association tests.
Lambda: genomic control inflation factors, defined as the median chi-squared statistics of all tested variables divided by 0.476.
Figure 2 with 1 supplement
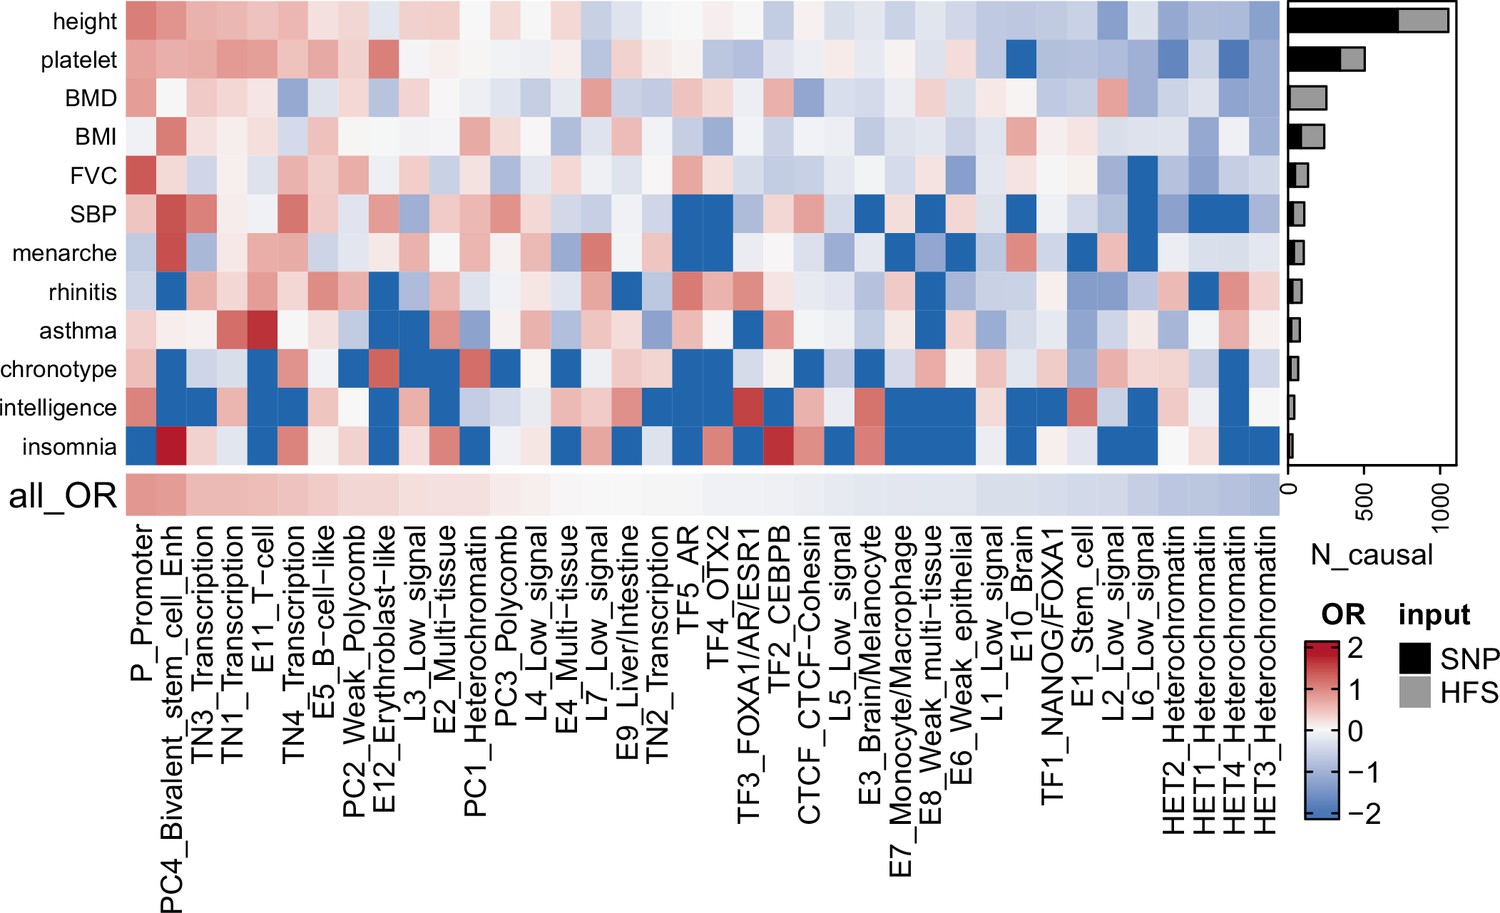
Fine-mapping result summary.
Gray bar plots indicated the number of loci with posterior inclusion probability (PIP) >0.95 in Haplotype Function Score (HFS) + SUSIE (causal loci). Black bar plots indicated number of SNP with PIP >0.95 in PolyFun or SbayesRC analysis (the larger number was shown). Each grid of heatmap showed the odds ratio of each sequence class loci being causal loci for each trait. ‘All_OR’ indicated odds ratio for pooling all traits together. Enh: enhancer. TF: transcription factor-binding site.
Figure 2—figure supplement 1

Heritability enrichment within causal loci estimated Linkage Disequilibrium Score regression (LDSC).
Causal loci: loci with posterior inclusion probability (PIP) >0.95. Control loci: nearest locus of a causal locus that reached the same p-value level. R2_enrich: proportion of heritability divided by proportion of SNP. Meta: inverse variance-weighted heritability enrichment of test traits. Error bar indicated 95% confidence interval.
Figure 3
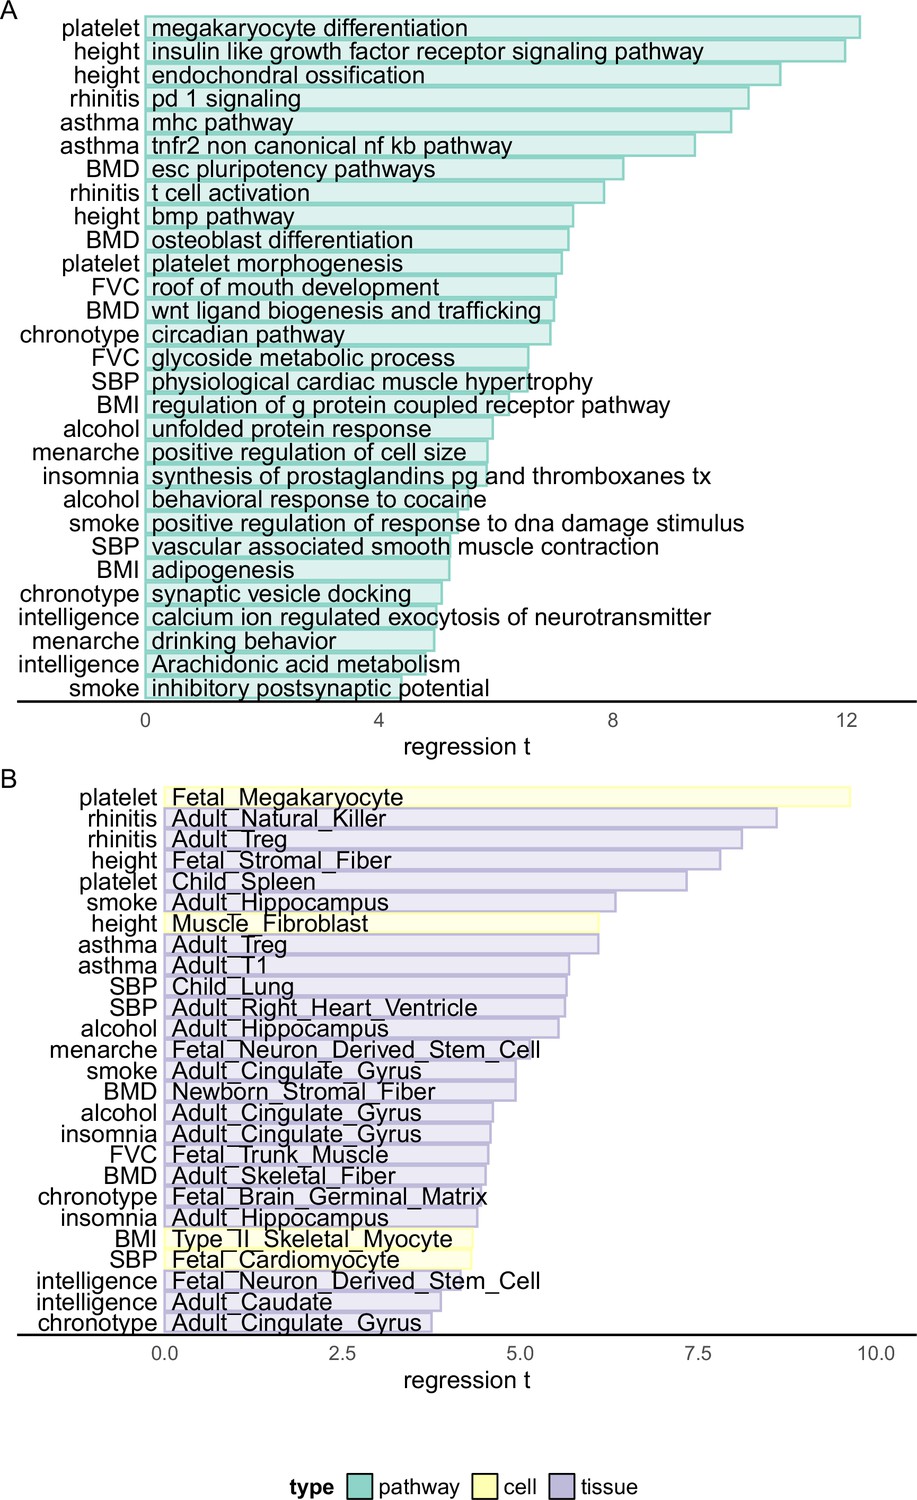
Biological enrichment analysis based on Haplotype Function Score (HFS) fine-mapping.
x-axis indicated t statistics of the analyzed term in a multivariate linear regression (Method). Cell: single-cell ATAC peak for 222 cell types from Zhang et al., 2021a. Tissue: active chromatin regions of 222 tissues from epimap (Boix et al., 2021). For each trait, we showed the most significant term plus one or two terms with high biological interpretation that also passed significance threshold. Full enrichment result is shown in Supplementary file 1g and Supplementary file 1h.
Figure 4 with 2 supplements
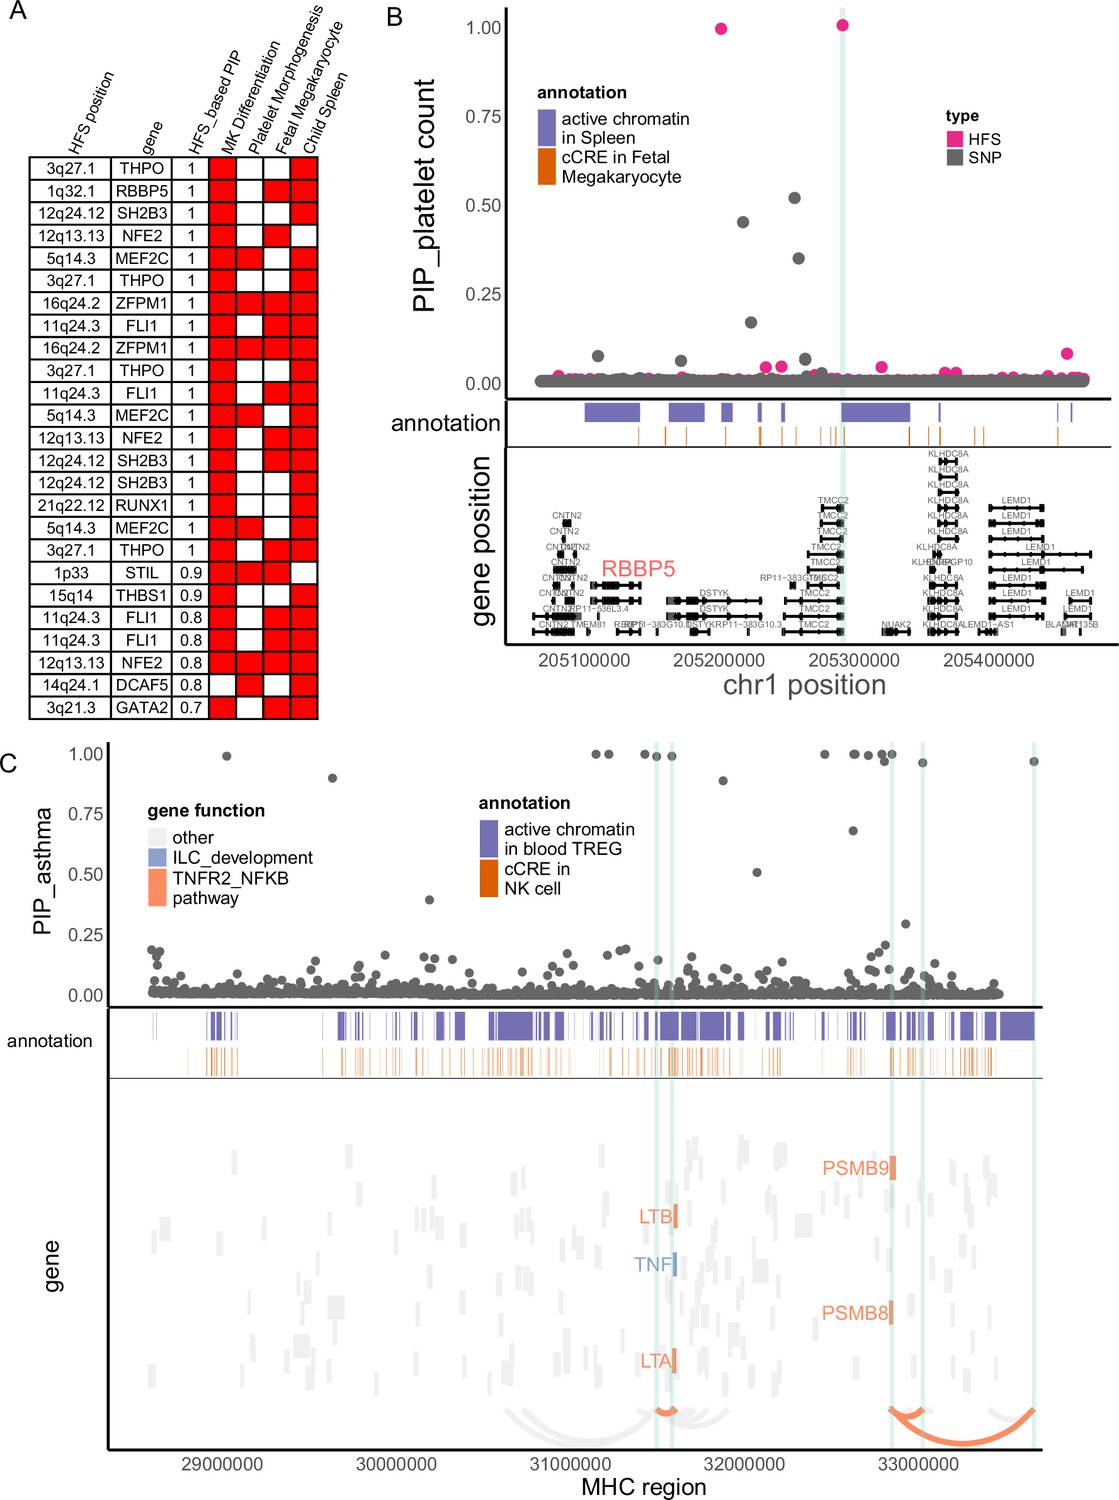
Haplotype Function Score (HFS) linked trait to causal genes.
(A) Target genes of causal loci identified by HFS + SUSIE for platelet count. Only genes that showed functional convergence were shown. (B) Regional plot for RBBP5. HFS: loci posterior inclusion probability (PIP) calculated by HFS + SUSIE. SNP: SNP PIP calculated by PolyFun. cCRE: credible cis-regulation elements. (C) Regional plot of major histocompatibility complex (MHC) region for asthma. Thickened curve linked highlighted causal loci to its target genes predicted by cS2G (Gazal et al., 2022).
Figure 4—figure supplement 1

p-value comparison within RBBP5 region between Haplotype Function Score (HFS) and SNP association test.
x-axis: Same chromosome region as Figure 4. Each black point represented a SNP, its y-axis represented REGENIE genome-wide association studies (GWAS) p-value. Each pink point represented a locus, its y-axis represented its p-value for HFS association test with platelet count.
Figure 4—figure supplement 2

Locus analysis for allergic diseases.
Similar to Figure 4C, but for other allergic diseases.
Figure 5 with 1 supplement
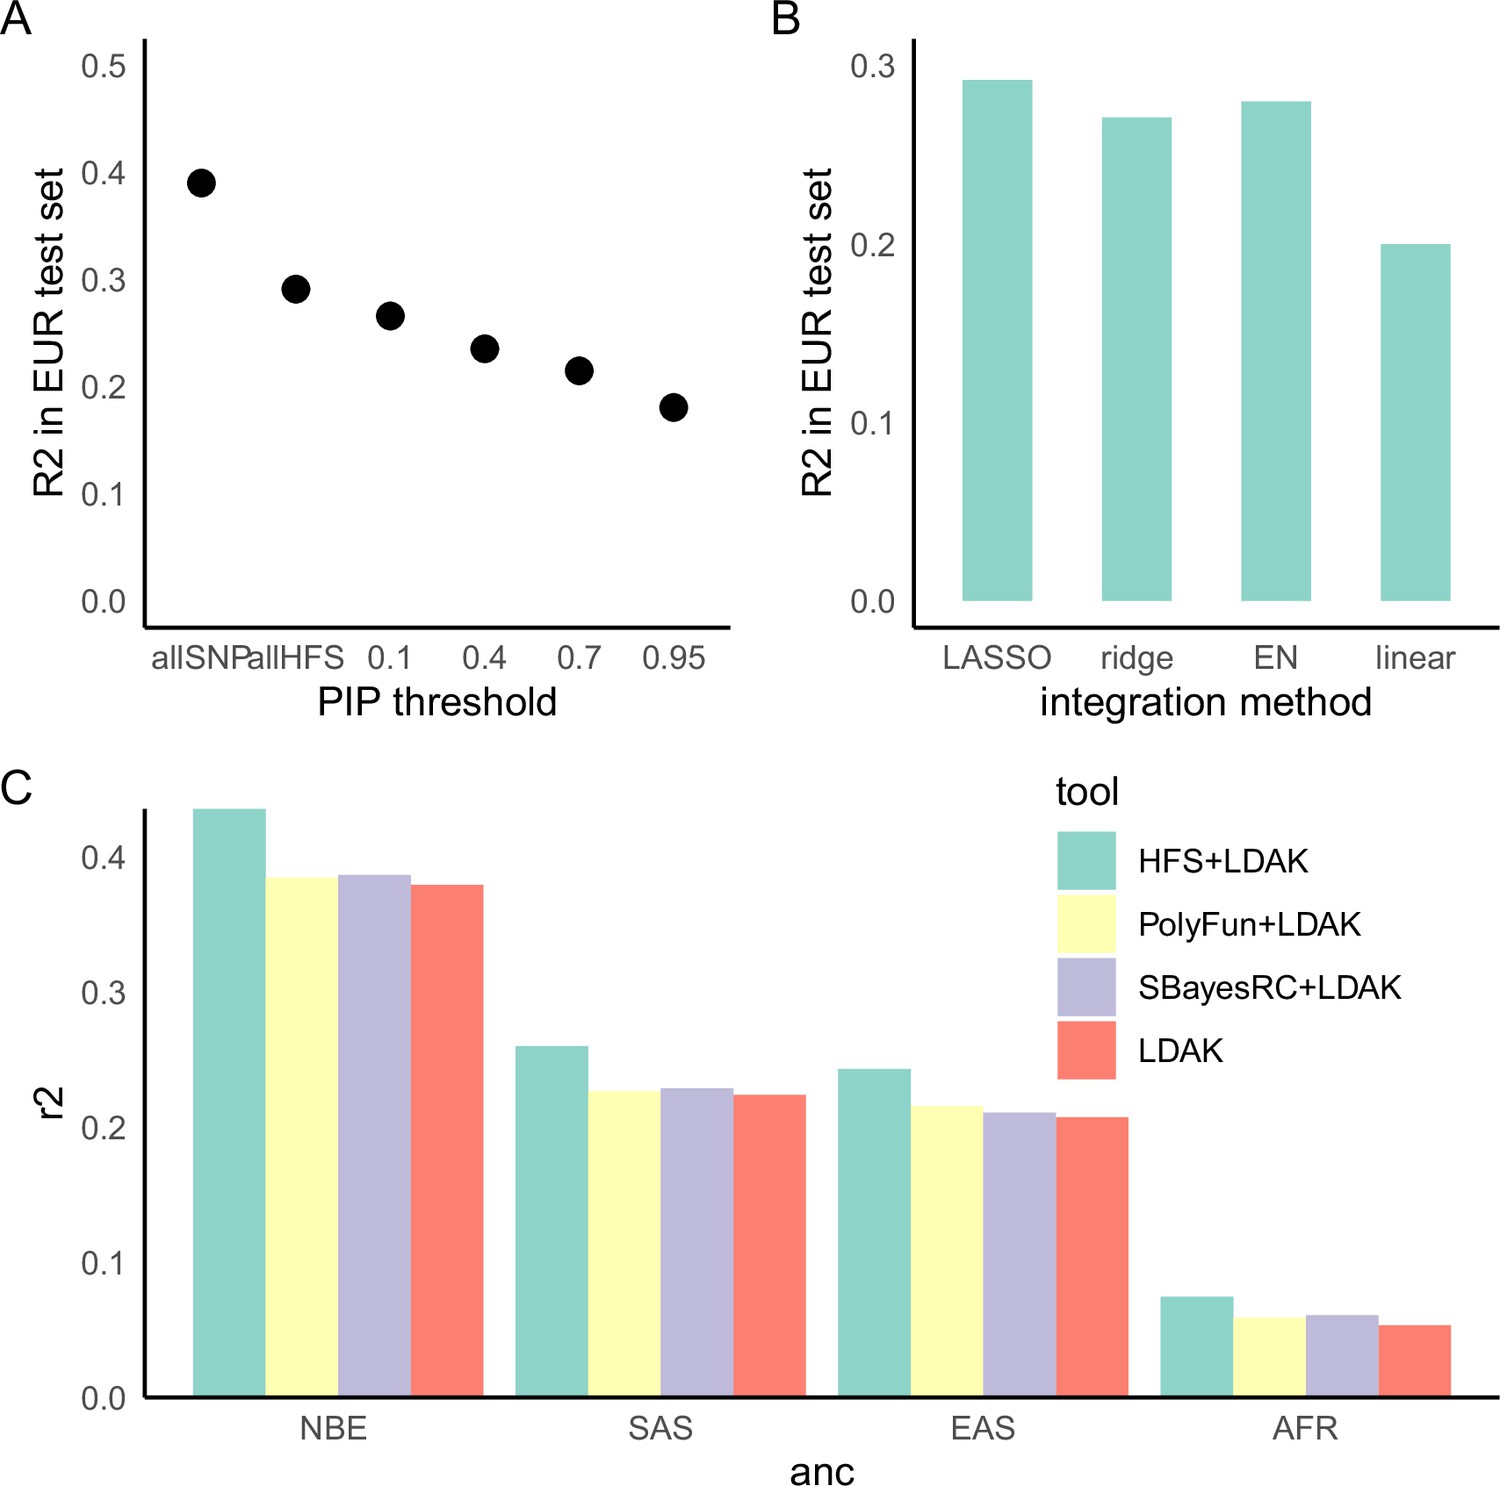
Haplotype Function Score (HFS)-based polygenic prediction.
(A) Prediction R2 of HFS-based polygenic risk score (PRS) using different threshold of posterior inclusion probability (PIP). allSNP: SNP-based PRS calculated by LDAK-BOLT (Zhang et al., 2021b). n: number of features included in the corresponding PRS. (B) Prediction R2 of per-block HFS score in British European test set by different methods. EN: elastic net. (C) Prediction R2 of different tools in non-British European (NBE), South Asian (SAS), East Asian (EAS), and African (AFR) groups in UK Biobank.
Figure 5—figure supplement 1

Proportion of heritability captured by Haplotype Function Score (HFS) polygenic risk score (PRS).
Author response image 1

Author response image 2
Author response image 3
Author response image 4

Author response image 5

Author response image 6

Author response image 7

Author response image 8

Author response image 9

Additional files
-
MDAR checklist
- https://cdn.elifesciences.org/articles/92574/elife-92574-mdarchecklist1-v2.pdf
-
Supplementary file 1
Supplementary tables.
- https://cdn.elifesciences.org/articles/92574/elife-92574-supp1-v2.xlsx
Download links
A two-part list of links to download the article, or parts of the article, in various formats.
Downloads (link to download the article as PDF)
Open citations (links to open the citations from this article in various online reference manager services)
Cite this article (links to download the citations from this article in formats compatible with various reference manager tools)
Haplotype function score improves biological interpretation and cross-ancestry polygenic prediction of human complex traits
eLife 12:RP92574.
https://doi.org/10.7554/eLife.92574.3


