Activating SRC/MAPK signaling via 5-HT1A receptor contributes to the effect of vilazodone on improving thrombocytopenia
- Sichuan Key Medical Laboratory of New Drug Discovery and Druggability, Luzhou Key Laboratory of Activity Screening and Druggability Evaluation for Chinese Materia Medica, School of Pharmacy, Southwest Medical University, China
- School of Pharmacy, Chengdu University of Traditional Chinese Medicine, China
- School of Basic Medical Sciences, Southwest Medical University, China
- School of Basic Medical Sciences, Public Center of Experimental Technology, Model Animal and Human Disease Research of Luzhou Key Laboratory, Southwest Medical University, China
- Education Ministry Key Laboratory of Medical Electrophysiology, Southwest Medical University, China
Figures
Figure 1
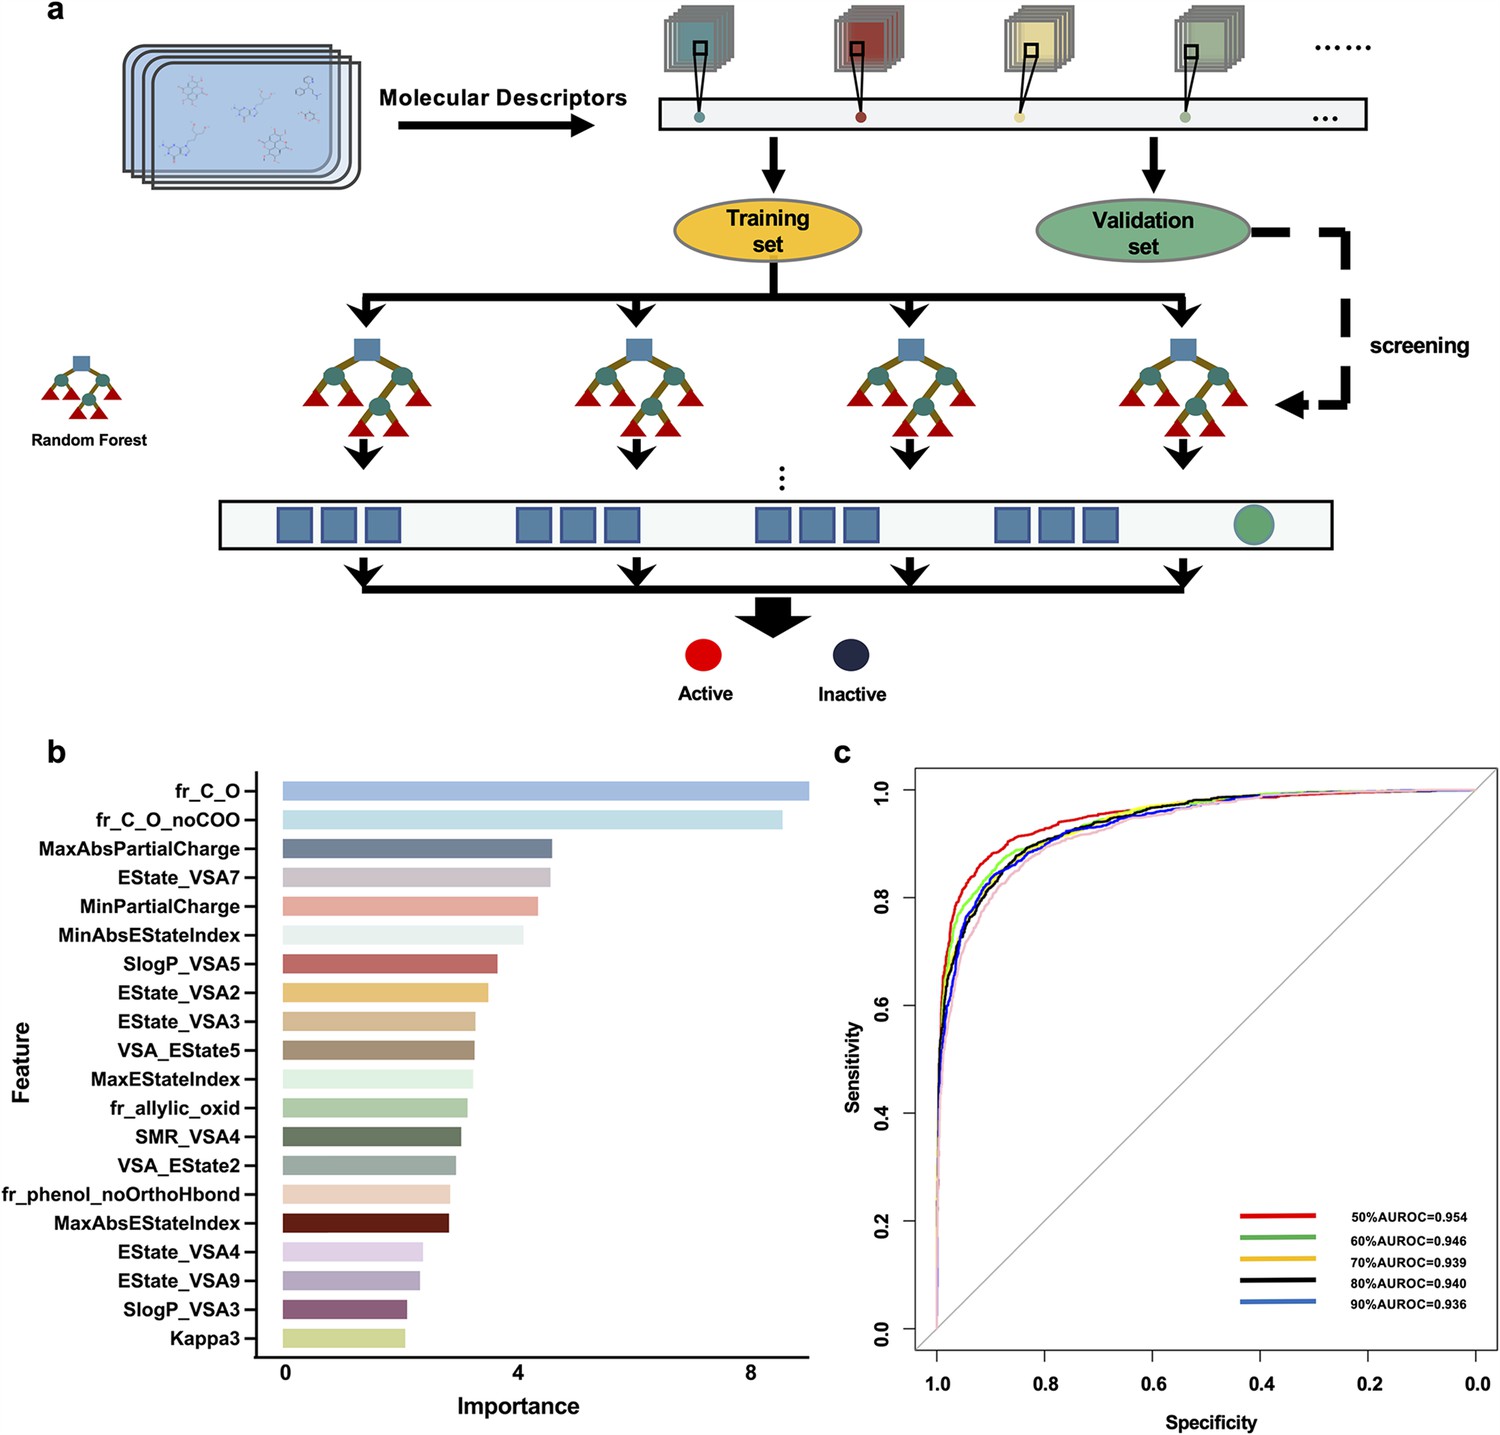
Drug screening model construction.
(a) Flowchart for the screening model construction. (b) The top 20 molecular descriptors with high scores. (c) ROC curves of importance ratios.
Figure 2 with 1 supplement
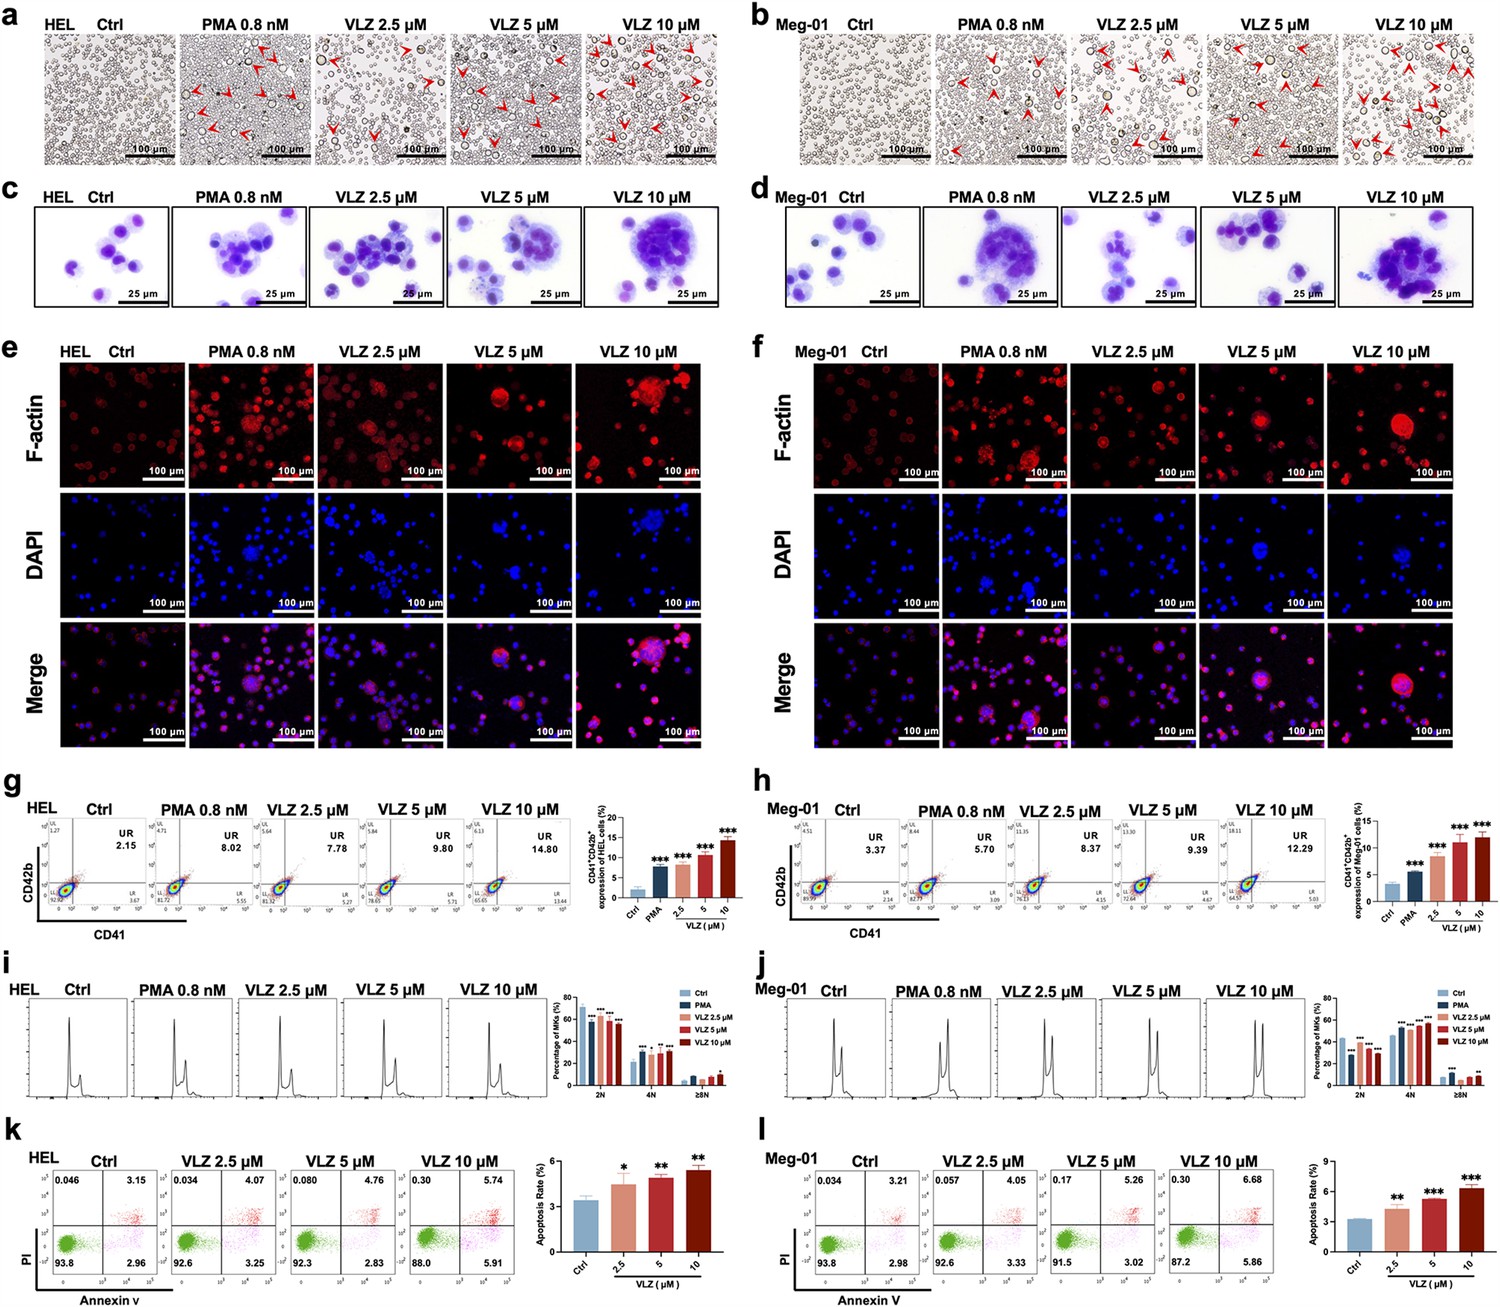
VLZ promotes megakaryocyte differentiation and enhances the DNA ploidy of HEL and Meg-01 cells.
(a, b) Representative images of HEL and Meg-01 cells treated with different concentrations of VLZ (2.5, 5, and 10 μM) for 5 days. Bars represent 100 μm. The positive control was PMA. (c, d) Giemsa staining of HEL and Meg-01 cells treated with VLZ (2.5, 5, and 10 μM) or PMA for 5 days. Bars represent 25 μm. (e, f) Phalloidin staining of HEL and Meg-01 cells treated with VLZ (2.5, 5, and 10 μM) or PMA for 5 days. DAPI staining nuclei (blue) and Phalloidin staining of F-actin (red). Bars represent 100 μm. (g, h) Flow cytometry analysis of the percentage of CD41+/CD42b+ complexes surface expression on HEL and Meg-01 cells by VLZ (2.5, 5, and 10 μM) or PMA for 5 days. The histogram shows the percentage of CD41+/CD42b+ cells for each group. (i, j) Flow cytometry analysis of the DNA ploidy of HEL and Meg-01 cells treated with VLZ (2.5, 5, and 10 μM) or PMA for 5 days. The histogram shows the percentages of DNA ploidy. (k, l) Flow cytometry analysis of the cell apoptosis of HEL and Meg-01 cells treated with VLZ (2.5, 5, and 10 μM) or PMA for 5 days. Data are shown as the mean ± SD from three independent experiments. *p≤0.05, **p≤0.01, and ***p≤0.001, vs the control group.
Figure 2—figure supplement 1
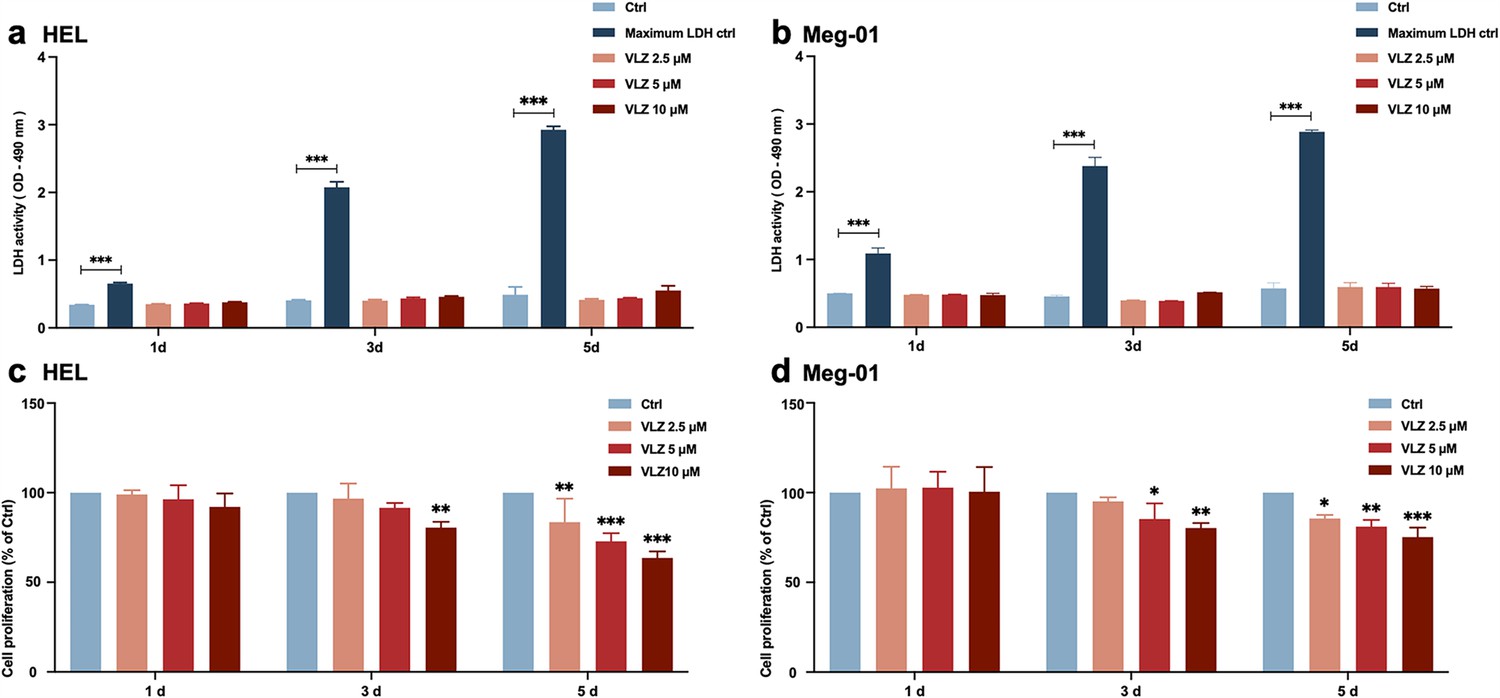
Safe concentration of VLZ for treatment of HEL and Meg-01.
(a, b) Results of the cell counting kit-8 (CCK-8) assay for the effect of VLZ intervention on MK proliferation.( c, d) Lactic acid dehydrogenase (LDH) assay detected the cytotoxicity of VLZ to HEL and Meg-01 cells at different time points. Data are shown as the mean ± SD from three independent experiments. *p≤0.05, **p≤0.01, and ***p≤0.001, ns: no significance, vs the control group.
Figure 3
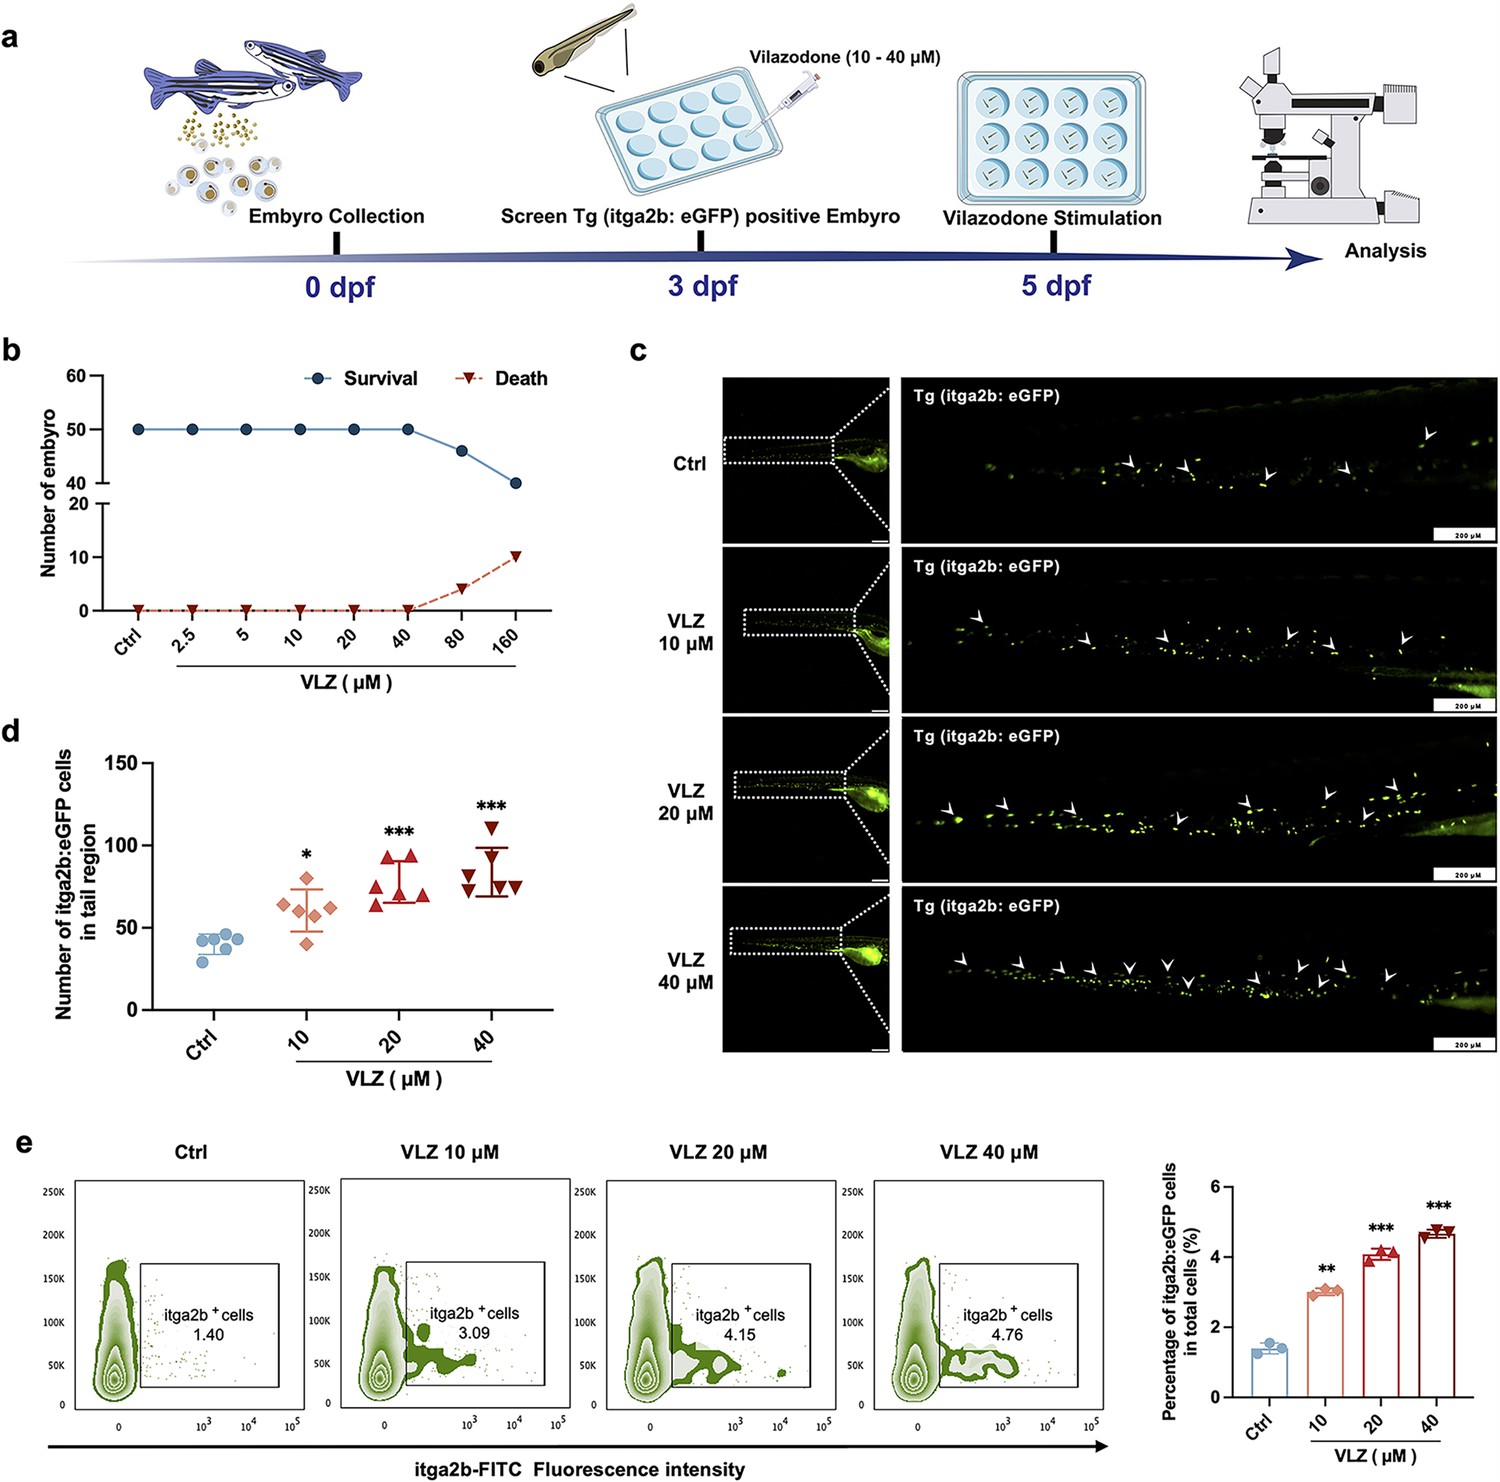
VLZ administration enhances thrombogenesis in Tg (itga2b: eGFP) transgenic zebrafish.
(a) Timeline of the zebrafish intervention. (b) Toxicity effects of different doses of VLZ on fish survival and general development. (c) itga2b: eGFP thrombocytes in whole tail regions of control and VLZ (2.5, 5, and 10 μM) treated zebrafish. Bars represent 200 μm. (d) Quantification of itga2b: eGFP cells in each group (n=6 per group). (e) Flow cytometry analysis of GFP-labeled platelets of Tg (itga2b: eGFP) zebrafish embryos treated with different doses of VLZ. The data are shown as the mean ± SD. *p≤0.05, **p≤0.01, and ***p≤0.001, vs the control group.
Figure 4 with 3 supplements
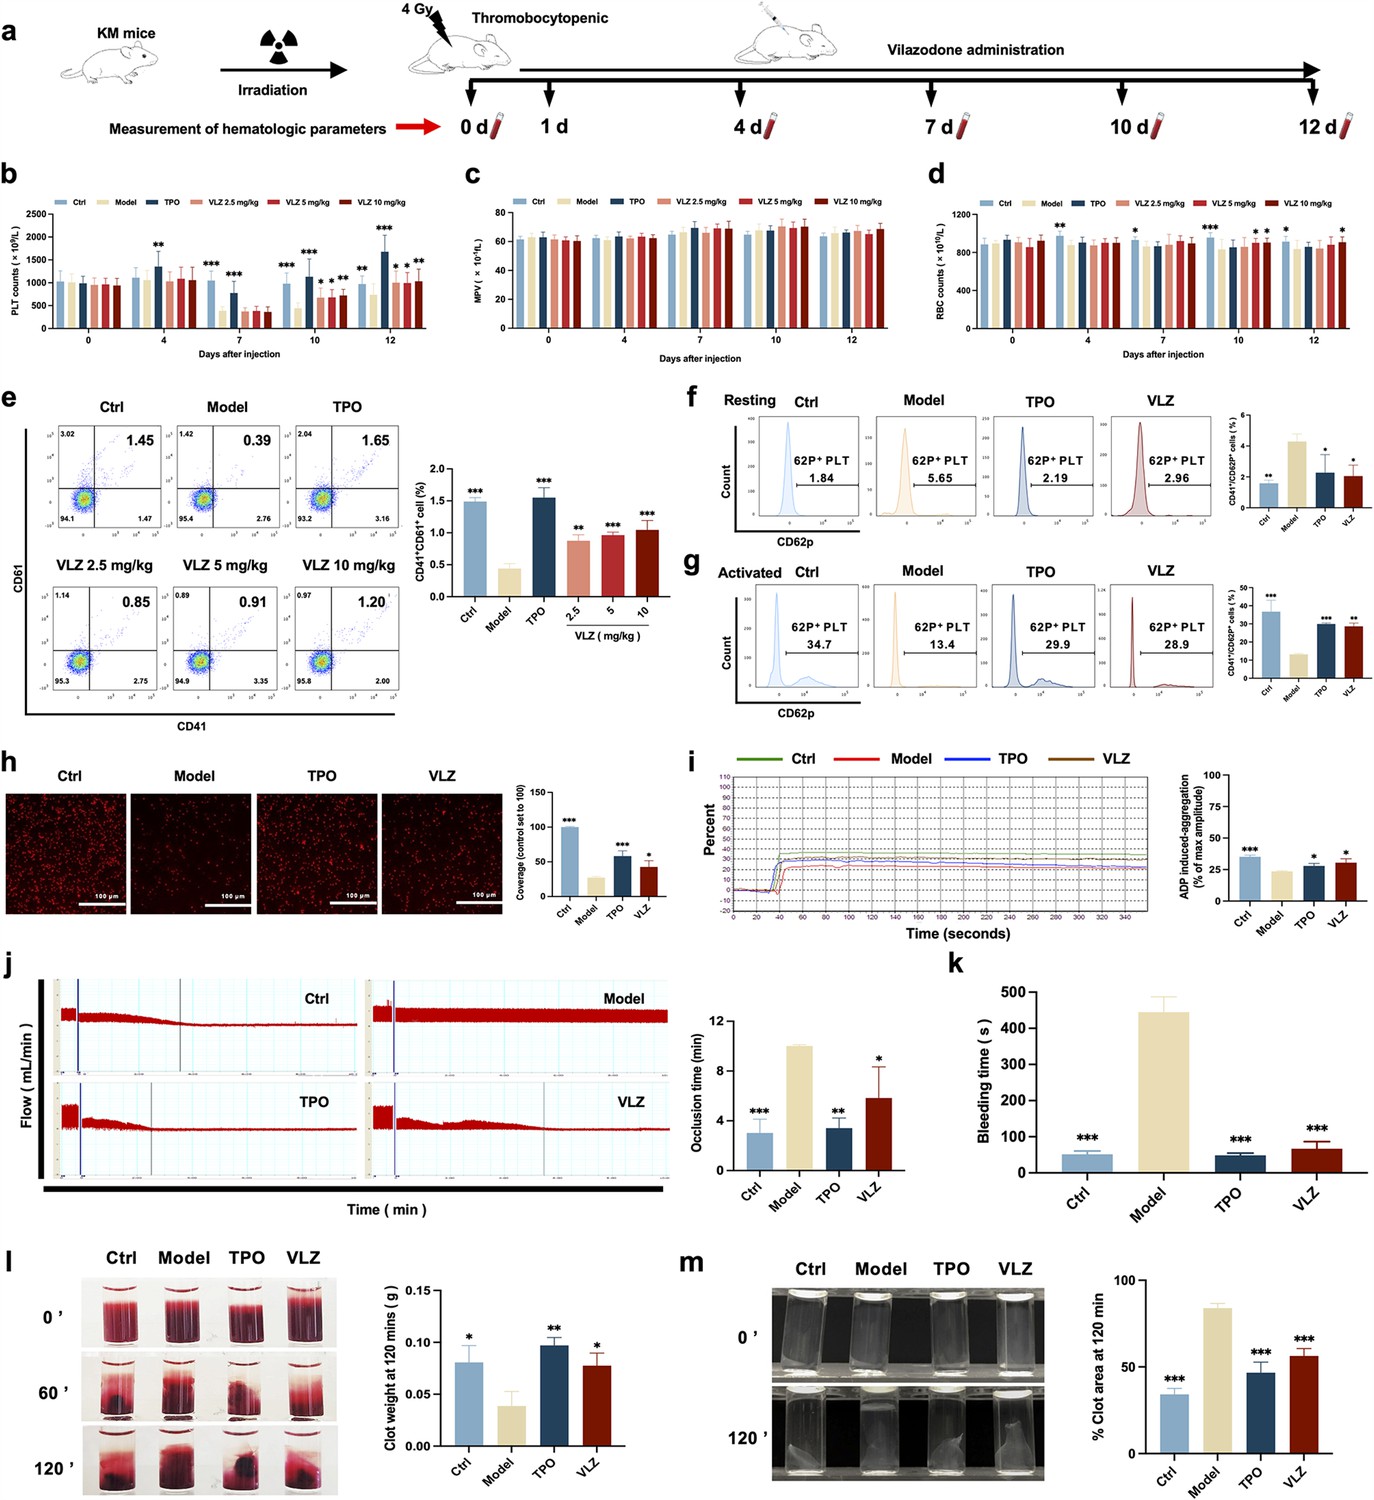
VLZ administration counteracts radiation-induced thrombocytopenia in vivo.
(a) Schematic diagram of thrombopoietin (TPO) (3000 U/kg) and VLZ (2.5, 5, and 10 mg/kg) administration in Kunming (KM) mice with thrombocytopenia induced by IR. (b–d) Peripheral blood counts showing (b) platelet counts, (c) mean platelet volume (MPV) and (d) RBC on days 0, 4, 7, 10, and 12 post-IR. In B to E, (n=12 per group) the data are expressed as the mean ± SD, and two-way ANOVA with Tukey’s multiple comparisons test was used unless otherwise specified. *p≤0.05, **p≤0.01, and ***p≤0.001, vs the model group. (e) Flow cytometry analysis indicates the expression of CD41 and CD61 in peripheral blood cells after receiving therapy for 12 days. The histogram represents the percentage of CD41+/CD61+ cells in each group. (f) Representative image of CD62p in washed platelets in each group. (g) Representative images of CD62p in ADP (10 mM) washed platelets in each group. (h) Micrographs of collagen-coated slides with the same number of platelets perfused. Red represents platelets. The histogram shows the average of red fluorescence on the whole surface by ImageJ software. (i) Platelet aggregation was measured by a turbidimetric aggregation-monitoring device under ADP stimulation. The histogram represents the aggregation results expressed as the maximum aggregation amplitude of platelets in each group. (j) The rate tracings of carotid blood flow. The histogram shows the mean carotid artery occlusion times of each group. (k) Tail bleeding time was measured in each group. (l) Representative images of whole blood clots at times 0, 60, and 120 min (end point) in each group. The histogram represents the percentage of final clot weight. (m) Representative images of washed platelet clots at time 0 and 120 min (endpoint) in each group. The histogram shows clot retraction at 120 min as a percentage of clot area from 0 min. The data represent the mean ± SD of three independent experiments. *p≤0.05, **p≤0.01, and ***p≤0.001, vs the model group.
Figure 4—figure supplement 1

VLZ promotes platelet increase in normal mice.
(a) Peripheral blood counts showing platelet counts on days 0, 4, 7, 10, and 12. (n=8 per group) the data are expressed as the mean ± SD, and two-way ANOVA with Tukey’s multiple comparisons test was used unless otherwise specified, *p≤0.05, **p≤0.01, and ***p≤0.001. (b) Flow cytometry analysis indicates the expression of CD41 and CD61 in peripheral blood after receiving therapy for 12 days. The histogram represents the percentage of CD41+/CD61+ cells in each group. The data represent the mean ± SD of three independent experiments. *p≤0.05, **p≤0.01, and ***p≤0.001, vs the control group.
Figure 4—figure supplement 2
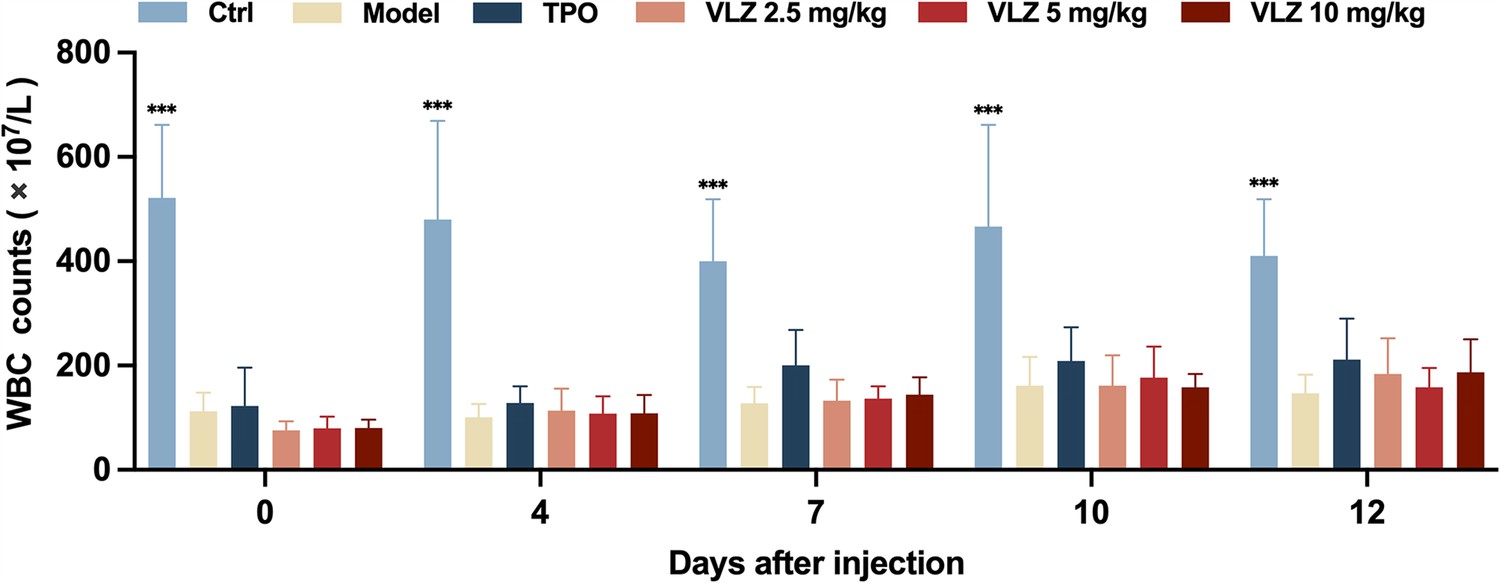
WBC counts.
Peripheral blood counts showing WBC on days 0, 4, 7, 10, and 12 post-IR. In B to E, (n=12 per group) the data are expressed as the mean ± SD, and two-way ANOVA with Tukey’s multiple comparisons test was used unless otherwise specified, *p≤0.05, **p≤0.01, and ***p≤0.001, vs the model group.
Figure 4—figure supplement 3
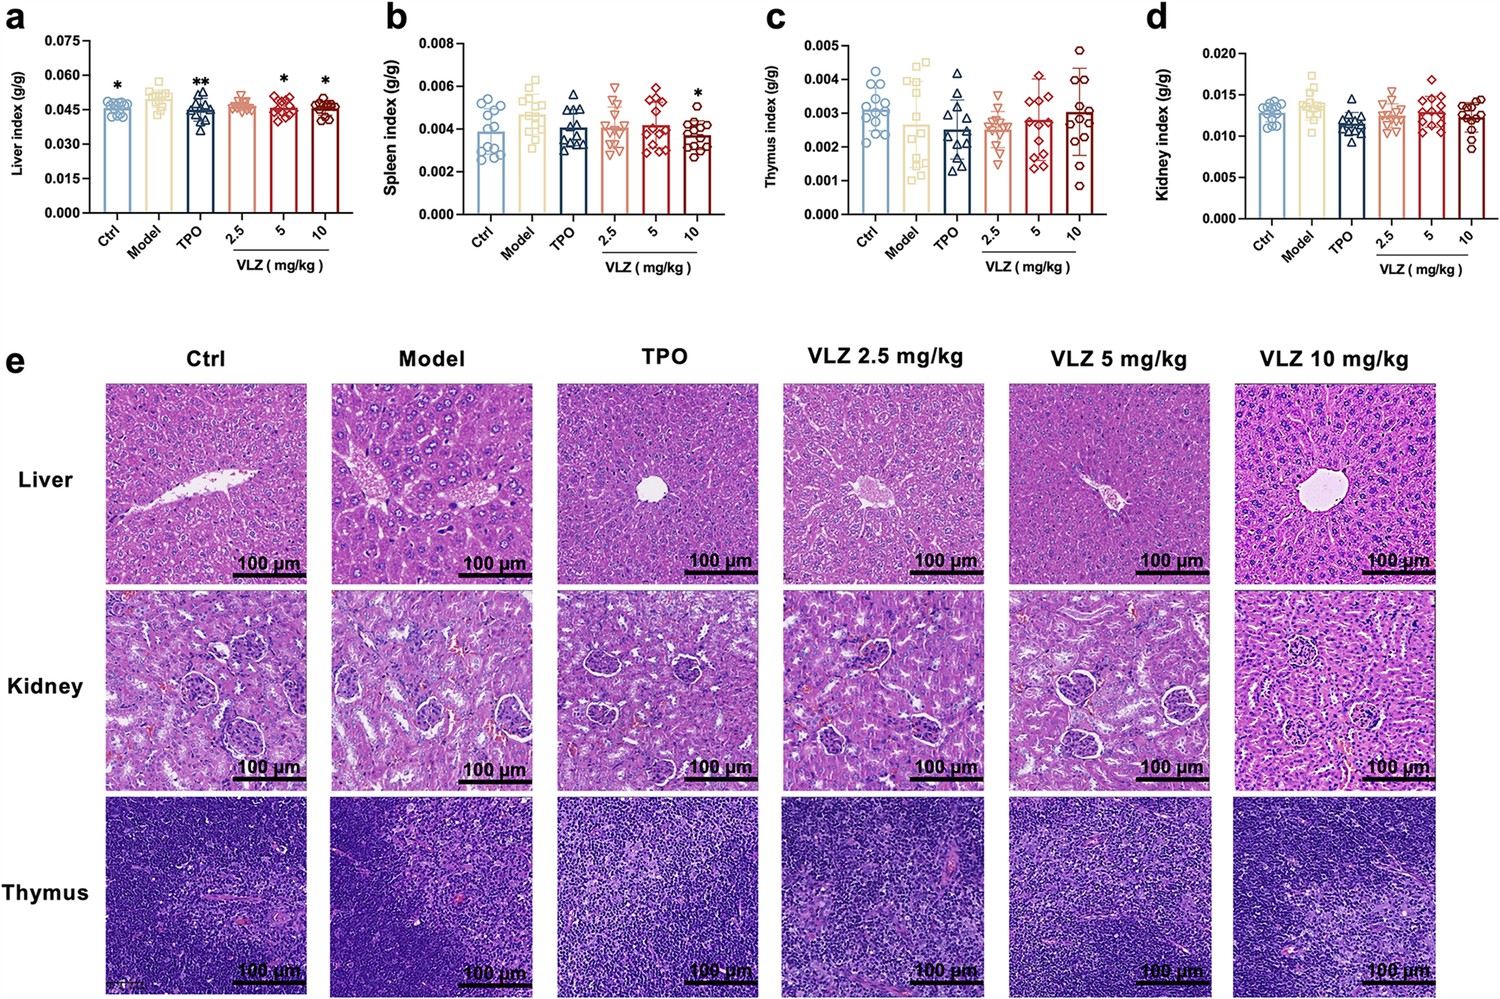
Toxicity evaluation of VLZ in vivo.
(a-d) The effects of VLZ on the visceral index in thrombocytopenia mice (n=12 per group). The data are expressed as the mean ± SD, and two-way ANOVA with Tukey’s multiple comparisons test was used unless otherwise specified, *p≤0.05, **p≤0.01, and ***p≤0.001, vs the model group. (e) H&E staining shows the major organs in each group.
Figure 5
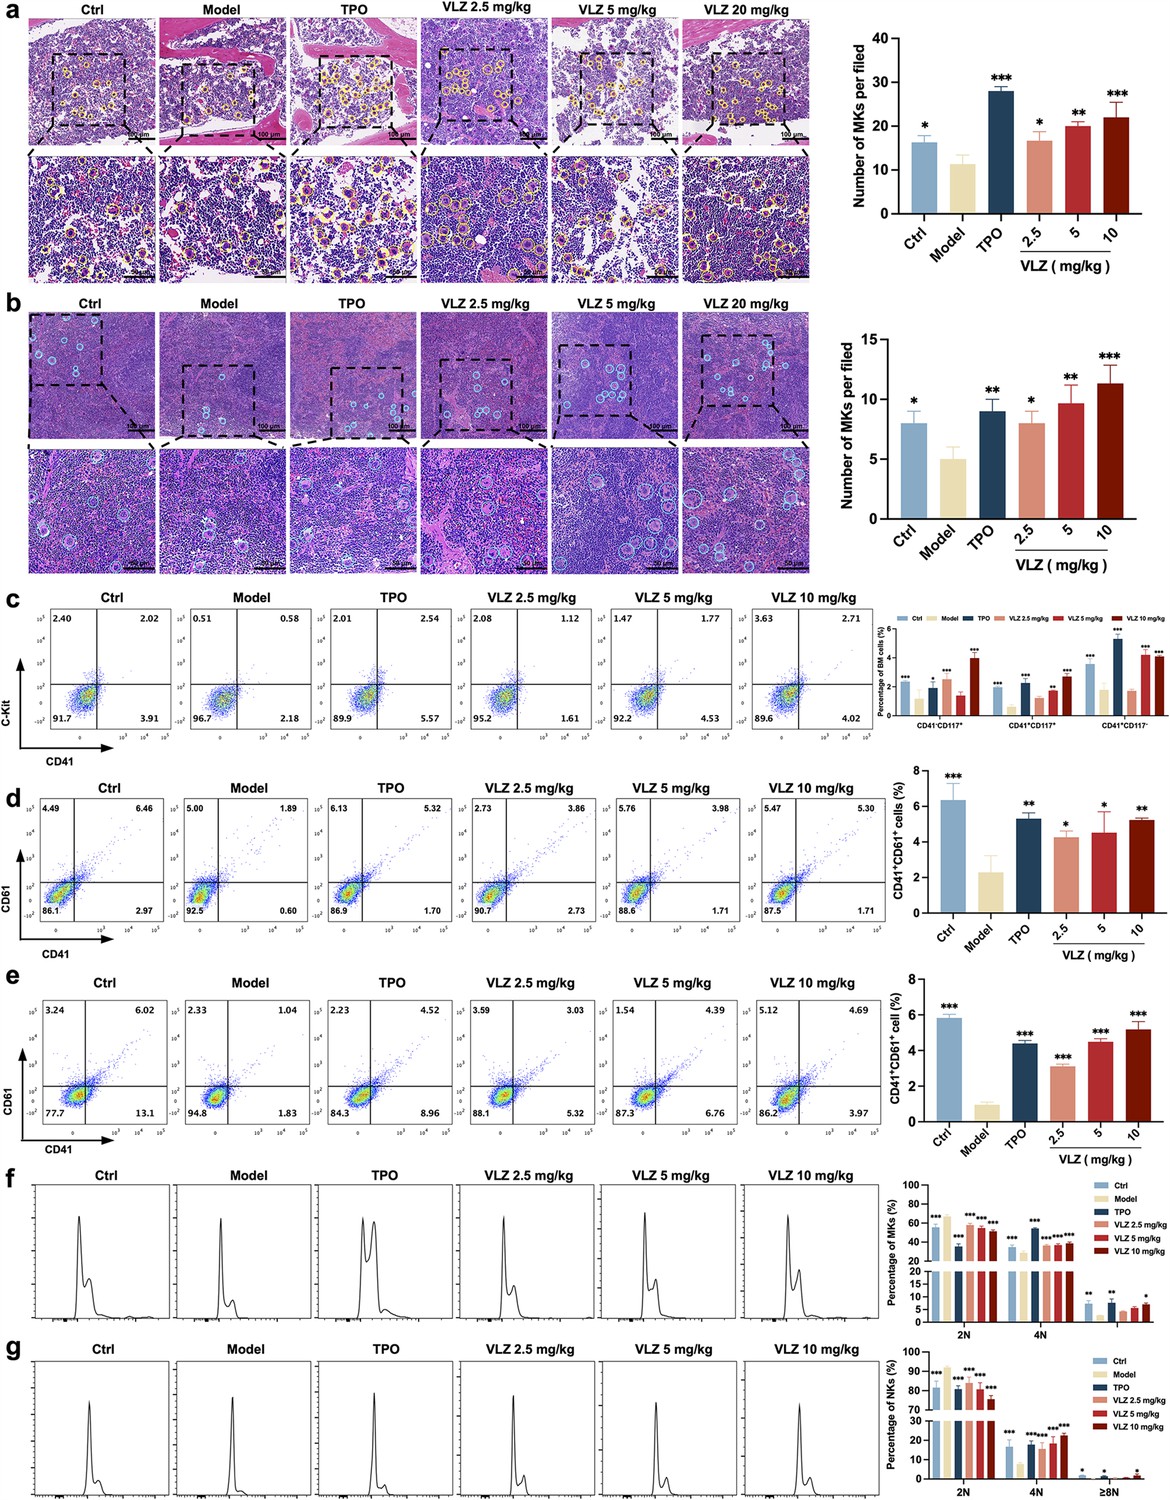
VLZ rescues bone marrow and splenic hematopoiesis after radiation injury.
(a, b) H&E staining shows the megakaryocytes in BM and spleen after mice were treated with normal saline, thrombopoietin (TPO) (3000 U/kg), and VLZ (2.5, 5, and 10 mg/kg) for 12 days. Ten microscopy fields per sample were counted. The circles mark the megakaryocytes. The histogram shows the number of megakaryocytes in the BM and spleen in each group. (c) The examination of the expression of c-Kit and CD41 in each group by flow cytometry after receiving therapy for 12 days. The histogram represents the percentage of c-Kit+/CD41-, c-Kit+/CD41+, and c-Kit-/CD41+ cells in each group. (d, e) Flow cytometry analysis indicates the expression of CD41 and CD61 in BM and spleen cells after receiving therapy for 12 days. The histogram represents the percentage of CD41+/CD61+ cells in each group. (f, g) Flow cytometry analysis indicates the cell ploidy of BM and spleen cells of each group. The histogram represents the cell ploidy in the BM and spleen cells of each group. All data represent the mean ± SD of three independent experiments. *p≤0.05, **p≤0.01, and ***p≤0.001, vs the model group.
Figure 6
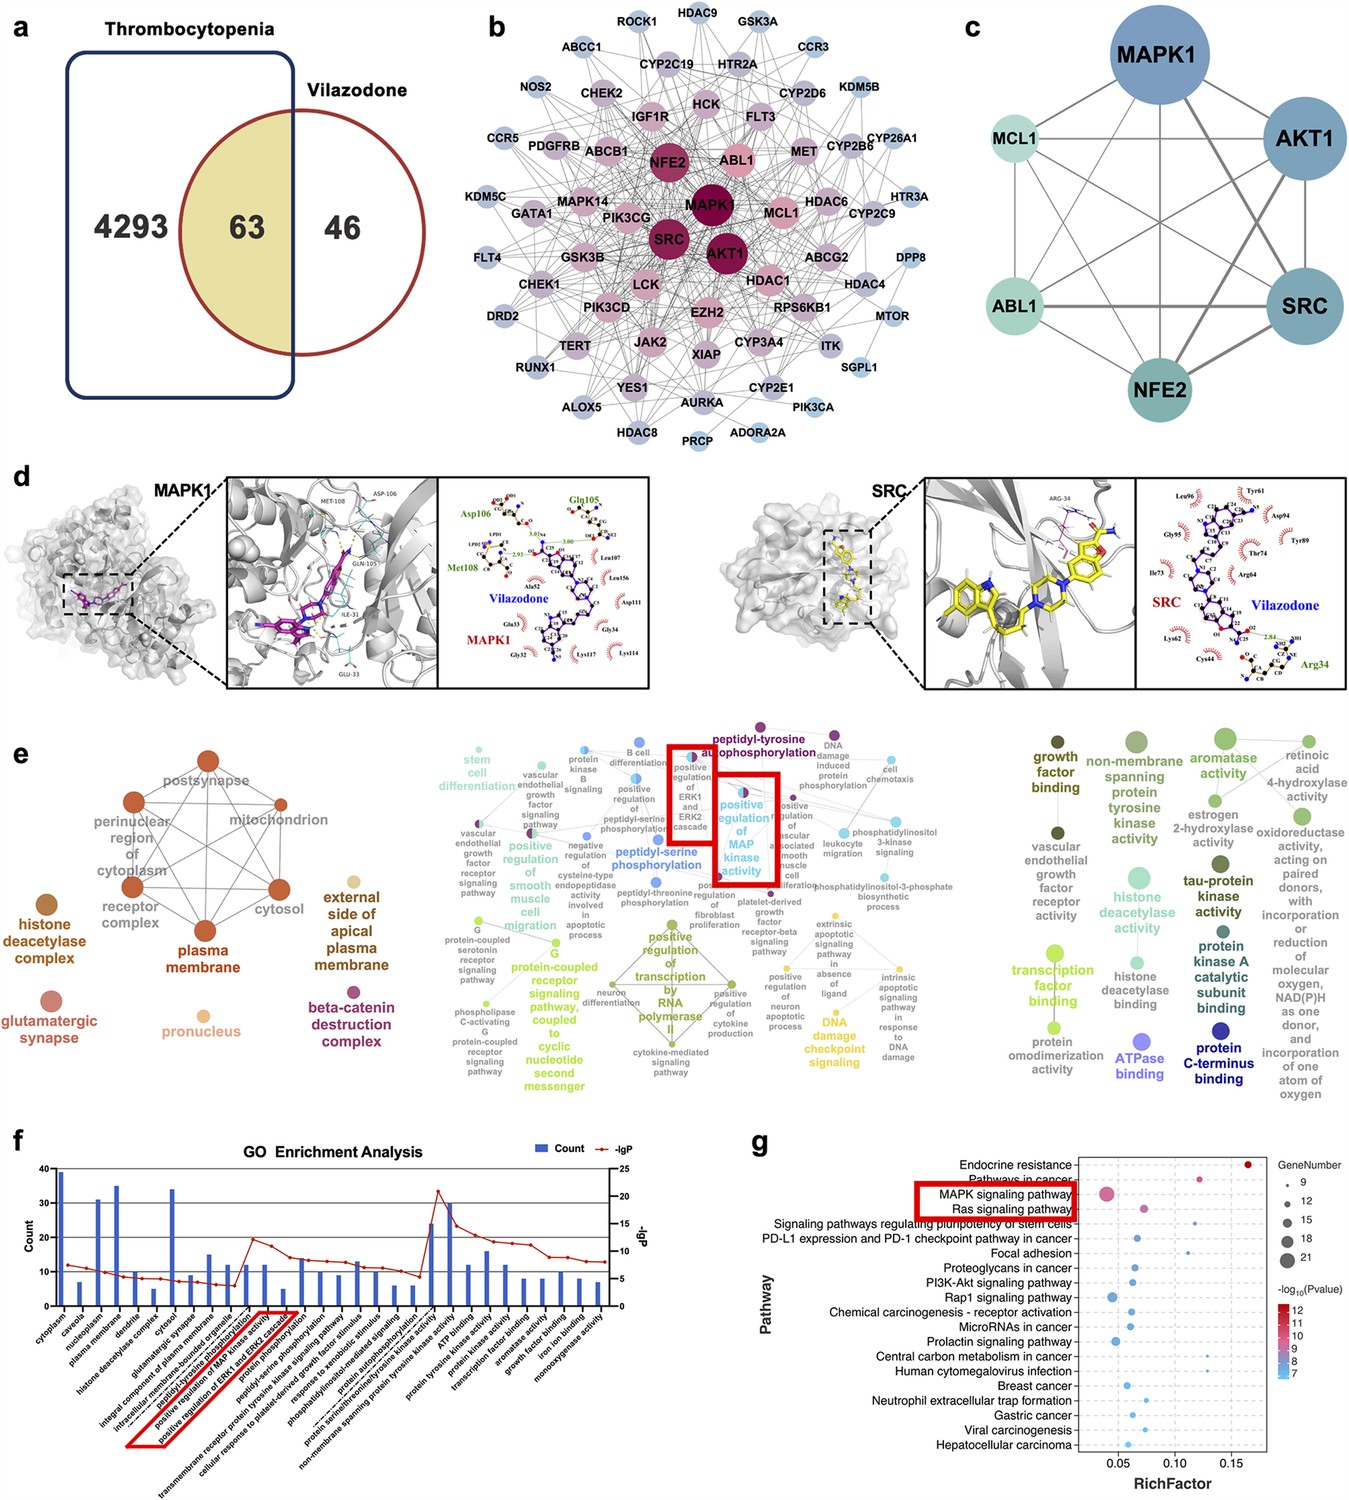
Network pharmacology and molecular docking analysis of VLZ activity in thrombocytopenia.
(a) Venn diagram of the common targets of VLZ and thrombocytopenia. (b) The VLZ-targets-Thrombocytopenia network that was constructed by Cytoscape_v3.7.1 software. (c) Protein-protein interaction (PPI) network based on the core targets of VLZ against thrombocytopenia through the screening conditions of Degree >12, BC >0.01105525, CC >0.52777778. (d) Molecular docking shows the binding ability between VLZ and its core targets (MAPK1 and SRC). (e) Visualization of cellular component, biological process, and molecular function enrichment analysis. (f) The top 10 of CC, BP, and MF terms showing the greatest enrichment with VLZ-related processes are listed in ascending order of P values.(g) The top 20 of KEGG pathways enrichment analysis for the mechanisms of VLZ against thrombocytopenia. A higher richness factor indicates more enrichment. The number of genes enriched in each pathway is represented by the size of the bubble. The p value range is shown by the color of the bubble.
Figure 7
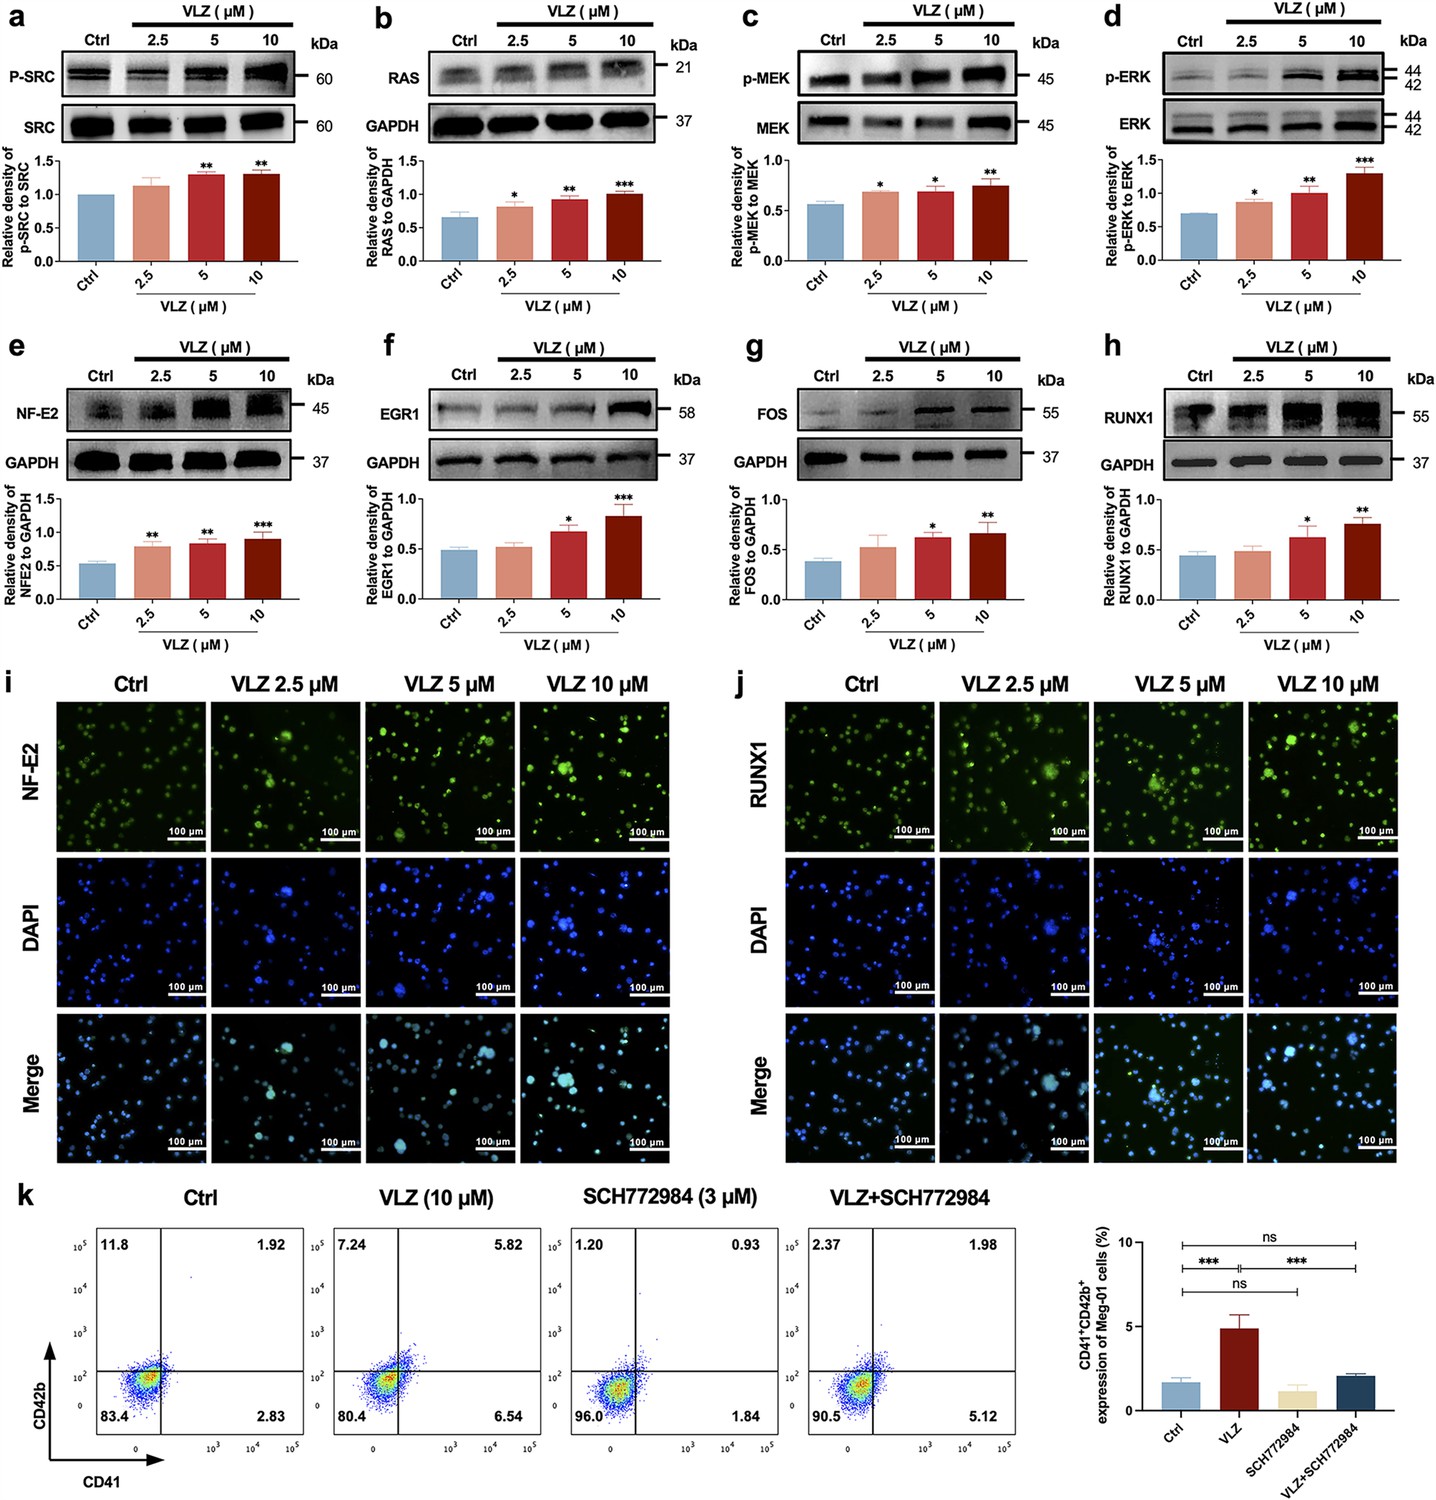
VLZ induces megakaryocyte (MK) maturation and differentiation by activating the SRC/RAS/MEK/ERK signaling pathway.
(a-h) The expression of SRC, RAS, MEK, ERK, NF-E2, EGR1, FOS, and RUNX1 were detected by western blot after Meg-01 cells were treated with VLZ (2.5, 5, and 10 μM) for 5 days (n=3 per group). (i, j) Immunofluorescence analysis of the expression of NF-E2 and RUNX1 in Meg-01 cells after VLZ (2.5, 5, and 10 μM) intervention for 5 days. Cells were stained with DAPI for nuclei (blue) and antibodies for NF-E2 (green). Bars represent 100 μm. (k) Flow cytometry analysis of the percentage of CD41+ CD42b+ complexes surface expression on HEL and Meg-01 cells treated with VLZ (10 μM), SCH772984 (3 μM), and VLZ (10 μM)+SCH772984 (3 μM) treated for 5 days. The histogram shows the percentage of CD41+/CD42b+ cells for each group. The data represent the mean ± SD of three independent experiments. *p≤0.05, **p≤0.01, and ***p≤0.001, ns: no significance, vs the control group.
-
Figure 7—source data 1
Original file for the Western blot analysis in Figure 7.
- https://cdn.elifesciences.org/articles/94765/elife-94765-fig7-data1-v1.zip
-
Figure 7—source data 2
PDF containing Figure 7 and original scans of the relevant Western blot analysis with highlighted bands and sample labels.
- https://cdn.elifesciences.org/articles/94765/elife-94765-fig7-data2-v1.pdf
Figure 8
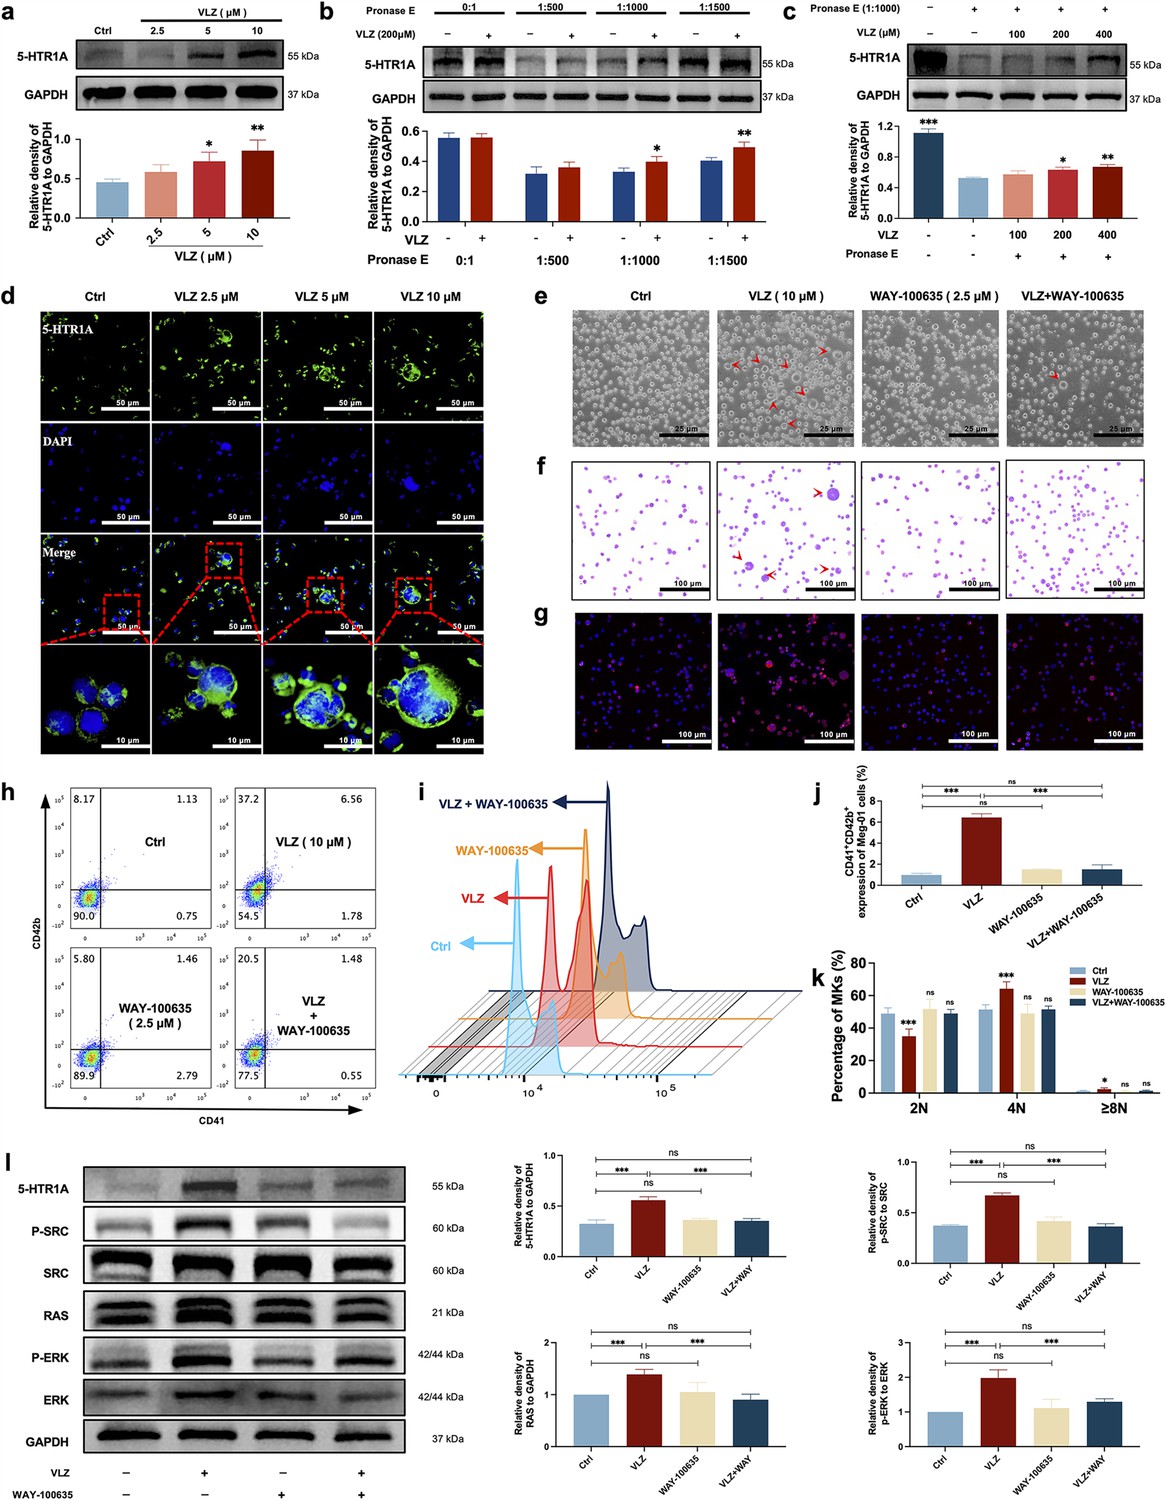
VLZ stimulates megakaryocytopoiesis via the 5-HT1A receptor.
(a) Representative immunoblot images and biochemical quantification of 5-HTR1A after treatment with VLZ (2.5, 5, and 10 μM) in Meg-01 cells for 5 days (n=3 per group). (b) The DARTS assay for target validation. 5-HTR1A protein stability was increased upon VLZ (200 μM) treatment in Meg-01 lysates. Pronase was added using several dilutions (1:500, 1:1000, or 1500) from 50 μg/mL stock for 10 min at 40 °C (n=3 per group). (c) The DARTS assay demonstrated the dose-dependent binding of VLZ to 5-HTR1A in Meg-01 cells. Treatment with pronase (1:1000) was conducted for 10 min at 40 °C (n=3 per group). (d) Immunofluorescence analysis of the expression of 5-HTR1A in Meg-01 cells after VLZ (2.5, 5, and 10 μM) intervention for 5 days. Cells were stained with DAPI for nuclei (blue) and antibodies for 5-HTR1A (green). Bars represent 100 μm. (e–k) Meg-01 cells were treated with VLZ (10 μM), WAY-100635 (2.5 μM), VLZ (10 μM)+WAY-100635 (2.5 μM) for 5 days. (e) Representative images, bars represent 25 μm. (f) Giemsa staining of Meg-01 cells, bars represent 100 μm. (g) Phalloidin staining of Meg-01 cells, bars represent 100 μm. (h, i) Flow cytometry analysis of the expression of CD41/CD42b and the DNA ploidy. (j, k) The histogram shows the percentage of CD41+/CD42b+ cells and DNA ploidy for each group. (l) Western blot analysis of 5-HTR1A, RAS and ERK expression after Meg-01 cells were treated with VLZ (10 μM), WAY-100635 (2.5 μM), and VLZ (10 μM)+WAY-100635 (2.5 μM) for 5 days. The histogram shows the expression of 5-HTR1A, RAS, and ERK in each group (n=3 per group). The data represent the mean ± SD of three independent experiments. *p≤0.05, **p≤0.01, and ***p≤0.001, ns: no significance, vs the control group.
-
Figure 8—source data 1
Original file for the Western blot analysis in Figure 8.
- https://cdn.elifesciences.org/articles/94765/elife-94765-fig8-data1-v1.zip
-
Figure 8—source data 2
PDF containing Figure 8 and original scans of the relevant Western blot analysis with highlighted bands and sample labels.
- https://cdn.elifesciences.org/articles/94765/elife-94765-fig8-data2-v1.pdf
Figure 9
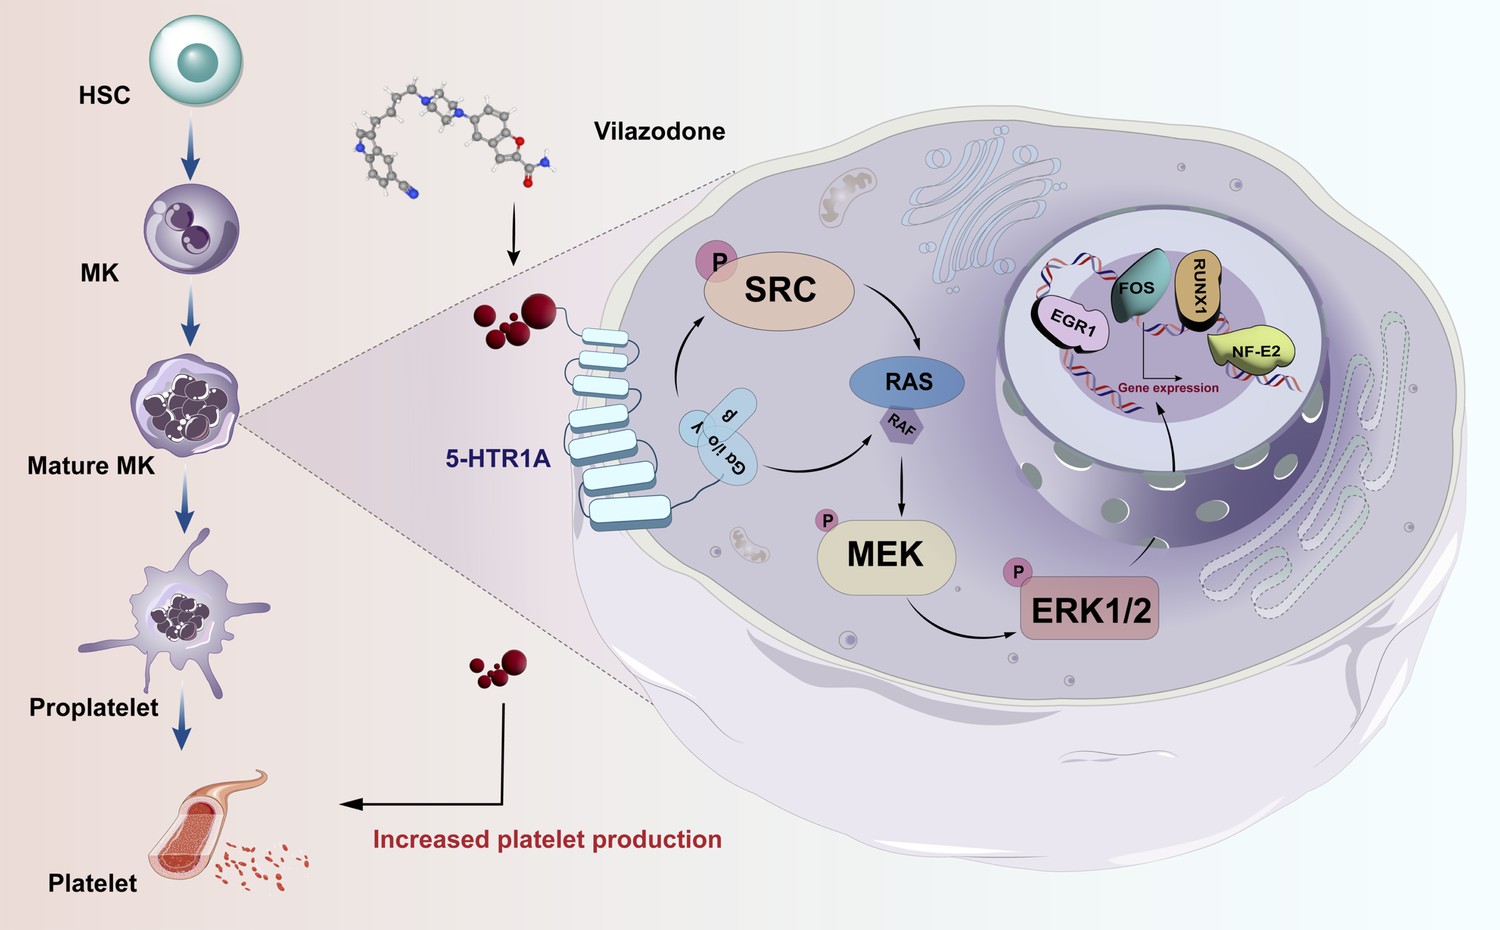
Schematic representation of the mechanism by which VLZ regulates megakaryocyte differentiation and thrombopoiesis.
Additional files
Download links
A two-part list of links to download the article, or parts of the article, in various formats.
Downloads (link to download the article as PDF)
Open citations (links to open the citations from this article in various online reference manager services)
Cite this article (links to download the citations from this article in formats compatible with various reference manager tools)
Activating SRC/MAPK signaling via 5-HT1A receptor contributes to the effect of vilazodone on improving thrombocytopenia
eLife 13:RP94765.
https://doi.org/10.7554/eLife.94765.3


