Single-molecule tracking in live cells reveals distinct target-search strategies of transcription factors in the nucleus
- Institut de Biologie de l’Ecole Normale Supérieure (IBENS), Inserm U1024, and CNRS UMR 8197, France
- CNRS UMR 8552, Departement de Physique et Institut de Biologie de l'Ecole Normale Supérieure (IBENS), France
- Janelia Farm Research Campus, Howard Hughes Medical Institute, United States
- Université Paris Diderot, France
- CNRS UMR 7600, Université Pierre et Marie Curie, France
- Institut de Biologie de l'École Normale Supérieure (IBENS) CNRS UMR 8197, France
- Institut Curie, CNRS UMR 168, France
Figures
Figure 1 with 3 supplements
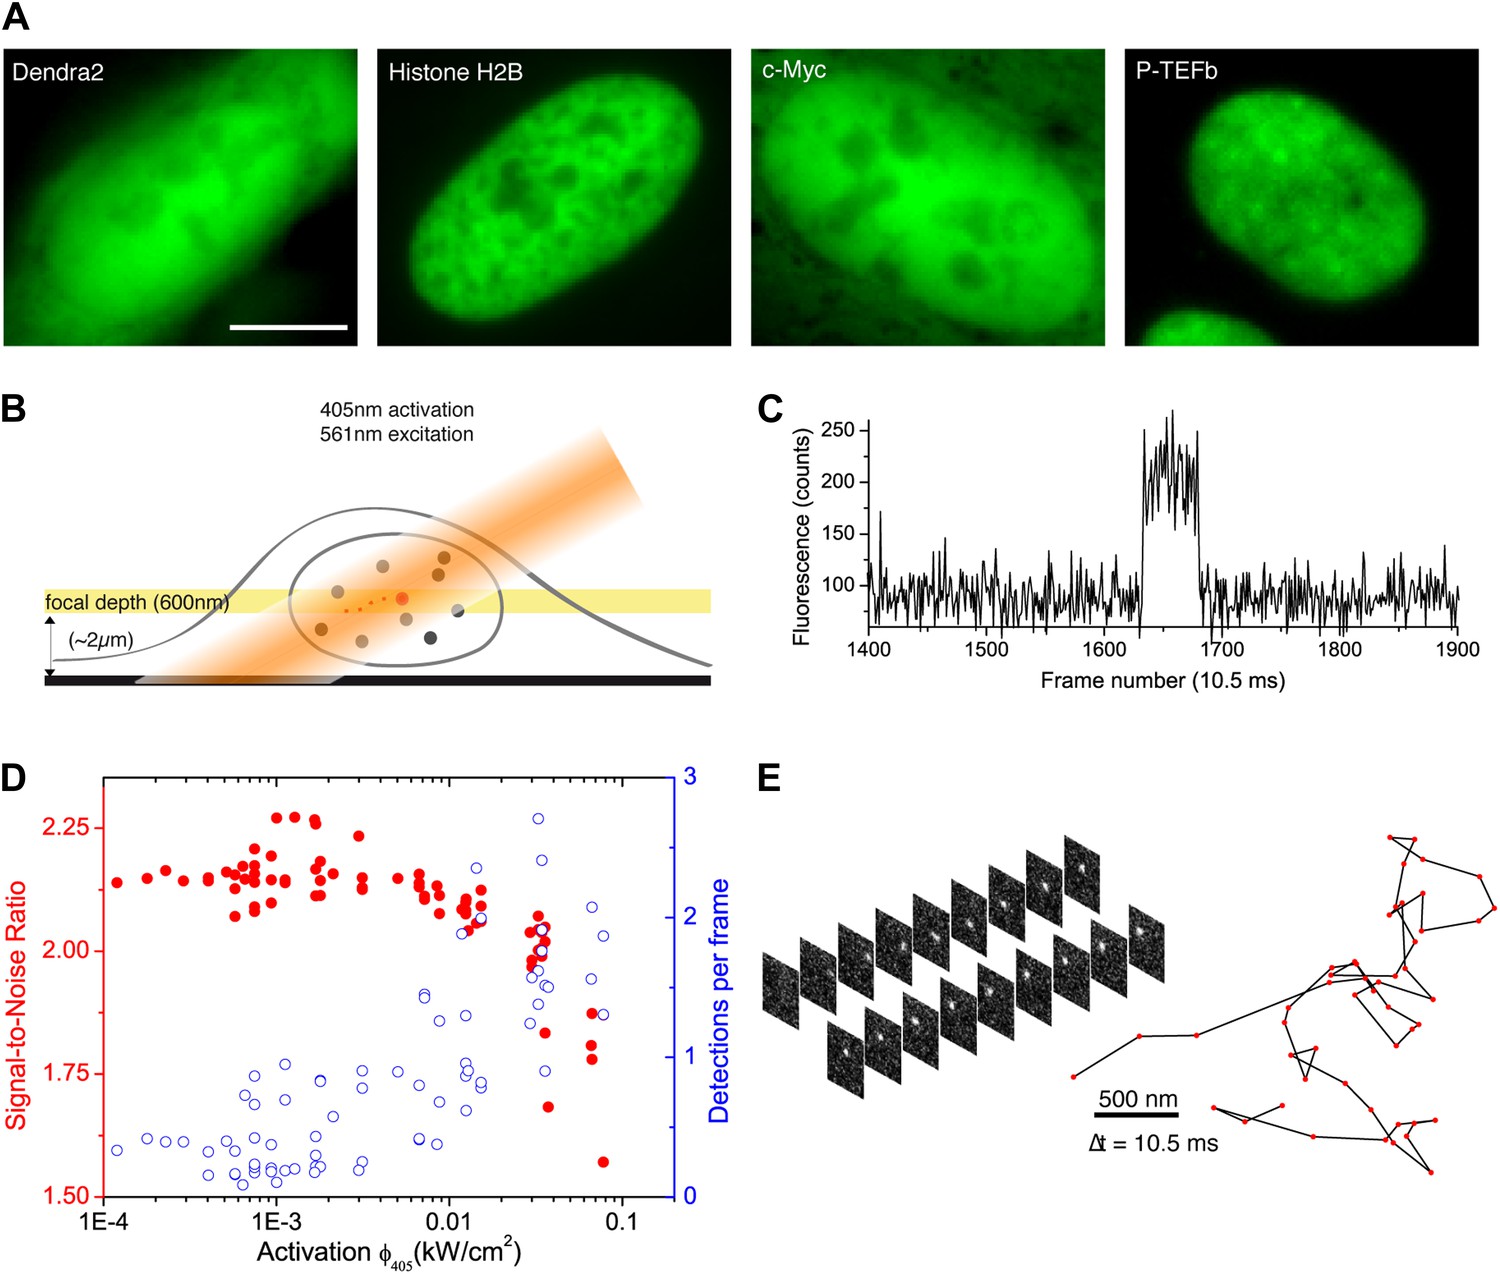
From bulk to single molecule fluorescence imaging.
(A) Images of the 525 nm bulk emission of the pre-converted form of Dendra2 in the cellular nucleus for the ‘free’ fluorophore Dendra2 and Dendra2 fused to H2B, c-Myc, and P-TEFb. (B) Schematics of the intracellular sptPALM; wide-field illumination is necessary in order to reach the nucleus of mammalian cells. A signature of single molecule detection is the on/off single-step fluorescence shown in panel (C). To achieve single molecule detection, 405 nm laser photoactivation needs to be reduced to a level where no background noise is produced by out-of-focus fluorophores. Graphic in panel (D) shows the number of detected single molecules (blue data, right axis) and the mean SNR of the single molecule signal (red data, left axis) as a function of 405 nm photoactivation photon flux per pulse (10 ms pulses every 1 s). The signal-to-noise ratio (SNR) of the molecules within the image depth of focus indeed increases as the total number of detected particles decreases. In panel (E), the trace of a single Dendra2 molecule freely diffusing in the nucleus of a living cell is depicted, imaged at a rate of 95 Hz (10 ms acquisition time and 0.5 ms interval between frames).
Figure 1—figure supplement 1
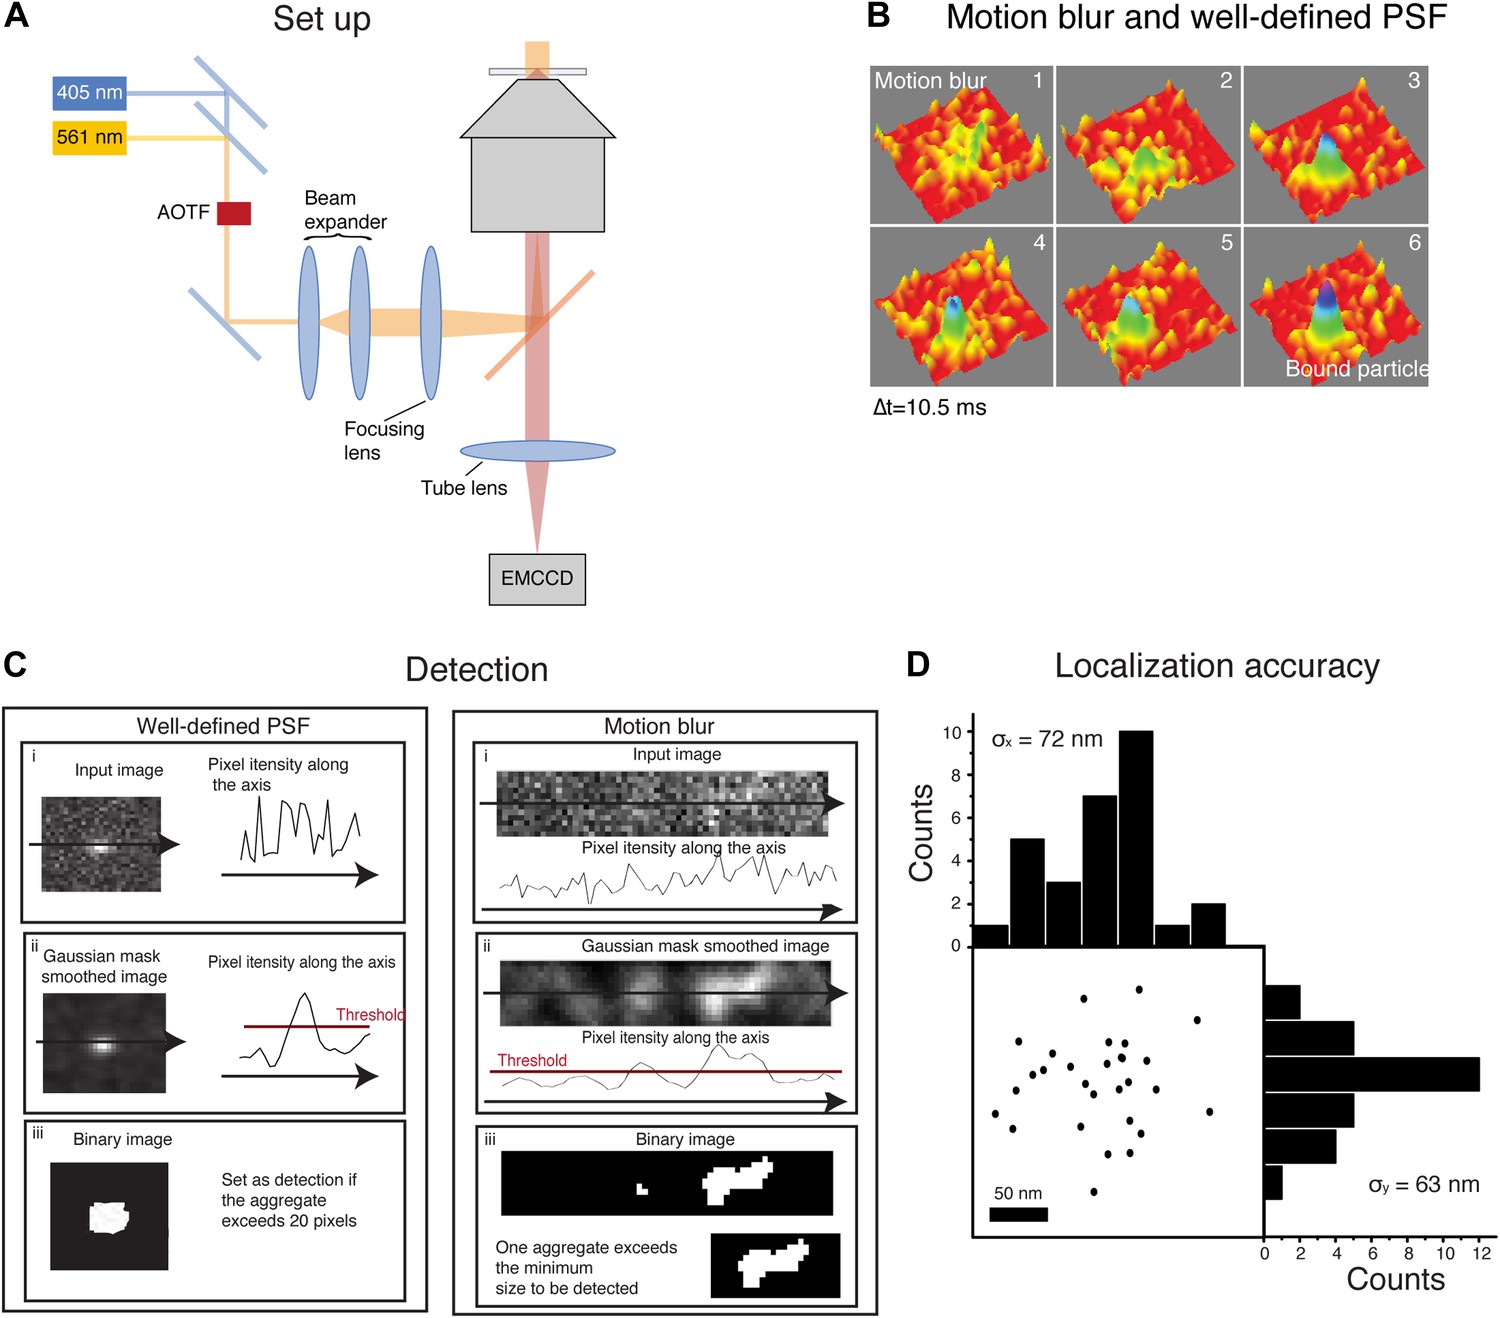
Motion blur and detection algorithm.
In panel A, schematics of the experimental set-up. The activation (405 nm) laser and the excitation (561 nm) laser were aligned on a single beam using a dichroic beam splitter. Their intensity and on/off switching ratio were independently controlled with an acousto-optic tunable filter (AOTF). The combined laser beam was expanded through a beam expander and focused on the rear plane of the objective in an inverted microscope, with the help of a long-pass dichroic. The emission from the sample was imaged through the tube lens with an EMCCD. Panel B shows the transition of a fast diffusing particle to a bound state. The image of the moving particle results in a motion blur whereas the image of the bound molecule is a well-defined PSF. In panel C, schematics of the steps followed by the detection algorithm for both a well-defined PSF and a motion blur. The initial image (i) was smoothed by a Gaussian mask and the threshold value set as the 80% percentile of the raw image (ii). Finally, the image was binarized according to the threshold and aggregates of sufficient size set as a positive detection. Panel D shows the estimation of the experimental localization accuracy computed for an immobile-like H2B protein. The position of the centroid of 29 consecutive detections represents the experimental error of the detection. Computation of the standard deviation of the mean along the X and Y axes is a measure of the pointing accuracy.
Figure 1—figure supplement 2
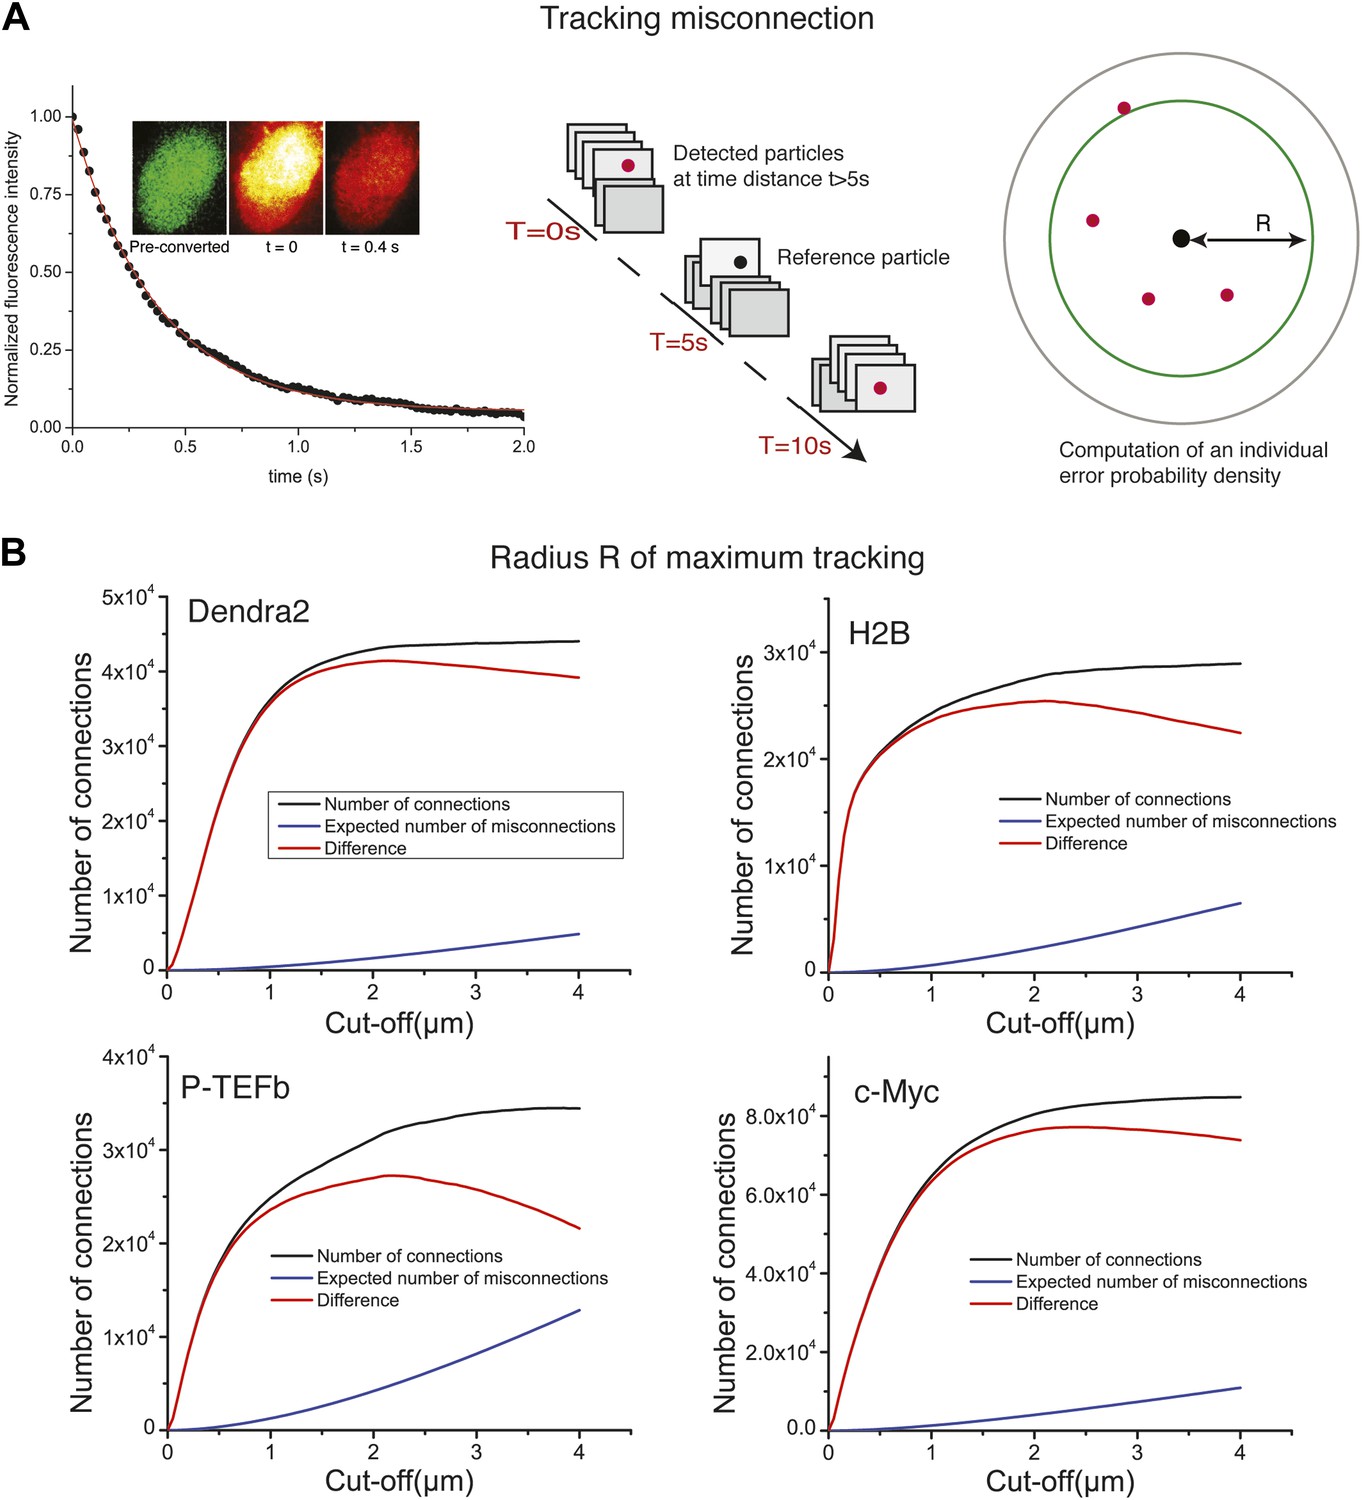
Tracking algorithm.
In A, decay of fluorescence intensity of the ensemble of Dendra2 fluorophores in the nucleus of a cell, after strong pulsed activation. The decay was fitted to a single exponential of lifetime τ = 600 ms. After 5 s of illumination, 99.9999% of the particles have bleached, allowing us to compute the misconnection probability. For each detected molecule, detections located at a time distance of at least 5 s were taken into account. Those detections have a negligible probability of 10−6 to arise from the same protein. For a given radius R, we could therefore compute the expected number of misconnections. In panel B, the number of connections, misconnections, and their difference as a function of the cut-off tracking radius R, for each protein under study are shown. Gradual increase of the cut-off distance increases the number of both connections and misconnections. The optimal cut-off radius R is reached when the number of connections reaches a plateau and only the number of misconnections increases. For all the proteins, we found an optimal value of ∼2 µm.
Figure 1—figure supplement 3
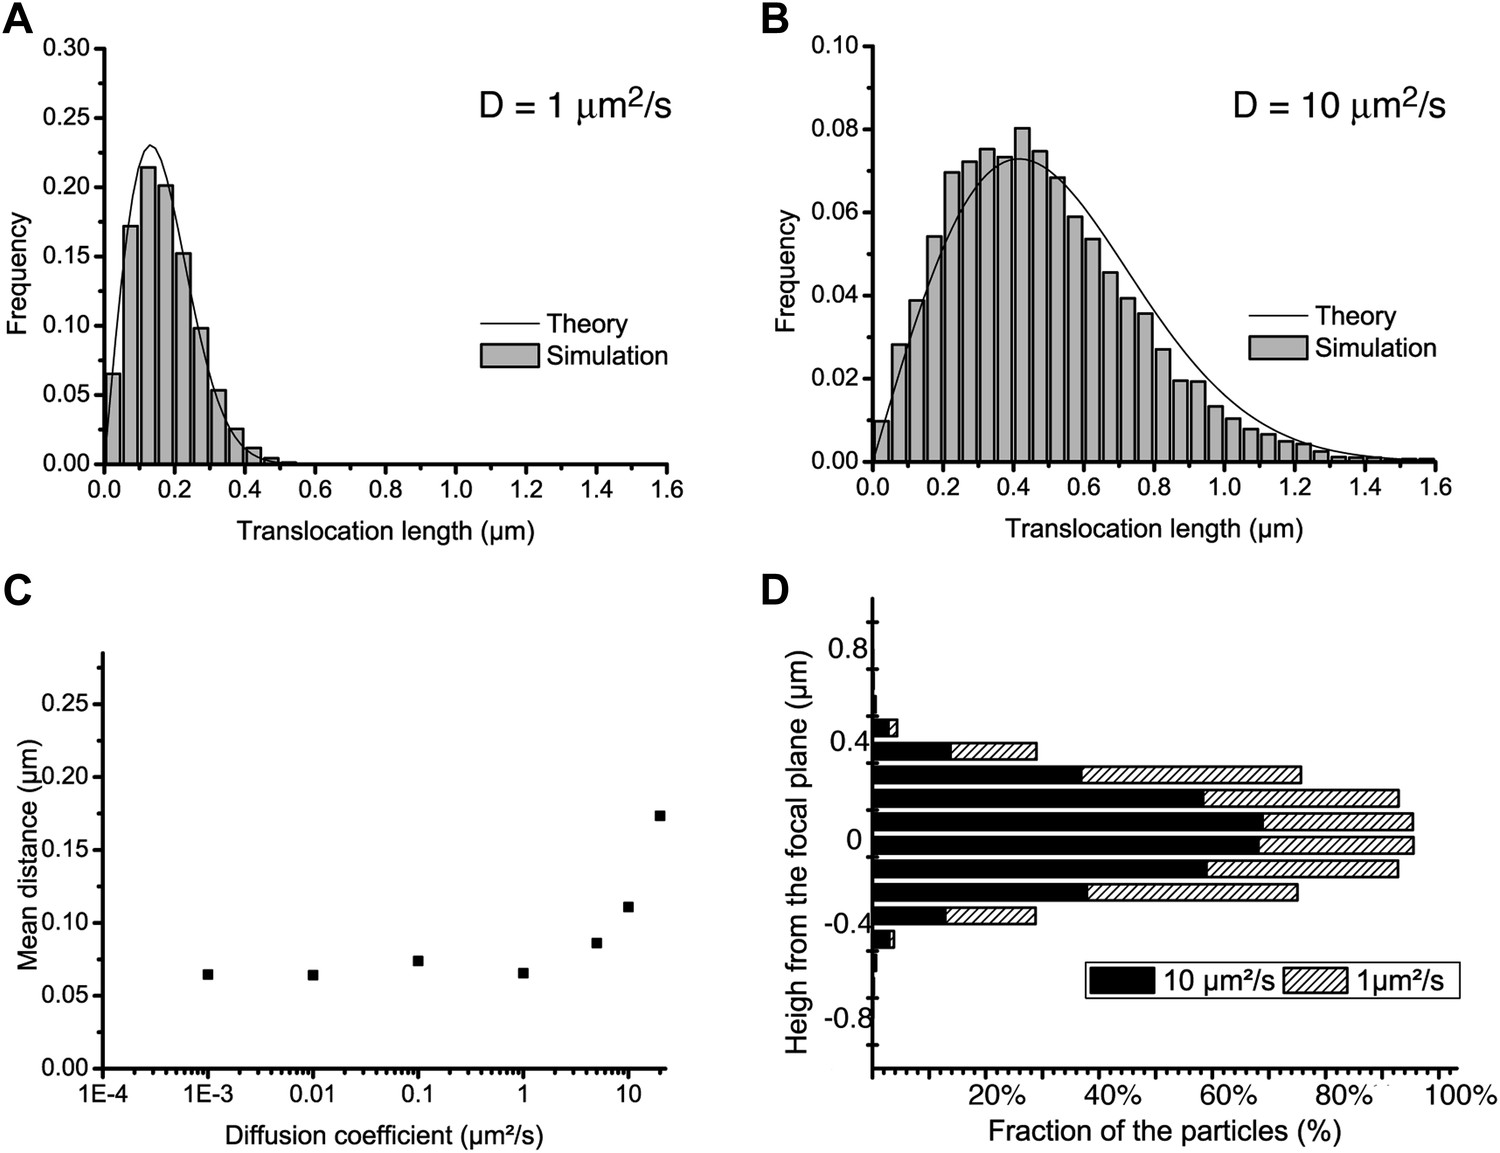
Localization accuracy and detection efficiency as a function of diffusion coefficient.
In panels A and B, step translocation histograms as retrieved by the detection and tracking algorithms on simulated videos of particles following pure Brownian diffusion, with different diffusion coefficients (D = 1 μm2/s and D = 10 μm2/s for A and B, respectively). In panel C, the localization accuracy of the detection is plotted as a function of the diffusion coefficient of the particle, for a series of simulated videos with increasing diffusion coefficient (0.001, 0.01, 0.1, 1, 10, and 20 μm2/s). In panel D, the percentage of detected particles is plotted as a function their distance to the focal plane, averaged over the acquisition time, for two diffusion coefficients: 1 μm2/s and 10 μm2/s.
Figure 2 with 2 supplements
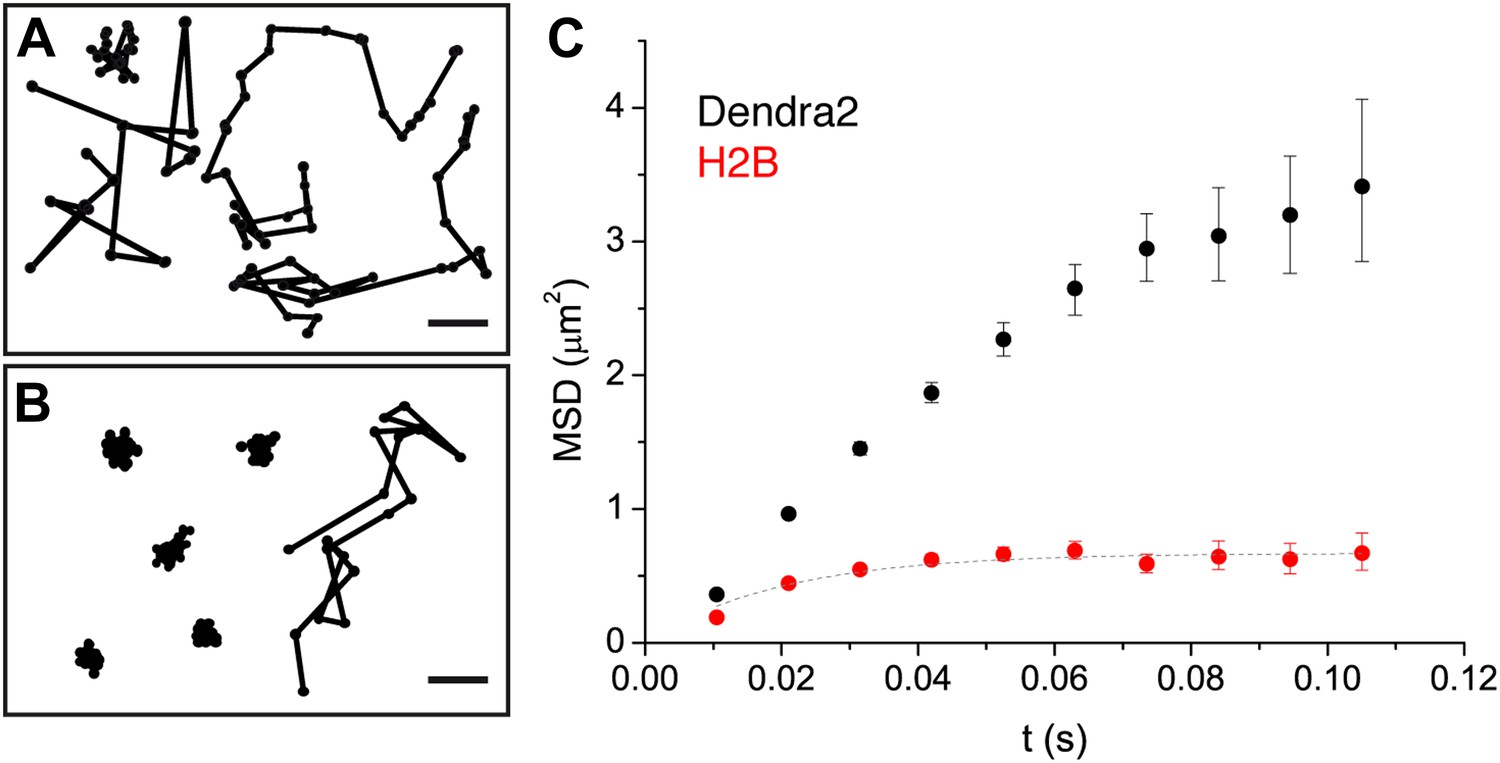
Diffusion properties of ‘free’ Dendra2 and H2B.
Examples of single molecule traces of the free fluorophore Dendra2 (A) and DNA-associated histone H2B (B). In (C), the averaged mean square displacement (MSD) as a function of time is represented for both proteins, with an interval of confidence of 95%. The averaged MSD curves were computed from a total of 18,364 trajectories (from 39 cells) for Dendra2, and 40,546 trajectories (from 32 cells) for H2B.
Figure 2—figure supplement 1
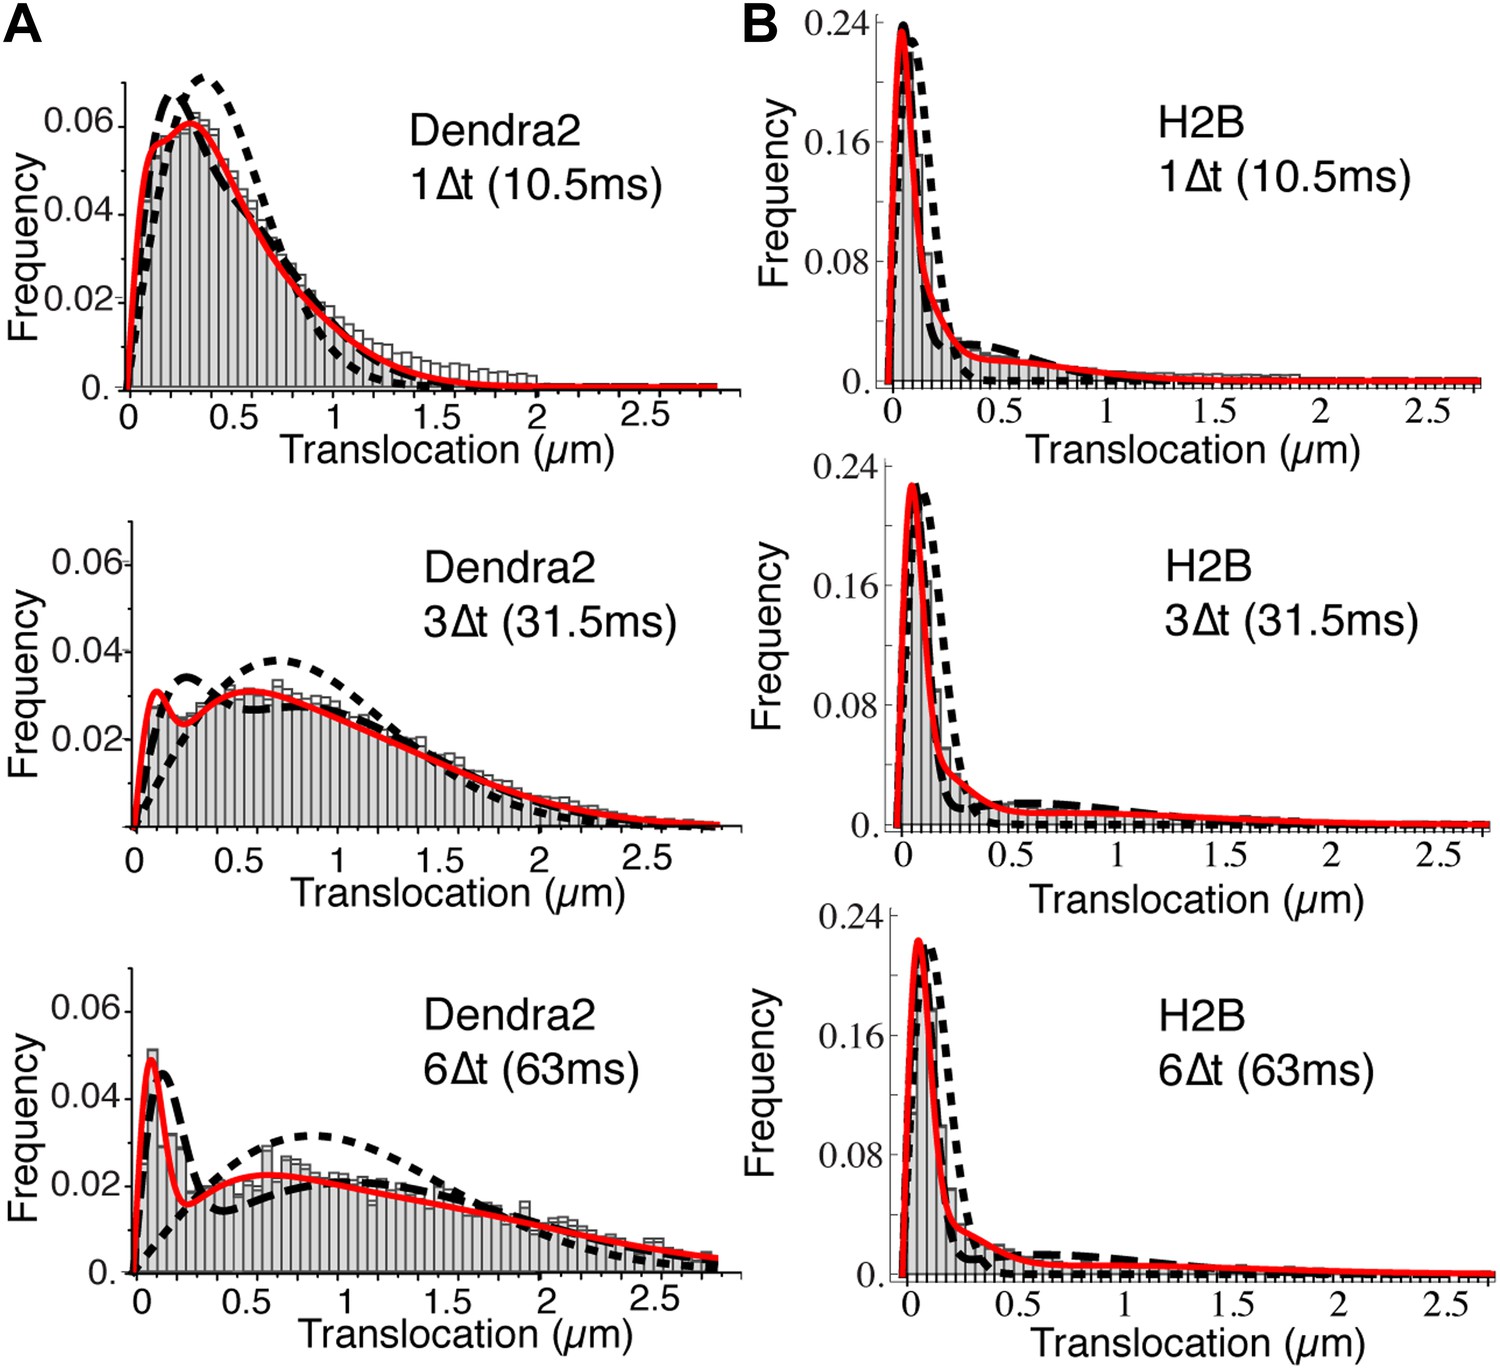
Translocation histograms of Dendra2 and H2B.
Translocation histograms of Dendra2 (A) and H2B (B), plotted for 1Δt (10 ms), 3Δt, and 6Δt. Fits of the step size distribution with one Brownian diffusive population (dotted line), two populations (dashed lines), and three diffusive populations (red solid line) are represented in the graphs. Three distinct populations were thus needed to fit the translocation histograms at all time intervals. For ‘free’ Dendra2, ∼4% of the molecules were within the experimental localization accuracy (∼70 nm). The other two populations could be distinguished by their diffusion coefficients: 24% moved with a slow diffusion coefficient (D2 = 2.6 μm2/s) and 72% moved faster (D3 = 13 μm2/s). For Dendra2-H2B, 35% of the molecules appeared immobile and might correspond to molecules engaged in chromatin-bound nucleosomes. The two populations of mobile Dendra2-H2B molecules were D2 = 0.5 μm2/s, 25%, and D3 = 13 μm2/s, 40%, respectively.
Figure 2—figure supplement 2

Population exclusion.
In panel A, the average single step translocations (Δt = 10.5 ms) plotted as a function of the length of the trace for ‘free’ Dendra2. In panel B, the number of detected translocations is shown for increasing diffusion coefficient (0.001, 0.01, 0.1, 1, 10, and 20 μm2/s) for simulated videos of the same duration, volume, and particle concentration (one single diffusing particle). Simulations with a mixture of two diffusive species with different diffusion coefficients of 1 μm2/s and 10 μm2/s were also performed. The translocation histogram in panel C shows the effect of the bias due to the lower percentage of detections of fast particles. The same effect can be observed at larger lag times in the difference for the theoretical and measured averaged MSD shown in panel D.
Figure 3 with 3 supplements
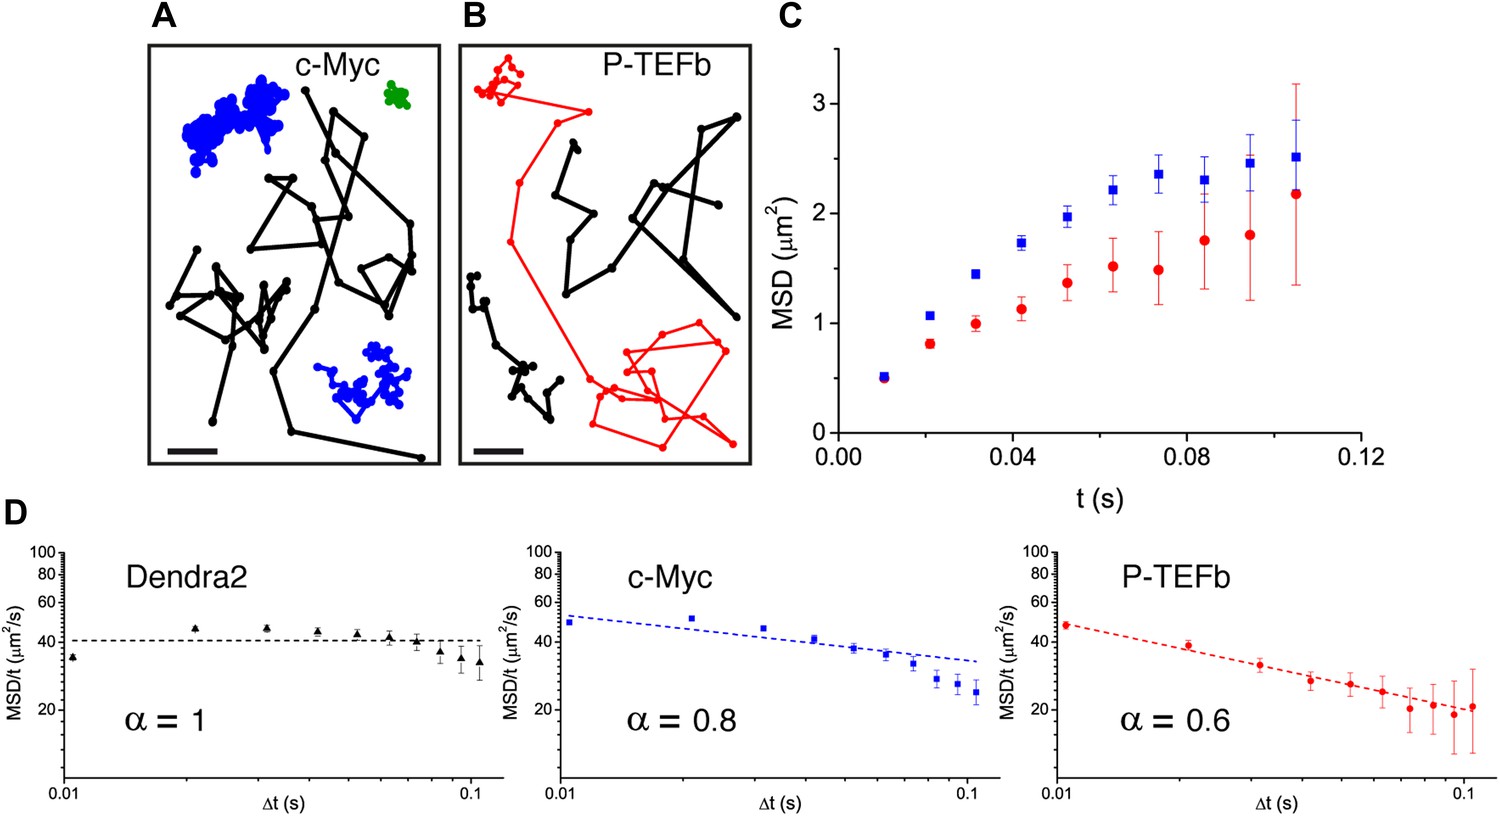
Diffusion properties of c-Myc and P-TEFb.
For c-Myc (A) and P-TEFb (B), examples of single molecule traces. From these, we plotted the averaged mean square displacement (MSD) as a function of the lag time with intervals of confidence of 95% (panel C), from a total of 33,645 trajectories (from 42 cells) for c-Myc and 16,852 trajectories (from 38 cells) for P-TEFb. In panel D, the MSD over time was represented as a function of time in logarithmic scale for ‘free’ Dendra2, c-Myc and P-TEFb. The fit in the inset follows the time rescaling law MSD(t) = D tα, where α = 1 for normal diffusion, and 0 < α < 1 for subdiffusive behavior.
Figure 3—figure supplement 1
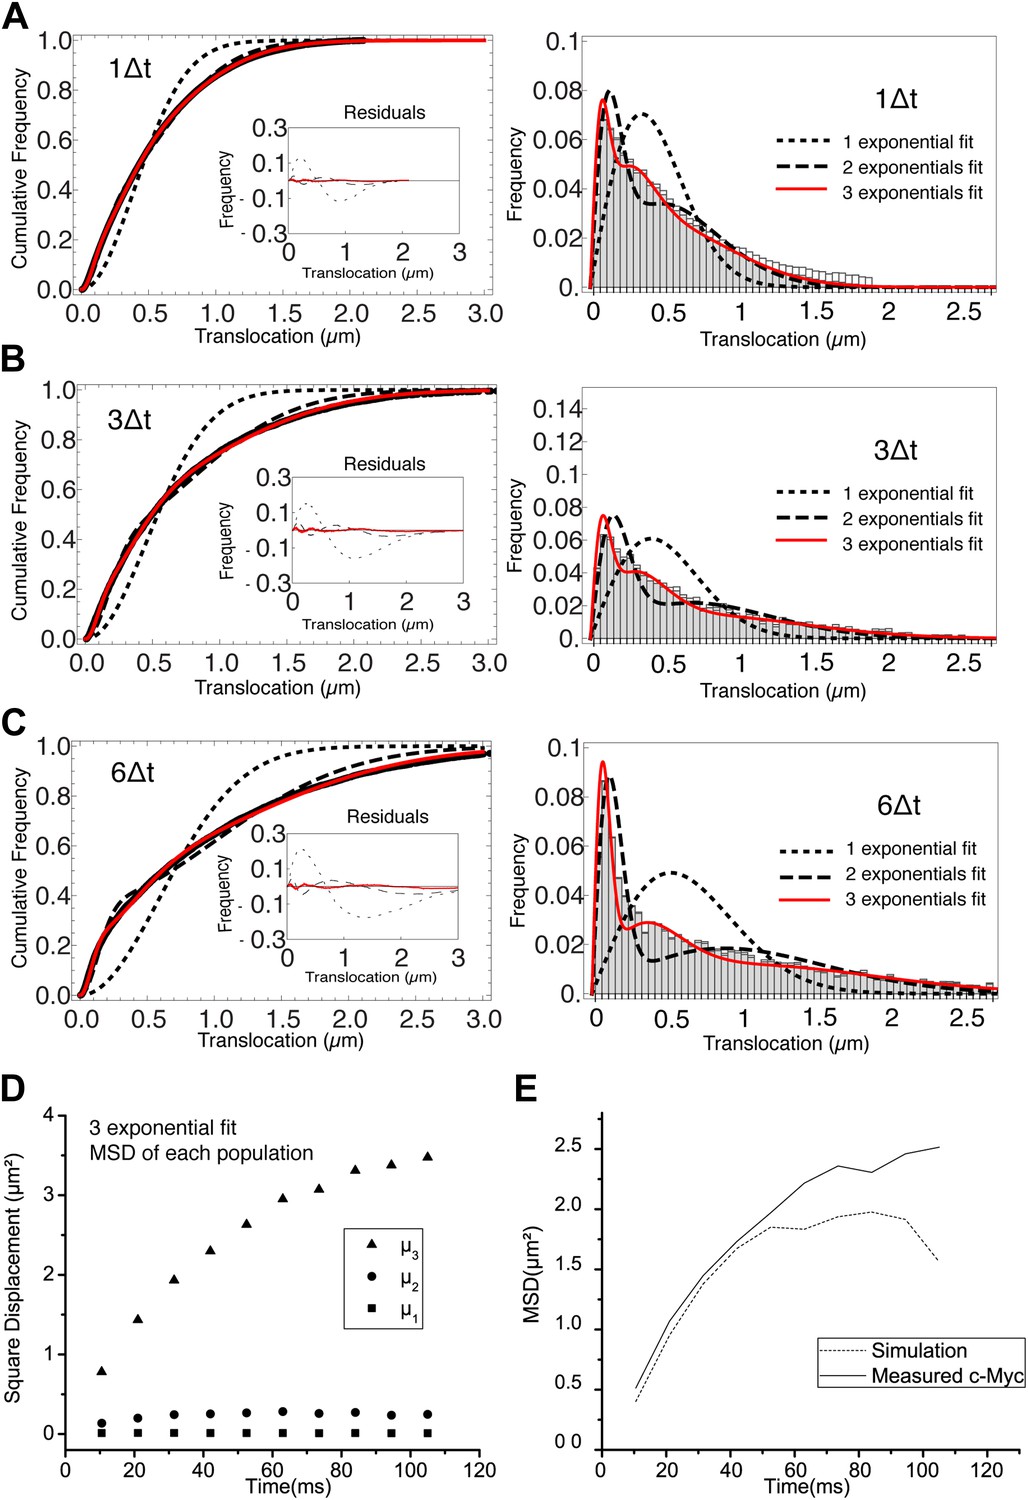
Analysis of the cumulative distribution function of step translocations for c-Myc.
Cumulative distribution function (CDF) of the step translocations is plotted in red for three different time intervals (1Δt, 3Δt and 6Δt in panels A, B, and C, respectively; Δt = 10.5 ms). The fit of the CDF is shown for 1 (dotted line) 2 (dashed line) and 3 (solid line) Brownian diffusive populations. In the inset, the residuals of the fits are shown. On the right hand side, the step translocation histograms from which the CDF were calculated, shown with the results of the CDF fit for 1, 2, and 3 populations. At increasing lag times, three diffusive species were needed to retrieve a good fit of the data. In panel D, the temporal evolution of the exponential coefficient µ for each population is shown. The diffusion coefficient for each population was calculated by a linear regression of the first four points of the MSD. In panel E, a simulation was performed using the results of the measurement of the diffusing coefficients and corresponding rescaled proportions (D1 = 0 μm2/s, 9%; D2 = 1.4 μm2/s, 20%; D3 = 14.4 μm2/s, 70%) and the resulting MSD is shown.
Figure 3—figure supplement 2
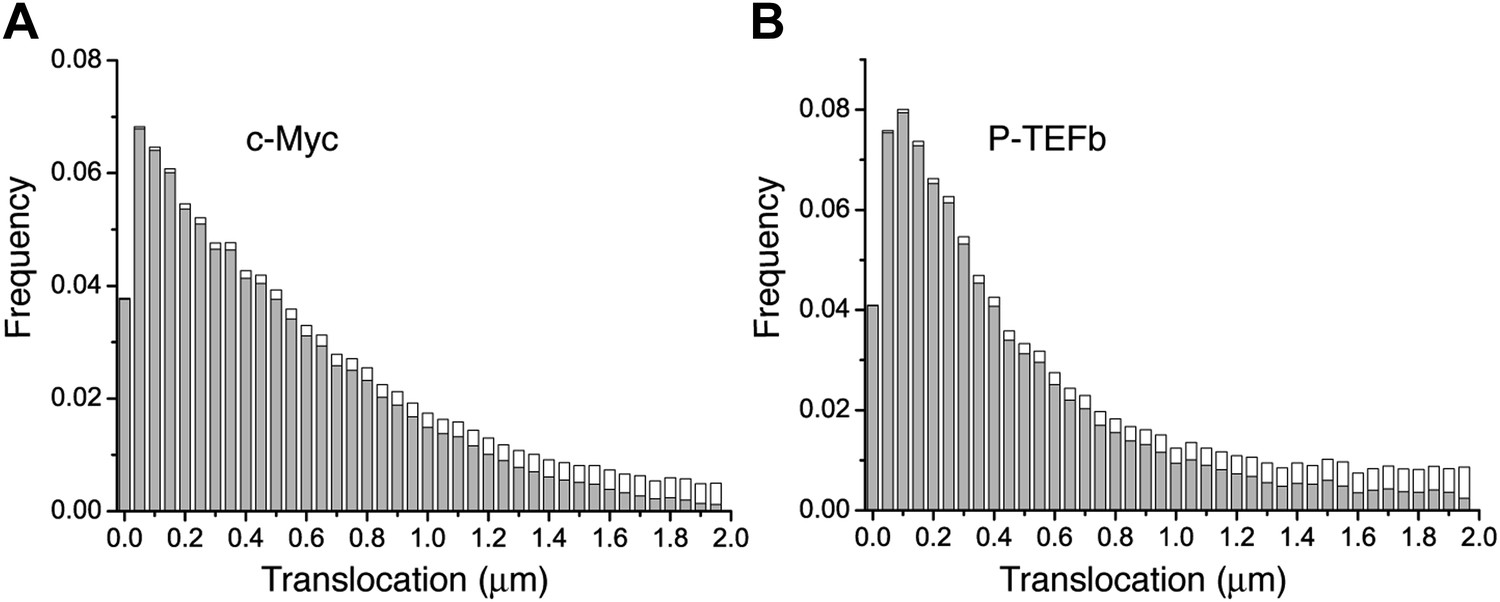
Histogram of single translocations for c-Myc and P-TEFb.
Histograms of single step translocation lengths for c-Myc (A) and P-TEFb (B), for 1Δt = 10.5 ms. Black curves are the result of the fit of the cumulative distribution function with three populations. Note that both histograms span within the same range of lengths.
Figure 3—figure supplement 3
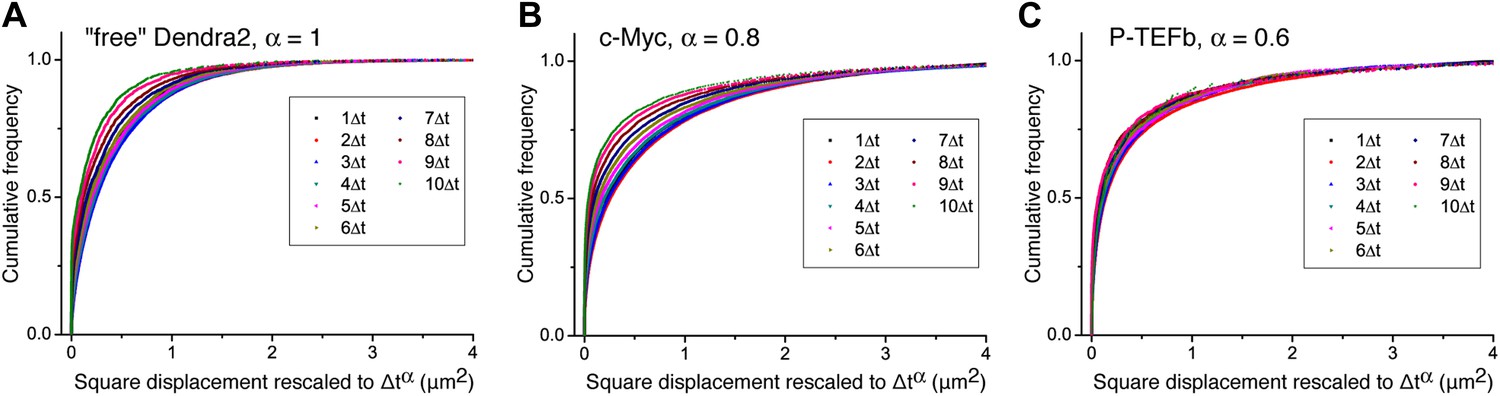
Cumulative histogram of square displacements rescaled in time.
For ‘free’ Dendra2 (A), c-Myc (B), and P-TEFb (C), cumulative histograms of the square displacements rescaled in time to Δtα, for increasing lag times. The α value for each molecule was obtained from the fit in Figure 3. Only the data obtained from P-TEFb show a collapse of the curves, indicating the goodness of the fit to the anomalous diffusion model.
Figure 4 with 1 supplement
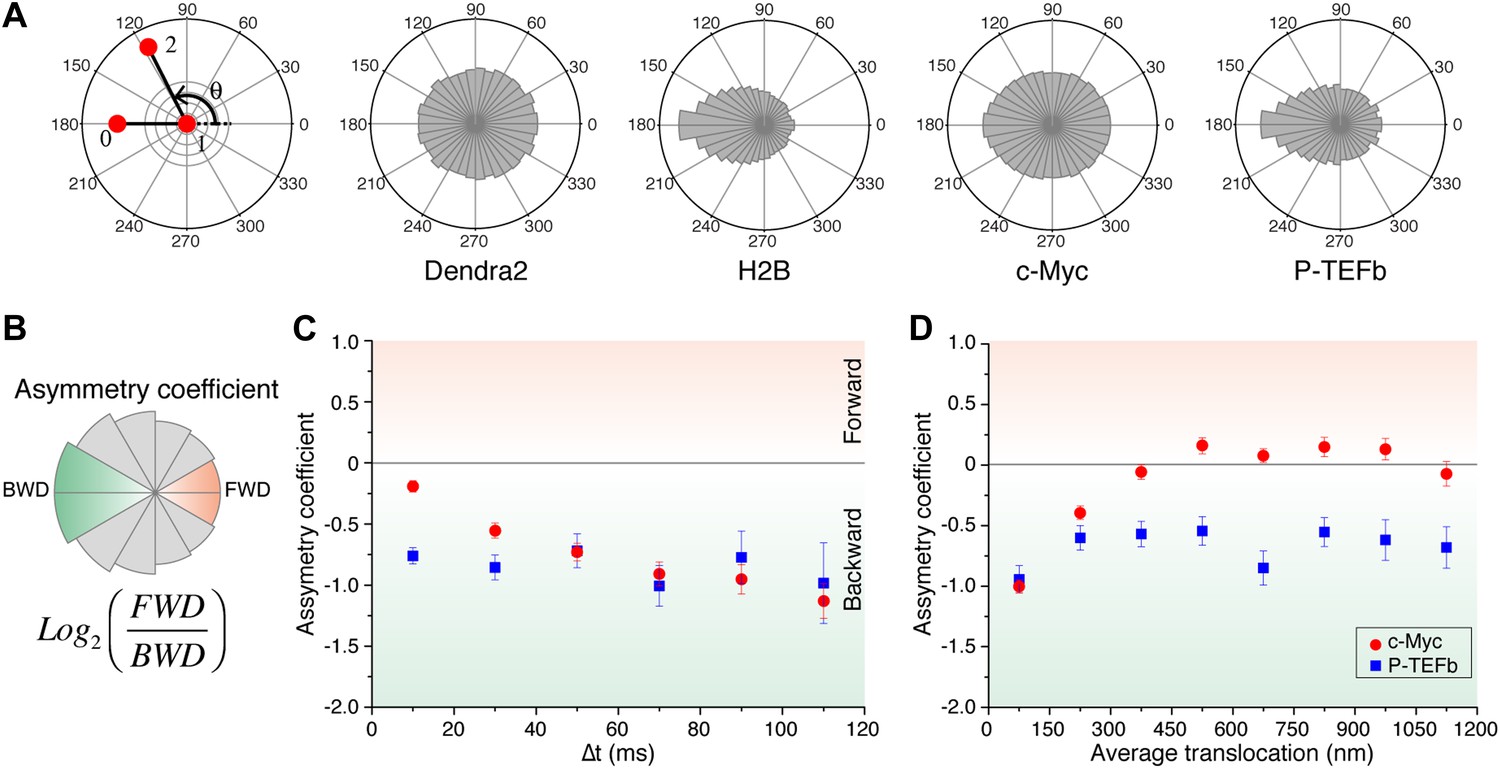
Angle distribution between consecutive steps.
(A) Distribution histograms, in polar coordinates, of the angle θ formed between the vectors of two consecutive translocation steps (vectors formed by positions at time 0 and 10 ms, and between 10 ms and 20 ms), for Dendra2 (23,883 total number of angles), H2B (54,820 angles), c-Myc (46,540 angles), and P-TEFb (13,820 angles). The asymmetry coefficient (AC) was calculated as the logarithm to the base 2 of the ratio between the frequency of forward angles (between 0° and 30°) and the backward angles (150°–180°) (B). In panel (C), the temporal evolution of AC at increasing lag times has been plotted (i.e., the angle between the vectors formed by the positions at 0 to 10 ms and 10 ms to 20 ms, first data point at 10 ms; angle between the vectors formed at positions 0 to 20 ms and 20 ms to 40 ms, second data point at 20 ms, etc). In (D), dependence of the AC with the average translocation value, calculated between the two consecutive steps forming the angle θ and binned at 150 nm. Error bars in (C) and (D) were calculated as the standard deviation of 50 resamplings using 50% of the data randomly chosen from the radial histograms. Note that the error bars increase as fewer angles are available at increasing lag times and large translocations. Also, how the limited localization accuracy is reflected in the first data point of the spatial dependence of AC in (D).
Figure 4—figure supplement 1
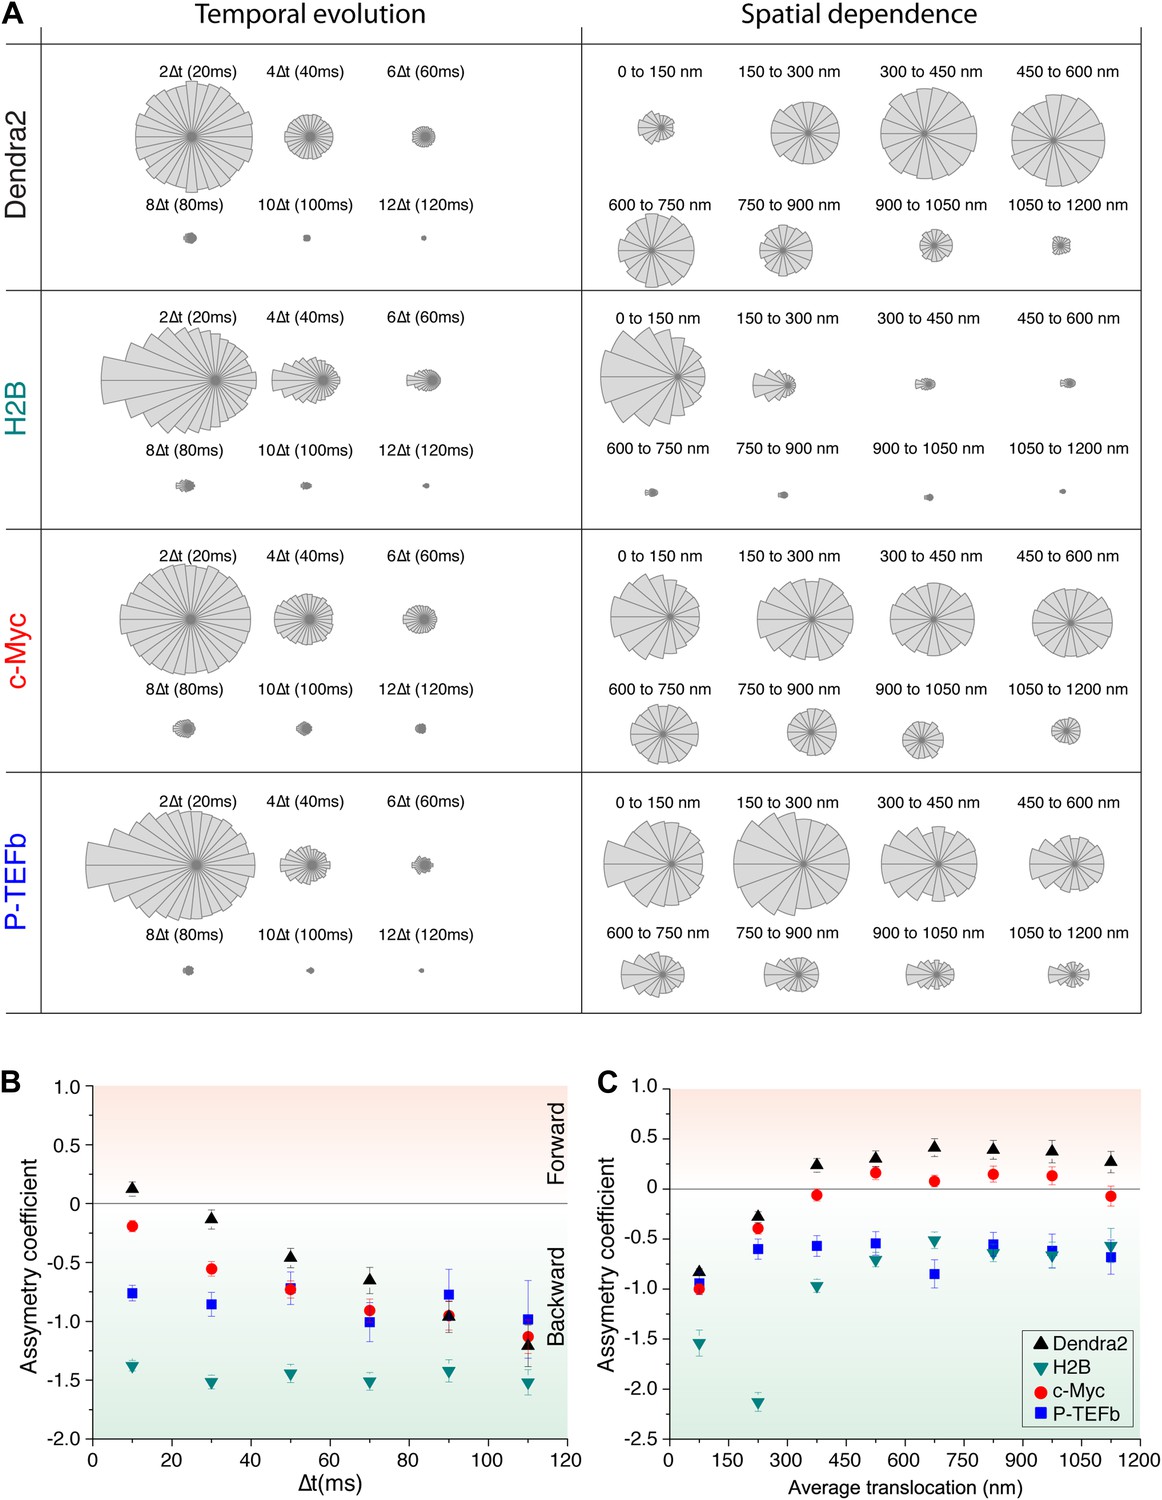
Temporal and spatial dependence of the angular distribution of angles and their asymmetry coefficient (AC).
Radial distribution of angles and their temporal and spatial dependence for the four proteins under study (Dendra2, H2B, c-Myc, and P-TEFb) (A). The temporal evolution was calculated as a function of lag time (angle between the vectors formed by the positions at 0 to 10 ms and 10 ms to 20 ms, 2Δt; angle between the vectors formed at positions 0 to 20 ms and 20 ms to 40 ms, 4Δt, etc). For each protein, the histograms were normalized to the total number of angles. The spatial dependence was calculated as a function of the average translocation length between the two steps forming the angle θ, with a bin of 150 nm. In (B) and (C), the asymmetry coefficient was computed from the angular histograms plotted in panel (A).
Figure 5 with 3 supplements
Simulated trajectories and distribution of angles.
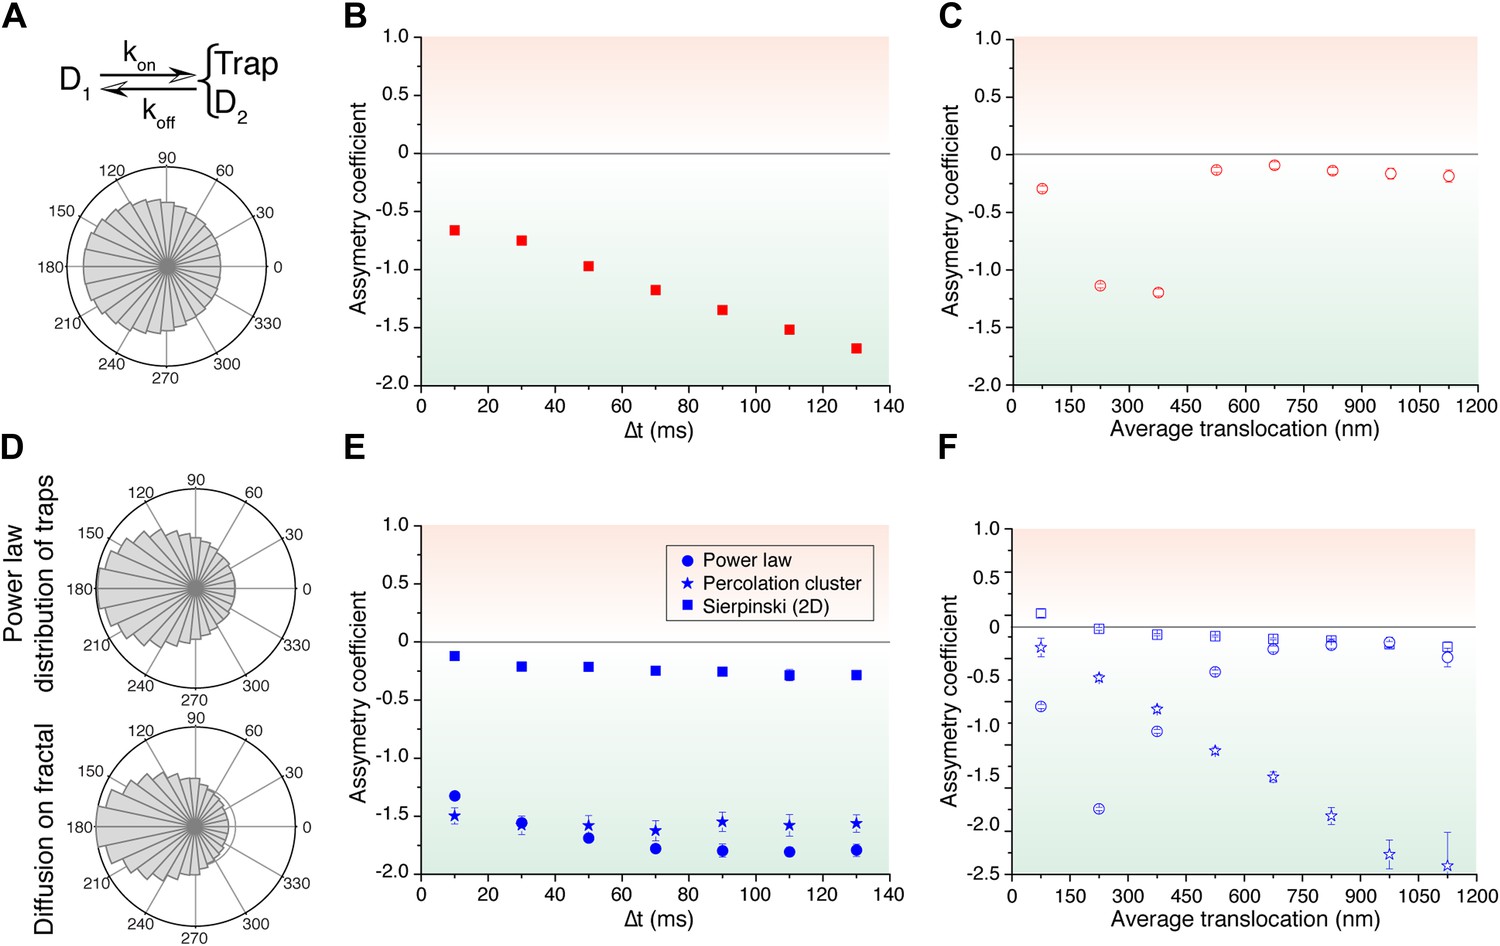
(A) Distribution of angles between consecutive translocations for the intermittent diffusion plus confinement model. In this model, a fast diffusing particle with diffusion coefficient D1 has an association rate probability Kon to enter into a confined volume (of radius Rtrap) with slower diffusion coefficient D2, and dissociation rate Koff. (The values of the parameters were D1 = 14 μm2/s, D2 = 1 μm2/s, Rtrap = 500 nm, Kon = 0.0015, Koff = 0.02.). In panels (B) and (C), the dependence of AC with the lag time and the average translocation step. In (D), angular distributions of the intermittent trap simulations with a distribution of trap sizes given by a power law, as well as the simulations of random walks on a percolation cluster. In panel (E), temporal dependence of the asymmetry coefficient (AC) for three types of simulations: power law distribution of trap sizes, random walks on a percolation cluster, and random walks on a 2D Sierpinski carpet. In panel (F), dependence of the AC with the average translocation size.
Figure 5—figure supplement 1
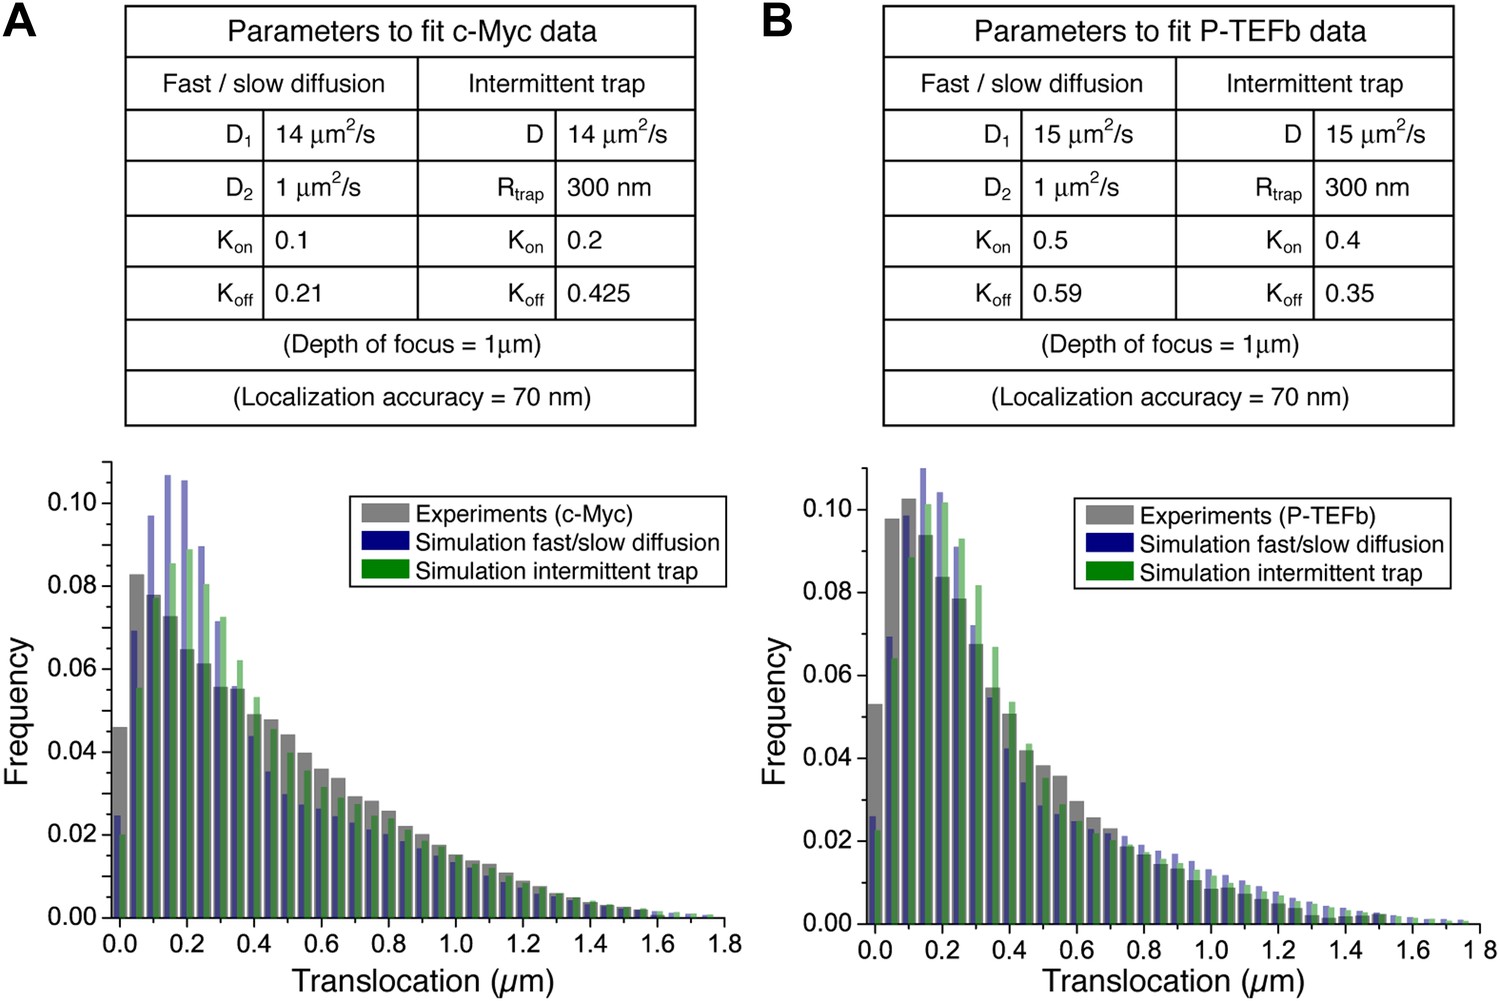
Simple models of intermittent diffusion and intermittent confinement.
Simulation parameters that best fit the experimental step translocation histograms of c-Myc (A) and P-TEFb (B). In the fast/slow diffusion model, D1 and D2 were determined by a two-population fit of the cumulative translocation histograms. Likewise, the rate Kon/Koff was determined by the population rate obtained in such a fit.
Figure 5—figure supplement 2
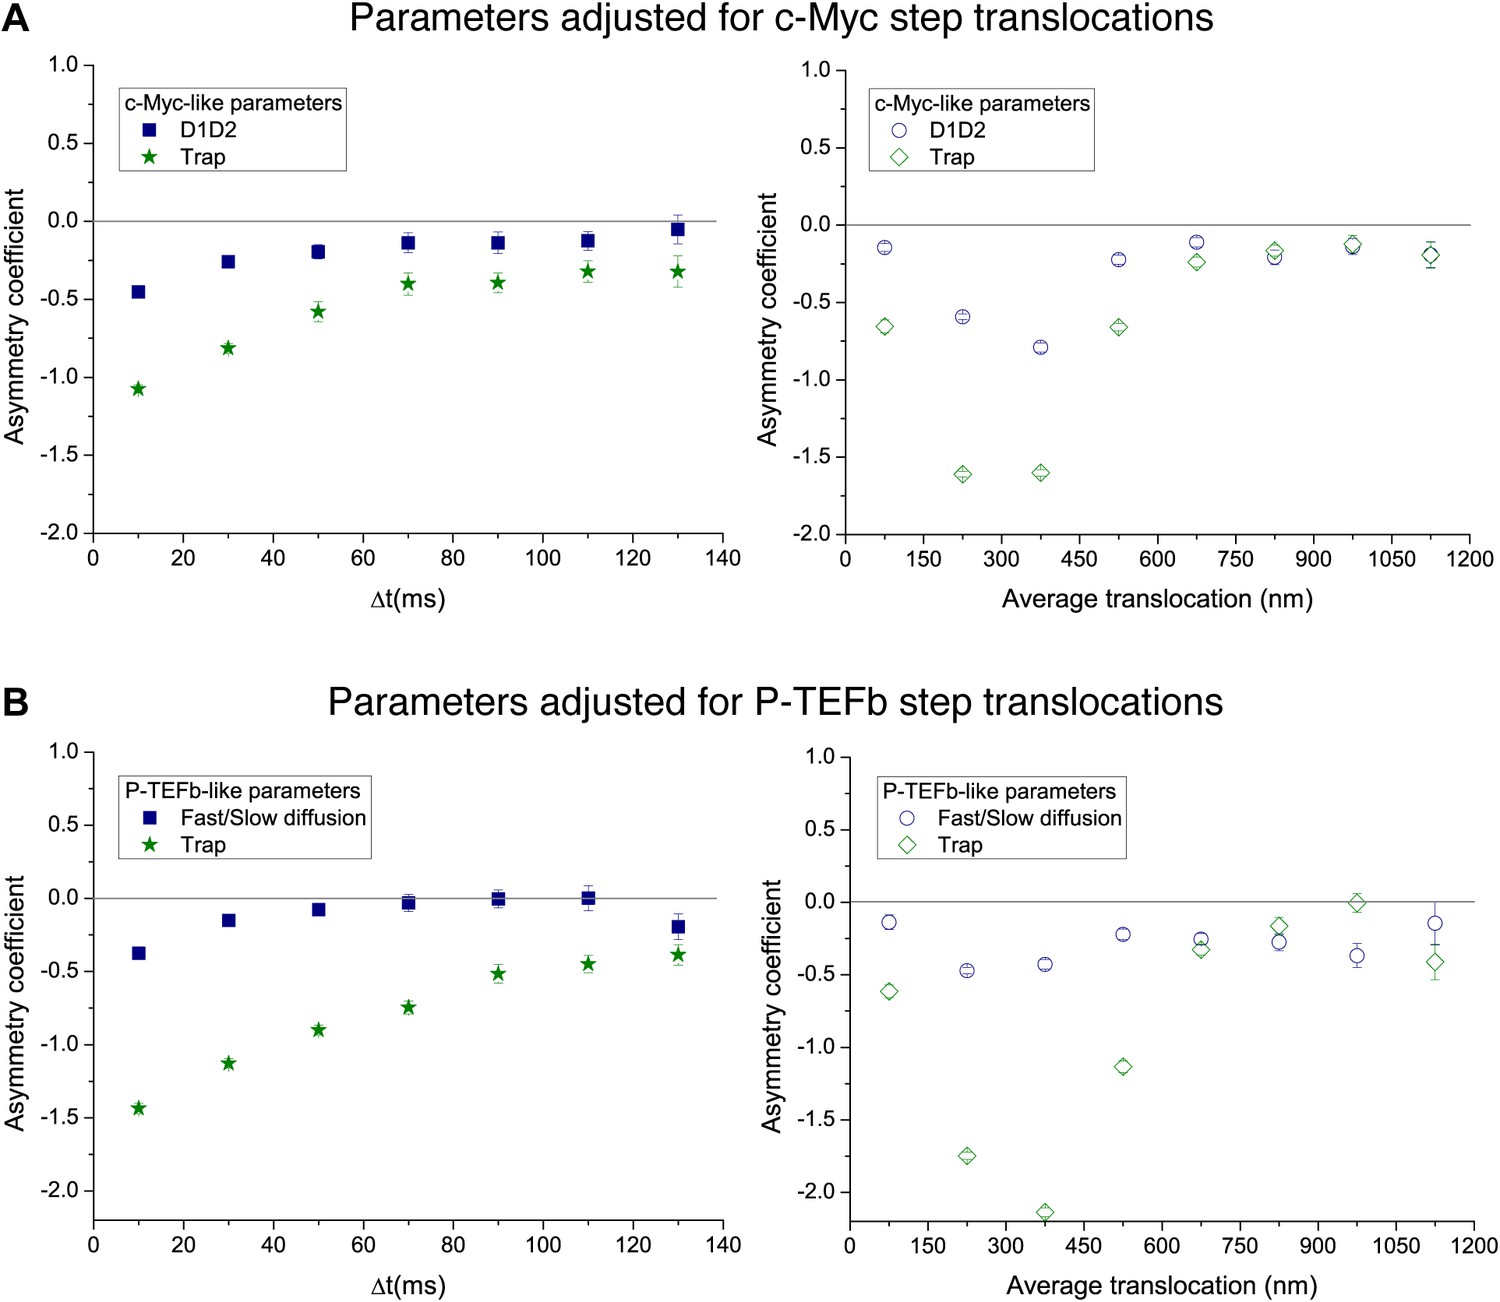
Temporal and spatial dependence of the asymmetry coefficient for the simple intermittent models.
Temporal and spatial dependence of the asymmetry coefficient (Figure 4B) for the intermittent diffusion and intermittent confinement models. In panel (A), the parameters that matched the translocation histogram of c-Myc were used. In panel (B), those that match P-TEFb.
Figure 5—figure supplement 3
Continuous-time random walk.
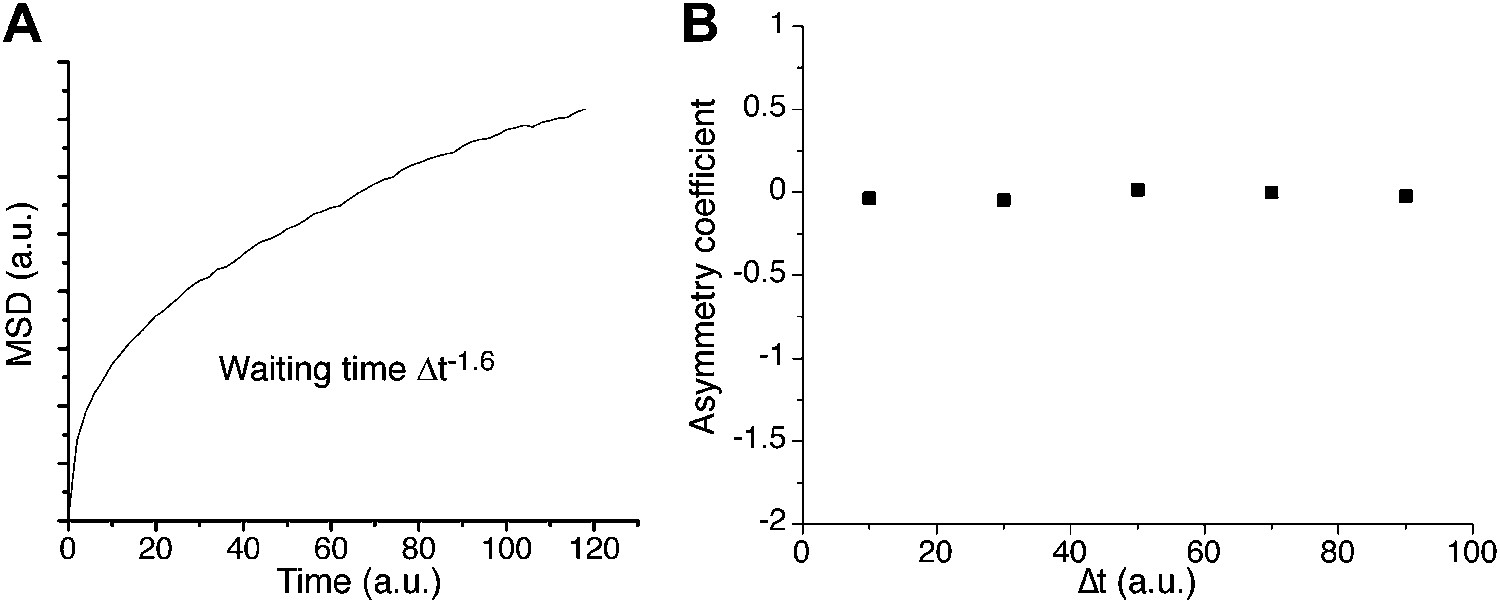
In A, ensemble averaged mean square displacement (MSD) for a continuous-time random walk (CTRW) on a cubic lattice, with a heavy-tailed probability distribution of power −1.6 and a position recorded every 1000 steps. The MSD exhibits an anomalous curvature. The corresponding asymmetry coefficient is shown in panel B. The distribution of angles is symmetric and uniform at all time scales.
Figure 6 with 1 supplement
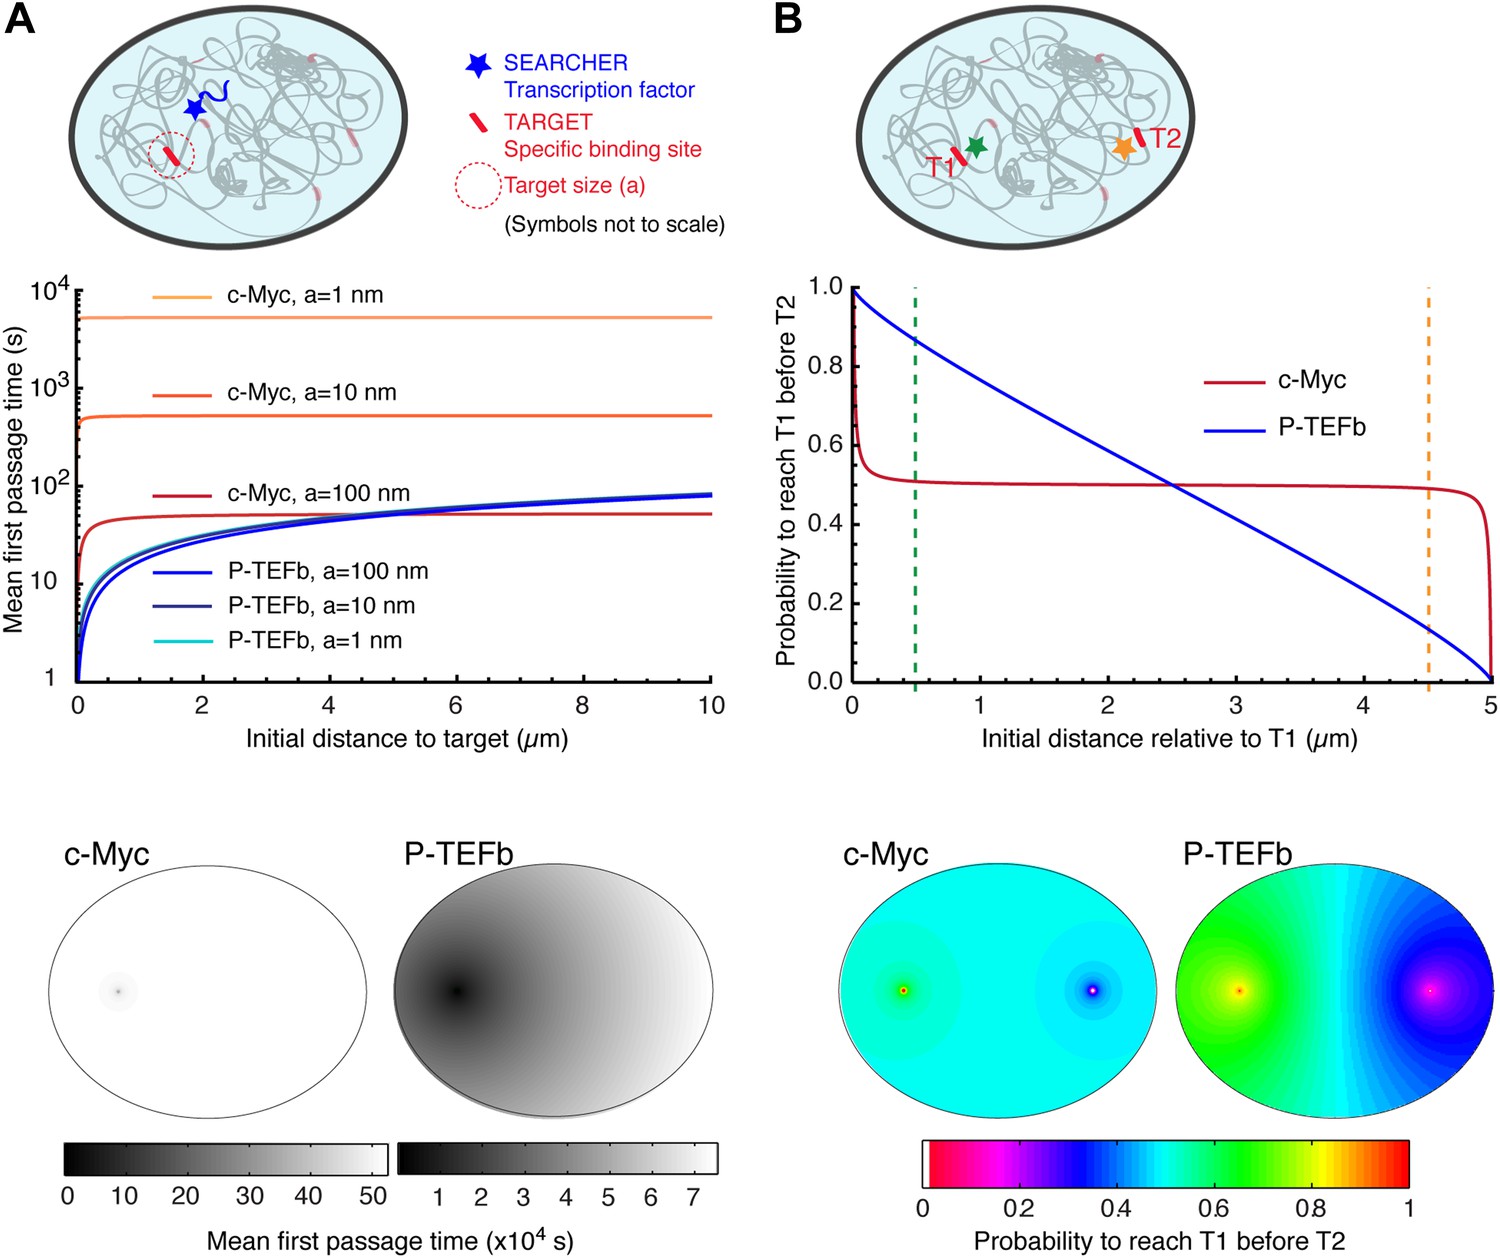
Compact vs non-compact exploration.
(A) Mean first passage time (MFPT) as a function of the initial distance to the target for both c-Myc (non-compact exploration; Df = 3, Dw = 2, and diffusion coefficient D = 9.8 μm2/s) and P-TEFb (compact exploration; Df = 2.6, Dw = 3.3, and scale factor of the MSD fit D = 7.8). The MFPT was calculated for three different target sizes: 1 nm, 10 nm, and 100 nm. Also, two-dimensional representation of the plots for a = 100 nm are depicted in the lower part of the panel. (B) Probability of interaction with target 1 before interacting with target 2, placed at a distance of 20 μm from each other, as a function to the relative distance between the searcher and the targets; two-dimensional plots in the lower side of the panel.
Figure 6—figure supplement 1
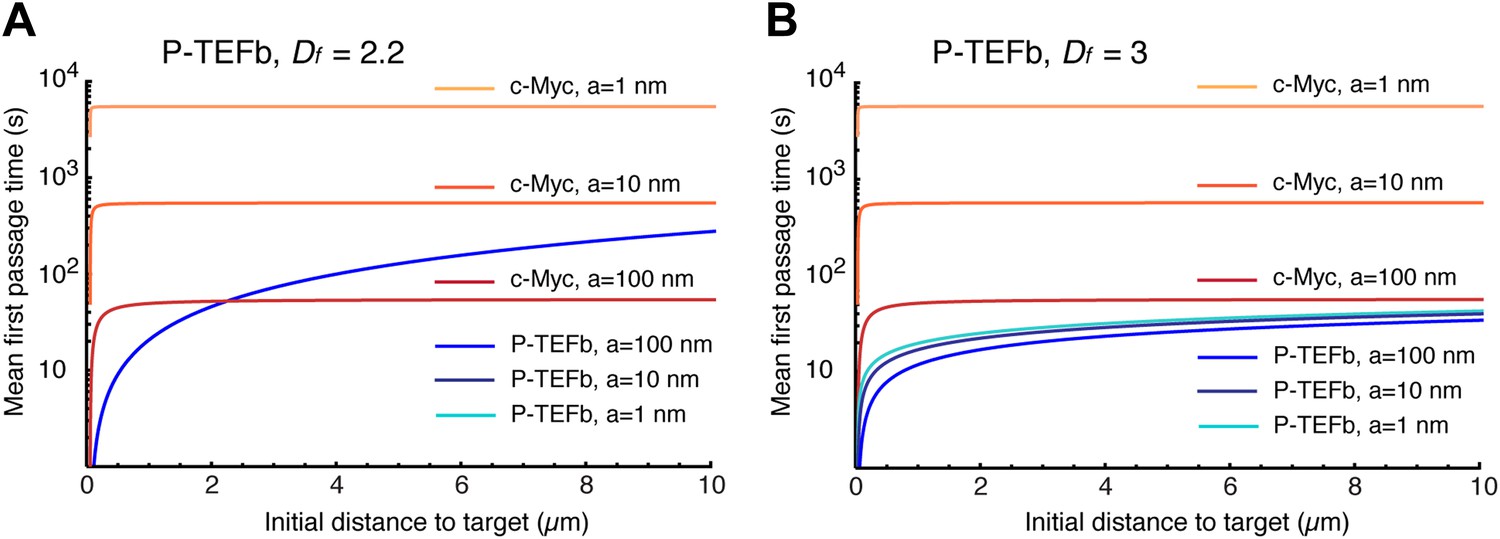
Mean first passage times with Df = 2.2 and Df = 3.
Mean first passage time (MFPT) as a function of the initial distance to the target for c-Myc (non-compact exploration; Df = 3, Dw = 2, and diffusion coefficient D = 9.8 μm2/s) and P-TEFb calculated with two fractal dimensions: Df = 2.2 in (A), and Df = 3 in (B) (Dw = 3.3, and scale factor of the MSD fit D = 7.8). The MFPT was calculated for three different target sizes: 1 nm, 10 nm, and 100 nm (in A, the three curves overlap in the case of P-TEFb).
Videos
Video 1
Raw video of a single Dendra2 molecule diffusing in the nucleoplasm of a U2OS cell.
Running parallel to the raw image, reconstruction of the trace by the localization and tracking algorithms. Exposure time was 10 ms, with 0.5 ms dead time between frames. Running time and scale bars are stamped on the video.
Video 2
Raw video of a single H2B molecule in the nucleoplasm of a U2OS cell.
Running parallel to the raw image, reconstruction of the trace by the localization and tracking algorithms. Exposure time was 10 ms, with 0.5 ms dead time between frames. Running time and scale bars are stamped on the video.
Video 3
Raw video of a single c-Myc molecule displaying slow diffusion (D2 ≈ 0.5 µm2/s) in the nucleoplasm of a U2OS cell.
Running parallel to the raw image, reconstruction of the trace by the localization and tracking algorithms. Exposure time was 10 ms, with 0.5 ms dead time between frames. Running time and scale bars are stamped on the video.
Video 4
Raw video of a single c-Myc molecule displaying fast diffusion (D1 ≈ 13.5 µm2/s) in the nucleoplasm of a U2OS cell.
Running parallel to the raw image, reconstruction of the trace by the localization and tracking algorithms. Exposure time was 10 ms, with 0.5 ms dead time between frames. Running time and scale bars are stamped on the video.
Video 5
Raw video of a single P-TEFb molecule diffusing in the nucleoplasm of a U2OS cell.
Running parallel to the raw image, reconstruction of the trace by the localization and tracking algorithms. Exposure time was 10 ms, with 0.5 ms dead time between frames. Running time and scale bars are stamped on the video.
Download links
A two-part list of links to download the article, or parts of the article, in various formats.
Downloads (link to download the article as PDF)
Open citations (links to open the citations from this article in various online reference manager services)
Cite this article (links to download the citations from this article in formats compatible with various reference manager tools)
Single-molecule tracking in live cells reveals distinct target-search strategies of transcription factors in the nucleus
eLife 3:e02230.
https://doi.org/10.7554/eLife.02230


