Evolution of reduced co-activator dependence led to target expansion of a starvation response pathway
- Howard Hughes Medical Institute, Harvard University, United States
- Harvard University, United States
Figures
Figure 1

Difference among three yeast species in their dependence on Pho2 for gene induction and organismal survival under low Pi conditions.
(A) Induction of the secreted phosphatase in each species measured by a semi-quantitative acid phosphatase assay (Wykoff et al., 2007). The intensity of the red color indicates the total activity of the secreted acid phosphatase from the cell colony. For S. cerevisiae and C. glabrata, strains lacking the negative regulator of Pho4 – Pho80 – were spotted on synthetic medium with 10 mM Pi. For C. albicans, strains with PHO80 wild-type were spotted on synthetic medium lacking inorganic phosphate; the pho2∆ strain was not able to grow on this plate. (B) Colony growth phenotype of the wild-type, pho4∆, pho2∆ strains in each of the three species, under different Pi concentrations. In both panels, two technical replicates of four-fold serial dilutions from the same culture are shown for each strain.
Figure 2
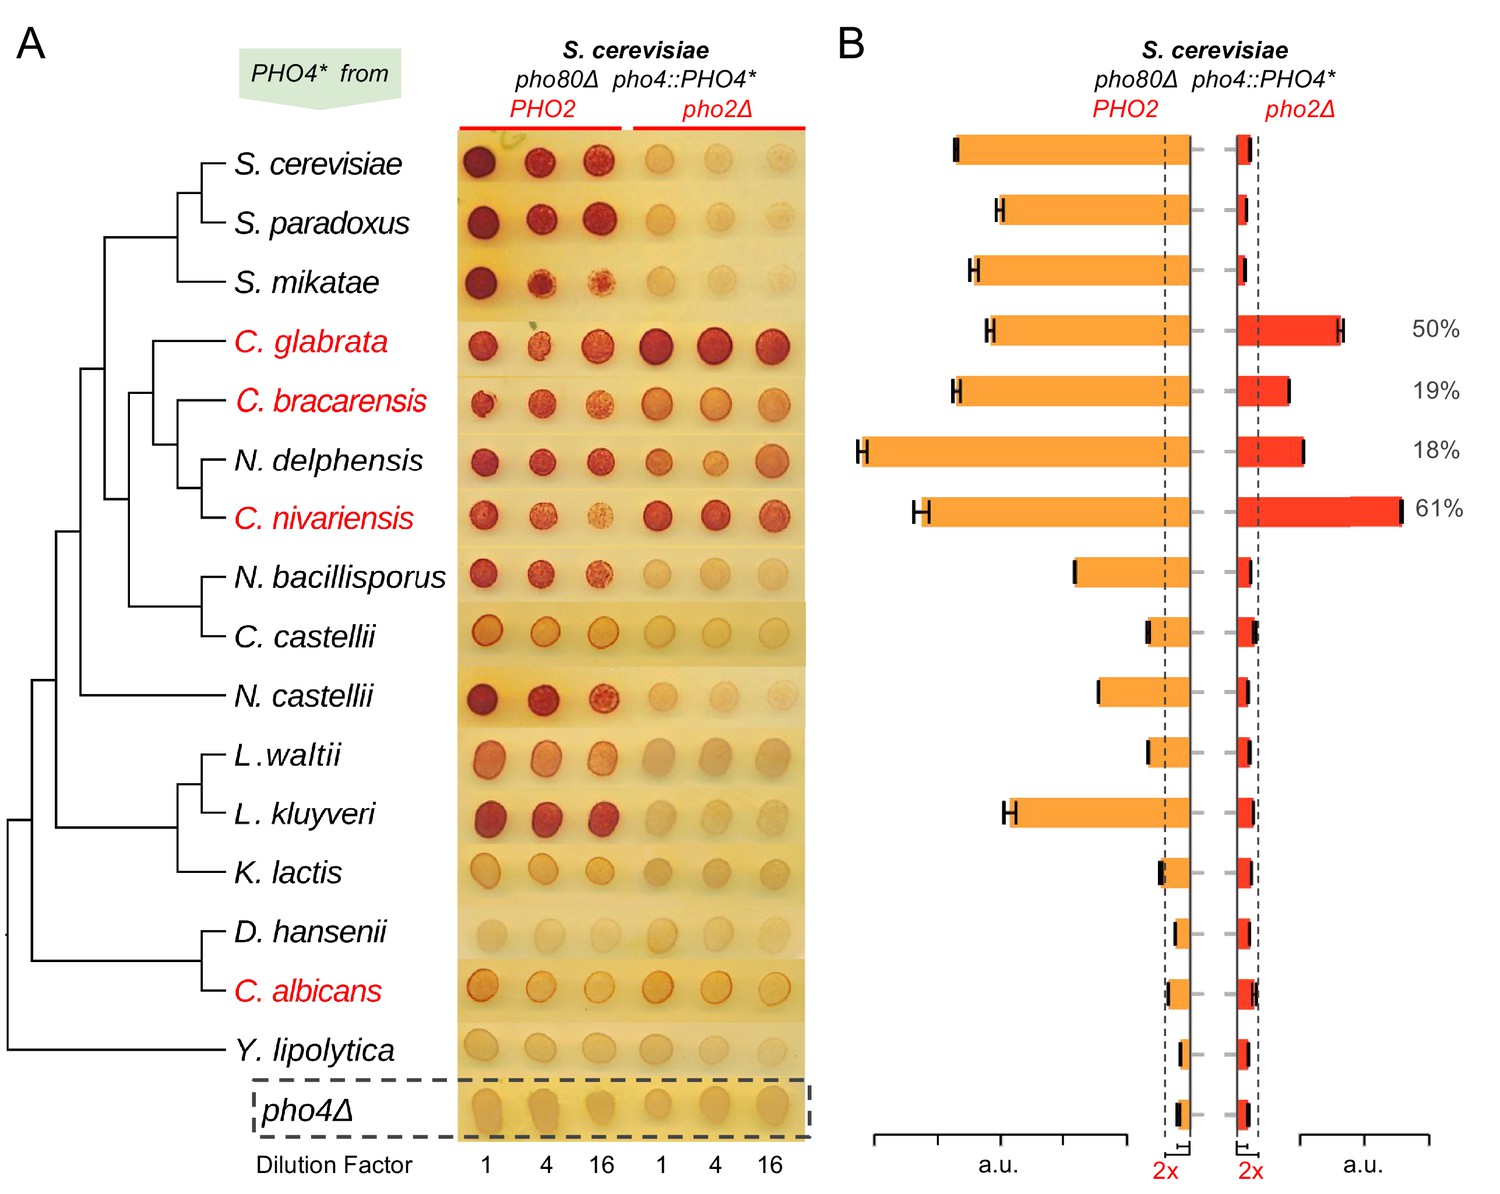
Evolution of Pho4 dependence on Pho2 in the Hemiascomycetes.
(A) Survey of Pho4 orthologs activity in the S. cerevisiae background by the semi-quantitative acid phosphatase assay with or without ScPho2. The species phylogenetic relationship shown on the left were based on (Wapinski et al., 2007). Species names marked in red indicate known commensal and human pathogens. All strains were constructed in an identical S. cerevisiae background lacking the PHO pathway negative regulator Pho80. For each strain, three technical replicates in four-fold serial dilutions were assayed. A strain lacking Pho4 serves as the negative control (pho4Δ, dotted box). (B) Quantitative phosphatase assay for the same strains in (A). The bar graph shows the mean and standard deviation of the secreted phosphatase activity (N = 2, technical replicates). For Pho4 orthologs with noticeable activities (exceeding twice the value of the pho4Δ control with and without ScPho2, dotted lines), a percentage value was calculated by dividing the activity without ScPho2 by that with ScPho2, after subtracting the negative control (pho4∆) in both cases. All results are representative of multiple (>2) experiments.
Figure 3 with 2 supplements
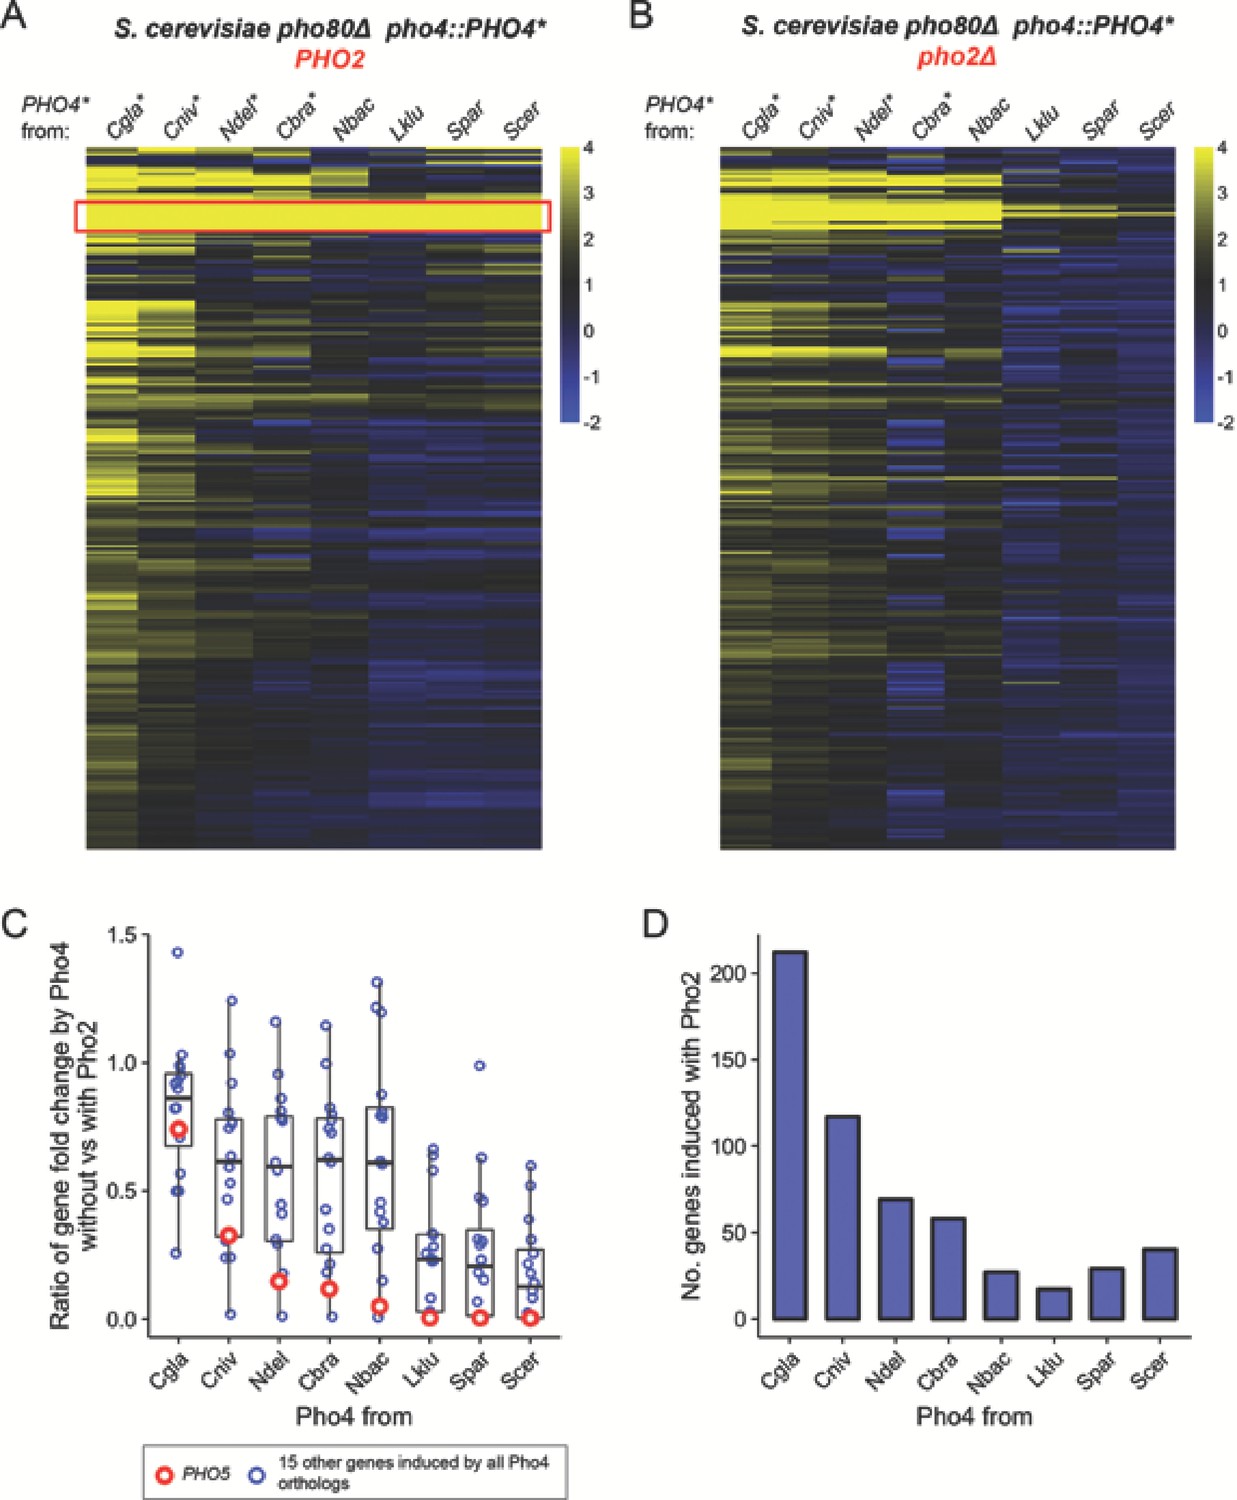
Pho4 orthologs that are less dependent on Pho2 induce more genes in the S. cerevisiae background.
(A) Heatmap showing log2 fold change of genes (rows) induced by Pho4 orthologs (columns) in the S. cerevisiae background lacking PHO80, with ScPho2. A cutoff of 4 and −2 are used for visual presentation. The raw fold change estimates for the 247 genes by eight Pho4 orthologs were available in Figure 3—source data 1. Species names for each of the Pho4 orthologs were abbreviated and correspond to the full names in Figure 2. An asterisk indicates the Pho4 ortholog was shown to induce Pho5 expression in the absence of ScPho2 in S. cerevisiae. A total of 247 genes are plotted. The red box highlights a group of 16 genes that were induced by all eight Pho4 orthologs tested. (B) Same as (A) except the strains were in a pho80∆ pho2Δ background for all Pho4 orthologs. (C) Scatter plot comparing the levels of Pho2-dependence for each Pho4 ortholog, measured by the ratios for the 16 shared target genes between their fold changes in the absence versus in the presence of ScPho2. The boxplots represent the interquartile range (IQC, box), the mean (thick bar in the middle) and the highest or lowest values within 1.5 times of IQC (whisker). The red circles highlight one of the 16 genes, PHO5. (D) Bar plot showing the number of genes significantly induced more than twofold by each Pho4 ortholog in the presence of ScPho2.
-
Figure 3—source data 1
This zip file contains four tab-delimited csv files.
Two of them (fold_with_Pho2.csv and fold_no_pho2.csv) record the gene fold change estimates for each Pho4 ortholog with or without ScPho2. The other two (sig_with_Pho2.csv and sig_no_pho2.csv) record for each Pho4 ortholog whether a gene is deemed significantly induced with or without Pho2.
- https://cdn.elifesciences.org/articles/25157/elife-25157-fig3-data1-v3.zip
Figure 3—figure supplement 1
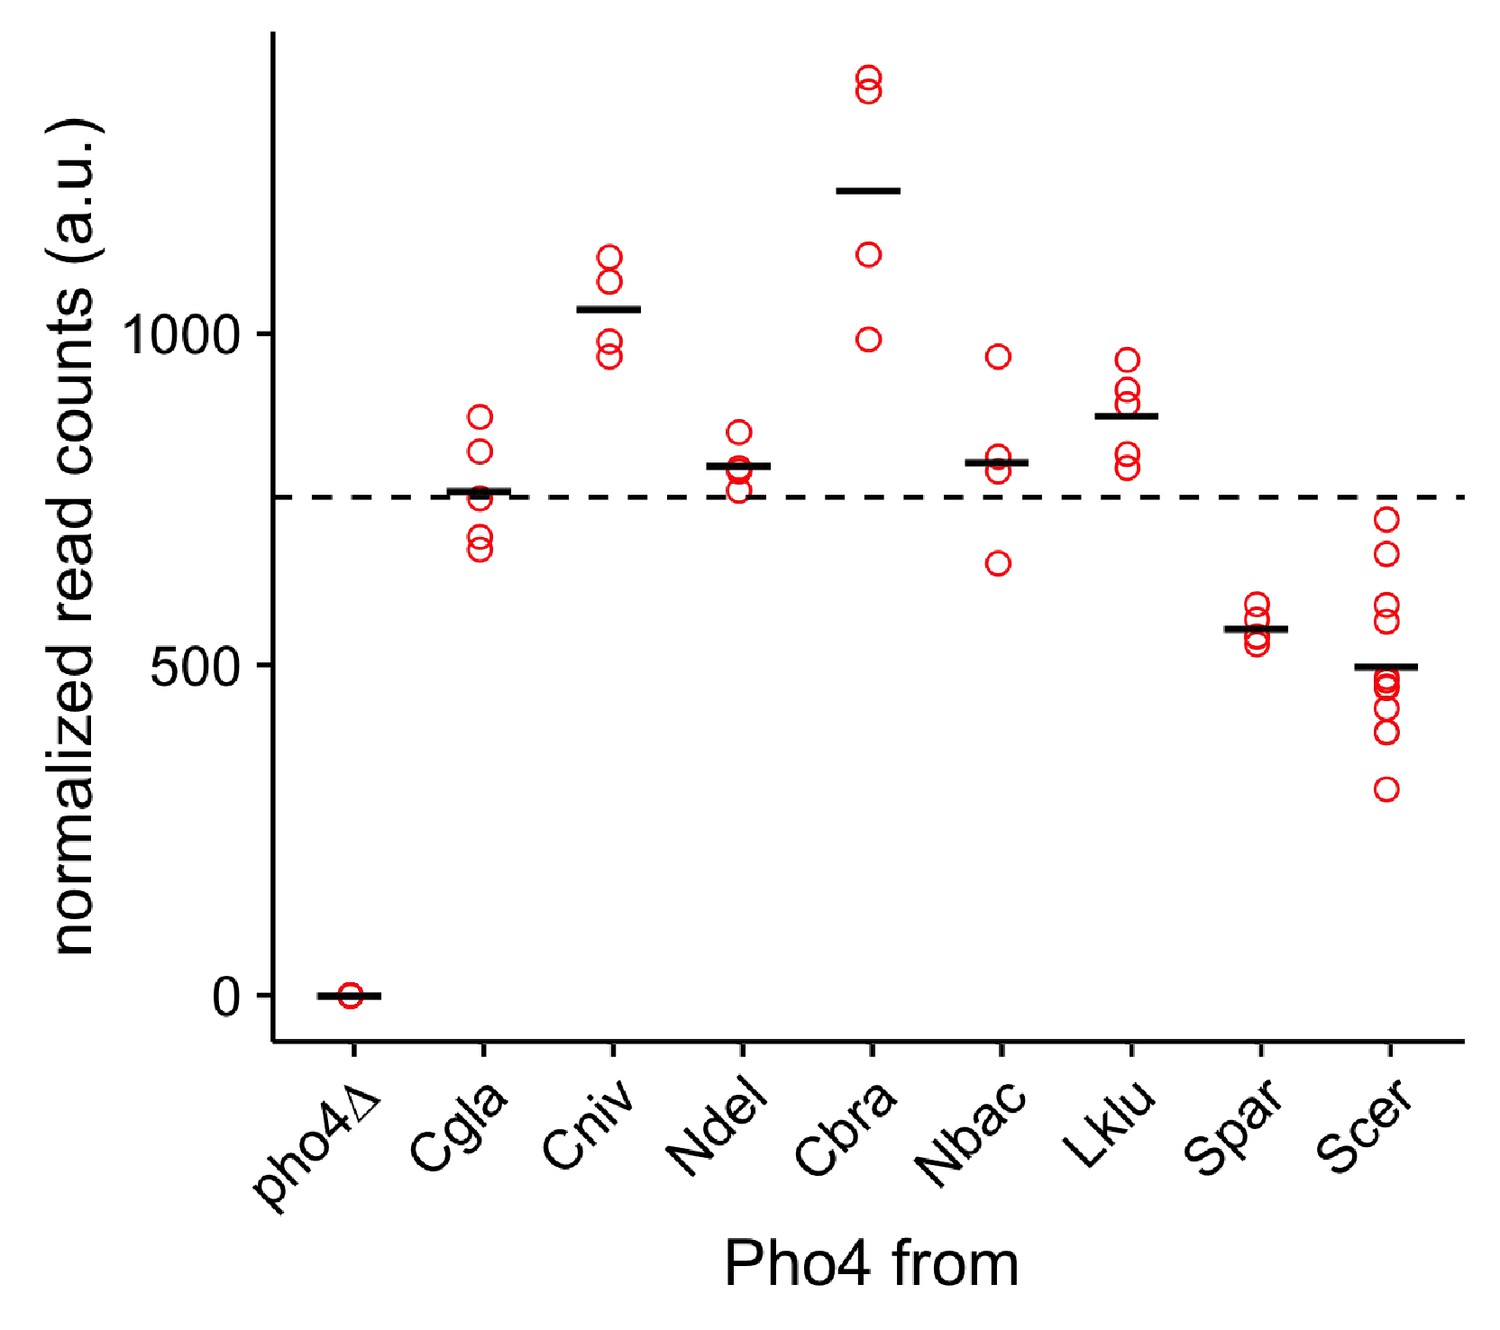
Expression levels of the Pho4 orthologs by RNA-seq.
The scatter plot shows normalized transcript abundance for the PHO4 orthologs. The black bar indicates the mean for each PHO4 ortholog. The dotted line shows the average expression level over all Pho4 orthologs (except pho4∆).
Figure 3—figure supplement 2
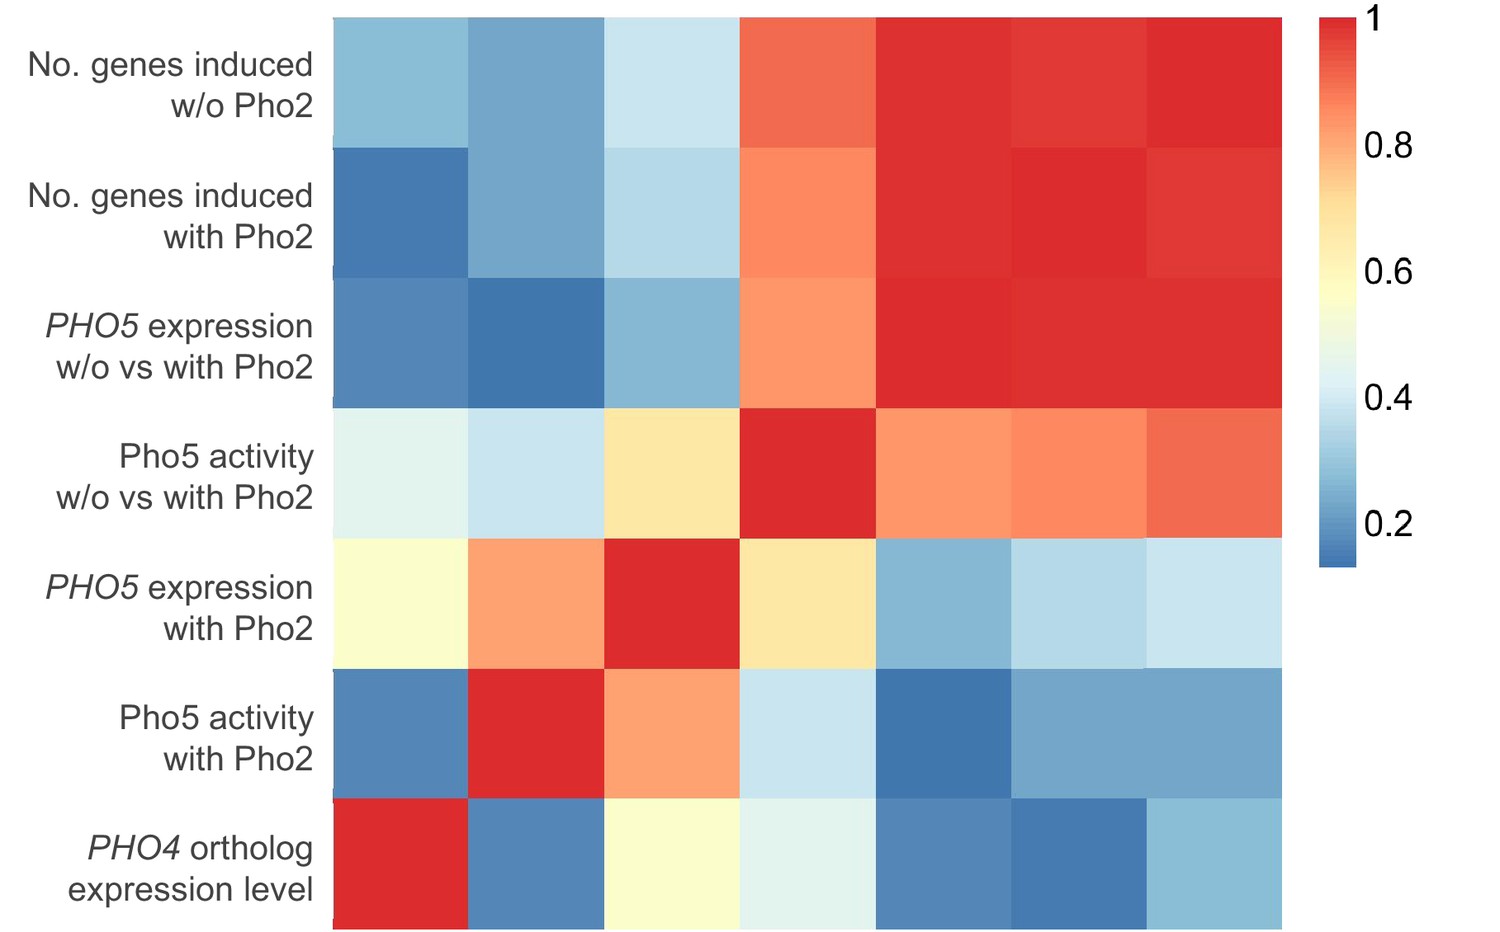
Expression level of a Pho4 ortholog does not correlate with its level of Pho2-dependence or the number of genes it induces.
The heatmap shows the Pearson correlation between a Pho4 ortholog’s expression level and the corresponding strain’s gene induction statistics, including (a) phosphatase assay activity; (b) PHO5 expression level with Pho2; (c) ratio of phosphatase assay activity without vs with Pho2; (d) ratio of PHO5 expression level without vs with Pho2; (e) number of genes induced by each Pho4 ortholog with Pho2 and (f) number of genes induced by each Pho4 ortholog without Pho2.
Figure 4 with 1 supplement
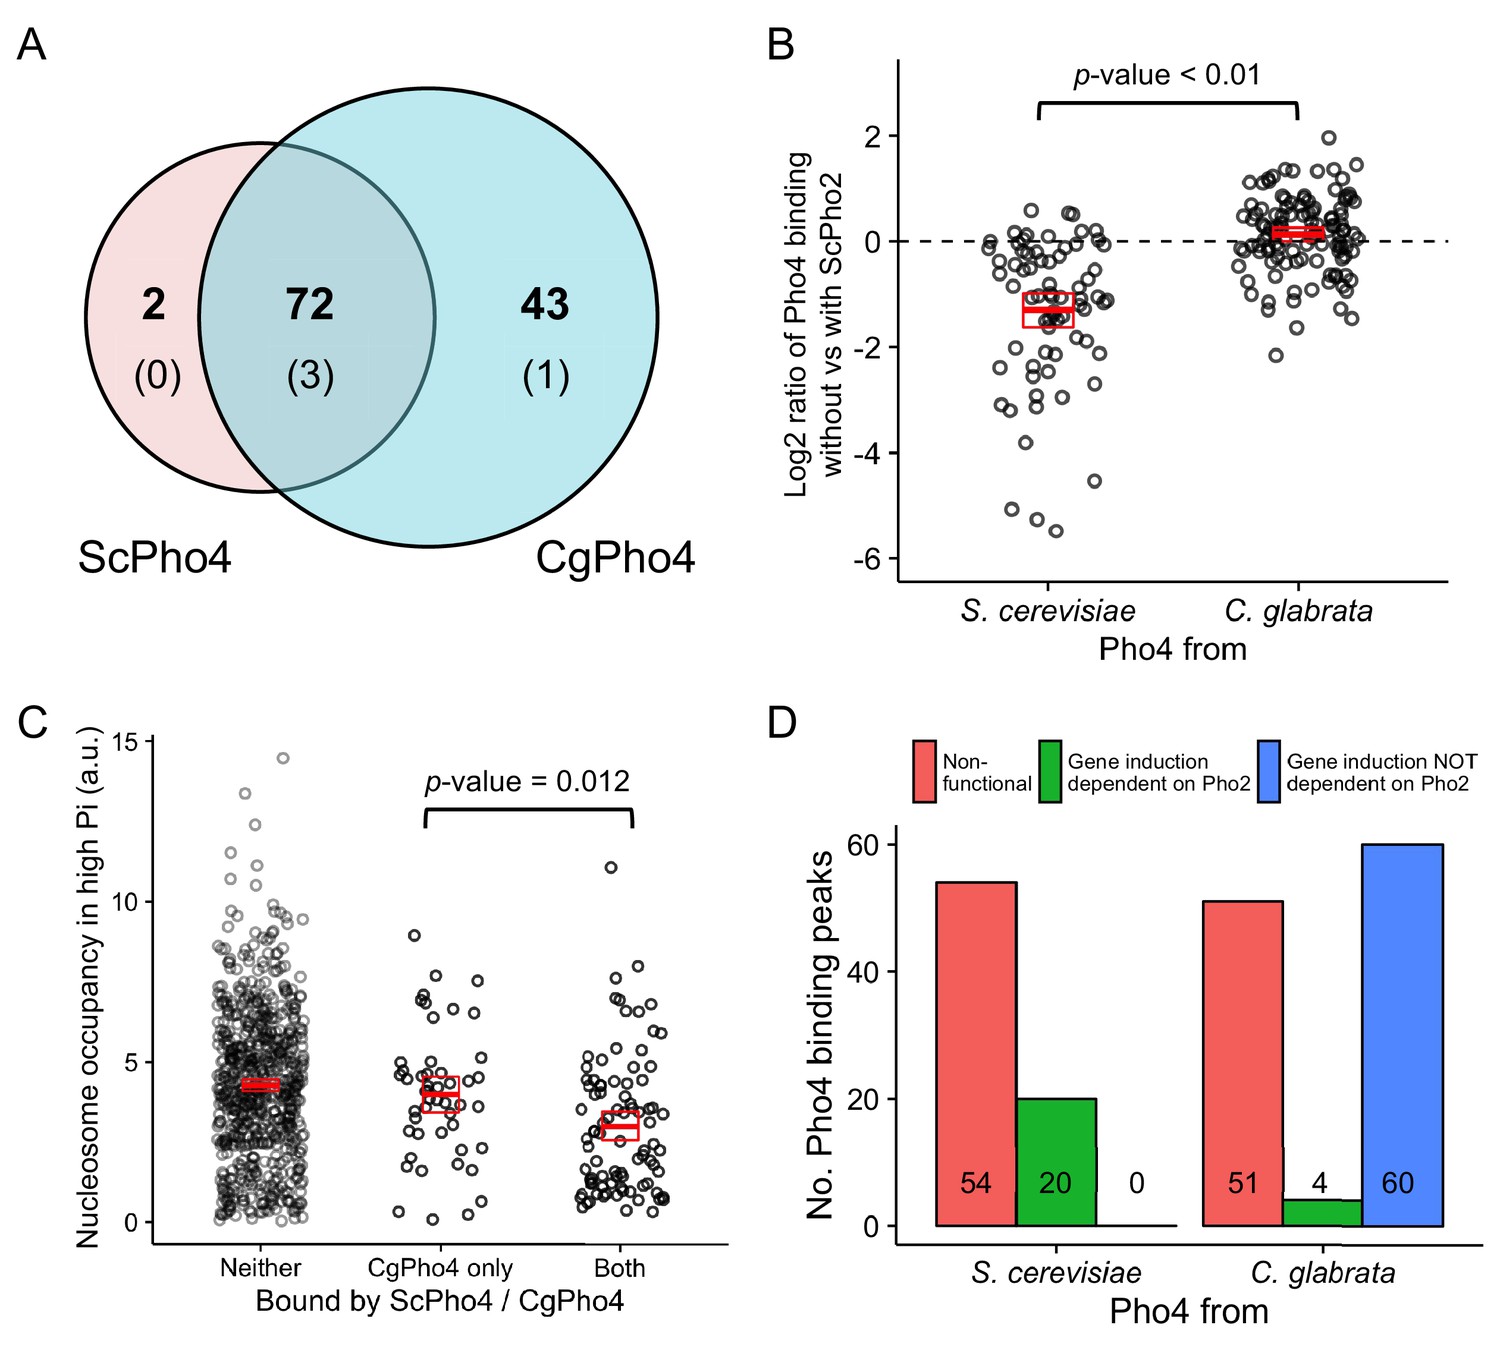
CgPho4 binds to more genomic locations than ScPho4 and is more likely to lead to gene activation upon binding in S. cerevisiae.
(A) Venn diagram showing the number of and overlap between binding locations for ScPho4 and CgPho4 in the S. cerevisiae genome. The numbers in parentheses indicate binding events among the total number where the DNA sequence underlying the peak contains a suboptimal motif with one base pair mismatch to the consensus. (B) Scatter plot showing log2 ratio of ScPho4 or CgPho4 ChIP occupancy without vs with ScPho2. Only sites bound by Sc or CgPho4 in the presence of ScPho2 (N = 74 and 115, respectively) are plotted. The thick red bar represents the mean and the box the 95% confidence limits computed by a non-parametric bootstrapping method (Harrell, 2016). The means of the two groups are significantly different by a two-sided Student’s t-test, with a p-value < 0.01. (C) Scatterplot for nucleosome occupancy in high Pi conditions at ‘CACGTG’ motifs either bound by neither ScPho4 nor CgPho4 (N = 660), only by CgPho4 (N = 48) or by both (N = 88). The red bar and box have the same meaning as in (B), and the difference between sites bound only by CgPho4 and those bound by both CgPho4 and ScPho4 is significant by a two-sided Student’s t test (p-value = 0.012). (D) Bar plot comparing the number of genome-wide binding peaks for ScPho4 and CgPho4 that are either non-functional, lead to gene induction only with ScPho2 or lead to gene induction with or without ScPho2. The source data listing all identified ChIP peaks and the associated gene induction statistics are provided in Figure 4—source data 1.
-
Figure 4—source data 1
List of ChIP-identified binding sites of ScPho4 and CgPho4 in S. cerevisiae, and associated gene information.
Yellow highlight of chromosome names and coordinates mark the same ChIP peak associated with two downstream genes. Two genes (YOR183W and YNL042W-B) do not have induction fold change estimates because of low or no coverage in the RNA-seq data, and marked ‘NA’. YDL106C (PHO2) is deleted in a subset of the strains and therefore excluded from the differential gene expression analysis. Five genes (in red) are exceptions in that the associated CgPho4 ChIP peaks (none of them are bound by ScPho4) were in their coding sequences. For two of the five genes, i.e. RIM15 and YDR089W, CgPho4 binding is associated with CgPho4-dependent gene induction.
- https://cdn.elifesciences.org/articles/25157/elife-25157-fig4-data1-v3.xlsx
Figure 4—figure supplement 1
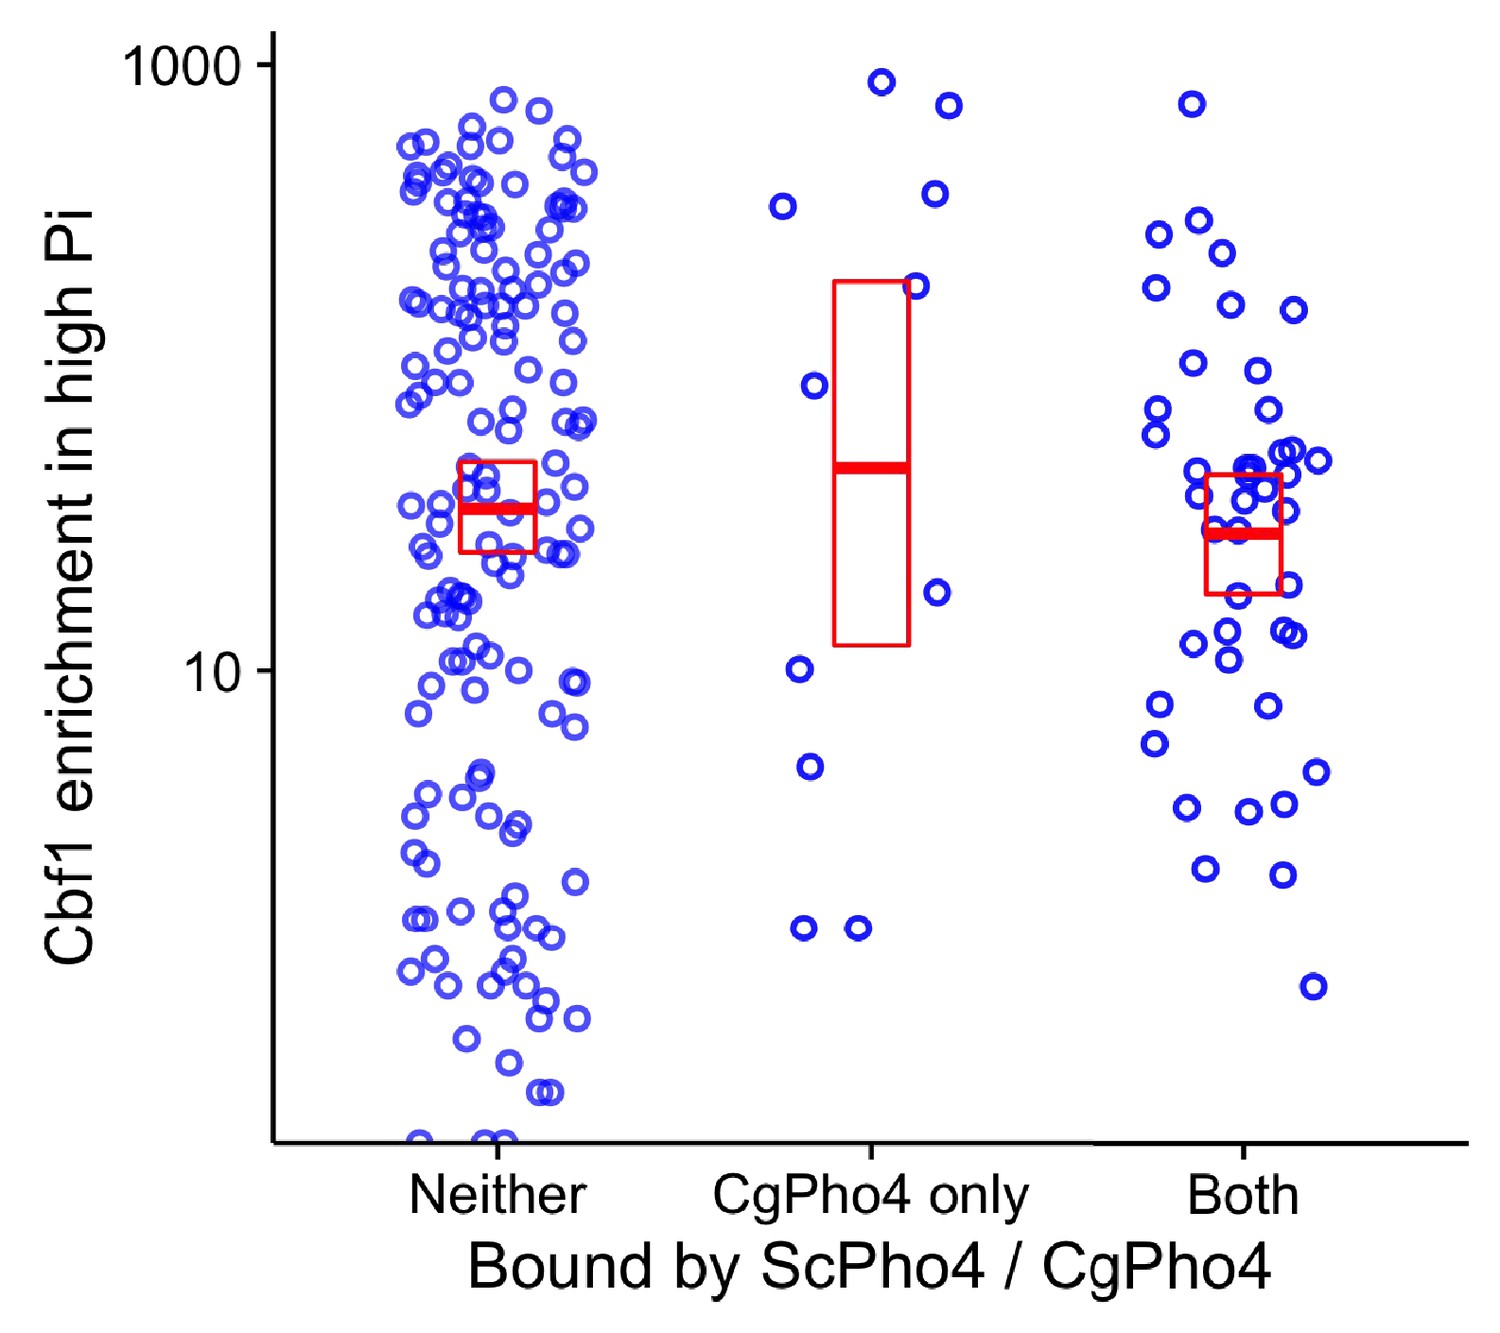
Cbf1 enrichment in high Pi conditions in S. cerevisiae is not significantly different between sites bound by both CgPho4 and ScPho4 and sites bound by CgPho4 only.
Scatter plot shows the log10 transformed Cbf1 enrichment in high Pi conditions (Zhou et al., 2011) at a subset of the E-box motifs*, grouped by whether the motif is bound by neither ScPho4 and CgPho4, only CgPho4 or both. A two-sided t-test comparing the means of the latter two groups yielded a p-value of 0.53. * To avoid the confounding nucleosome exclusion, the E-box motifs in the S. cerevisiae genome were ordered by their nucleosome occupancy in high Pi conditions (Zhou et al., 2011) from low to high, and the top 25% most accessible ones were used for this plot.
Figure 5 with 1 supplement
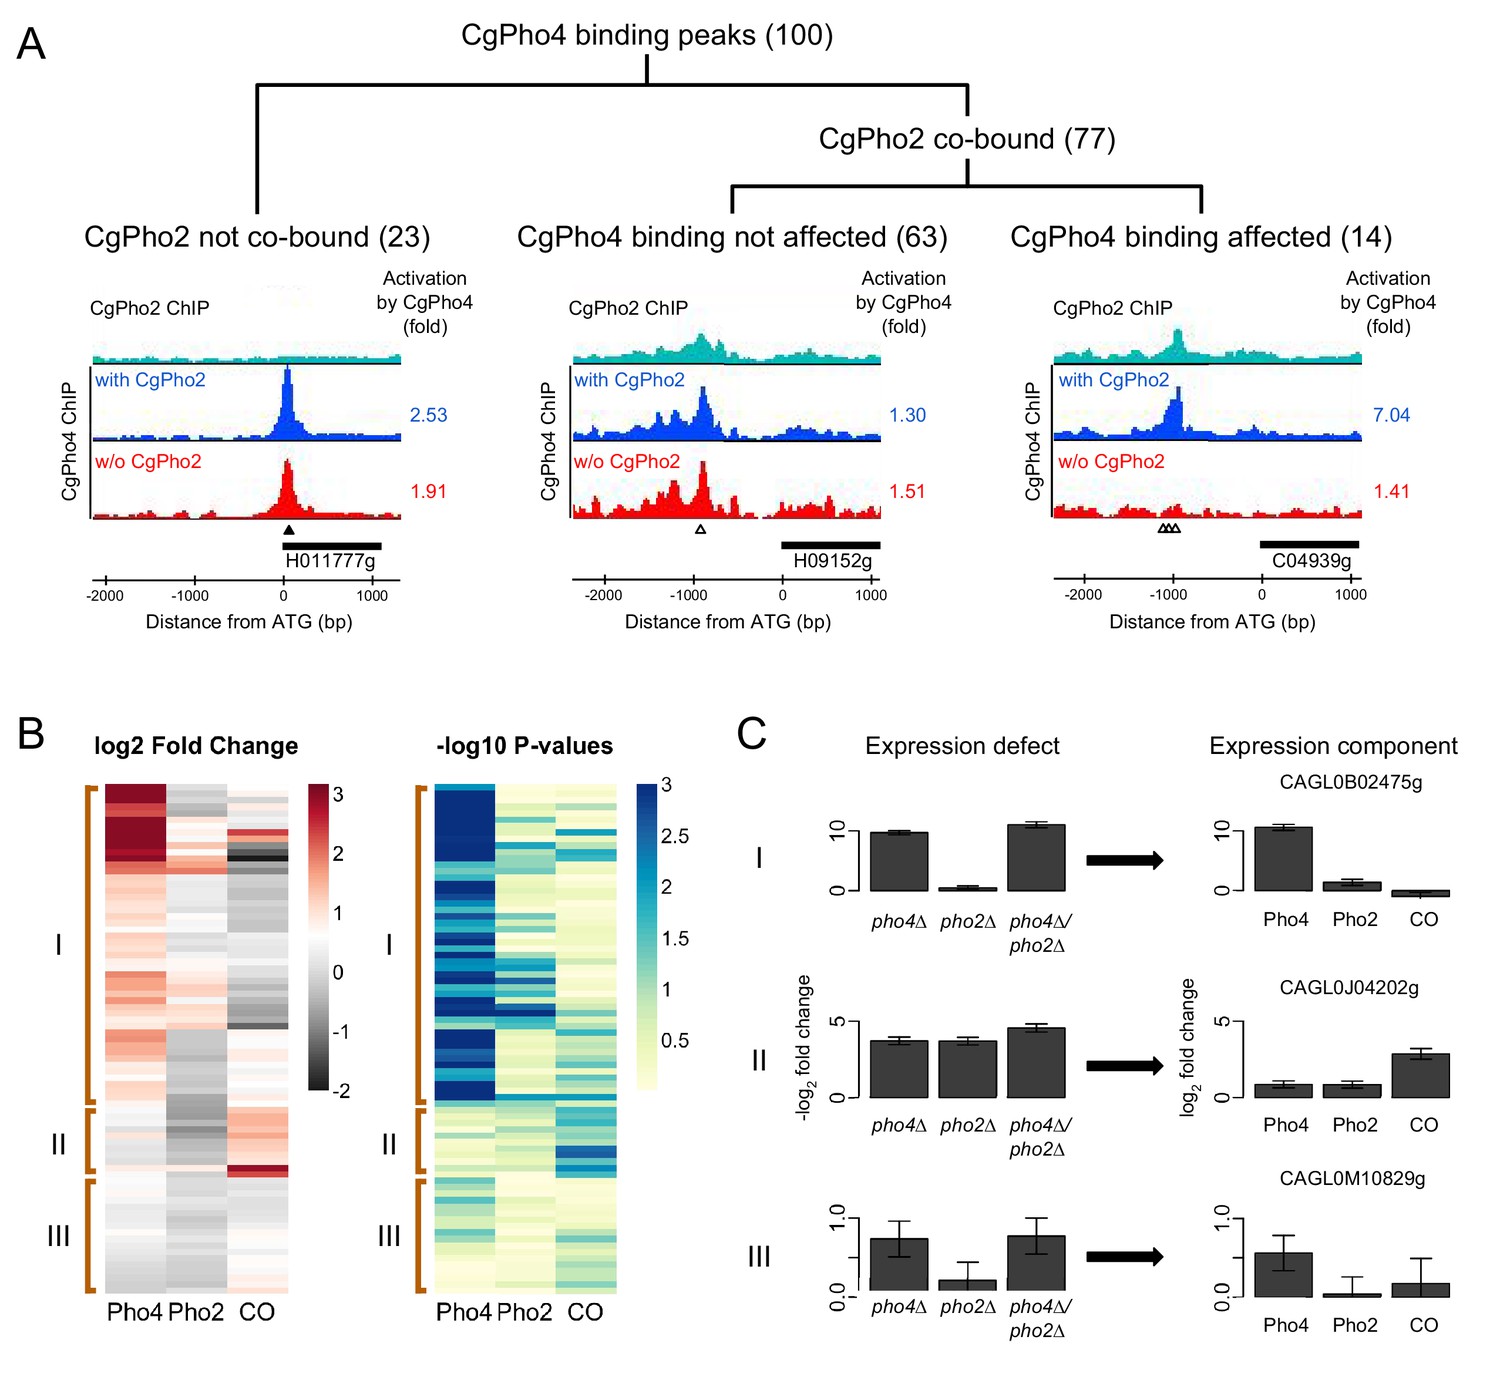
Identifying Pho4 targets in C. glabrata using genome-wide binding and transcriptome profiling data.
(A) Dendrogram showing the breakdown of the 100 CgPho4 ChIP peaks based on whether CgPho2 binds next to CgPho4, and when it does, whether CgPho4 binding is affected by the deletion of Pho2 or not (defined as CgPho4 ChIP peak height reduced by more than twofold in the pho2∆ background). The graphs below the dendrogram show examples of ChIP profiles for each category of CgPho4 binding. Profiles of ChIP fold enrichment over mock are shown for CgPho2 in cyan, CgPho4 with CgPho2 in blue and CgPho4 without CgPho2 in red. The filled triangles indicate the location of a consensus "CACGTG" motif while the open triangles the one-bp-mismatches. The downstream gene is depicted as a thick bar to the right and the shortened systematic name (remove the preceding ‘CAGL0’) is shown below. The fold changes in induction for the putative target gene with or without CgPho2 are shown to the right of each graph. A list of the 100 binding peaks and the associated statistics are available in Figure 5—source data 1. (B) The left heat map showing the estimates of expression components for 79 genes directly bound and induced by CgPho4. For each gene, the log2 transformed fold change is decomposed into Pho4 effect alone (Pho4) + Pho2 effect alone (Pho2) + Pho4/Pho2 collaborative effect (CO). A cutoff of 3 and -2 is used for visual presentation. The unadjusted estimates and the associated p-values are available in Figure 5—source data 2. The right heatmap shows the -log10 transformed p-values for the corresponding t-statistics of the estimates on the left. Three groups are defined based on their characteristic expression components: group I genes are dominated by CgPho4 main effect; group II genes depend on both CgPho4 and CgPho2 (CO component); group III genes are a mix of the first two groups, with lower fold changes (weakly induced). (C) Bar graphs on the left showing the linear model estimates and the standard deviation of the expression defects, defined as the -log2 transformed fold changes between the mutants (single or double) and the wild-type. On the right are the corresponding estimates and standard deviation of the expression components for the same gene, estimated from the same data with two biological replicates per strain (Materials and methods). One representative gene is plotted for each category in (B).
-
Figure 5—source data 1
List of ChIP-identified binding sites of CgPho4 in C.glabrata.
- https://cdn.elifesciences.org/articles/25157/elife-25157-fig5-data1-v3.xlsx
-
Figure 5—source data 2
List of CgPho4 directly bound and induced genes and the associated expression components from the mutant cycle analysis.
- https://cdn.elifesciences.org/articles/25157/elife-25157-fig5-data2-v3.xlsx
Figure 5—figure supplement 1
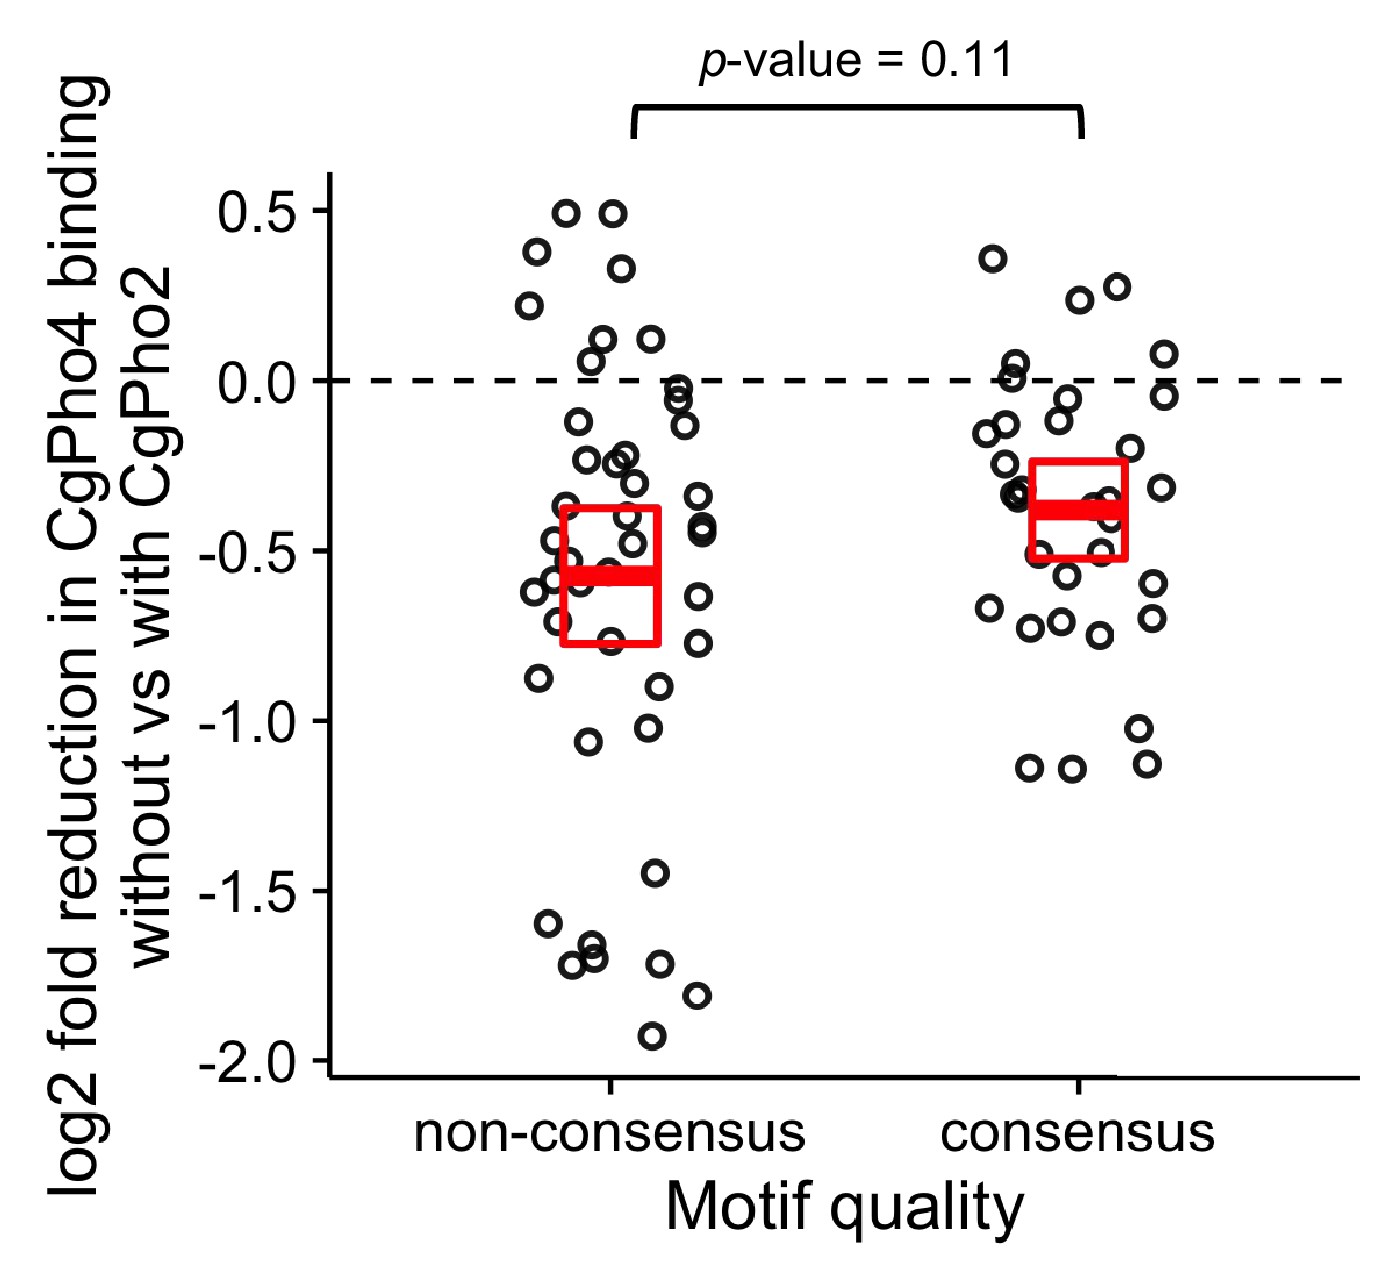
Comparison of CgPho2 influence on CgPho4 binding at sites with and without the consensus motif.
Scatter plot showing log2 ratio of CgPho4 ChIP enrichment without vs with CgPho2. The thick red bar depicts the mean and the box the 95% confidence limits computed by non-parametric bootstrapping. The difference in the means of the two groups is not significant at a 0.05 level by a Student’s t test, with a p-value=0.11.
Figure 6
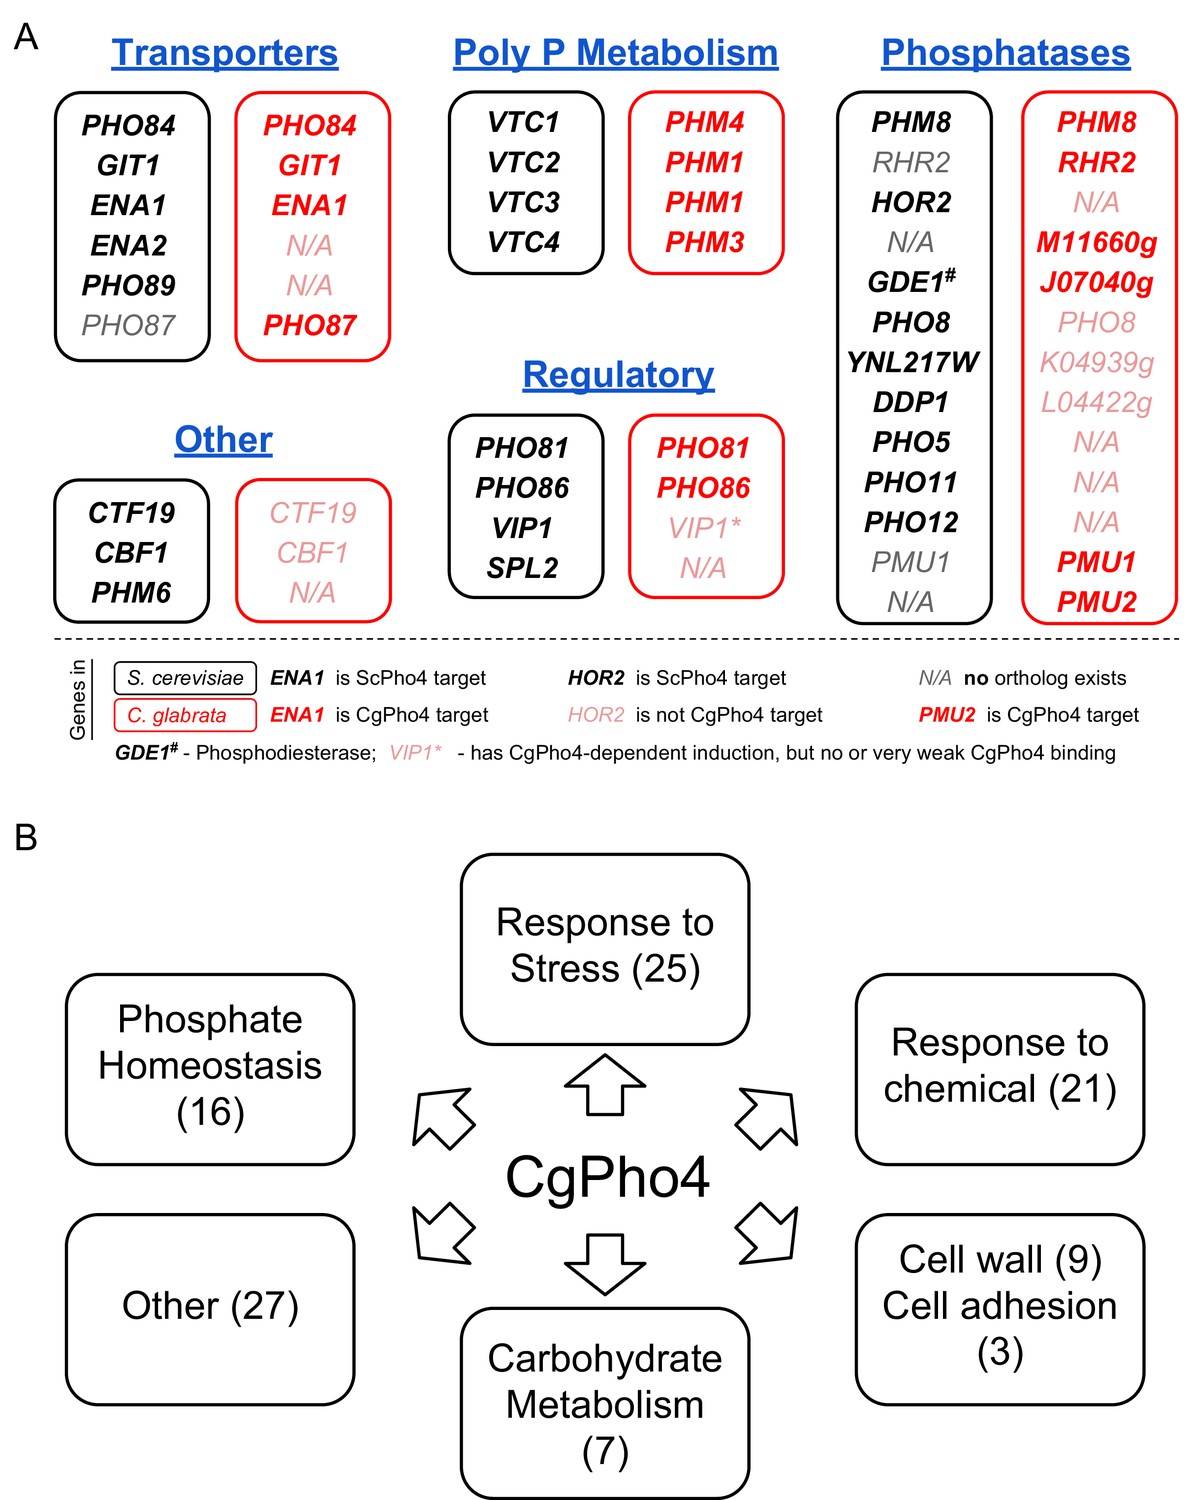
Functional annotation of Pho4 targets in C. glabrata.
(A) Comparison between all 24 ScPho4 targets in S. cerevisiae and CgPho4 targets with phosphate homeostasis related functions in C. glabrata. Abbreviations: ‘Poly P’ stands for ‘Polyphosphate’. Within each subcategory, S. cerevisiae genes in black are paired with their homologs in C. glabrata in red. N/A in either species indicates ortholog does not exist in that species. C. glabrata genes not annotated with a common name are represented by their systematic name with the preceding ‘CAGL0’ omitted. Gene names in bold indicate that they are targets of ScPho4 or CgPho4, while gray or pink gene names indicate they are not targets of ScPho4 or CgPho4, respectively. (B) Non-exclusive groups of Pho4 targets in C. glabrata based on Gene Ontology ‘Biological process’ terms and functional annotations in Candida Genome Database (for C. glabrata or orthologs in C. albicans) and Saccharomyces Genome Database (for orthologs in S. cerevisiae).
-
Figure 6—source data 1
Gene Ontology terms enrichment analysis results.
- https://cdn.elifesciences.org/articles/25157/elife-25157-fig6-data1-v3.xlsx
-
Figure 6—source data 2
Table comparing ScPho4 and CgPho4 targets with phosphate homeostasis related functions.
- https://cdn.elifesciences.org/articles/25157/elife-25157-fig6-data2-v3.xlsx
-
Figure 6—source data 3
All 79 CgPho4 targets in C. glabrata mapped to Gene Ontology Slim terms.
- https://cdn.elifesciences.org/articles/25157/elife-25157-fig6-data3-v3.xlsx
-
Figure 6—source data 4
Contains five tables listing CgPho4 target genes annotation grouped by functional categories: Table S1 – Non-phosphate related stress and starvation response; Table S2 – Response to chemicals; Table S3 – Cell wall and cell adhesion; Table S4 – Carbohydrate metabolism; Table S5 – all other functional groups.
- https://cdn.elifesciences.org/articles/25157/elife-25157-fig6-data4-v3.xlsx
Author response image 1
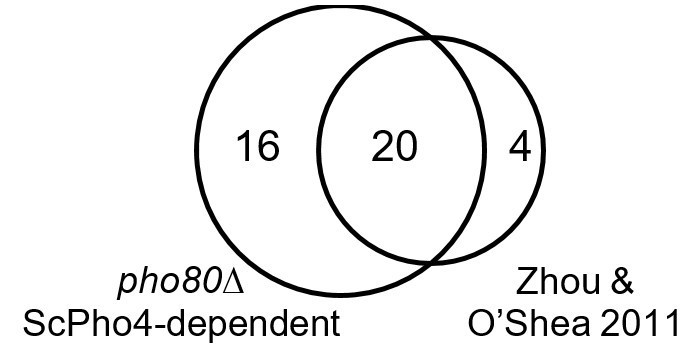
Venn diagram showing overlap of genes induced by ScPho4 in the pho80∆ vs. in phosphate starvation conditions (data from Zhou and O’Shea 2011).
Tables
Table 1
Strains used in this study.
| Strain | Genotype | Reference |
|---|---|---|
| S. cerevisiae | ||
| EY0057 | K699, as wild-type for PHO pathway | (O'Neill et al., 1996) |
| EY0252 | pho2::LEU2 | (Kaffman et al., 1994) |
| EY1710 | pho4::URA3 | (Zhou et al., 2011) |
| EY2849 | pho80::TRP1 | This study |
| EY2851 | pho80::TRP1 pho2::HIS5 | This study |
| EY2852 | pho80::TRP1 pho4::URA3 | This study |
| EY2859 | pho80::TRP1 pho4::URA3 pho2::HIS5 | This study |
| EY2863 | pho80::TRP1 pho4::CglaPHO4 | This study |
| EY2872 | pho80::TRP1 pho4::SparPHO4 | This study |
| EY2873 | pho80::TRP1 pho4::SmikPHO4 | This study |
| EY2874 | pho80::TRP1 pho4::LkluPHO4 | This study |
| EY2875 | pho80::TRP1 pho4::NcasPHO4 | This study |
| EY2876 | pho80::TRP1 pho4::KlacPHO4 | This study |
| EY2877 | pho80::TRP1 pho4::LwalPHO4 | This study |
| EY2878 | pho80::TRP1 pho4::DhanPHO4 | This study |
| HY107 | pho80::TRP1 pho4::CnivPHO4 | This study |
| HY108 | pho80::TRP1 pho4::CbraPHO4 | This study |
| HY110 | pho80::TRP1 pho4::NbacPHO4 | This study |
| HY111 | pho80::TRP1 pho4::NdelPHO4 | This study |
| HY120 | pho80::TRP1 pho4::CcasPHO4 | This study |
| HY132 | pho80::TRP1 pho4::CalbPHO4 | This study |
| HY136 | pho80::TRP1 pho4::YlipPHO4 | This study |
| EY2879 | pho80::TRP1 pho4::CglaPHO4 pho2::URA3 | This study |
| EY2880 | pho80::TRP1 pho4::SparPHO4 pho2::URA3 | This study |
| EY2881 | pho80::TRP1 pho4::SmikPHO4 pho2::URA3 | This study |
| EY2882 | pho80::TRP1 pho4::LkluPHO4 pho2::URA3 | This study |
| EY2883 | pho80::TRP1 pho4::NcasPHO4 pho2::URA3 | This study |
| EY2884 | pho80::TRP1 pho4::KlacPHO4 pho2::URA3 | This study |
| EY2885 | pho80::TRP1 pho4::LwalPHO4 pho2::URA3 | This study |
| EY2886 | pho80::TRP1 pho4::DhanPHO4 pho2::URA3 | This study |
| HY112 | pho80::TRP1 pho4::CnivPHO4 pho2::HIS5 | This study |
| HY114 | pho80::TRP1 pho4::CbraPHO4 pho2::HIS5 | This study |
| HY115 | pho80::TRP1 pho4::NbacPHO4 pho2::HIS5 | This study |
| HY116 | pho80::TRP1 pho4::NdelPHO4 pho2::HIS5 | This study |
| HY121 | pho80::TRP1 pho4::CcasPHO4 pho2::HIS5 | This study |
| HY134 | pho80::TRP1 pho4::CalbPHO4 pho2::HIS5 | This study |
| HY138 | pho80::TRP1 pho4::YlipPHO4 pho2::HIS5 | This study |
| EY2681 | pho80::HIS3 pho4::ScerPHO4-C-AVI-TRP1 ura3::pRS306-BirA | (Zhou et al., 2011) |
| EY2869 | pho80::TRP1 pho4::CglaPHO4-C-AVI ura3::pRS306-BirA | This study |
| EY2867 | pho80::TRP1 pho4::CglaPHO4-C-AVI pho2::URA3 ura3::pRS306-BirA | This study |
| HY130 | pho80::TRP1 pho4::CglaPHO4 ura3::pRS306-BirA | This study |
| C. glabrata | ||
| BG99 | his3Δ (1 + 631), as wild-type for PHO pathway | (Cormack and Falkow, 1999) |
| HY1 | BG99, ura3∆ | This study |
| HY3 | pho80::HIS3 | This study |
| HY5 | pho4::URA3 | This study |
| HY6 | pho80::HIS3 pho4::URA3 | This study |
| HY8 | pho2::URA3 | This study |
| HY10 | pho80::HIS3 pho2::URA3 | This study |
| HY29 | pho80::HIS3 pho4::natNT2 pho2::URA3 | This study |
| HY68 | pho2::N-3xFLAG-PHO2 | This study |
| HY70 | pho2::N-V5-PHO2 | This study |
| HY75 | pho4::PHO4-C-3xFLAG | This study |
| HY85 | pho4::PHO4-C-3xFLAG pho2::URA3 | This study |
| HY89 | pho80::HIS3 pho2::N-V5-PHO2 | This study |
| C. albicans | ||
| Wild-type | LEU2 / leu2∆ HIS1 / his1∆ | (Homann et al., 2009) |
| orf19.1253 | pho4::LEU2 / pho4::HIS1 | (Homann et al., 2009) |
| orf19.4000 | pho2::LEU2 / pho2::HIS1 | (Homann et al., 2009) |
Download links
A two-part list of links to download the article, or parts of the article, in various formats.
Downloads (link to download the article as PDF)
Open citations (links to open the citations from this article in various online reference manager services)
Cite this article (links to download the citations from this article in formats compatible with various reference manager tools)
Evolution of reduced co-activator dependence led to target expansion of a starvation response pathway
eLife 6:e25157.
https://doi.org/10.7554/eLife.25157


