Rapid short-term reorganization in the language network
- Max Planck Institute for Human Cognitive and Brain Sciences Leipzig, Germany
- University of Leipzig, Germany
- RWTH Aachen, Germany
- JARA-BRAIN, Jülich-Aachen Research Alliance, Germany
- Parietal team, INRIA, Neurospin, bat 145, CEA Saclay, France
Figures
Figure 1

Experimental design and behavioural results.
(A) Subjects received effective or sham cTBS either over supramarginal gyrus (SMG) or angular gyrus (AG) in different sessions. Thereafter, they performed semantic and phonological tasks in two fMRI runs. (B) Tasks were divided into 10 miniblocks per task and run, each consisting of 6 stimuli (e.g. ‘Katze’ (‘cat’)) with varying stimulus onset asynchrony. min=minutes; s=seconds. (C) Effects of cTBS over AG and SMG on reaction times (RTs) and accuracy. *p<0.05; SEM= standard error of the mean.
Figure 2 with 2 supplements
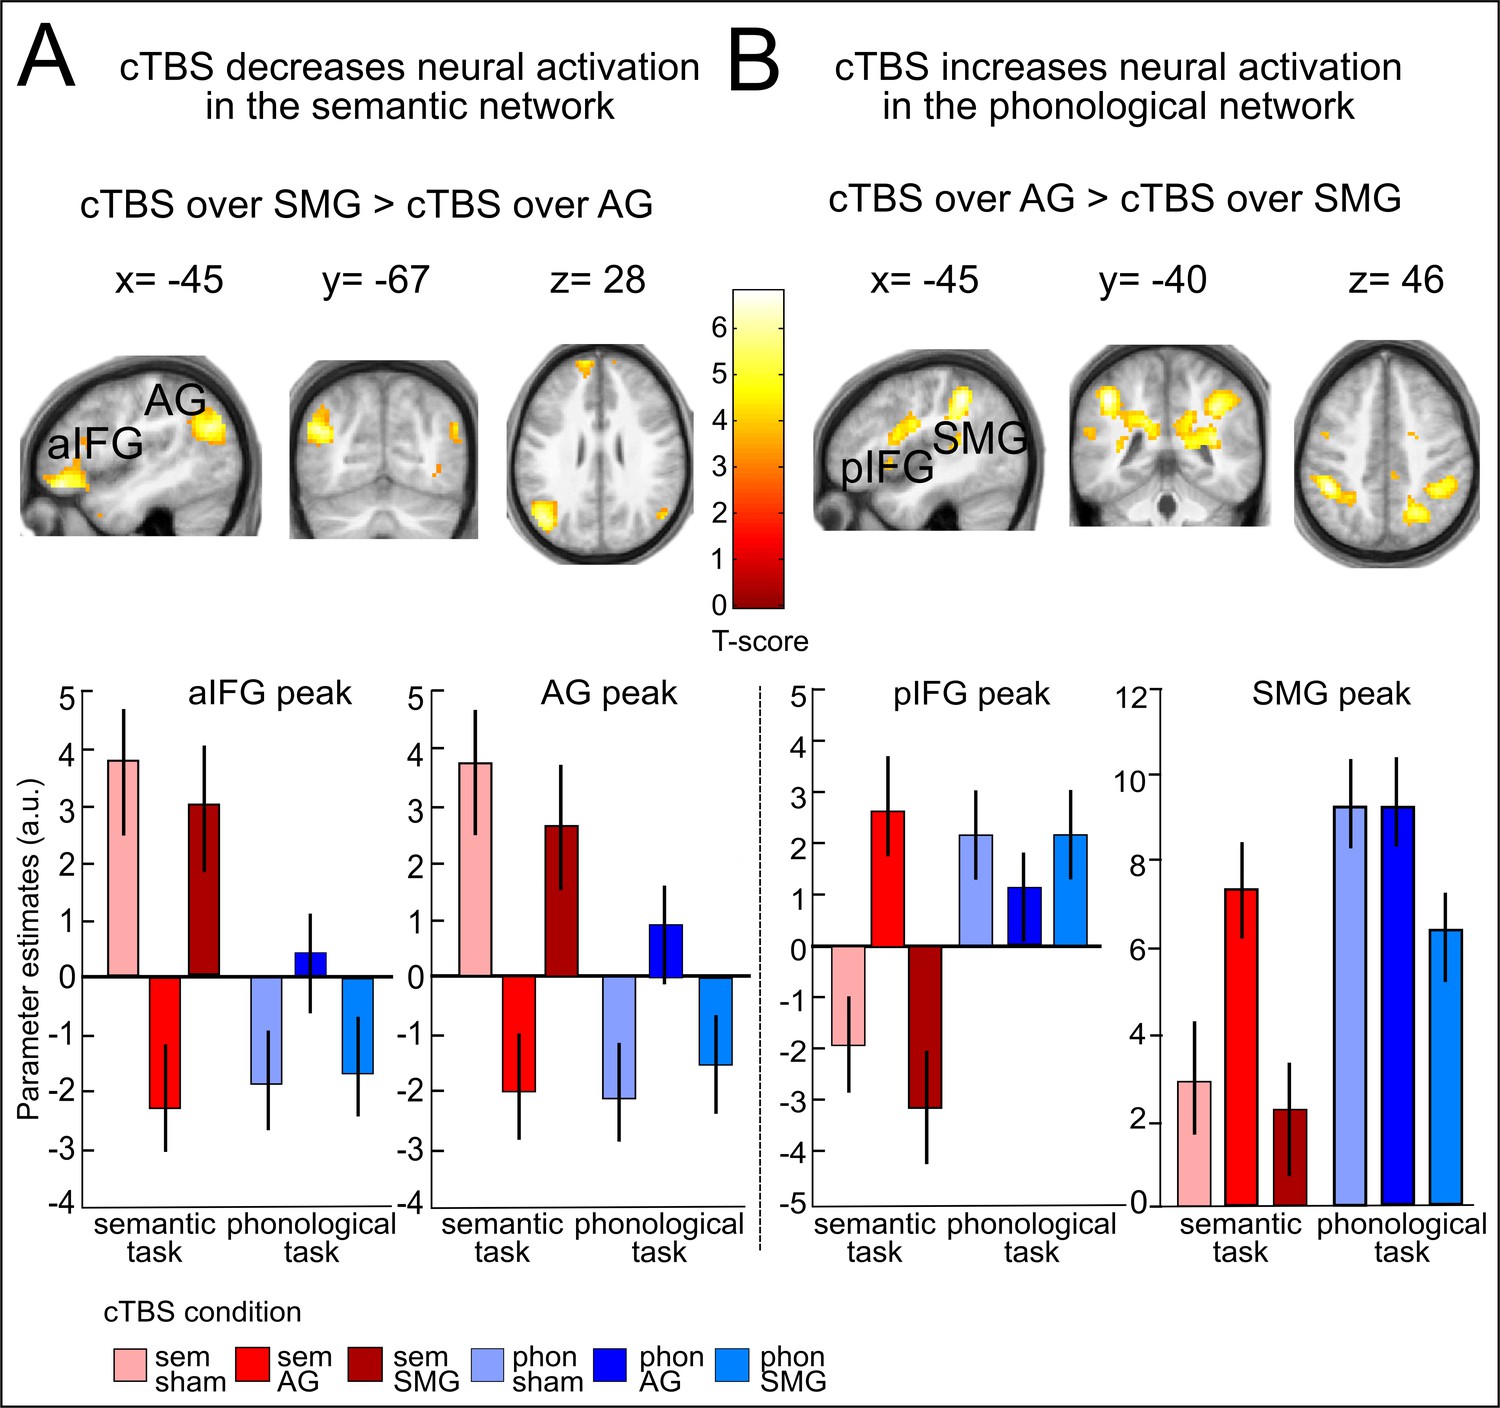
Effects of cTBS on semantic decisions.
(A) Relative to cTBS over SMG, cTBS of AG significantly decreased neural activity not only at the stimulated area, but in a larger network including AG and aIFG. (B) Relative to cTBS of SMG, cTBS of AG significantly increased neural activity in phonological regions, including the bilateral SMG and pIFG. Lower panels display the respective parameter estimates (arbitrary units) for the different cTBS conditions that were extracted at the respective mean peak coordinates from the effect of interest for each task condition against rest. p<0.001 for display reasons. Sem=semantic, phon=phonological task.
Figure 2—figure supplement 1

Effects of cTBS on semantic decisions.
(A) Inhibitory effects of cTBS on task-related neural activity during semantic decisions. Relative to sham cTBS, cTBS of AG significantly decreased neural activity not only at the stimulated area, but in a larger semantic network. (B) Upregulation of the phonological network after AG cTBS during semantic decisions. Relative to cTBS over SMG, cTBS of AG significantly increased neural activity in phonological regions, including the bilateral SMG and pIFG / ventral premotor cortex. Right panels display the respective parameter estimates (arbitrary units) for the different cTBS conditions that were extracted at the respective mean peak coordinates from the effect of interest for each task condition against rest. p<0.001 for display reasons.
Figure 2—figure supplement 2

Task-related activity changes after sham cTBS (baseline).
(A), (B) Main effects of semantic or phonological decisions relative to rest trials. (C), (D) Differential contrasts of semantic > phonological and phonological > semantic decisions. Coordinates are given at respective peak activations. p<0.05, FWE corrected.
Figure 3
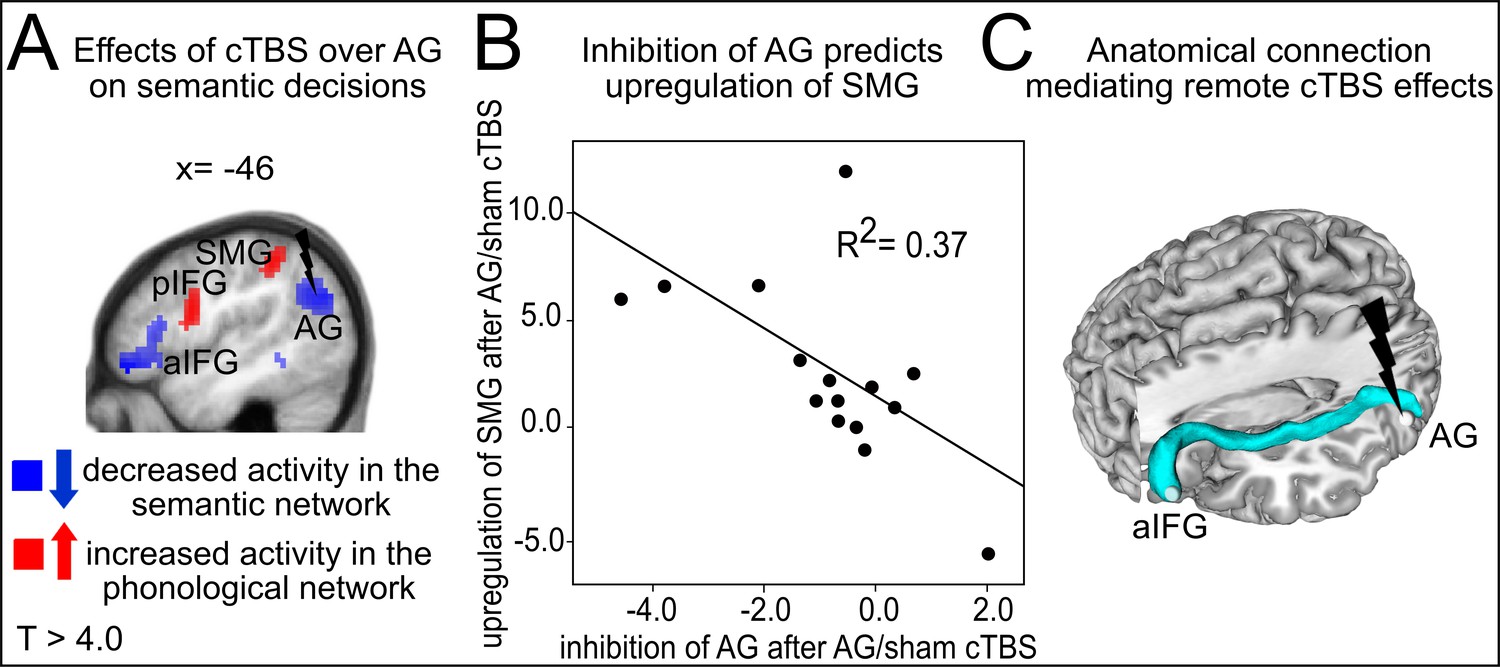
Semantic network effects.
(A) Illustration of the strong cTBS-induced suppression in the semantic network (in blue) and the upregulation of the phonological network (in red). (B) The strength of the individual inhibition of left AG after cTBS (effect sizes for AG/sham cTBS received from the effect of interest at x,y,z= −42,–64, 25) predicted the upregulation of left SMG (effect sizes for AG/sham cTBS extracted from the effect of interest at x,y,z= −45,–40, 46). (C) Three-dimensional tractography rendering illustrating the underlying anatomical fiber connections mediating the remote effects of cTBS. AG and aIFG were most probably connected via the middle longitudinal fasciculus and extreme capsule.
Figure 4 with 1 supplement
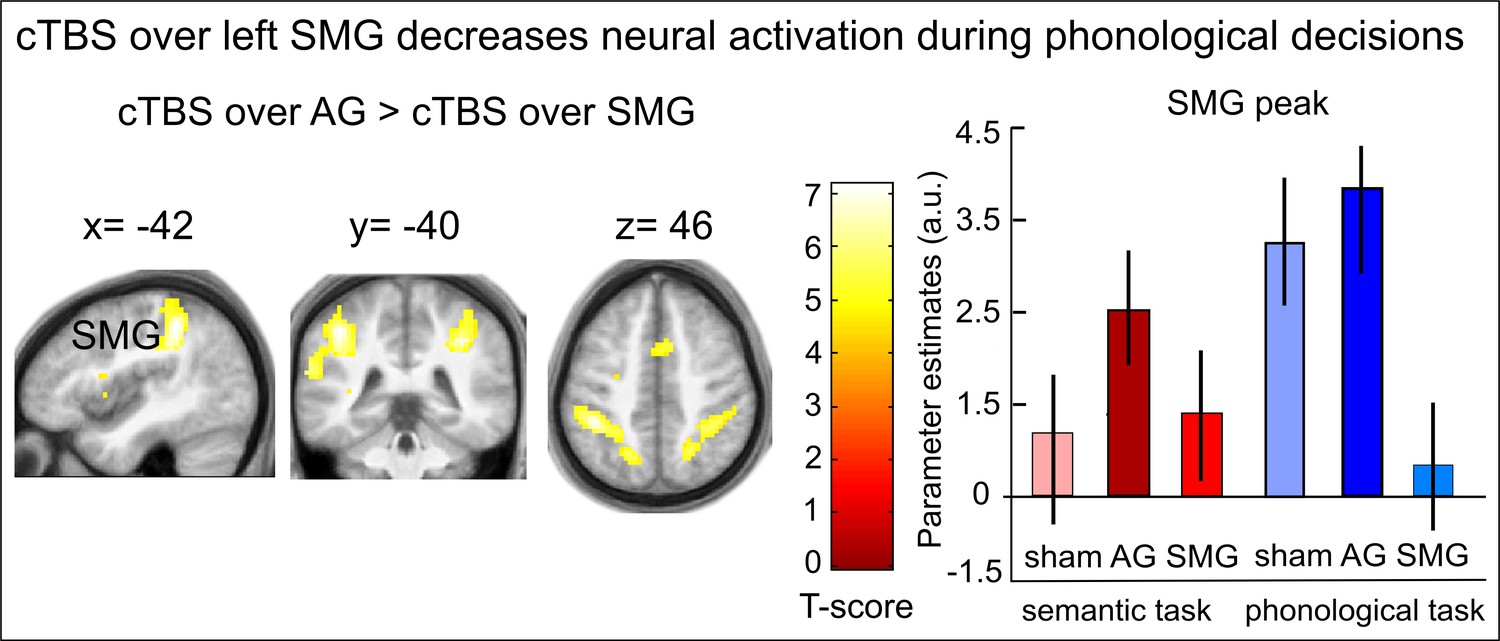
Effects of cTBS on phonological decisions.
Relative to cTBS over AG, cTBS over SMG significantly decreased neural activity in bilateral supramarginal gyrus, with the strongest effect at the stimulation site. The right panel displays the parameter estimates (arbitrary units) for the different cTBS conditions that were extracted at the mean peak coordinates from the effect of interest for each task condition against rest. p<0.001 for display reasons.
Figure 4—figure supplement 1
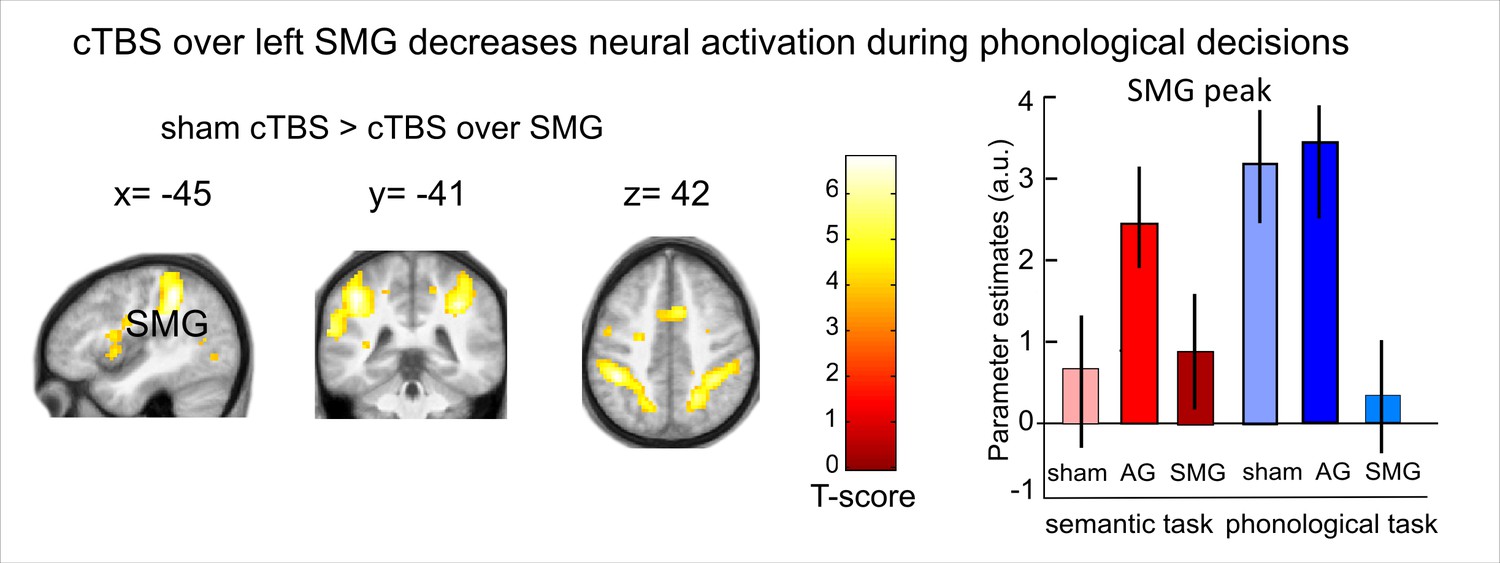
Inhibitory effects of cTBS on task-related neural activation during phonological decisions.
Relative to sham cTBS, cTBS over SMG significantly decreased neural activity in bilateral supramarginal gyrus, with the strongest effect at the stimulation site. The right panel displays the respective parameter estimates (arbitrary units) for the different cTBS conditions that were extracted at the respective mean peak coordinates from the effect of interest for each task condition against rest. p<0.001 for display reasons.
Figure 5 with 2 supplements

Effective connectivity in the semantic network.
(A) The winning DCM model assumed modulation of the connection from left AG to aIFG by cTBS of left AG. Mean parameter estimates are given for the significant driving input to SMG, the facilitatory intrinsic connections from AG to aIFG and SMG (solid arrows) and the inhibitory modulation of the connection from AG to aIFG by cTBS over AG (red line), (*)survived a Bonferoni-Holm correction. (B) Regression analysis. The increase in the inhibitory influence of AG on aIFG after AG cTBS predicted the individual semantic response delay. (C) The degree of the individual upregulation of left SMG after cTBS of AG (effect sizes for AG/sham extracted from the effect of interest at x,y,z= −45,–40, 46) was significantly correlated with the delay in semantic response speed after AG/sham cTBS.
Figure 5—figure supplement 1
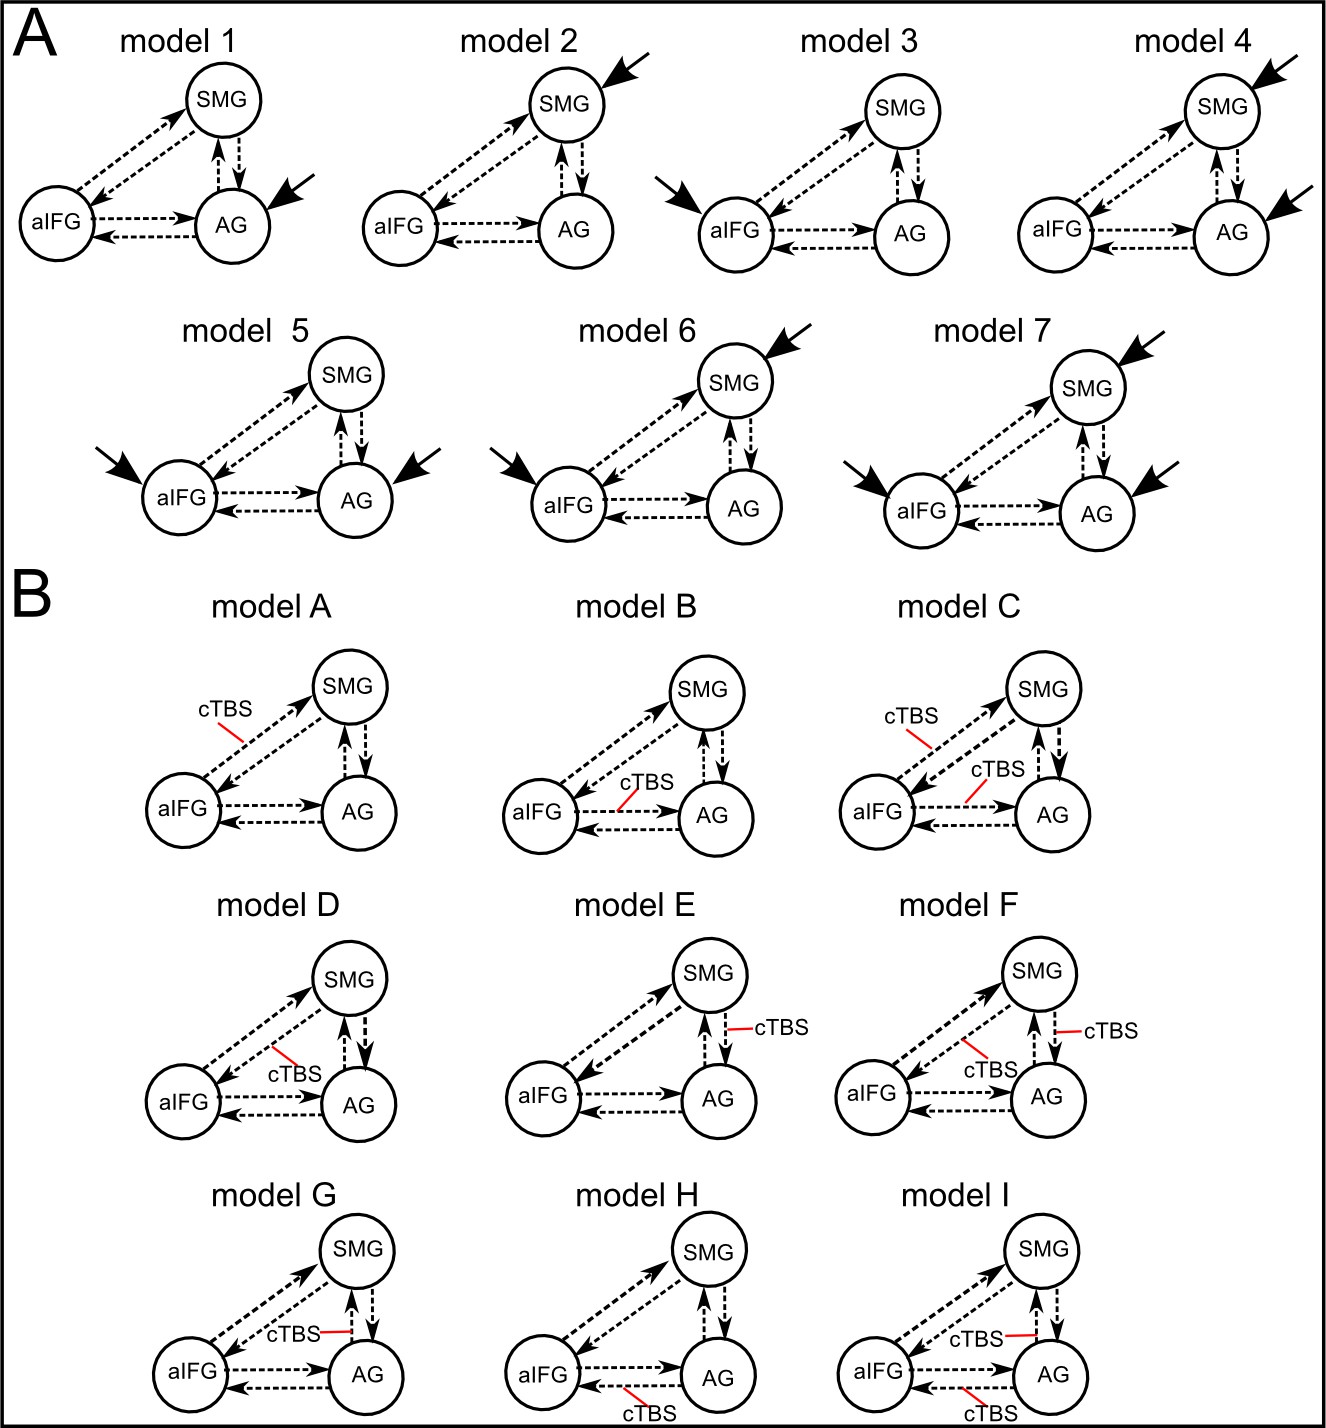
Illustration of the different DCM-models.
Panel A displays seven models that differ with respect to the driving input regions (indicated by fat solid arrows). Panel B shows nine models with different external modulations by the cTBS conditions (applied over AG or SMG, indicated by red lines). The combination of both model types resulted in a total of 63 models. All models had the same intrinsic connections (shown as dotted arrows).
Figure 5—figure supplement 2

Regression analysis.
The individual increase in the inhibitory influence of AG on aIFG after AG / sham cTBS predicted the individual semantic response delay.
Tables
Table 1
Changes in task-specific neural activation patterns after cTBS
| Region | Side | MNI coordinates X, Y, Z (in mm) | T | Cluster size | ||
|---|---|---|---|---|---|---|
| Semantic judgements: SMG > AG cTBS | ||||||
| inferior frontal gyrus (pars orbitalis) | L | −48 | 41 | −14 | 6.64 | 115 |
| inferior frontal gyrus (pars triangularis) | L | −57 | 26 | 10 | 6.48 | 95 |
| superior frontal gyrus | L | –9 | 44 | 43 | 5.71 | 92 |
| posterior middle temporal gyrus | L | −60 | −43 | –2 | 5.55 | 255 |
| angular gyrus | L | −42 | −67 | 28 | 5.21 | 240 |
| Semantic judgements: sham > AG cTBS | ||||||
| cerebellum | R | 24 | −85 | −38 | 5.21 | 117 |
| inferior frontal gyrus (pars orbitalis) | L | −45 | 38 | −14 | 5.12 | 45 |
| angular gyrus | L | −42 | −64 | 25 | 5.05 | 55 |
| Semantic judgements: AG > SMG cTBS | ||||||
| supramarginal gyrus | L | −45 | −40 | 46 | 5.30 | 215 |
| inferior frontal gyrus (pars opercularis) | L | −54 | 5 | 19 | 5.28 | 99 |
| supramarginal gyrus | R | 42 | −44 | 42 | 5.00 | 78 |
| Semantic judgements: AG > sham cTBS | ||||||
| supramarginal gyrus | L | −42 | −43 | 43 | 5.41 | 225 |
| supramarginal gyrus | R | 44 | −44 | 43 | 5.31 | 118 |
| inferior frontal gyrus (pars opercularis) | L | −57 | 8 | 16 | 5.28 | 103 |
| planum temporale | L | −57 | −40 | 19 | 5.01 | 35 |
| Phonological judgements: AG > SMG cTBS | ||||||
| supramarginal gyrus / superior parietal lobe | L | −45 | −41 | 42 | 5.24 | 222 |
| supramarginal gyrus / superior parietal lobe | R | 36 | −40 | 40 | 5.23 | 121 |
| frontal operculum / posterior inferior frontal gyrus | L | −55 | 10 | 4 | 4.97 | 87 |
| frontal operculum / posterior inferior frontal gyrus | R | 57 | 11 | 4 | 4.95 | 69 |
| supplementary motor area | R | 0 | 5 | 55 | 4.91 | 92 |
| Phonological judgements: sham > SMG cTBS | ||||||
| supramarginal gyrus / superior parietal lobe | L | −42 | −40 | 46 | 6.10 | 334 |
| frontal operculum / posterior inferior frontal gyrus | L | −51 | 8 | –2 | 5.91 | 97 |
| supramarginal gyrus / superior parietal lobe | R | 36 | −39 | 42 | 5.88 | 169 |
| frontal operculum / posterior inferior frontal gyrus | R | 57 | 8 | 7 | 5.44 | 82 |
| supplementary motor area | R | 0 | 7 | 55 | 5.29 | 101 |
| middle frontal gyrus | L | −33 | 41 | 25 | 5.12 | 57 |
-
thresholded at p<0.05; FWE-corrected at the peak level, cluster extent >20 voxels.
Table 2
Mean parameter estimates of the winning model for semantic decisions
| Connection / parameter Right | Mean | SD | T | P |
|---|---|---|---|---|
| Intrinsic connections | ||||
| AG→aIFG | 0.0295 | 0.0315 | 2.24 | 0.046 |
| AG→SMG | 0.0314 | 0.0140 | 3.27 | 0.006* |
| aIFG→AG | 0.1100 | 0.3965 | 1.07 | 0.30 |
| aIFG→SMG | 0.0529 | 0.1535 | 1.33 | 0.20 |
| SMG→AG | 0.2424 | 0.1642 | 2.10 | 0.056 |
| SMG→aIFG | 0.0413 | 0.1195 | 1.34 | 0.20 |
| Modulation of connectivity from AG aIFG by cTBS | ||||
| cTBS of AG | −0.1900 | 0.1746 | −3.67 | 0.003* |
| cTBS of SMG | 0.0167 | 0.1471 | 1.27 | 0.23 |
| Driving Input | ||||
| SMG | 0.0136 | 0.0106 | 2.21 | 0.049 |
-
*significant at p<0.05; two-tailed; corrected with a Bonferroni-Holm correction for multiple comparisons.
Table 3
Changes in task-specific neural activation patterns after sham cTBS
| Region | Side | MNI coordinates X, Y, Z | T | Cluster size | ||
|---|---|---|---|---|---|---|
| Semantic judgements > rest | ||||||
| cerebellum (lobule VIIa) | R | 18 | −82 | −35 | 10.76 | 2981 |
| angular gyrus | L | −44 | −66 | 25 | 10.36 | 6144 |
| supplementary motor area | R | 5 | 14 | 52 | 10.21 | 354 |
| superior frontal gyrus | L | –12 | 38 | 46 | 9.47 | 2900 |
| inferior frontal gyrus (pars orbitalis) | L | −48 | 38 | −14 | 9.42 | 3200 |
| inferior frontal gyrus (pars triangularis) | L | −57 | 26 | 10 | 4.85 | subcluster |
| thalamus | L | −18 | −13 | 9 | 8.67 | 135 |
| postcentral gyrus | L | −57 | −19 | 25 | 6.33 | 68 |
| angular gyrus | R | 47 | −64 | 25 | 8.37 | 150 |
| middle temporal gyrus (posterior part) | L | −63 | −43 | –2 | 5.29 | 130 |
| precuneus | L | –3 | −52 | 16 | 4.87 | 1119 |
| Phonological judgements > rest | ||||||
| supramarginal gyrus / superior parietal lobe | L | −48 | −38 | 46 | 12.84 | 462 |
| superior parietal lobe | L | −27 | −57 | 44 | 8.67 | subcluster |
| supplementary motor area | R | 3 | 14 | 49 | 12.32 | 4936 |
| thalamus | L | −18 | −12 | 8 | 10.54 | 95 |
| thalamus | R | 15 | −13 | 13 | 10.93 | 98 |
| precentral gyrus / posterior inferior frontal gyrus (pars opercularis) | L | −45 | 5 | 25 | 8.76 | 5222 |
| middle / inferior frontal gyrus (pars triangularis) | L | −48 | 33 | 26 | 8.23 | subcluster |
| anterior insula | L | −30 | 20 | 7 | 10.21 | 326 |
| supramarginal gyrus / superior parietal lobe | R | 54 | −31 | 52 | 10.22 | 663 |
| precentral gyrus / primary motor cortex | R | 39 | −22 | 52 | 7.53 | subcluster |
| precentral gyrus | R | 36 | −19 | 67 | 7.37 | subcluster |
| cerebellum (lobule VI) | R | 30 | −64 | −29 | 10.12 | 2582 |
| cerebellum | R | 39 | −52 | −32 | 9.92 | subcluster |
| cerebellum | L | −18 | −52 | −23 | 9.14 | subcluster |
| inferior temporal gyrus | L | −51 | −52 | −14 | 6.53 | 154 |
| middle frontal gyrus | R | 45 | 35 | 19 | 8.67 | 345 |
| inferior frontal gyrus (pars opercularis) | R | 50 | 16 | 4 | 6.80 | subcluster |
| postcentral gyrus | L | −60 | −16 | 22 | 5.24 | 29 |
| Semantic judgements > phonological judgements | ||||||
| inferior frontal gyurs (pars triangularis) | L | −53 | 26 | 10 | 6.68 | 336 |
| angular gyrus | L | −45 | −67 | 28 | 6.21 | 348 |
| superior frontal gyrus | L | –9 | 59 | 28 | 5.88 | 292 |
| superior frontal gyrus | R | 9 | 41 | 49 | 4.95 | subcluster |
| angular gyrus | R | 54 | −64 | 25 | 4.92 | 123 |
| middle temporal gyrus (posterior part) | L | −63 | −40 | –2 | 4.90 | 139 |
| middle temporal gyrus (anterior part) | L | −54 | –2 | −23 | 4.88 | 28 |
| Phonological judgements > semantic judgements | ||||||
| inferior frontal gyrus (pars opercularis)/ frontal operculum | L | −51 | 8 | 4 | 7.21 | 1235 |
| supramarginal gyrus / superior parietal lobe | L | −42 | −37 | 40 | 6.84 | 158 |
| cerebellum (lobule VIIb) | R | 21 | −70 | −47 | 6.34 | 97 |
| supplementary motor area | M | 3 | 5 | 61 | 6.23 | 383 |
| supramarginal gyrus / superior parietal lobe | R | 36 | −40 | 37 | 6.22 | 548 |
| middle frontal gyrus | L | −33 | 41 | 25 | 5.83 | 119 |
| inferior frontal gyrus (pars opercularis) | R | 54 | 11 | 7 | 5.67 | 242 |
| cerebellum (lobule VI) | R | 18 | −70 | −17 | 5.64 | 254 |
| middle frontal gyrus | R | 33 | 35 | 31 | 5.42 | 166 |
| superior temporal gyrus | L | −60 | −15 | 10 | 4.85 | 35 |
-
thresholded at p<0.05; FWE-corrected at the peak level, cluster extent >20 voxels.
Download links
A two-part list of links to download the article, or parts of the article, in various formats.
Downloads (link to download the article as PDF)
Open citations (links to open the citations from this article in various online reference manager services)
Cite this article (links to download the citations from this article in formats compatible with various reference manager tools)
Rapid short-term reorganization in the language network
eLife 6:e25964.
https://doi.org/10.7554/eLife.25964


