An unfolded protein-induced conformational switch activates mammalian IRE1
- Howard Hughes Medical Institute, University of California, San Francisco, United States
- University of New Hampshire, United States
Figures
Figure 1
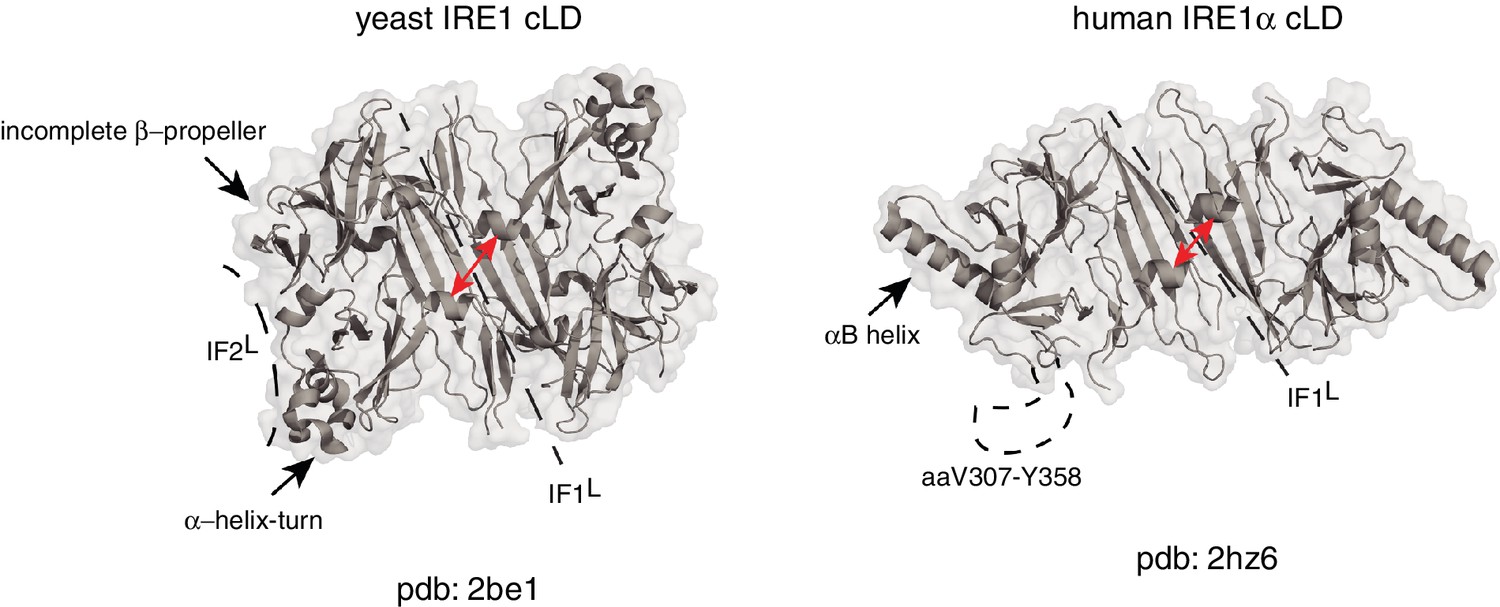
Human and yeast IRE1 cLD’s crystal structures display distinct features.
The αB helix in hIRE1α cLD structure (pdb: 2hz6) , the helix-turn region and the incomplete β-propeller in yIRE1 cLD (pdb: 2be1) structure are indicated with arrows. The interfaces IF1L and IF2L and the unresolved dynamic region (aaV307-Y358) in hIRE1α cLD crystal structure are depicted with dashed lines. The distance between the helices surrounding the groove in yIre1 and hIRE1α cLD is depicted with red arrows.
Figure 2 with 2 supplements
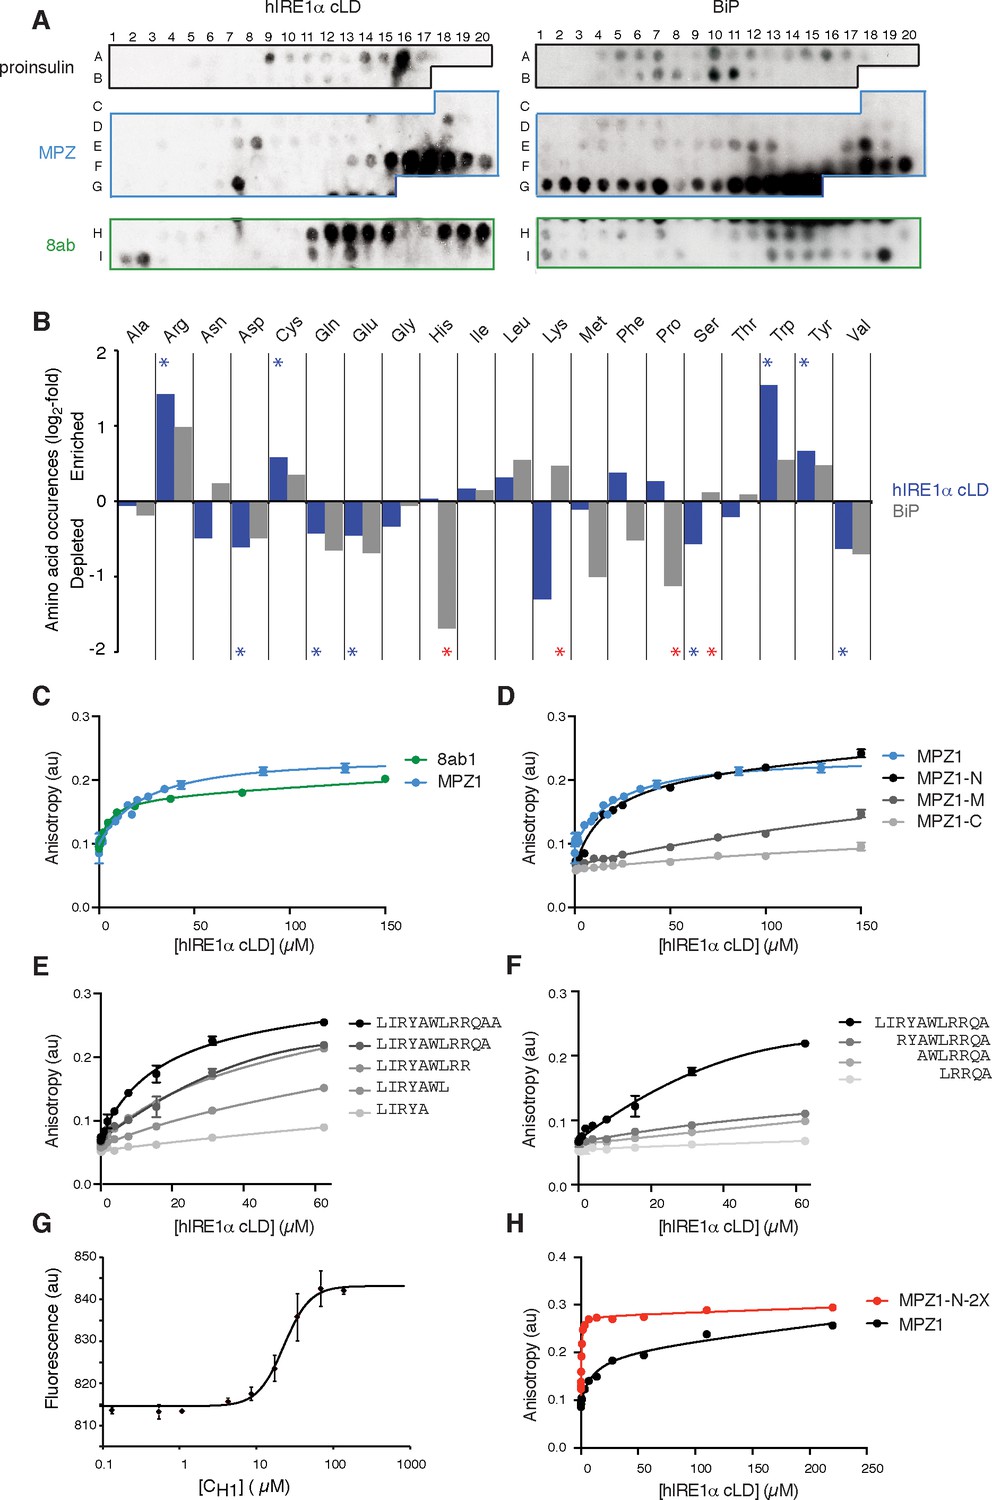
hIRE1α cLD binds peptides and unfolded proteins
(A) Peptide arrays tiled with 18mer peptides derived from proinsulin, myelin protein zero (MPZ), 8ab are probed with MBP-hIRE1α cLD (on the left) or His10-BiP (on the right). (B) Comparison of the amino acid preferences of MBP-hIRE1α cLD (blue) and His10-BiP (gray). The peptide arrays were quantified using Max Quant. The binding intensity in each spot was normalized to max signal intensity in the peptide array. The peptides with the top 10% binding scores were selected and the occurrence of each amino acid in these top-binding peptides was normalized to their total abundance in the arrays. The normalized occurrences are plotted in log2 scale. Blue stars depict the amino acids that are significantly enriched or depleted in hIRE1α cLD binders (p<0.05), whereas red stars depict differences in binding preferences of hIRE1α cLD and BiP (p<0.05). (C) hIRE1α cLD binds peptides derived from proteins MPZ, ‘MPZ1’ (in blue) (peptides F16-F17 in Figure 1a, sequence: LIRYCWLRRQAALQRRISAME) and 8ab, ‘8ab1’ (in green) (peptide H20 in Figure 1a, sequence: WLCALGKVLPFHRWHTMV) with a K1/2 of 24 ± 4.7 µM and 5 ± 1.7 µM, respectively, determined by fluorescence anisotropy measurements. (D) Fluorescence anisotropy measurements show that N-terminal 12mer derivative of MPZ1 peptide, ‘MPZ1-N’ binds to hIRE1α cLD with a similar affinity as the full-length peptide, with a K1/2= 16.0 ± 2.6 µM. The binding curves of N-terminal (MPZ1-N, sequence: LIRYCWLRRQAA), Middle (MPZ1-M, sequence: WLRRQAALQRR) and C-terminal (MPZ1-C, sequence: LQRRISAME) fragments are shown in black, dark gray, and light gray, respectively. (E) The binding affinity of C-terminal truncations of MPZ1-N for hIRE1α cLD was measured by fluorescence anisotropy. The binding curves for the truncated peptides are shown in different shades of gray. (F) Fluorescence anisotropy measurements with N-terminal truncations of the MPZ1-N peptide are shown in different shades of gray. (G) IRE1 cLD binds to unfolded CH1 domain of IgG1 with a K1/2 of 29.2 ± 1.2 µM determined by microscale thermophoresis measurements. (H) Fluorescence anisotropy measurements show that MPZ1-N-2X peptide where MPZ1-N peptide sequence is repeated twice in the peptide binds tighter to hIRE1α cLD (peptide sequence: LIRYAWLRRQAALQRRLIRYAWLRRQAA).
Figure 2—figure supplement 1
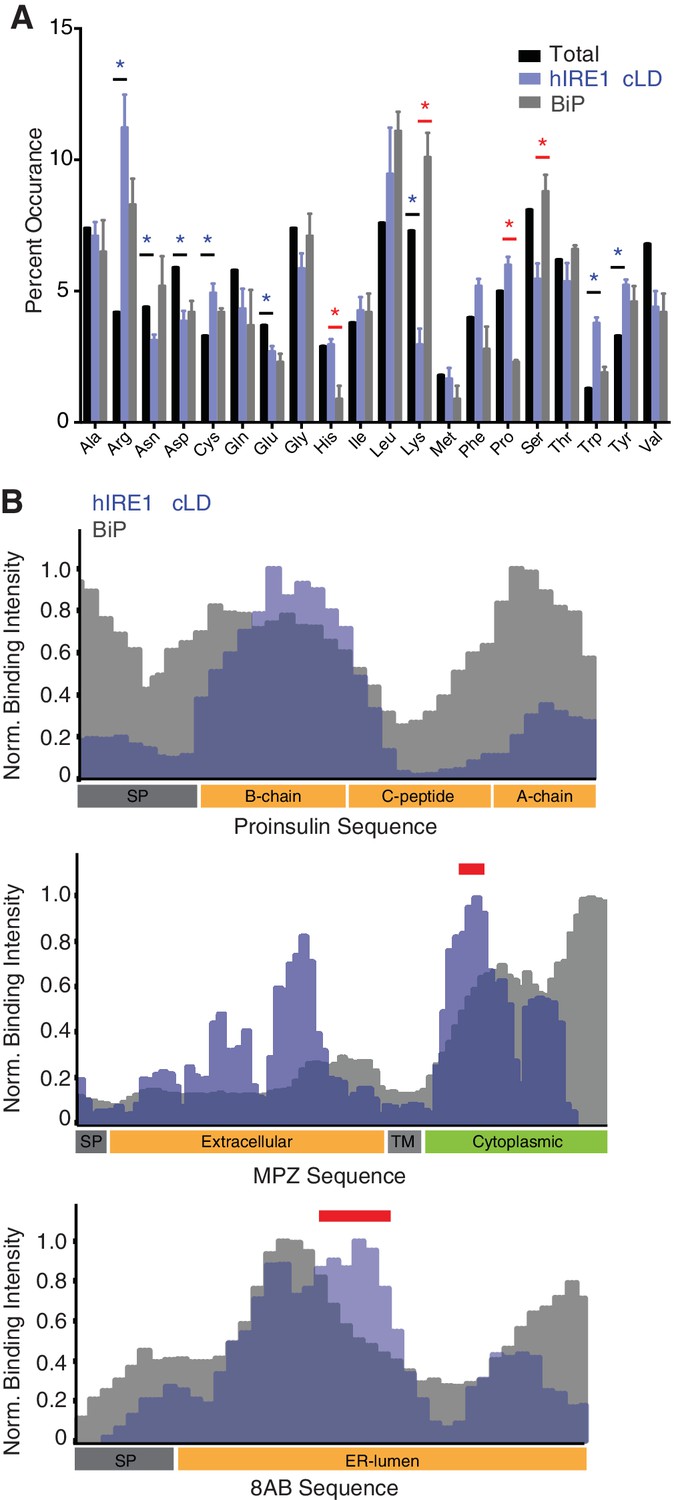
hIRE1α cLD shows preference for arginines and aromatic residues.
(A) Comparison of the amino acid preferences of MBP-hIRE1α cLD (blue) and His10-BiP (gray) with the amino acid composition of all peptides displayed on the array (total, black). The frequency of each amino acid present in peptides with top 10% binding score is shown for hIRE1α cLD and BiP. The experimental error is calculated from three experimental replicates. Blue stars depict the amino acids that are significantly enriched or depleted in hIRE1α cLD binders (p<0.05), whereas red stars show the amino acids that differ between hIRE1α cLD and BiP binders (p<0.05). (B) Comparison of MBP-hIRE1α cLD (blue) and His10-BiP (gray) binding to peptides derived from MPZ, proinsulin and 8ab. The contribution of each amino acid to MBP-hIRE1α cLD (blue) and His10-BiP (gray) binding was calculated by averaging the intensity of 6 neighboring spots that contain that amino acid. The topology of the proteins is shown at the bottom of each graph (SP: signal peptide, TM: transmembrane domain). Precursor peptides of insulin are depicted in the graph. Red bars indicate the location of the MPZ1 and 8ab1 peptides in the protein sequence.
Figure 2—figure supplement 2
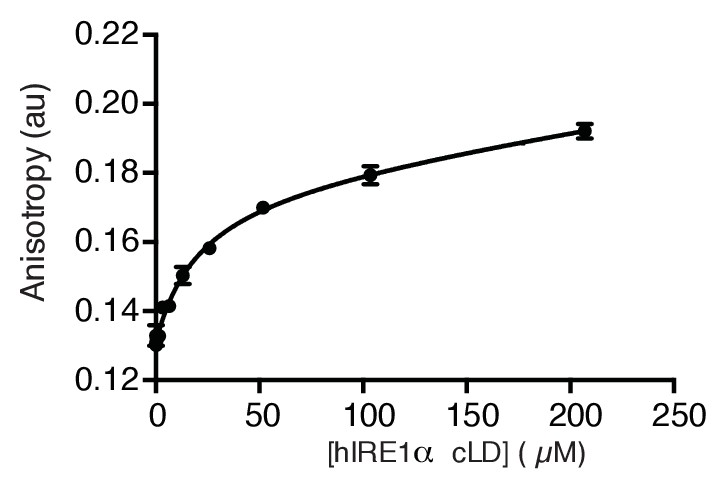
hIRE1α cLD binds unfolded proteins.
hIRE1α cLD binds the folding mutant of Staphylococcal nuclease Δ131Δ with 21.4 ± 2.3 µM affinity determined by fluorescence anisotropy.
Figure 3 with 4 supplements
NMR spectroscopy reveals dynamic nature of hIRE1α cLD
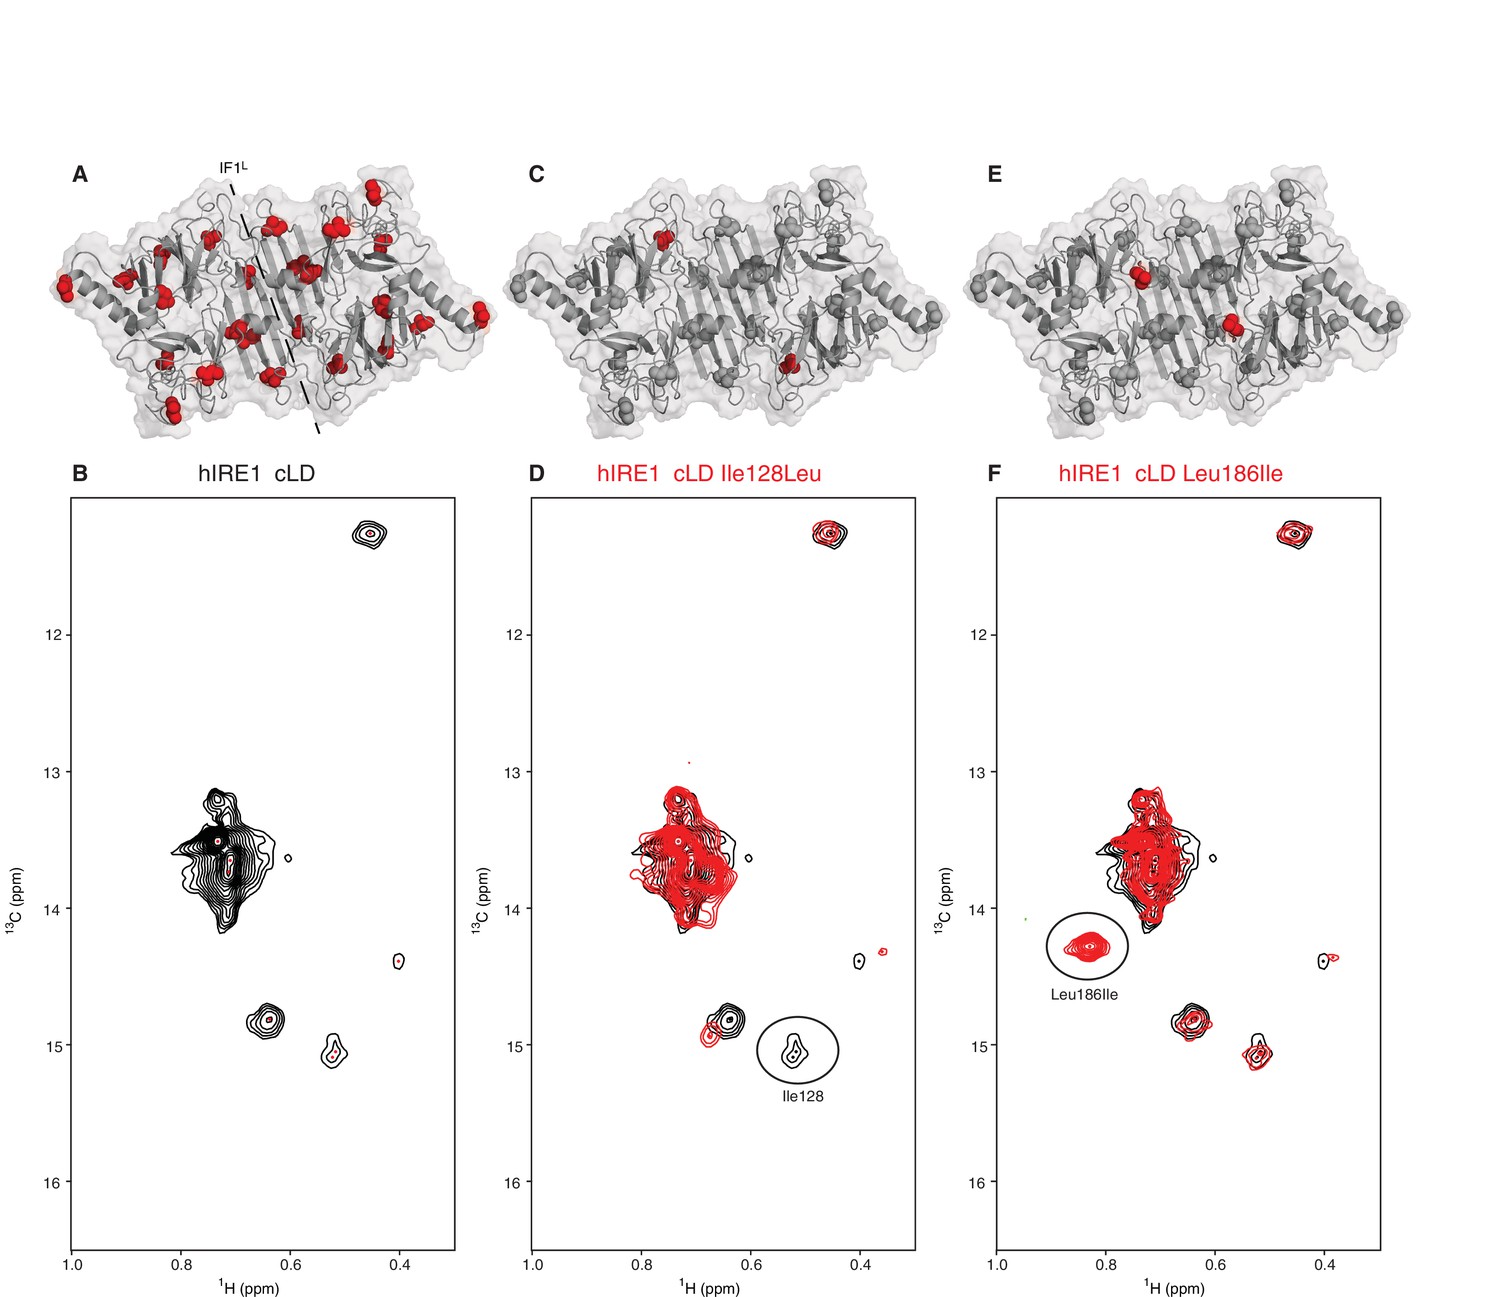
(A) Isoleucines serving as probes in the NMR experiments are evenly distributed throughout hIRE1α cLD. hIRE1α cLD structural model is shown in gray, with space-filling isoleucine side chains shown in red. The structural model of hIRE1α cLD was generated by I-Tasser webserver using hIRE1α cLD crystal structure (pdb:2hz6) as a template to visualize the loops that are not resolved in the crystal structure (Roy et al., 2010; Zhang, 2008). The dimerization interface IF1L of hIRE1α cLD is depicted with a dashed line. (B) Methyl-TROSY spectrum of hIRE1α cLD with selective 13C labeling at δ1- methyl group of isoleucines resolves seven peaks, indicated by red dots. (C) Ile128 is highlighted as red spheres on hIRE1α cLD structural model. hIRE1α cLD is shown in gray, with isoleucine side chains are depicted as grayspace-fillings. (D) Assignment strategy for isoleucines in hIRE1α cLD. The WT hIRE1α cLD spectrum (in black) is overlaid with the spectrum of Ile128Ala mutant (depicted in red). The signal that disappeared in the mutant spectrum corresponds to Ile128 peak and is depicted with a circle. (E) The side chain of Leu186 is highlighted as red spheres on hIRE1 α cLD structural model. (F) The WT hIRE1α cLD spectrum (in black) is overlaid with the spectrum of Leu186Ile mutant (depicted in red). The signal that appeared in the mutant spectrum that corresponds Leu186Ile peak is depicted with a circle.
Figure 3—figure supplement 1
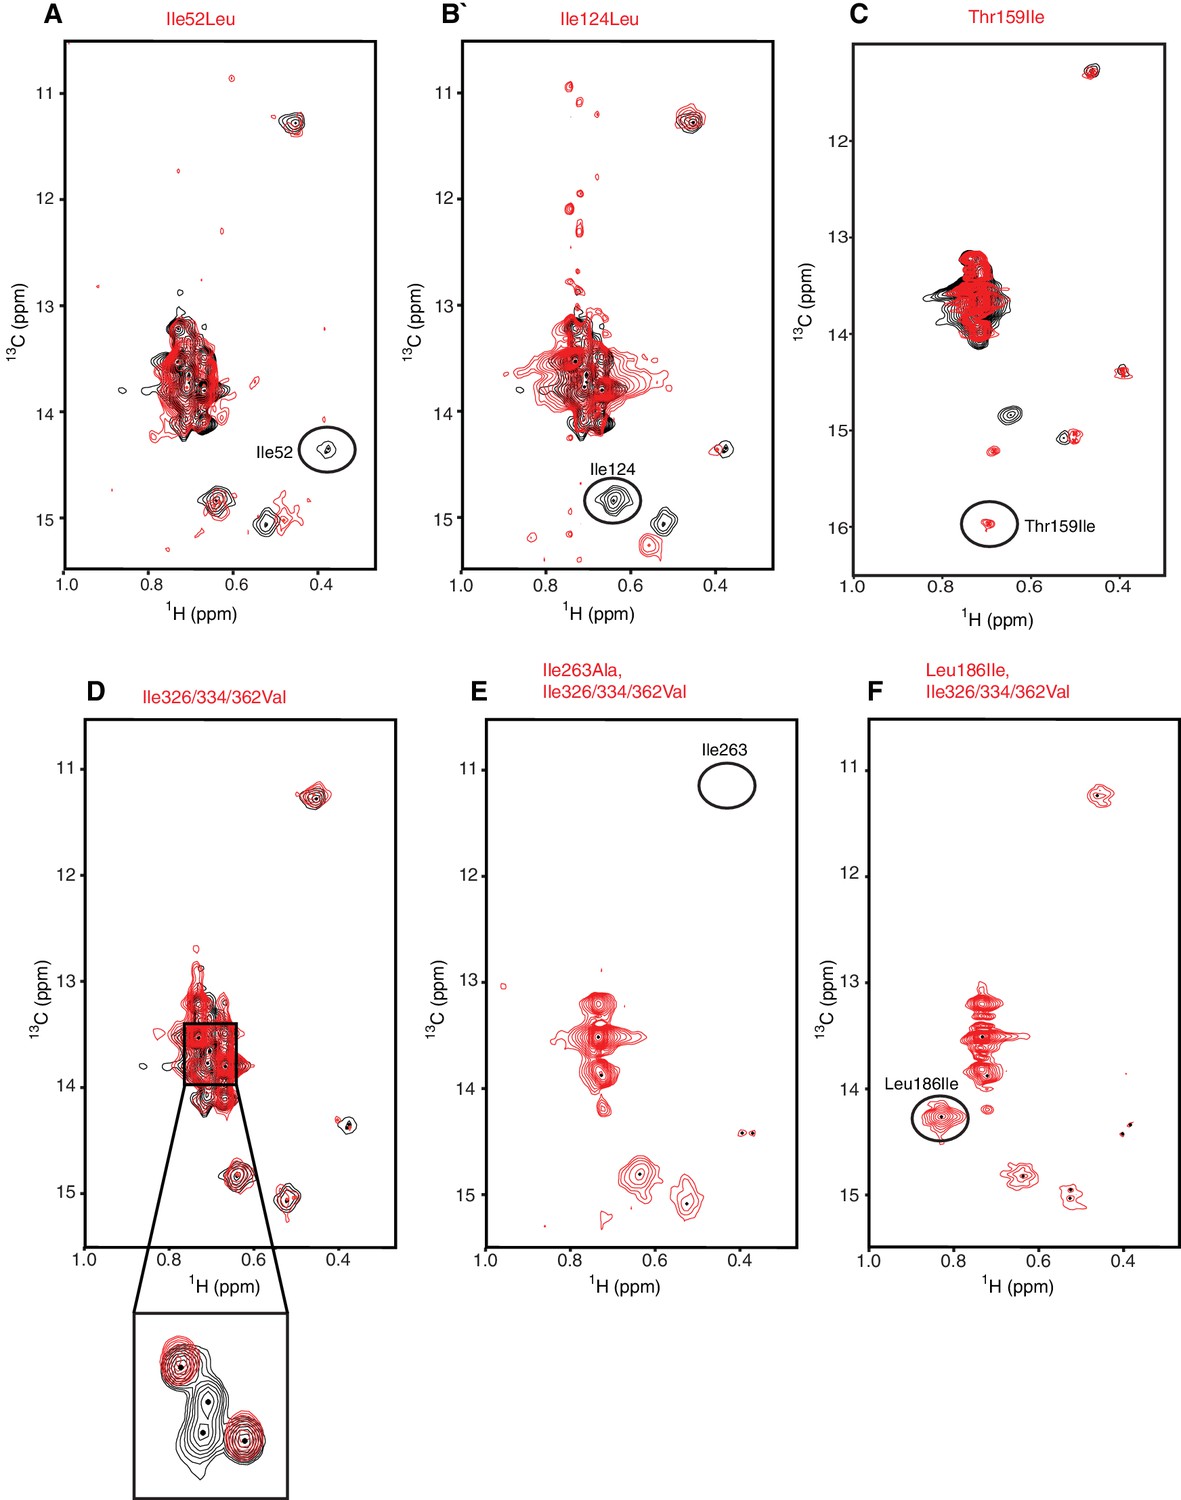
Assignment strategy of the isoleucines in hIRE1α cLD spectrum.
(A–F) The WT hIRE1α cLD (in black) is overlaid with isoleucine mutants (depicted in red). The mutants Ile52Leu (A), Ile124Leu (B), resulted in disappearance of corresponding residues from the NMR spectrum. By contrast, we did not observe peaks disappear in the hIRE1α cLD Ile362Leu spectrum (Figure 3—figure supplement 2F). The triple Ile326/334/362Val mutation assigned disappearing peaks to Ile326 and Ile334 (D). The Ile263Ala (E) and Leu186Ile (F) mutants were made independently in the context of the Ile326/334/362Val triple mutation to overcome spectral crowding and unambiguously assign these residues in the resulting quadruple mutants. Thr159Ile (C) Leu186Ile (F) mutations were made to increase the number of Ile probes.
Figure 3—figure supplement 2
Assignment strategy of the isoleucines in hIRE1α cLD spectrum.
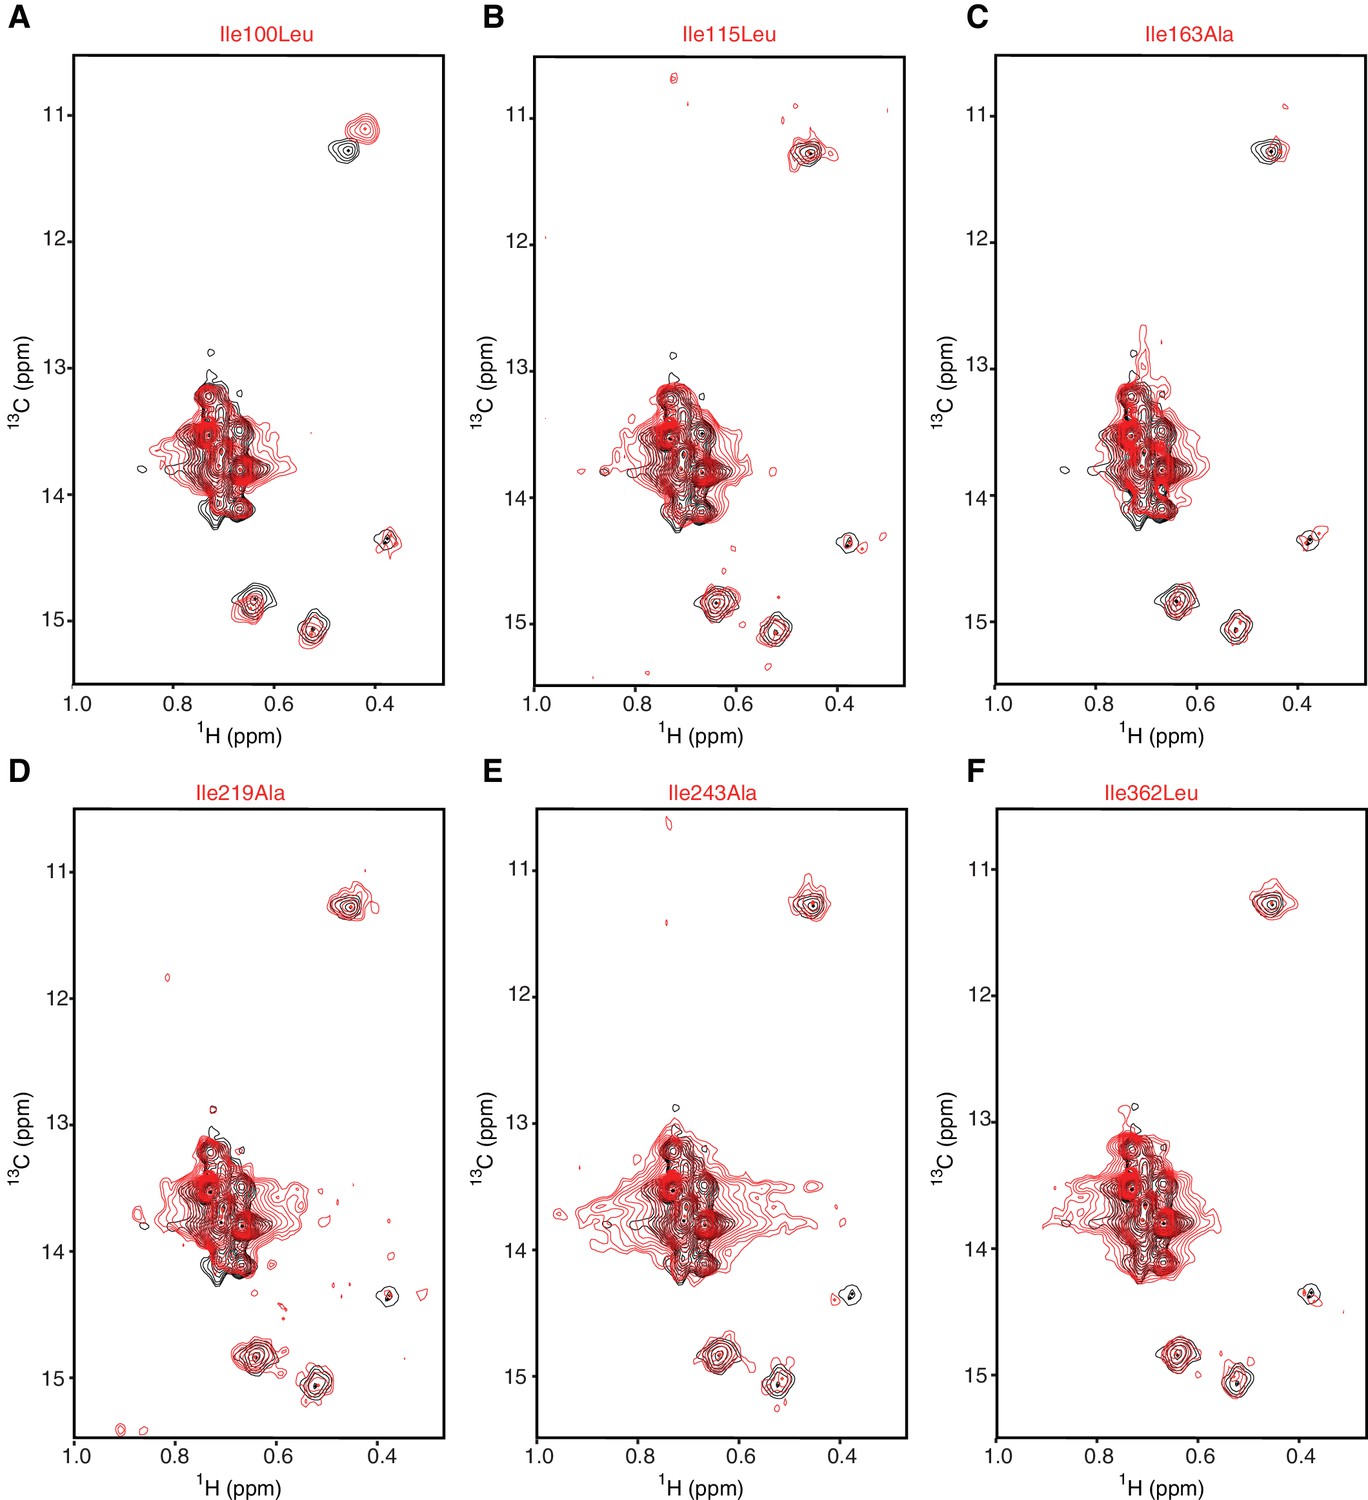
(A–F) No peaks disappeared in the spectrum of Ile100Leu (A), Ile115Leu (B), Ile163Ala (C) Ile219Ala (D), Ile243Ala (E) and Ile362Leu (F) mutants. This is likely due to signal overlap, to low signal intensity of these residues, and/or to a combination of the two. These experiments confirm the unambiguity of the assignment of the other residues.
Figure 3—figure supplement 3
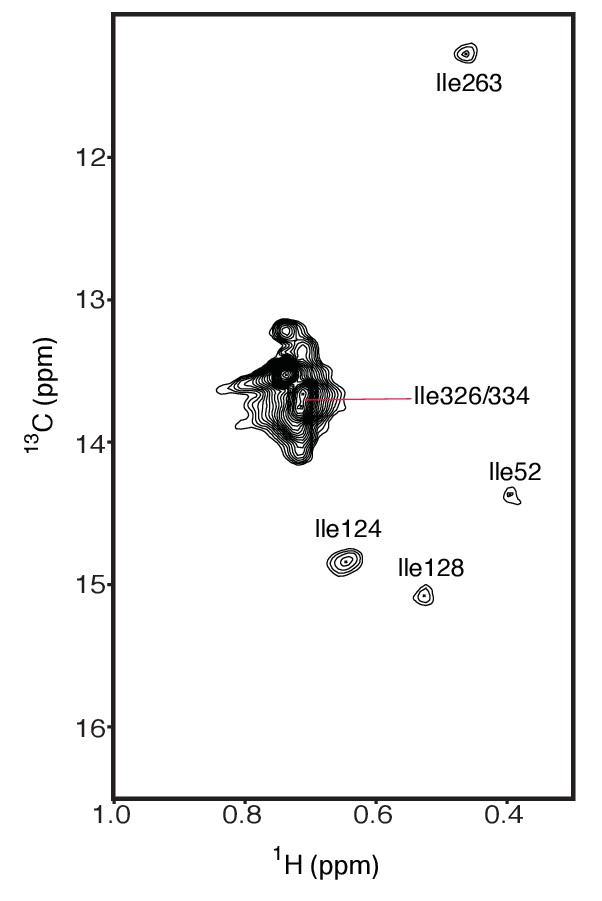
The assigned isoleucines in wild type hIRE1α cLD are depicted on the spectrum.
https://doi.org/10.7554/eLife.30700.011
Figure 3—figure supplement 4
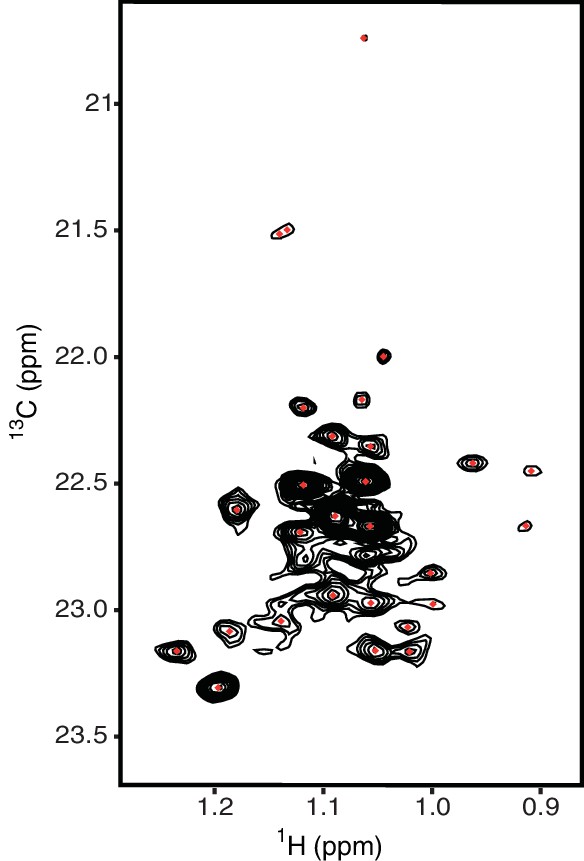
Methyl-TROSY spectrum of hIRE1α cLD with selective 13C labeling at γ2 methyl group of threonines resolves 24 residues.
The threonine peaks are colored as red dots.
Figure 4 with 2 supplements
Peptide binding induces conformational changes in hIRE1α cLD
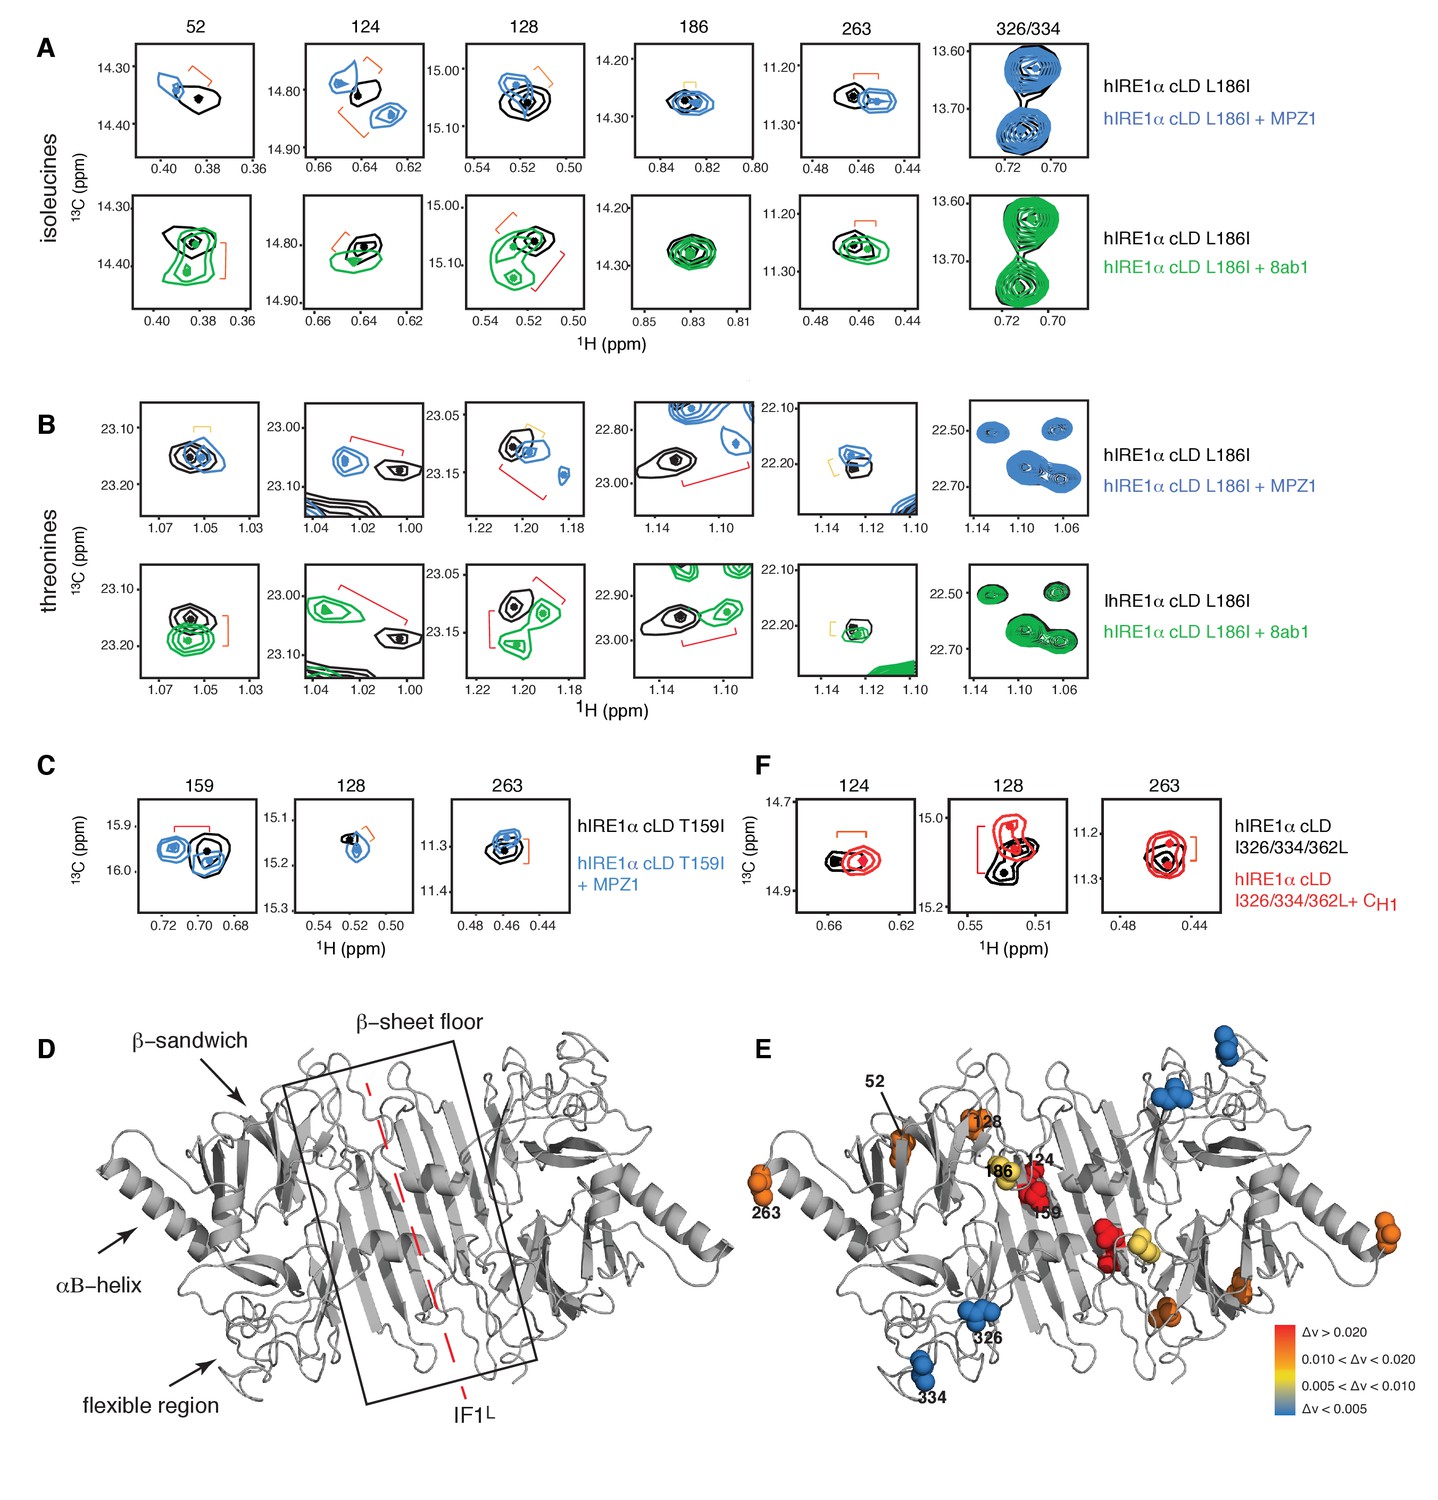
(A) Close-up of the isoleucine peaks in the methyl-TROSY spectrum of hIRE1α cLD Leu186Ile alone (black, 50 µM) and of hIRE1α cLD Leu186lle bound to MPZ1 (1:1 molar ratio) (upper panel, blue), or to 8ab1 peptide (lower panel, green, 1:1 molar ratio) shows that peptide binding shifts select peaks. The shift of each peak is indicated with brackets consistent with the color code in Figure 4—figure supplement 1B, where yellow color indicates chemical shift perturbation values Δν > 0.005, orange, Δν > 0.010 and red Δν > 0.020. The identities of isoleucine peaks are indicated on top of each peak. (B) Close-up of the threonine peaks in the methyl-TROSY spectrum of hIRE1α cLD Leu186Ile alone (black, 50 µM) and of hIRE1α cLD Leu186Ile bound to MPZ1 (1:1 molar ratio) (upper panel, blue), or to 8ab1 peptide (lower panel, green, 1:1 molar ratio) shows that peptide binding shifts select peaks upon binding of peptides. The chemical shift of each peak is indicated as in Figure 4A based on the chemical shift perturbations calculated in Figure 4—figure supplement 1C. (C) Close-up of select isoleucine peaks in the methyl-TROSY spectrum of hIRE1α cLD T159I mutant alone (black, 25 µM) and in the spectrum of hIRE1α cLD bound to MPZ1-N peptide (1:1 molar ratio) (blue). The chemical shift of each peak is indicated with brackets consistent with the color code in Figure 4—figure supplement 1B,D. (D) Important structural regions of hIRE1 cLD are depicted on the structural model of hIRE1α cLD by arrows. The red dashed-lines indicate the dimerization interface IF1L of hIRE1α cLD, whereas the black box shows the β-sheet floor of the MHC-like groove. (E) The isoleucine peaks shifting upon MPZ1 binding are mapped into the hIRE1α cLD structural model based on their combined chemical shift perturbation values as shown in Figure 4—figure supplements 4 and 6. The red spheres indicate isoleucine peaks with significant shifts (Δν > 0.020), orange; moderate shifts Δν > 0.010, and yellow spheres show isoleucines that shift slightly upon peptide binding, Δν > 0.005. The isoleucine peaks that do not change significantly (Δν < 0.005) are depicted in blue. (F) Close-up of select isoleucine peaks in the methyl-TROSY spectrum of hIRE1α cLD triple mutant Ile326/334/362Leu alone (black, 50 µM) overlaid with the spectrum of hIRE1α cLD when bound to CH1 domain (1:1 molar ratio) (red). The shifts are indicated with brackets consistent with color coding in Figure 4B and Figure 4—figure supplement 1B,D.
Figure 4—figure supplement 1
Peptide induced conformational changes in hIRE1α cLD.
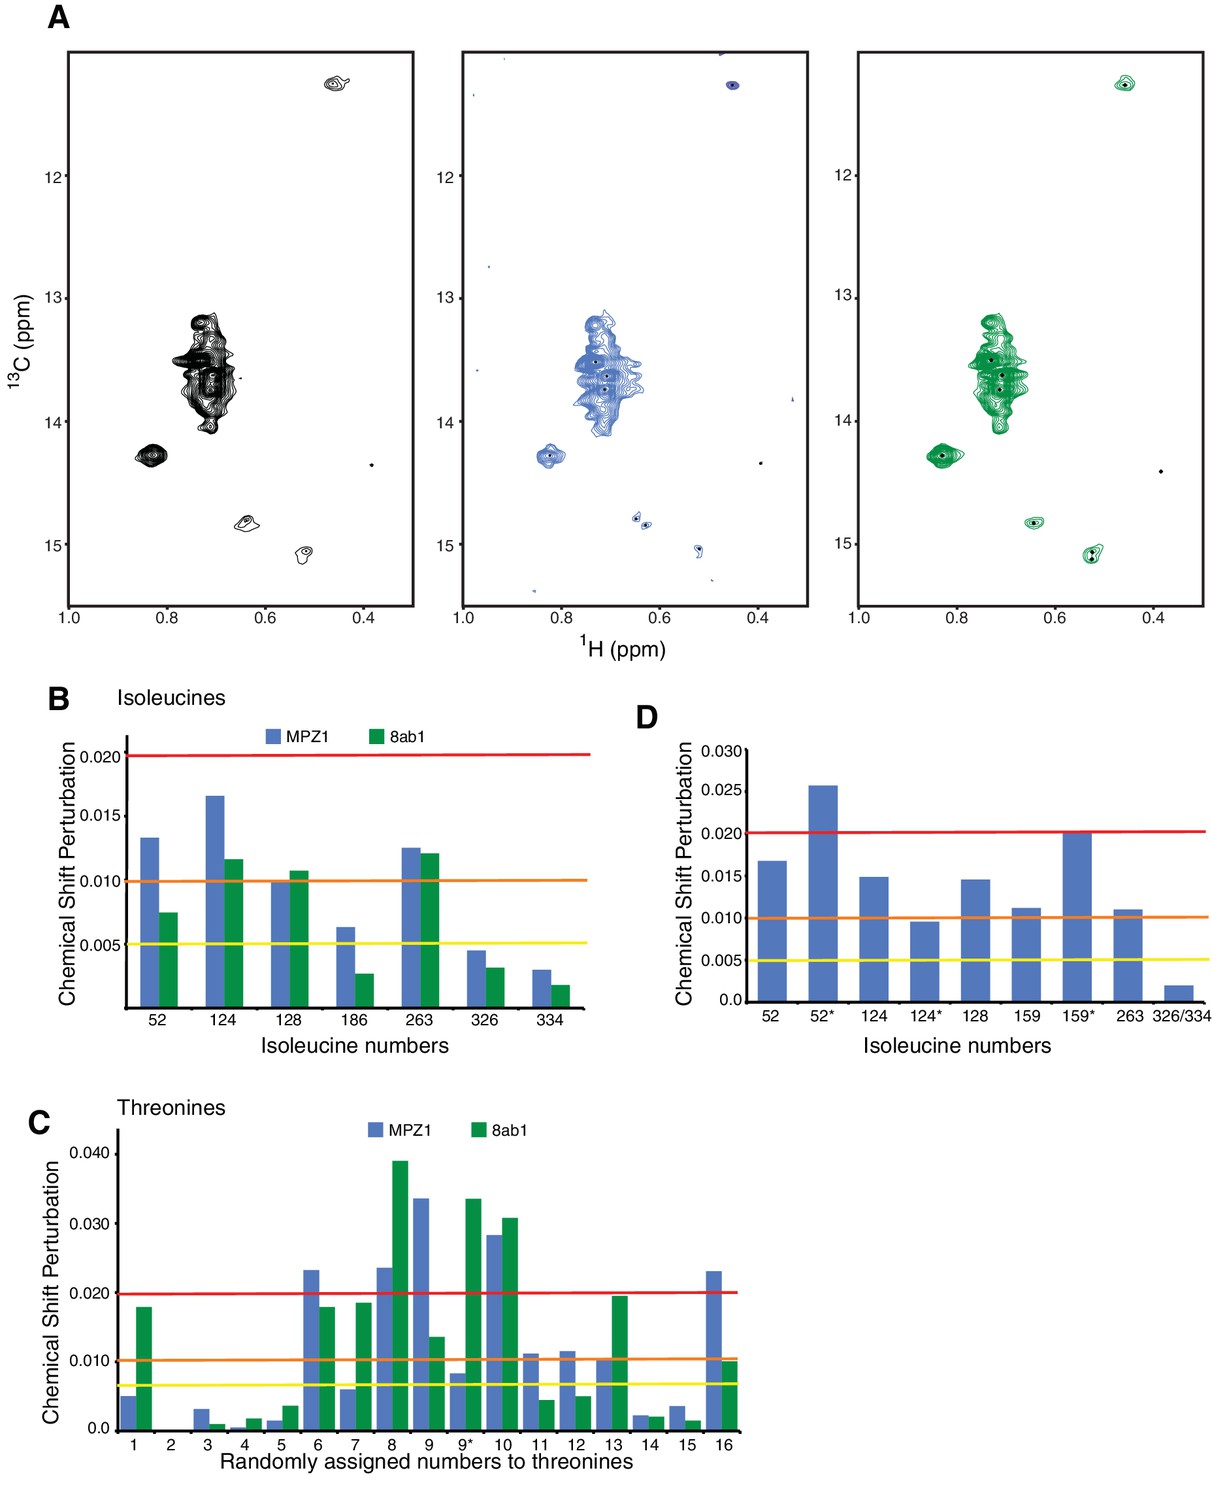
(A) Methyl-TROSY spectrum of hIRE1α cLD Leu186Ile at 50 µM alone (right), hIRE1α cLD Leu186Ile bound to MPZ1 peptide, at 50 µM (1:1 molar ratio, middle), hIRE1α cLD Leu186Ile bound to 8ab1 peptide, at 50 µM (1:1 molar ratio, left). (B) Chemical shift perturbation analysis of isoleucine signals upon MPZ1 (blue) and 8ab1 (green) peptide binding to hIRE1α cLD (based on the spectra in Figure 4a). The combined chemical shift perturbation of the isoleucines is calculated as Δν= ((0.25ΔνC)2 + (ΔνH)2)1/2. The yellow line indicates Δν > 0.005, orange line Δν > 0.010 and red line Δν > 0.020. ‘*’ indicates isoleucine peaks that split. (C)Chemical shift perturbation analysis of threonine signals upon MPZ1 (blue) and 8ab1 (green) peptide binding to hIRE1α cLD (based on the spectra in Figure 4b). The combined chemical shift perturbation of the isoleucines are calculated as ΔV= ((0.25ΔνC)2 + (ΔνH)2)1/2. The yellow line indicates Δν > 0.005, orange line Δν > 0.010 and red line Δν > 0.020. ‘*’ indicates isoleucine peaks that split. (D) Chemical shift perturbation analysis of isoleucine signals upon MPZ1 (blue) peptide binding to hIRE1α cLD T159I mutant (based on the spectrum in Figure 4c). The yellow line indicates Δν > 0.005, orange line Δν > 0.010 and red line Δν > 0.020.
Figure 4—figure supplement 2
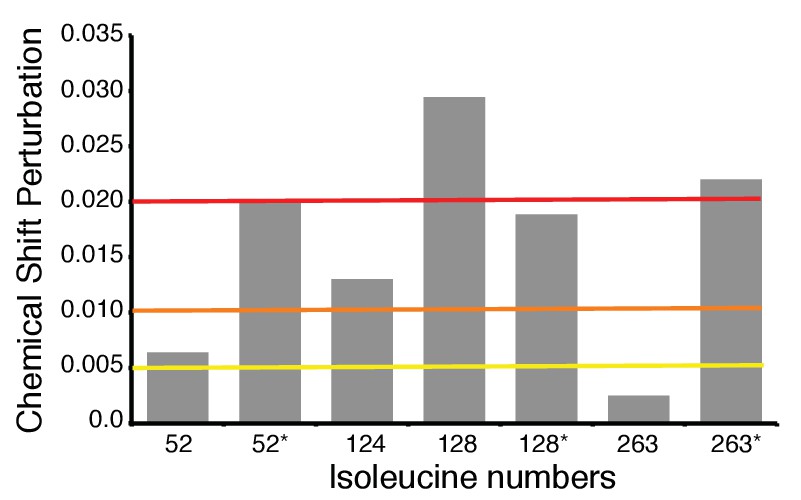
Chemical shift perturbation analysis of isoleucine signals upon binding of CH1 domain to hIRE1α cLD I326-334-362L triple mutant (based on the spectrum in Figure 4f).
The yellow line indicates Δν > 0.005, orange line Δν > 0.010 and red line Δν > 0.020. ‘*’ indicates isoleucine peaks that split.
Figure 5 with 1 supplement

Peptide binding maps to the center of MHC-like groove
(A) Schematic representation of the spin label attached MPZ1 peptide. (B) Comparison of the methyl-TROSY spectra of hIRE1α cLD Leu186Ile in the absence (black, 75 µM) and presence of spin-labeled MPZ1 peptide (red, 1:1 molar ratio). (C) The normalized PRE effect on isoleucine peaks upon binding of spin-labeled peptide. The intensity of isoleucine peaks upon MPZ1-proxyl binding is divided by their intensity in the reference spectrum (IPRE/I0) (Figure 5—figure supplement 1C) and further normalized to their surface exposed area to exclude possible contributions from non-specific interactions with the spin label attached peptide (Clore and Iwahara, 2009) (see Materials and methods). (D) The normalized PRE effect is mapped on the structural model of hIRE1α cLD. The isoleucine peaks in hIRE1α cLD that are broadened upon peptide binding are depicted with a color gradient from red to green as space filling side-chains in the hIRE1α cLD structural model based on decreasing degree of broadening using normalized PRE effect in Figure 5C.
Figure 5—figure supplement 1

Peptide binding maps to the center of the MHC-like groove in hIRE1α cLD.
(A) Comparison of the methyl-TROSY spectra of hIRE1α cLD L186I/I326-334-362L quadruple mutant in the absence (black, 50 µM) and presence of spin-labeled MPZ1 peptide (red in 1:1 molar ratio). (B) The intensity of isoleucine peaks upon MPZ1-proxyl binding to L186I/I326-334-362L quadruple mutant is divided to their intensity in the reference spectrum (IPRE/I0). (C) The intensity of isoleucine peaks upon MPZ1-proxyl binding to L186I mutant is divided to their intensity in the reference spectrum (I PRE/I0).
Figure 6 with 2 supplements
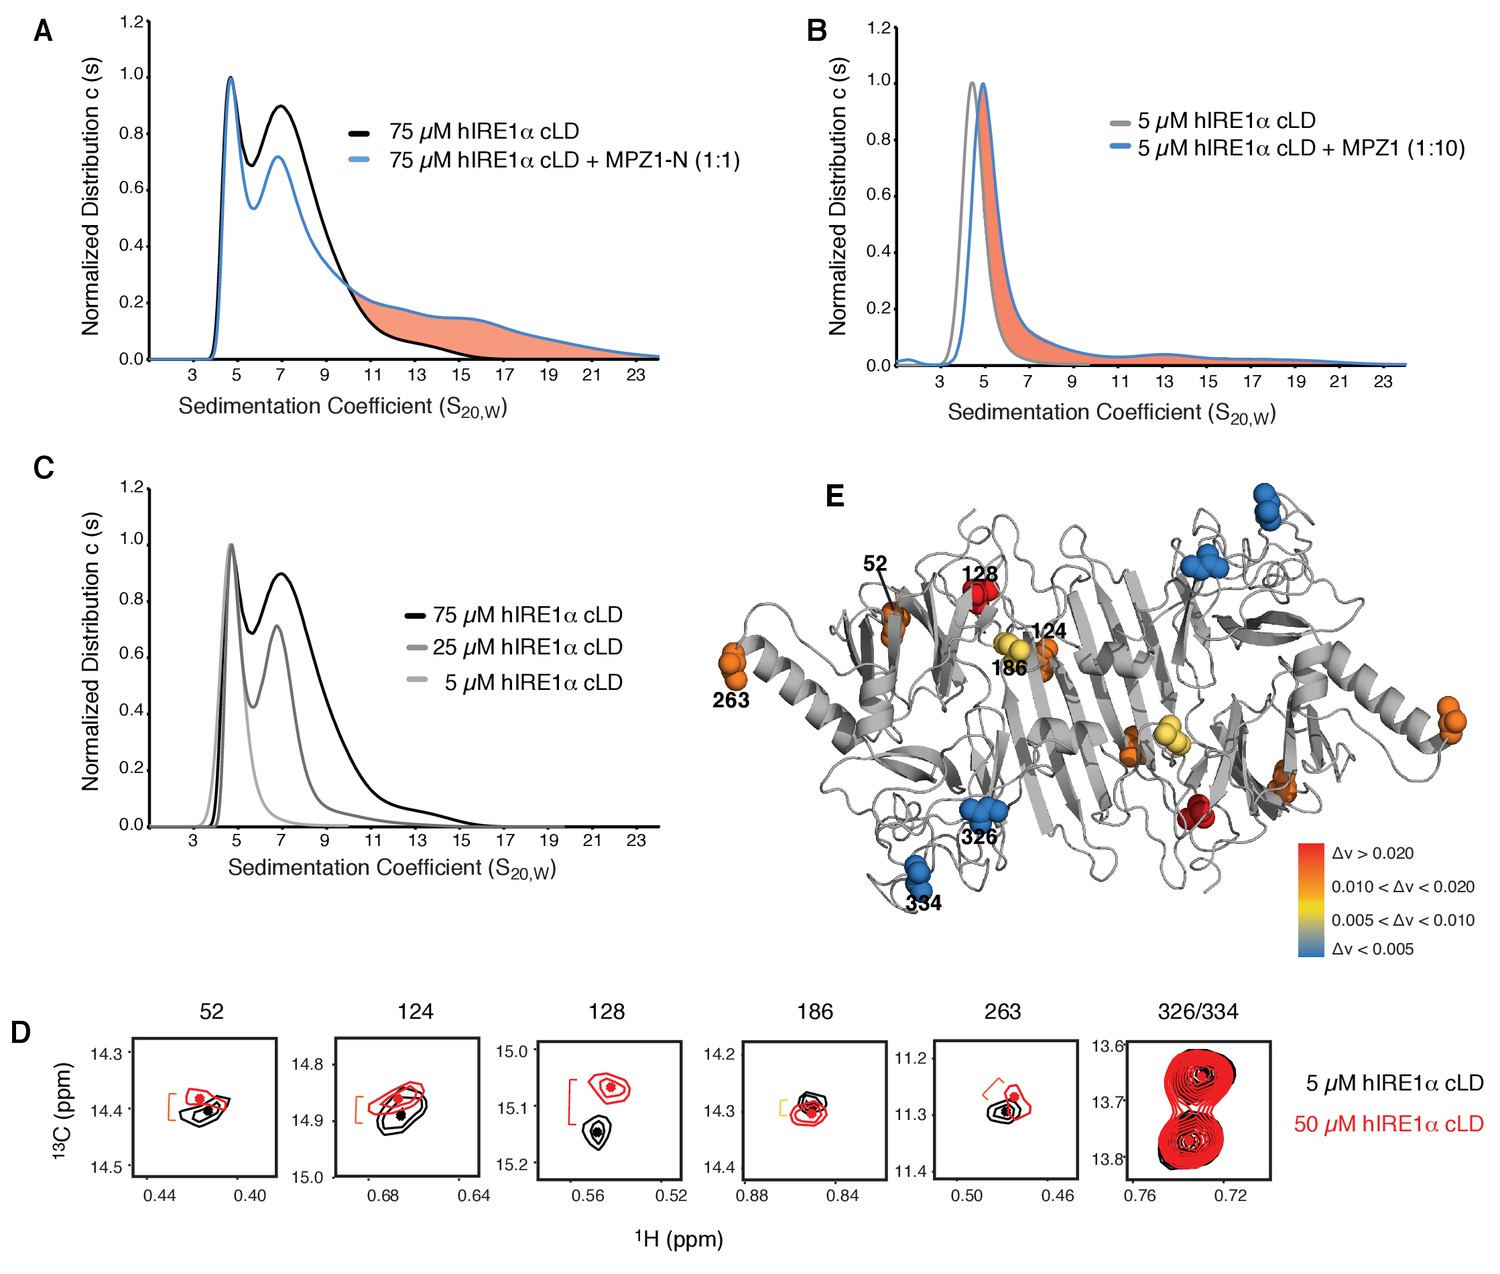
hIRE1α cLD forms dynamic oligomers
(A) AUC sedimentation velocity measurements of hIRE1α cLD alone (75 µM) (gray line) versus hIRE1α cLD with 75 µM MPZ1-N peptide (blue line). Pink region indicates larger hIRE1α cLD oligomers formed upon peptide binding. (B) AUC sedimentation velocity measurements of hIRE1α cLD alone (5 µM) (gray line) versus hIRE1α cLD with 50 µM MPZ1 peptide (blue line), pink region indicates the shift in the AUC profile upon peptide binding. (C) AUC sedimentation velocity measurements of hIRE1α cLD at 5, 25 and 75 µM are shown in different shades of gray. (D) Close-up of isoleucine peaks in the methyl-TROSY spectrum of hIRE1α cLD at 5 µM (black) overlaid with the spectrum of hIRE1α cLD at 50 µM (red). (E) The isoleucine peaks shifting upon oligomerization are mapped into the hIRE1α cLD structure based on the chemical shift perturbation values shown in Figure 6—figure supplement 2C. The red spheres indicate isoleucine peaks that display most significant shifts (Δν > 0.020), orange; moderate shifts Δν > 0.010, and yellow; slight shifts Δν > 0.005. The isoleucine peaks that do not change significantly (Δν < 0.005) are depicted in blue.
Figure 6—figure supplement 1

hIRE1α cLD forms oligomers.
(A) Size exclusion chromatography with increasing concentrations of hIRE1α cLD shows that it elutes in earlier fractions in a concentration dependent manner (500 µM, 250 µM, 125 µM, 62.5 µM of hIRE1α cLD is loaded on the column). The arrows show the expected sizes of the most represented oligomeric species of hIRE1α cLD. (B) Comparison of sedimentation profiles of hIRE1α cLD at 1 and 2.5 (shades of gray) by AUC sedimentation velocity experiments.
Figure 6—figure supplement 2
Oligomerization leads to global conformational changes in hIRE1α cLD.
(A) Methyl-TROSY spectrum of hIRE1α cLD Leu186Ile at 5 µM. (B) Methyl-TROSY spectrum of hIRE1α cLD Leu186Ile at 50 µM. (C) Chemical shift perturbation analysis of isoleucine signals upon oligomerization of hIRE1α cLD (based on the spectra in Figure 6d). The combined chemical shift perturbation of the isoleucines are calculated as Δν = ((0.25ΔνC)2 + (ΔνH)2)1/2. The yellow line indicates Δν > 0.005, orange line Δν > 0.010 and red line Δν > 0.020.
Figure 7 with 4 supplements
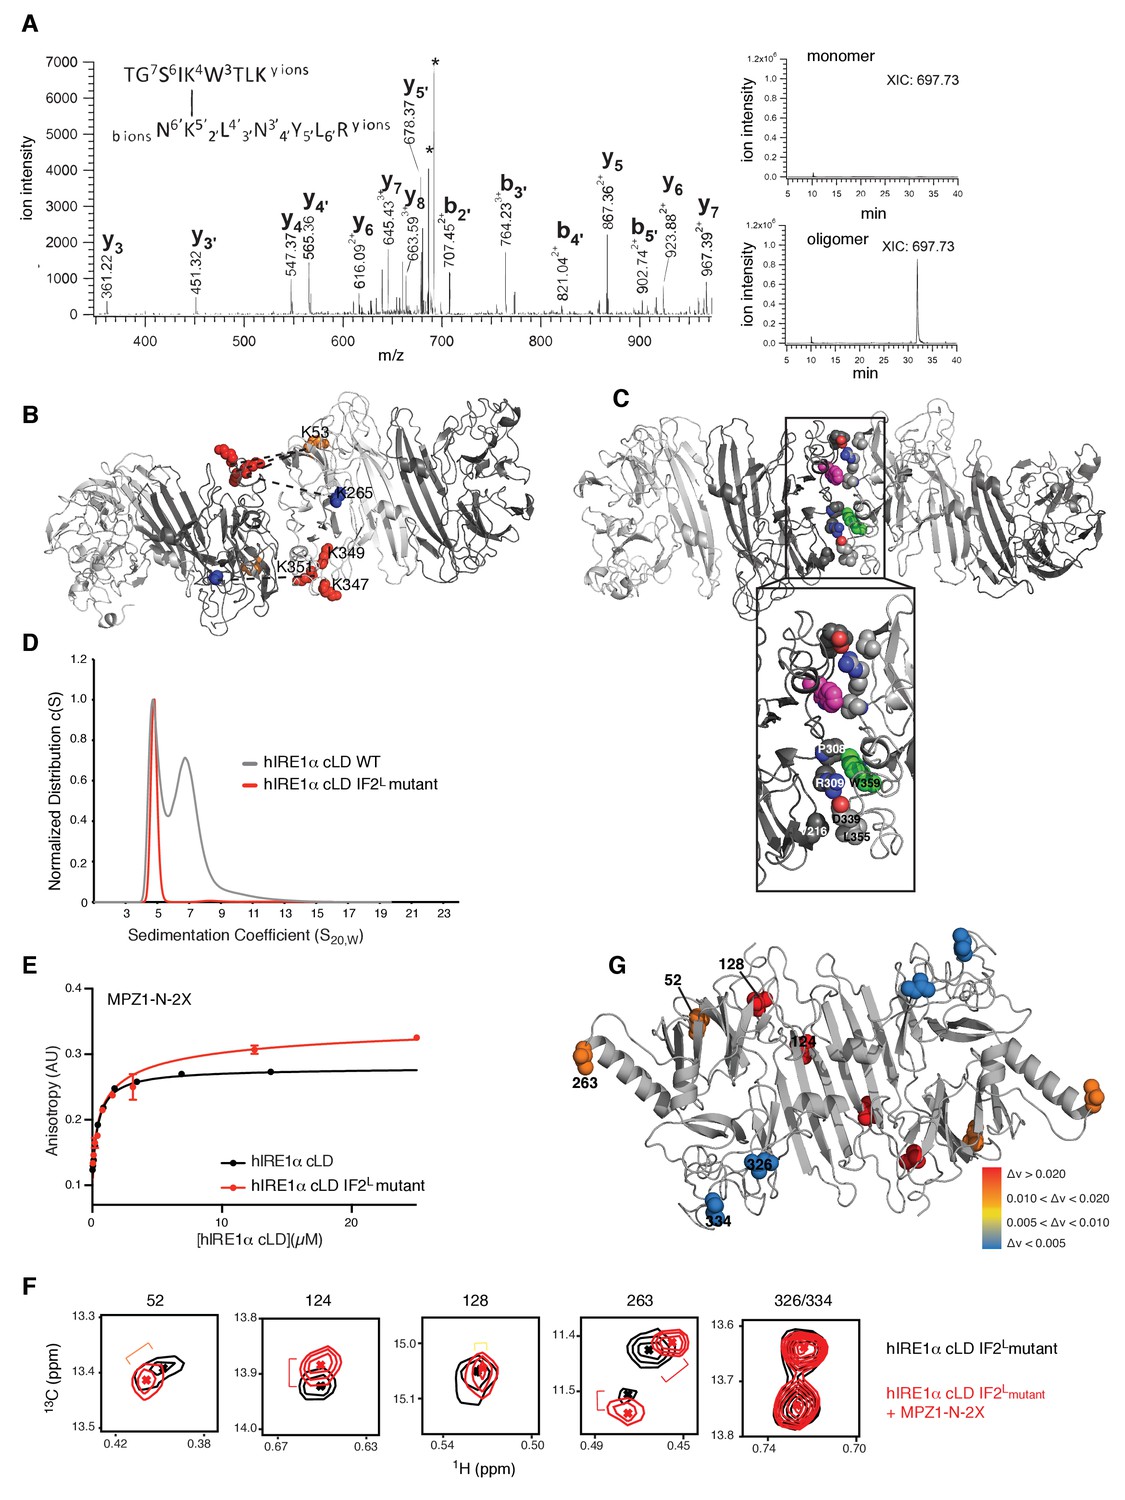
Cross-linking coupled to mass spectrometry identified the oligomerization interface of hIRE1α cLD
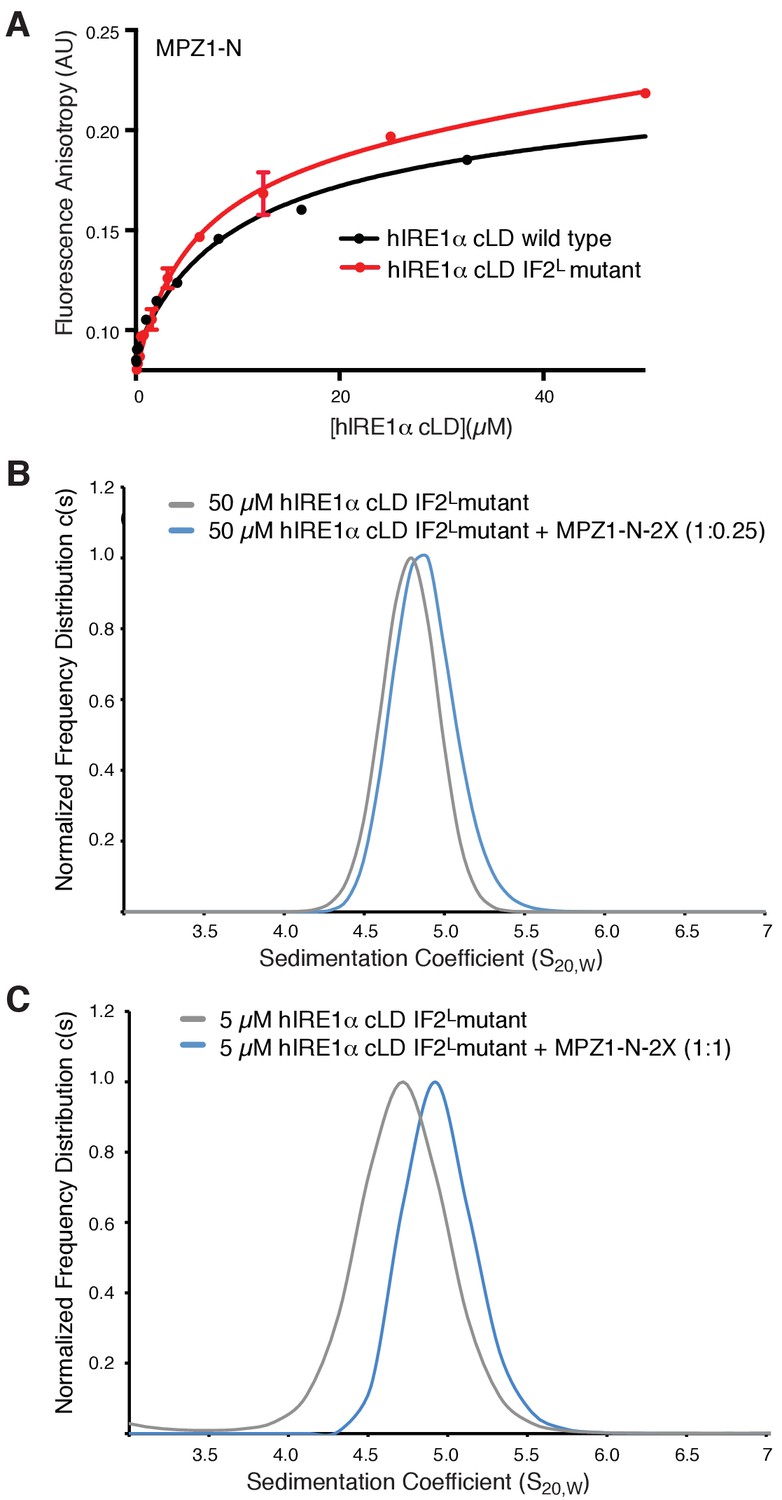
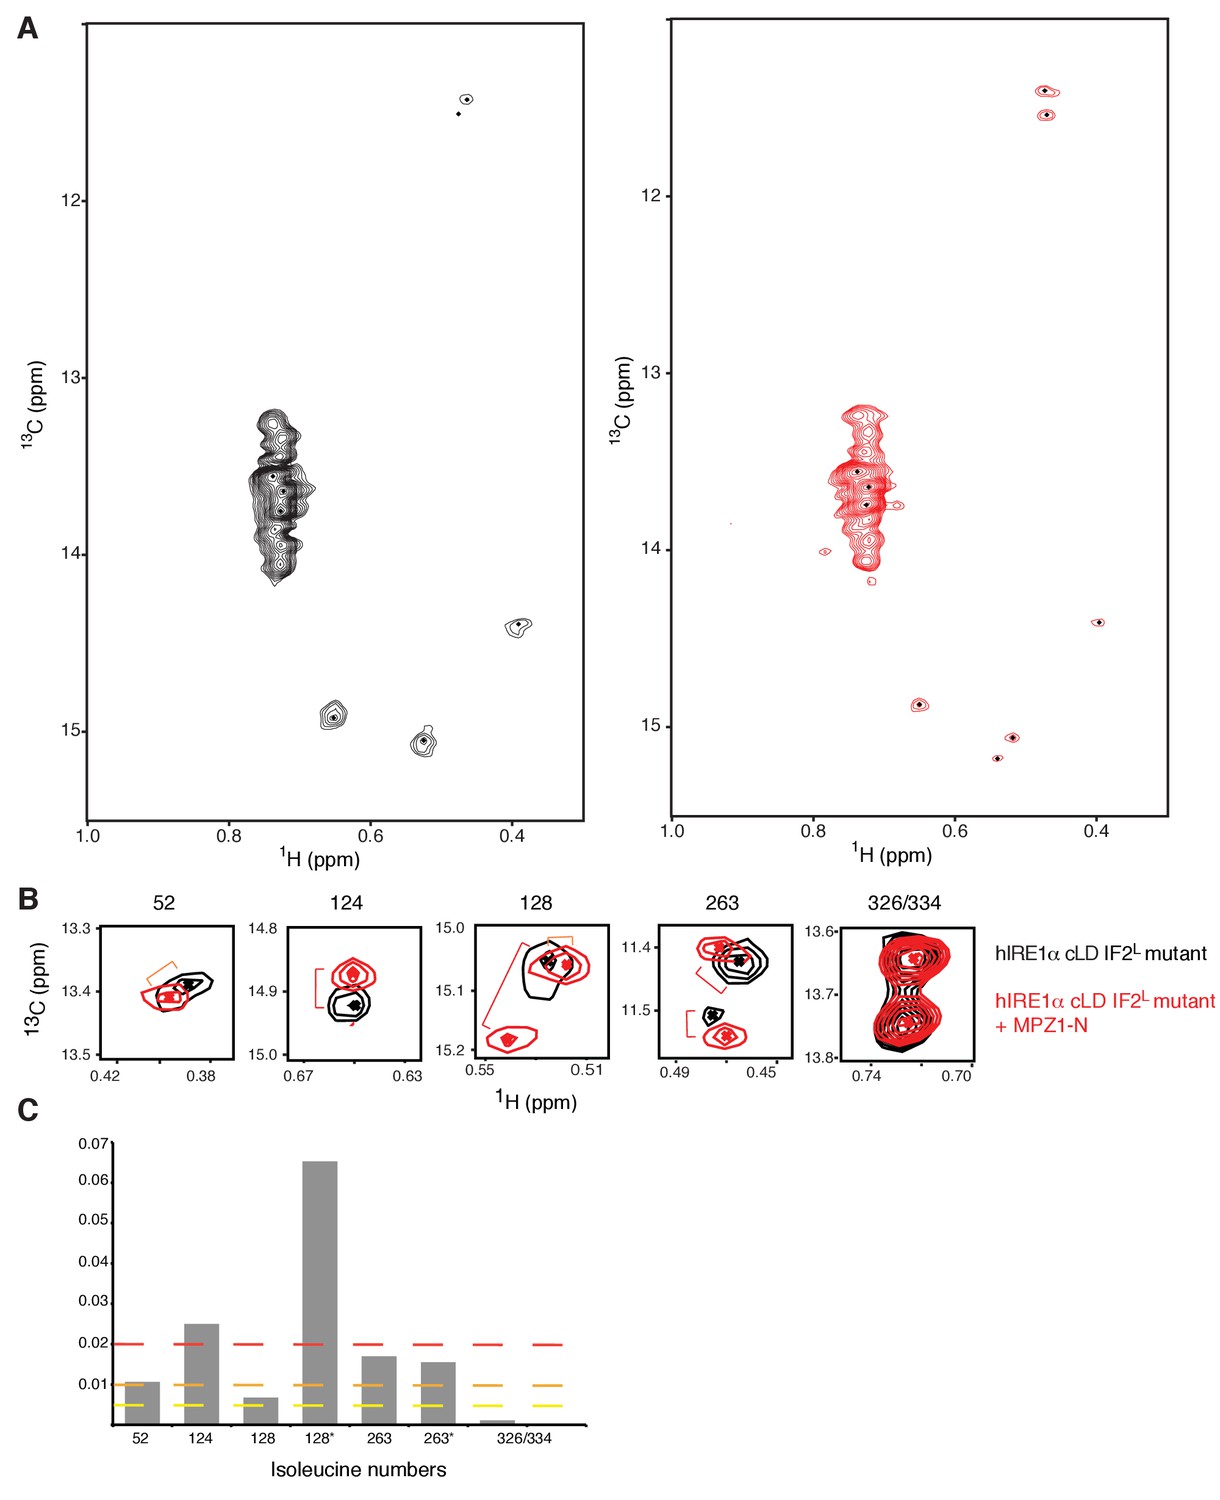
(A) Tandem mass spectrometry (MS) profile of the peptide crosslinked at Lys53 and Lys351. Extracted Ion chromatography (XIC) of the peptide peak in monomeric versus oligomeric hIRE1α cLD shows its absence in cross-linker treated monomer proteins. (B) Mapping cross-link sites on the structural model of hIRE1α cLD by threading on the oligomeric yeast crystal structure. Each monomer is colored as shades of gray. The Lys53, Lys265 are shown as orange and blue spheres, respectively, and Lys347,Lys349, Lys351 are shown as red spheres. The dashed lines indicate the cross-links between the lysines. (C) The amino acids forming the oligomerization interface are shown as spheres and colored by red (indicating oxygens), blue (indicating nitrogens) and white (indicating carbons). The Trp359 that is mutated in the hIRE1α cLD IF2L mutant is colored as green and pink in different protomers. (D) 359WLLI362-GSGS mutation (hIRE1α cLD IF2L mutant) impairs hIRE1α cLD oligomerization determined by AUC sedimentation velocity experiments. Gray line depicts wild type hIRE1 α cLD (25 µM) and red shows the hIRE1α cLD IF2L mutant (50 µM). (E) hIRE1α cLD IF2L mutant binds MPZ1-N-2X peptide (red curve) at similar affinity K 1/2=0.95 ± 0.4 as wild type hIRE1α cLD (black curve)(K1/2 = 0.456 ± 0.7 µM) determined by fluorescence anisotropy measurements. (F) Close-up of isoleucine peaks in the methyl-TROSY spectrum of hIRE1α cLD IF2L mutant alone (black, 50 µM) overlaid with the spectrum of hIRE1α cLD bound to MPZ1-N-2X (upper panel, red, 1:1 molar ratio). (G) The isoleucine peaks shifting upon peptide binding to hIRE1α cLD IF2L mutant are mapped on hIRE1α cLD structural model based on the chemical shift perturbations calculated in Figure 7—figure supplement 4) consistent with the color code in Figure 4E.
Figure 7—figure supplement 1
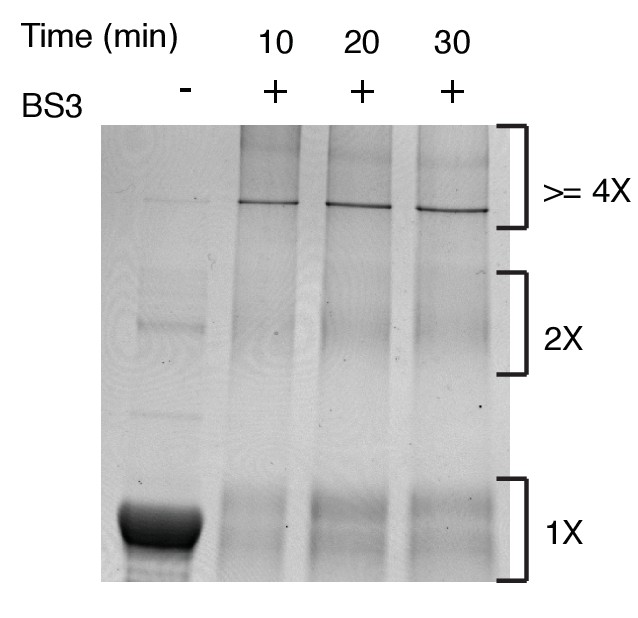
SDS-PAGE analysis of BS3 (1 mM) cross-linked hIRE1α cLD (20 µM).
After incubation with the BS3 cross-linker at the indicated times, the reaction is stopped with addition of Tris-HCl and the proteins are analyzed with the SDS-PAGE after coomassie blue staining.
Figure 7—figure supplement 2

The hydrophobic stretch 359WLLI362 that is mutated in hIRE1α cLD IF2L mutant is shown on the structural model of hIRE1α cLD based on yeast crystal structure.
The mutated amino acids are shown as spheres, where red spheres depict oxygens, blue, nitrogens and pink and green spheres depict carbons in different protomers.
Figure 7—figure supplement 3
hIRE1α cLD IF2L mutant binds peptides.
(A) hIRE1α cLD IF2L mutant binds MPZ1-N peptide (K1/2 = 5.4 ± 1.4 µM) at similar affinity to wild type hIRE1α cLD (K1/2= 16.0 ± 2.6 µM) determined by fluorescence anisotropy measurements. (B) AUC sedimentation velocity measurements of hIRE1α cLD IF2L mutant alone (50 µM) (gray line) versus hIRE1α cLD with 12.5 µM MPZ1-N-2X peptide (blue line). (C) AUC sedimentation velocity measurements of hIRE1α cLD IF2L mutant alone (5 µM) (gray line) versus hIRE1α cLD with 5 µM MPZ1-N-2X peptide (blue line).
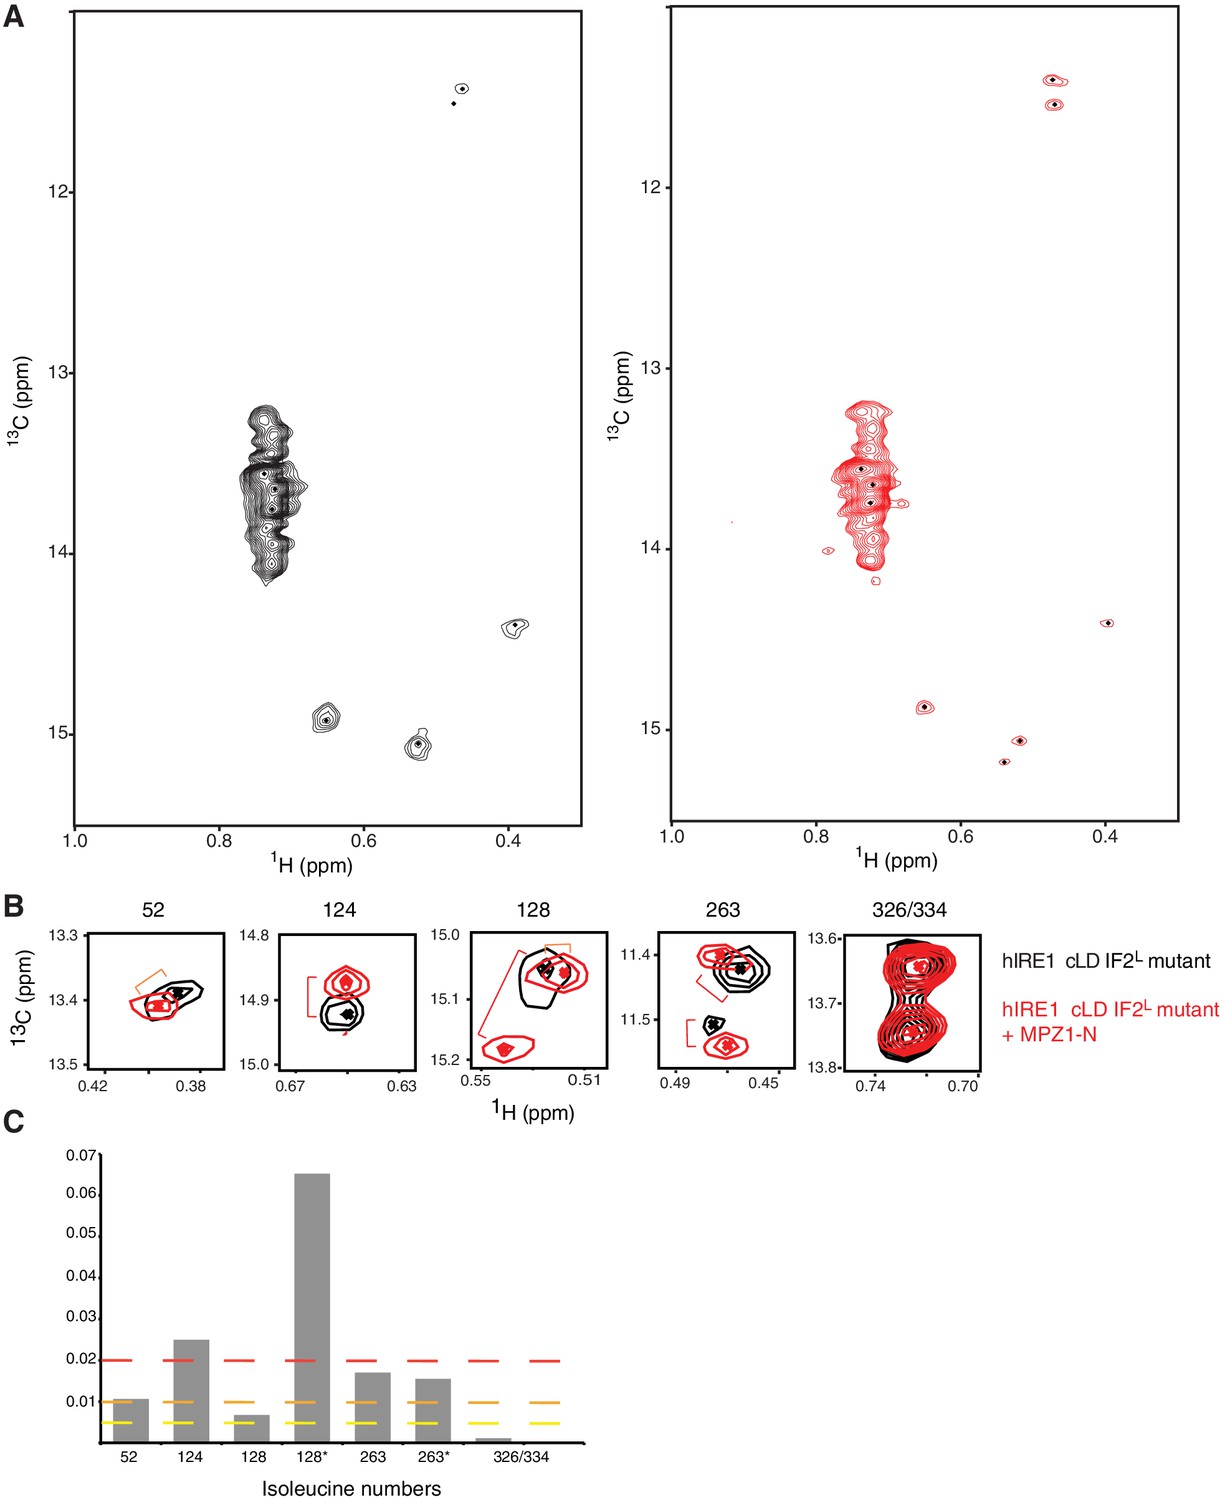
Figure 7—figure supplement 4
Peptide induced allosteric coupling is intact in hIRE1α cLD IF2L mutant.
(A) Methyl-TROSY spectrum of hIRE1α cLD IF2L mutant at 50 µM. (B) Methyl-TROSY spectrum of hIRE1α cLD IF2Lmutant bound to MPZ1-N peptide, at 50 µM (1:1 molar ratio). (C) Chemical shift perturbation analysis of MPZ1-N peptide binding to hIRE1α cLD IF2L mutant. The combined chemical shift perturbations of the isoleucine resonances were calculated as Δv = ((0.25ΔνC)2 + (ΔνH)2)1/2.
Figure 8 with 3 supplements
Lumenal domain driven oligomerization is crucial for IRE1 function
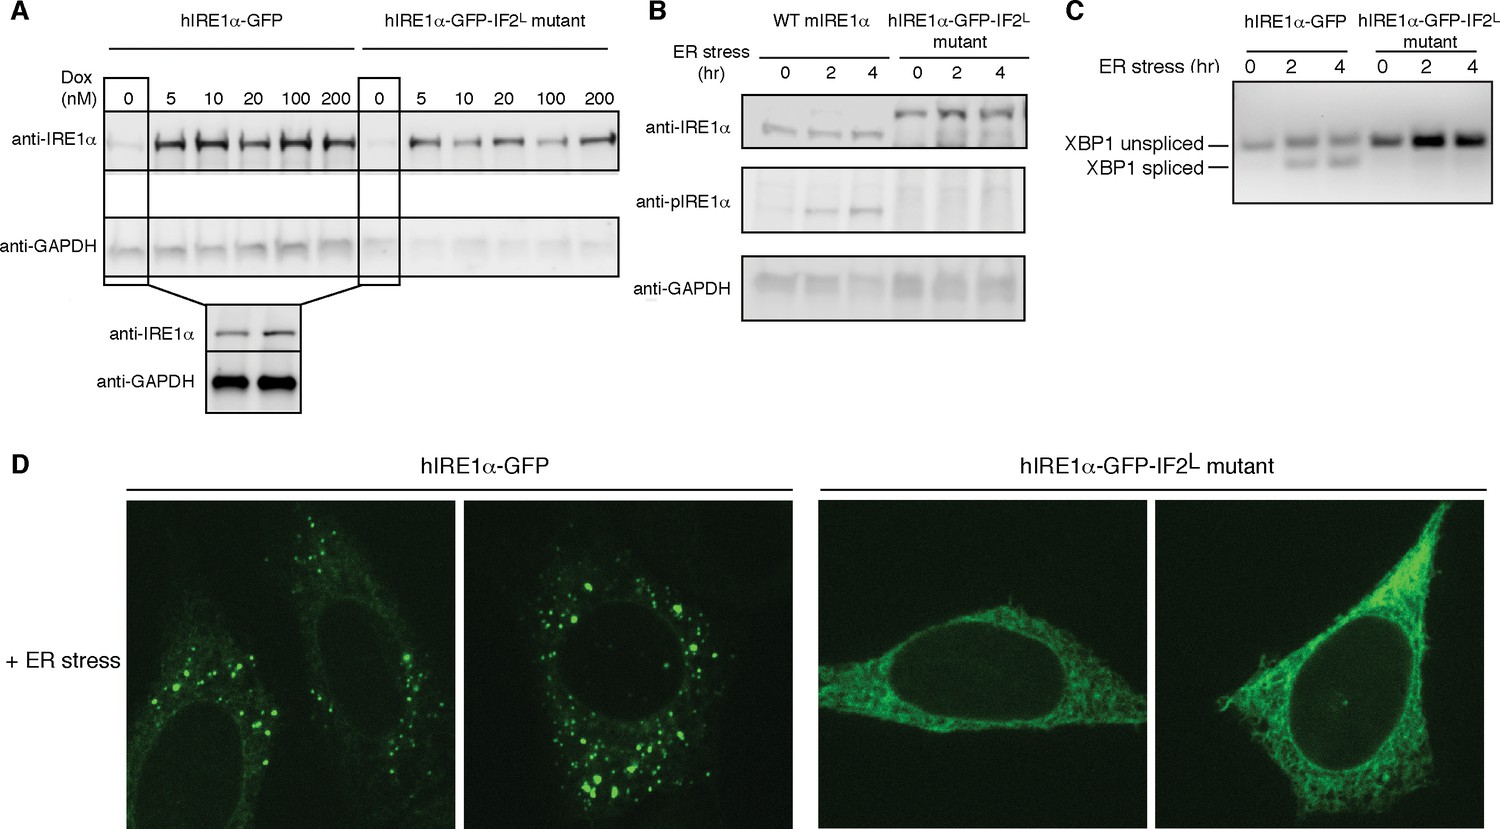
(A) Western blot analyses show the levels of hIRE1α-GFP and hIRE1α-GFP-IF2L mutant proteins stably expressed in IRE1α−/−/IRE1β−/− MEFs in response to various doxycycline concentrations. hIRE1α is detected by anti-IRE1 antibody and GAPDH is probed as the loading control. The lower panel shows Western blot analysis comparing IRE1 levels in hIRE1α-GFP and hIRE1α-GFP-IF2L mutant cell lines in the absence of doxycycline side by side. (B) Western blot analyses of hIRE1α-GFP and hIRE1α-GFP-IF2L mutant reconstituted in IRE1α−/−/IRE1β−/− MEFs and MEFs isolated from wild type mice are probed with anti-IRE1 and anti-phospho-IRE1 antibody. The cells are treated with 5 µg/ml tunicamycin for inducing ER stress. (C) Unlike hIRE1α-GFP, the hIRE1α-GFP-IF2L mutant does not splice XBP1 mRNA after induction of ER stress by the chemical ER stressor tunicamycin (5 µg/ml). XBP1 mRNA splicing is determined by semi quantitative PCR. The spliced and unspliced forms of XBP1 mRNA are indicated. Splicing assays in are conducted in IRE1α−/−/IRE1β−/− MEFs reconstituted with hIRE1α-GFP or the hIRE1α-GFP-IF2L mutant in the absence of doxycycline. (D) Confocal microscopy images of IRE1α−/−/IRE1β−/− MEFs reconstituted with hIRE1α-GFP-IF2L mutant and hIRE1α-GFP after 4 hr of chemically induced ER stress by tunicamycin (5 µg/ml).
Figure 8—figure supplement 1
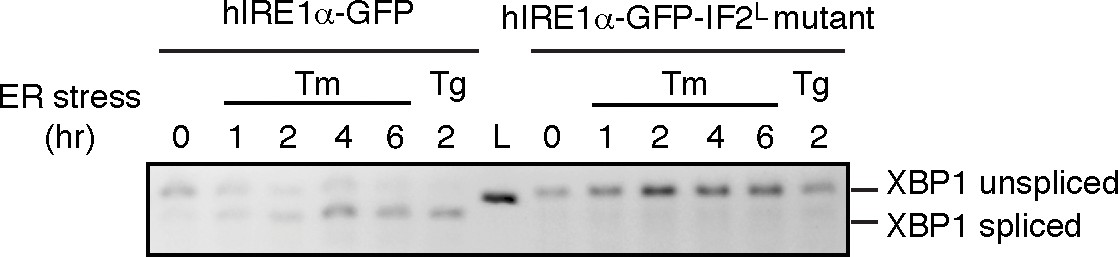
Unlike hIRE1α-GFP, the hIRE1α-GFP-IF2L mutant does not splice XBP1 mRNA after induction of ER stress by tunicamycin (Tm, 5 µg/ml) at various time points and 2 hr after thapsigargin (Tg, 100 nM) treatment.
The spliced and unspliced forms of XBP1 mRNA are indicated. Splicing assays in are conducted in IRE1α−/−/IRE1β−/− MEFs reconstituted with hIRE1α-GFP or the hIRE1α-GFP-IF2L mutant in the absence of doxycycline.
Figure 8—figure supplement 2
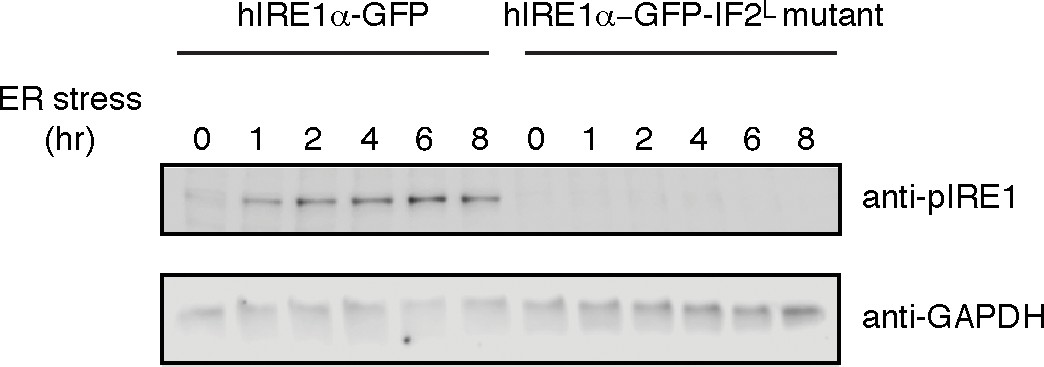
Western blot analyses of cell lysates collected at various times after ER stress induction from IRE1α−/−/IRE1β−/− MEFs reconstituted with hIRE1α-GFP and hIRE1α-GFP-IF2L (‘L’ for lumenal) mutant are probed with anti-phospho IRE1 antibody (upper panel), whereas GAPDH is the loading control (lower panel).
https://doi.org/10.7554/eLife.30700.029
Figure 8—figure supplement 3
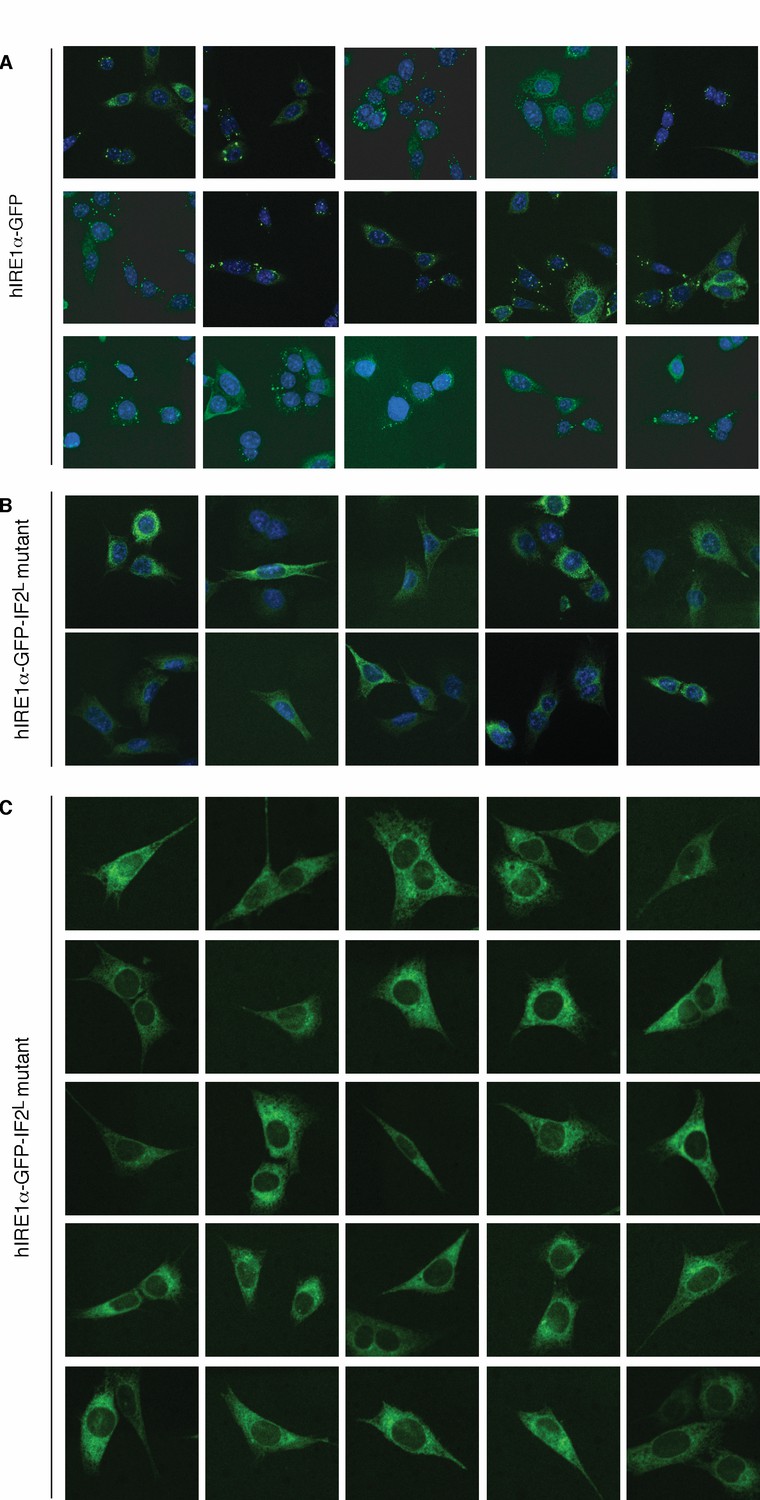
hIRE1α-GFP-IF2L mutant does not form foci.
(A) Confocal microscopy images of IRE1α−/−/IRE1β−/− MEFs reconstituted with hIRE1α-GFP. Around >70% of wild type cells form foci upon ER stress induction (n = 88). The cells are treated for 4 hr by tunicamycin to induce ER stress before fixation and fluorescence imaging of hIRE1α-GFP-IF2L (green) and DNA (blue, DAPI) (B) Confocal microscopy images of IRE1α−/−/IRE1β−/− MEFs reconstituted with hIRE1α-GFP-IF2L mutant. The cells are treated for 4 hr by tunicamycin to induce ER stress before fixation and fluorescence imaging of hIRE1α-GFP-IF2L mutant (green) and DNA (blue, DAPI). (C) Live cell imaging with IRE1α−/−/IRE1β−/− MEFs reconstituted with hIRE1α-GFP-IF2L mutant. Imaging was performed after 4 hr of ER stress induction (between 4–5 hr of ER stress) by tunicamycin.
Figure 9
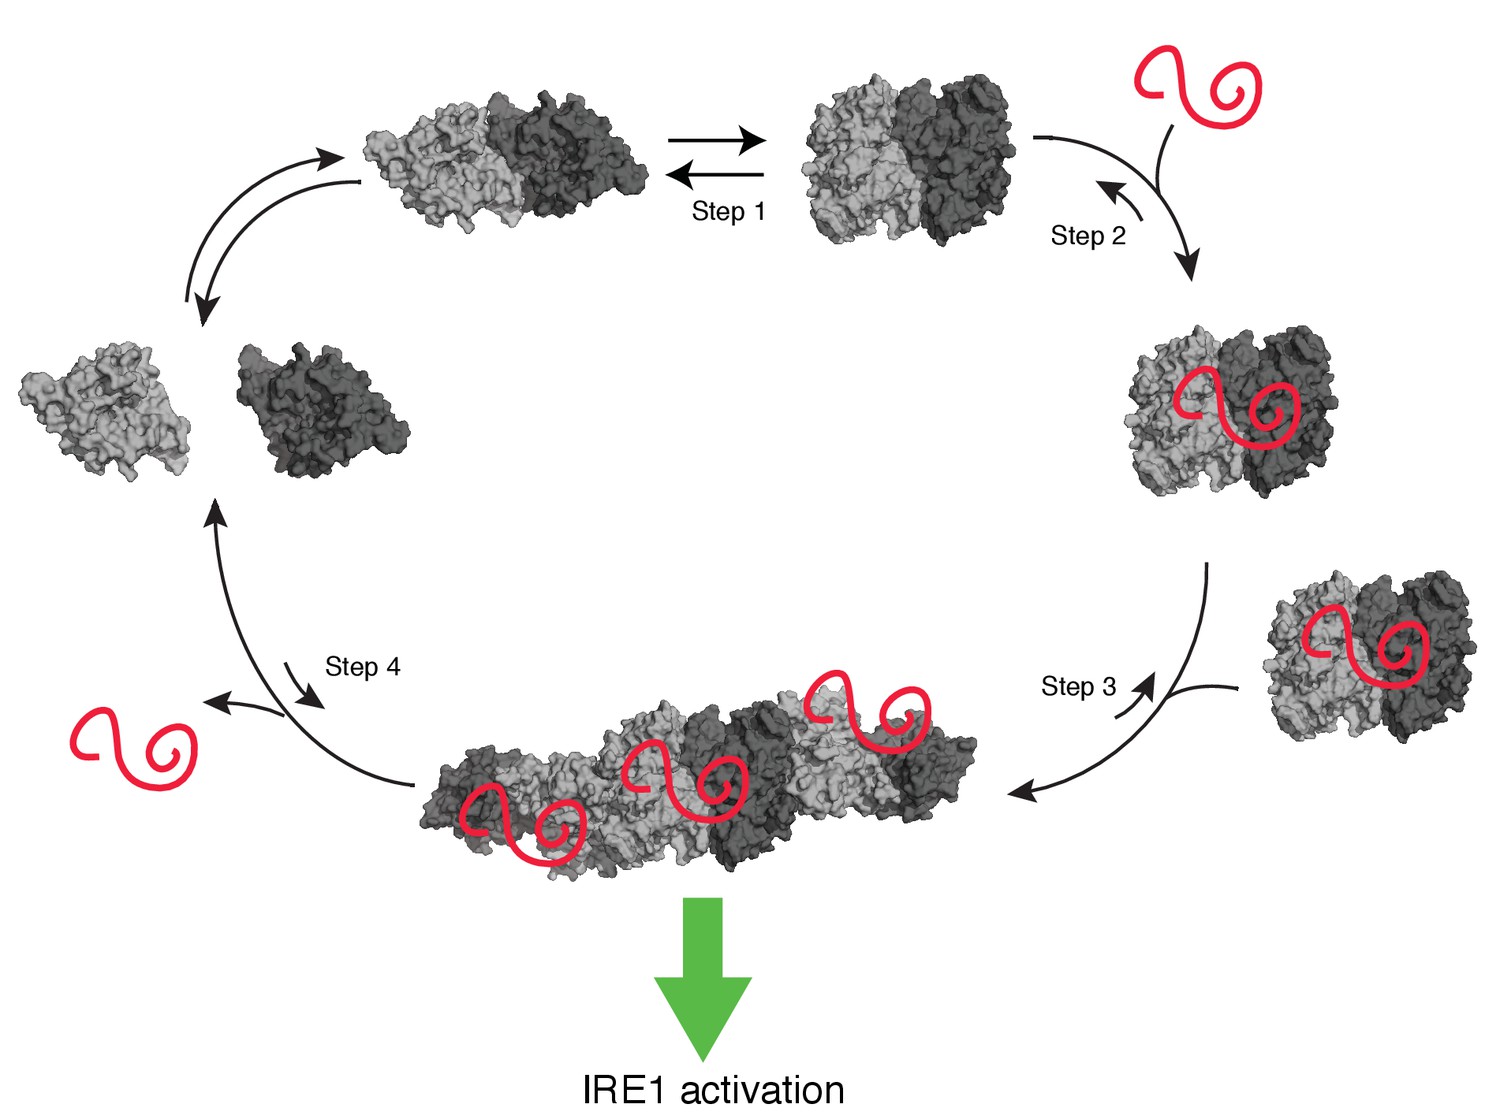
Model of human IRE1 activation
Apo-hIRE1α LD dimers are found in equilibrium between closed and open conformations (Step 1) (note that for simplicity IRE1’s cytoplasmic kinase/RNase domains are not displayed in the model). Upon ER stress, unfolded proteins accumulating in the ER lumen bind hIRE1α LD. Unfolded protein binding stabilizes hIRE1α LD in the open conformation and induces a conformational change in the αB helix and the neighboring structural elements (Steps 2). This conformational change releases the block on oligomerization, thus leading to active hIRE1α oligomers by allowing the formation of an IF2L-like interface in hIRE1α LD (Step 3). Oligomerization driven by hIRE1α LD subsequently activates its kinase and RNase domains. When protein-folding homeostasis is achieved, the dynamic hIRE1α LD oligomers re-adopt the inactive hIRE1α LD conformation (Step 4).
Videos
Video 1
The model displaying the transition of hIRE1α cLD from the ‘closed’ to ‘open’ state.
The crystal structure of hIRE1α cLD is used to represent (pdb: 2hz6) the closed and the hIRE1α cLD structural model based on the yeast crystal structure (pdb: 2be1) represents the open state. The movie is generated using Pymol.
Tables
Table 1
List of cross-linked peptides in hIRE1α cLD detected by mass spectrometry and their relative abundance.
https://doi.org/10.7554/eLife.30700.026| Band number on the SDS-PAGE (with peptides) | Band number on the SDS-PAGE (without peptides) | ||||||||||||||
|---|---|---|---|---|---|---|---|---|---|---|---|---|---|---|---|
| Xlink 1 | Xlink 2 | 5 | 4 | 3 | 2 | 1 (monomer) | Xlink 1 | Xlink 2 | 5 | 4 | 3 | 2 | 1 (monomer) | ||
| K53 | K347 | AVE (%) | 4.1% | 3.2% | 3.7% | 4.9% | 0.0% | K53 | K347 | AVE (%) | 3.3% | 4.3% | 4.4% | 3.4% | 0.0% |
| STDEV(%) | 0.4% | 1.9% | 1.0% | 1.0% | 0.0% | STDEV(%) | 0.3% | 1.9% | 2.1% | 2.5% | 0.0% | ||||
| K53 | K349 | AVE (%) | 1.4% | 1.0% | 1.4% | 1.5% | 0.0% | K53 | K349 | AVE (%) | 1.6% | 1.4% | 1.6% | 1.6% | 0.0% |
| STDEV(%) | 0.2% | 0.4% | 0.3% | 0.8% | 0.0% | STDEV(%) | 0.5% | 0.5% | 0.9% | 0.5% | 0.0% | ||||
| K53 | K351 | AVE (%) | 4.0% | 2.4% | 3.2% | 3.4% | 0.0% | K53 | K351 | AVE (%) | 2.3% | 3.2% | 2.6% | 2.1% | 0.0% |
| STDEV(%) | 1.1% | 2.4% | 0.8% | 0.3% | 0.0% | STDEV(%) | 0.4% | 1.0% | 1.7% | 2.3% | 0.0% | ||||
| K121 | K121 | AVE (%) | 3.7% | 2.9% | 1.5% | 0.8% | 0.0% | K121 | K121 | AVE (%) | 2.6% | 2.1% | 2.1% | 0.3% | 0.0% |
| STDEV(%) | 0.9% | 1.4% | 0.0% | 0.3% | 0.0% | STDEV(%) | 0.2% | 0.8% | 1.5% | 0.1% | 0.0% | ||||
| K351 | K265 | AVE (%) | 1.2% | 0.8% | 1.0% | 0.4% | 0.0% | K351 | K265 | AVE (%) | 0.6% | 0.9% | 0.9% | 0.4% | 0.0% |
| STDEV(%) | 0.1% | 0.6% | 0.5% | 0.3% | 0.0% | STDEV(%) | 0.3% | 0.2% | 0.4% | 0.3% | 0.0% | ||||
| K53 | K265 | AVE (%) | 0.5% | 0.4% | 0.2% | 0.2% | 0.0% | K53 | K265 | AVE (%) | 0.3% | 0.4% | 0.3% | 0.1% | 0.0% |
| STDEV(%) | 0.1% | 0.1% | 0.0% | 0.0% | 0.0% | STDEV(%) | 0.1% | 0.3% | 0.1% | 0.1% | 0.0% | ||||
Additional files
-
Transparent reporting form
- https://doi.org/10.7554/eLife.30700.032
Download links
A two-part list of links to download the article, or parts of the article, in various formats.
Downloads (link to download the article as PDF)
Open citations (links to open the citations from this article in various online reference manager services)
Cite this article (links to download the citations from this article in formats compatible with various reference manager tools)
An unfolded protein-induced conformational switch activates mammalian IRE1
eLife 6:e30700.
https://doi.org/10.7554/eLife.30700


