G9a regulates temporal preimplantation developmental program and lineage segregation in blastocyst
- Wellcome Trust/Cancer Research United Kingdom Gurdon Institute, University of Cambridge, United Kingdom
- University of Cambridge, United Kingdom
- Wellcome Trust/Medical Research Council Stem Cell Institute, University of Cambridge, United Kingdom
Abstract
Early mouse development is regulated and accompanied by dynamic changes in chromatin modifications, including G9a-mediated histone H3 lysine 9 dimethylation (H3K9me2). Previously, we provided insights into its role in post-implantation development (Zylicz et al., 2015). Here we explore the impact of depleting the maternally inherited G9a in oocytes on development shortly after fertilisation. We show that G9a accumulates typically at 4 to 8 cell stage to promote timely repression of a subset of 4 cell stage-specific genes. Loss of maternal inheritance of G9a disrupts the gene regulatory network resulting in developmental delay and destabilisation of inner cell mass lineages by the late blastocyst stage. Our results indicate a vital role of this maternally inherited epigenetic regulator in creating conducive conditions for developmental progression and on cell fate choices.
https://doi.org/10.7554/eLife.33361.001Introduction
The first developmental events in mouse are subject to regulation by information stored in the oocyte. The maternal inheritance in oocytes consists of mRNAs and proteins, which together direct rapid epigenetic reprogramming upon fertilisation, cell cleavage and activation of the zygotic genome (Ancelin et al., 2016; Li et al., 2010; Wasson et al., 2016).
The process of maternal-to-zygotic transition (MZT) in mice is first initiated in the late zygote, becoming more prominent at 2 cell stage (2C) on embryonic day (E) 1.5 (Golbus et al., 1973; Hamatani et al., 2004; Peaston et al., 2004). The initial wave of activation of many genes is followed by their repression within one or two cell cycles (Falco et al., 2007; Hamatani et al., 2004). How multiple genes are faithfully repressed during early embryogenesis to promote developmental progression remains unclear.
Extensive remodelling of the histone modifications and DNA methylation accompany division of blastomeres, which suggests a role for epigenetic regulatory mechanisms during development of the first embryonic lineages (Dahl et al., 2016; Liu et al., 2016; Smith et al., 2012; Wang et al., 2014; Wu et al., 2016; Zhang et al., 2016; Zheng et al., 2016). Outer trophectoderm (TE) cells are the first to be allocated together with the inner cell mass cells (ICM) at the blastocyst stage (E3.5). Shortly afterwards, by E4.0, the ICM segregates into primitive endoderm cells (PrE) and the pluripotent pre-Epiblast cells (Epi), which will give rise to the yolk sac and embryo proper respectively (Chazaud et al., 2006; Schrode et al., 2013).
We extend our previous study on the role of G9a-mediated H3K9me2 in mouse early post-implantation development (Zylicz et al., 2015), and examined the role of this histone methyltransferase during preimplantation development. We show that G9a (encoded by Ehmt2 gene) is maternally inherited and drives the accumulation of H3K9me2 at 4C and 8C stage, which accounts for timely repression of a subset of transcripts expressed at 4C. Severe disruption of the gene regulatory network follows upon maternal loss of G9a, resulting in developmental delay and destabilisation of ICM lineages, and frequent loss of embryos at the peri-implantation stage. Altogether, our results indicate that maternally-inherited G9a is crucial for regulating appropriate gene expression changes during preimplantation development.
Results and discussion
G9a and H3K9me2 accumulate at 4 and 8 cell stage
First, we investigated the H3K9me2 dynamics in early mouse preimplantation development. Immunofluorescence (IF) analysis of 2C (E1.5), 4C (E2.0), 8C (E2.5) and late blastocysts (E4.5) revealed progressive and significant accumulation of H3K9me2 at 4C and 8C stage; this was not the case at 2C or at E4.5 (Figure 1A,B). A more substantial enrichment follows in the epiblast of postimplantation embryos (Zylicz et al., 2015).
Figure 1 with 2 supplements see all

H3K9me2 and G9a accumulate at 4- and 8 cell stage.
(A) Whole-mount IF staining for H3K9me2 (top panels) and G9a (bottom panels) in E1.5, E2.0, E2.5 and E4.5 embryos. DAPI intensity has been adjusted between time points for visualisation purposes (scale bar = 20 μm). IF signal is quantified (B) and visualised using box plots of median and interquartile range (IQR), with whiskers drawn 1.5xIQR away from the lower and upper quartiles. Data shows IF intensity normalised to DAPI for individual cells. At least 9 embryos were quantified for each time point. (*p<0.05 by Wilcoxon rank sum test). 2C: 2 cell stage; 4C: 4 cell stage; 8C: 8 cell stage; DAPI: 4',6-diamidino-2-phenylindole; H3K9me2: histone H3 lysine 9 dimethylation; IF: immunofluorescence; IQR: interquartile range. Also see Figure 1—figure supplements 1 and 2.
The first wave of H3K9 dimethylation is consistent with increased level of G9a at 4C, and more significantly so at 8C stage (Figure 1A,B). What is more, G9a’s binding partner GLP also accumulates in 8C embryos (Figure 1—figure supplement 1). These results, in line with a previous immunofluorescence study (Li et al., 2013), indicate that even low levels of nuclear G9a at 4C stage are sufficient to initiate H3K9 dimethylation. Thus, following the burst of transcription at 2C stage, blastomeres accumulate substantial levels of repressive H3K9me2 mark, although its functional significance remains unclear.
G9a promotes developmental progression and primitive endoderm (PrE) segregation
To determine the role of G9a in preimplantation development, we first induced depletion of the maternal pool of both the Ehmt2 transcript and G9a protein in the oocyte (Figure 1—figure supplement 2). To do so, we used Zp3-Cre-expressing Ehmt2F/- females (Ehmt2F/+ for controls), in which conditional allele is recombined under Cre recombinase expression during oogenesis (de Vries et al., 2000), and crossed them with Ehmt2+/- males. Whereas loss of both maternal and zygotic G9a (Ehmt2M/Z) does not appear to grossly affect early development up to the E2.5 stage, these embryos show slight developmental delay and lack of substantial accumulation of H3K9me2 (Figure 2A,B, Figure 2—figure supplement 1A). Upon further development in vitro, the maternally depleted embryos do form blastocysts (E4.5), however with fewer Pou5f1-positive ICM cells (Figure 2—figure supplement 1B,C).
Figure 2 with 1 supplement see all
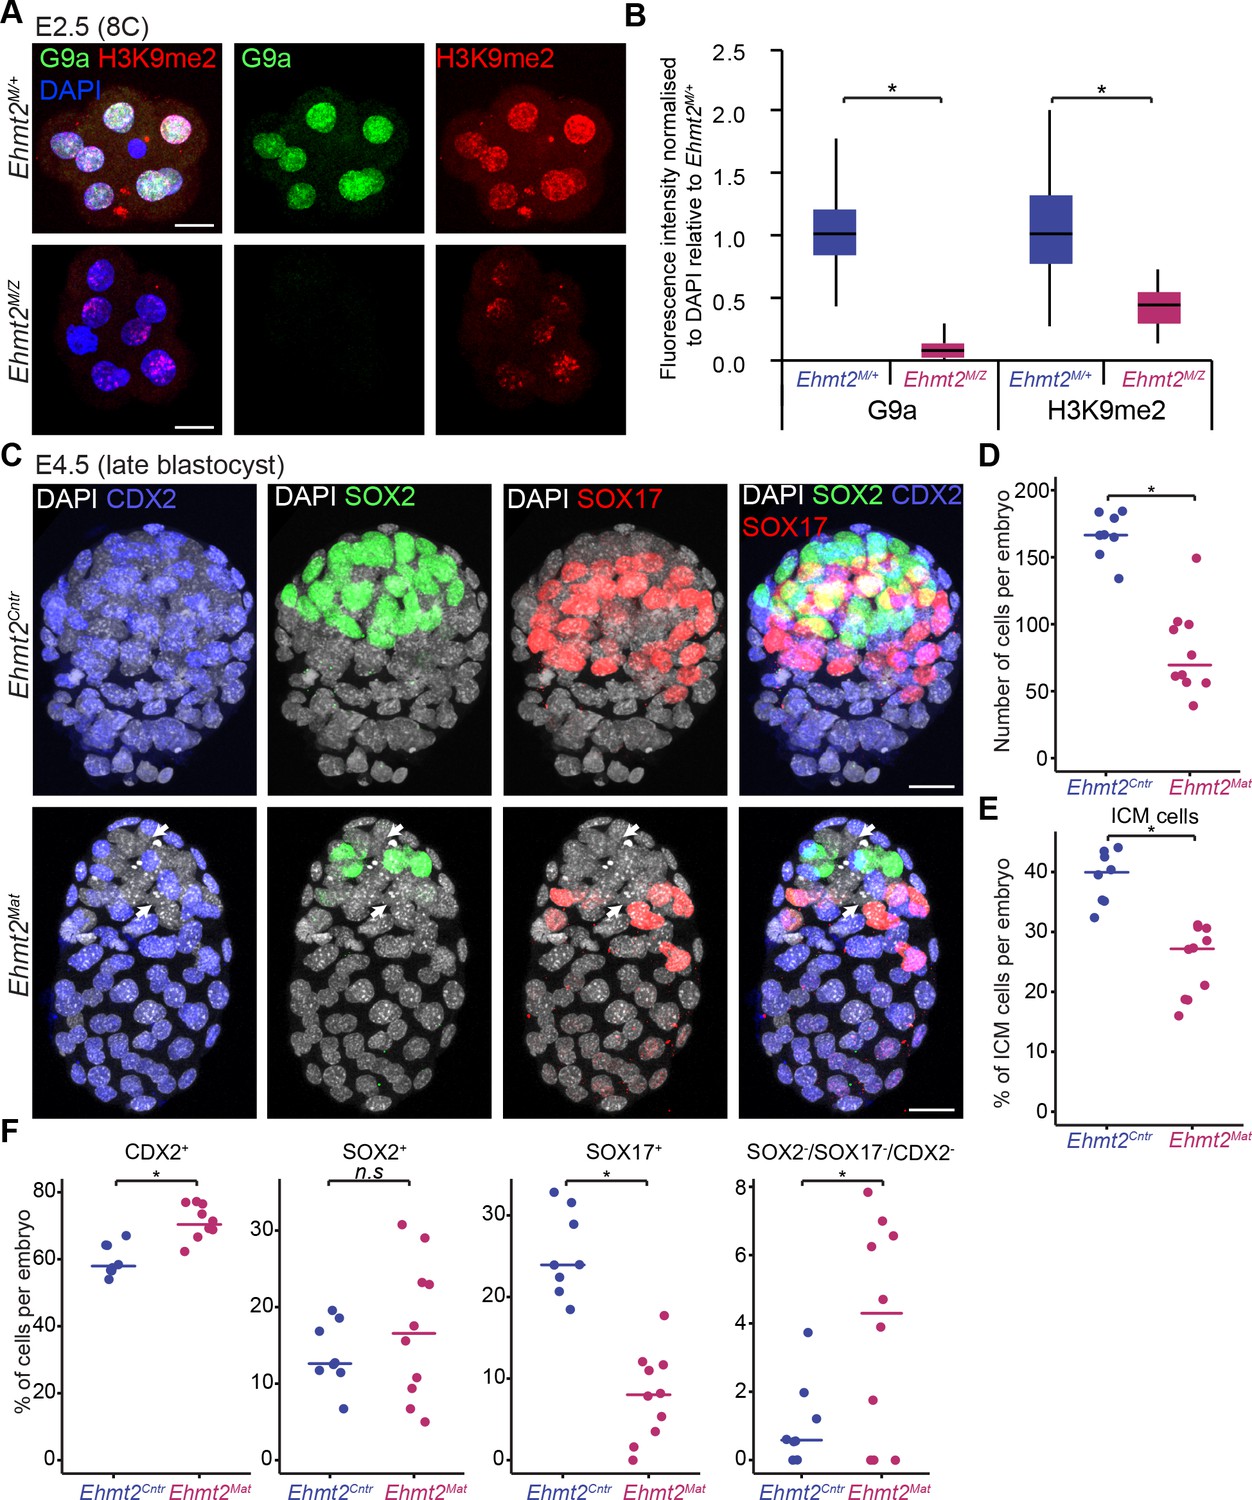
Lack of maternal G9a leads to smaller blastocysts with fewer PrE cells.
(A) Whole-mount IF staining for G9a and H3K9me2 in E2.5 Ehmt2M/Z and Ehmt2M/+ embryos. (Scale bar = 20 μm). (B) IF signal quantification for G9a and H3K9me2 from Figure 2A. Box plots show median and interquartile range (IQR), with whiskers drawn 1.5xIQR away from the lower and upper quartiles. Data shows IF intensity normalised to DAPI. At least six embryos were quantified for each genotype. (*p<0.05 in Wilcoxon rank sum test). (C) Whole-mount IF staining of E4.5 Ehmt2Mat and Ehmt2Cntr blastocysts using anti-CDX2 (TE, Blue), anti-SOX2 (Epi, Green) and anti-SOX17 (PrE, Red) antibodies. White arrows point towards nuclei devoid of staining for any lineage marker. (Scale bar = 20 μm). (D–F) Dot plots showing IF quantification from Figure 2C in relation to embryo genotypes. Each dot represents one embryo, 10 Ehmt2Mat and 8 Ehmt2Cntr embryos were quantified. (D) Total number of cells in an embryo. (E) Percentage of cells within the ICM (SOX2+ or SOX17+). (F) Percentage of cells within each lineage or showing no marker gene expression (SOX2-SOX17-CDX2-). Line shows the median. (*p<0.05 in Wilcoxon rank sum test). CDX2: Caudal Type Homeobox 2; DAPI: 4',6-diamidino-2-phenylindole; Ehmt2Cntr: control embryos with maternally inherited G9a; Ehmt2M/+ embryos maternally depleted but with zygotic expression of G9a; Ehmt2M/Z embryos without both maternal and zygotic expression of G9a; Ehmt2Mat embryos maternally depleted of G9a;Epi: pre-epiblast; H3K9me2: histone H3 lysine 9 dimethylation; ICM: inner cell mass; IF: immunofluorescence; IQR: interquartile range; PrE: primitive endoderm; SOX2: SRY box 2; SOX17: SRY box 17; TE: trophectoderm. Also see Figure 2—figure supplement 1.
Next, we performed a detailed IF analysis of mutant and control embryos recovered at E4.5 for SOX2, SOX17 and CDX2, the critical markers of epiblast (Epi), primitive endoderm (PrE) and trophectoderm (TE), respectively (Figure 2C). We found no significant difference concerning lineage allocation between Ehmt2M/Z and Ehmt2M/+ embryos and thus decided to group them together as maternally depleted embryos (Ehmt2Mat). Similarly, control embryos (Ehmt2Cntr) of different genotypes (e.g. Ehmt2+/- vs Ehmt2-/-, data not shown) also do not reveal detectable phenotypic differences at E4.5. In contrast, Ehmt2Mat compared to Ehmt2Cntr blastocysts show significantly reduced cell numbers (80 vs 166 cells, respectively), and with fewer ICM (SOX2+ve or SOX17+ve) cells (25.0% vs 39.1% respectively) in line with our initial observation (Figure 2D,E, Figure 2—figure supplement 1B,C). We attribute the changes primarily to a relative reduction in PrE cells (7.9% vs 25.3%), as well as to a relative increase in the ICM cells that do not display expression of any of the three lineage markers (Figure 2F).
This observation suggests that maternal loss of G9a results in delayed development and lineage segregation within the ICM. The observed phenotype is however not entirely due to a developmental delay since we also see defects in lineage stabilisation within the ICM, potentially resulting in cell loss. Consistently, when comparing Ehmt2Mat and Ehmt2Cntr blastocysts we observed a significant increase in the levels γH2A.X, a hallmark of genetic stress and misregulation of the cell cycle (Figure 2—figure supplement 1B,C) (Turinetto and Giachino, 2015). Accumulation of γH2A.X also occurs in cells with decondensed chromatin potentially due to loss of H3K9me2 (Banáth et al., 2009). Notably, ‘knockdown’ of GLP, a binding partner of G9a, also results in defects in blastocyst, increased cell death, and loss of cells in the ICM (Huang et al., 2015). Thus, G9a-GLP complex likely promotes developmental progression in vivo, with a timely specification of the PrE and stabilisation of lineage choices. The significant reduction in the number of cells in mutant embryos as well as accumulation of γH2A.X indicate potential misregulation of the cell cycle as we reported in the postimplantation epiblast (Zylicz et al., 2015). Nevertheless, mutant embryos show defects in timely lineage segregation and stabilisation at the blastocyst stage, which indicates that epigenetic programming might create conditions conducive to cell fate choices. Previous studies have similarly indicated that arginine methylation by CARM1 and PRDM14, might also be important for the establishment of the Epi (Burton et al., 2013; Torres-Padilla et al., 2007). We thus hypothesise that maternal G9a is involved in setting up a stable transcriptional and epigenetic network allowing for timely developmental progression and lineage segregation at the blastocyst stage.
G9a represses a subset of 4C upregulated genes
To address the functional relevance of G9a in transcriptional regulation, we focused on the 8C stage (E2.5), when we detect accumulation of the highest levels of G9a and H3K9me2. Loss of maternal G9a at 8C has yet to result in an overt phenotype except for a mild developmental delay. To determine if there are underlying consequences of loss of G9a already at 8C, we performed single-embryo RNA-seq on ten control (Ehmt2Cntr), and ten maternally depleted embryos (Ehmt2Mat), which were morphologically indistinguishable (Figure 3—source data 1). Of note, we observed differential expression of only six genes between Ehmt2M/Z and Ehmt2M/+; we decided therefore to group them together. Maternally depleted G9a embryos however are largely transcriptionally distinct from the controls as shown by principal component analysis (PCA) (Figure 3—figure supplement 1A). The differential expression of 1467 genes accounts for the differences between the two groups, of which 44% become upregulated (Figure 3A, Figure 3—source data 2). Lack of enrichment for derepressed genes upon maternal loss of a transcriptional repressor implies that the transcriptome is affected prior to 8C, by which stage we observe substantial accumulation of secondary transcriptional effects. Interestingly, there were only four genes upregulated in both E2.5 Ehmt2Mat and E6.25 Ehmt2-/- embryos (Zylicz et al., 2015)(Chi2 p>0.77; Figure 3B), indicating that G9a plays a distinct role in pre- and post-implantation development.
Figure 3 with 3 supplements see all
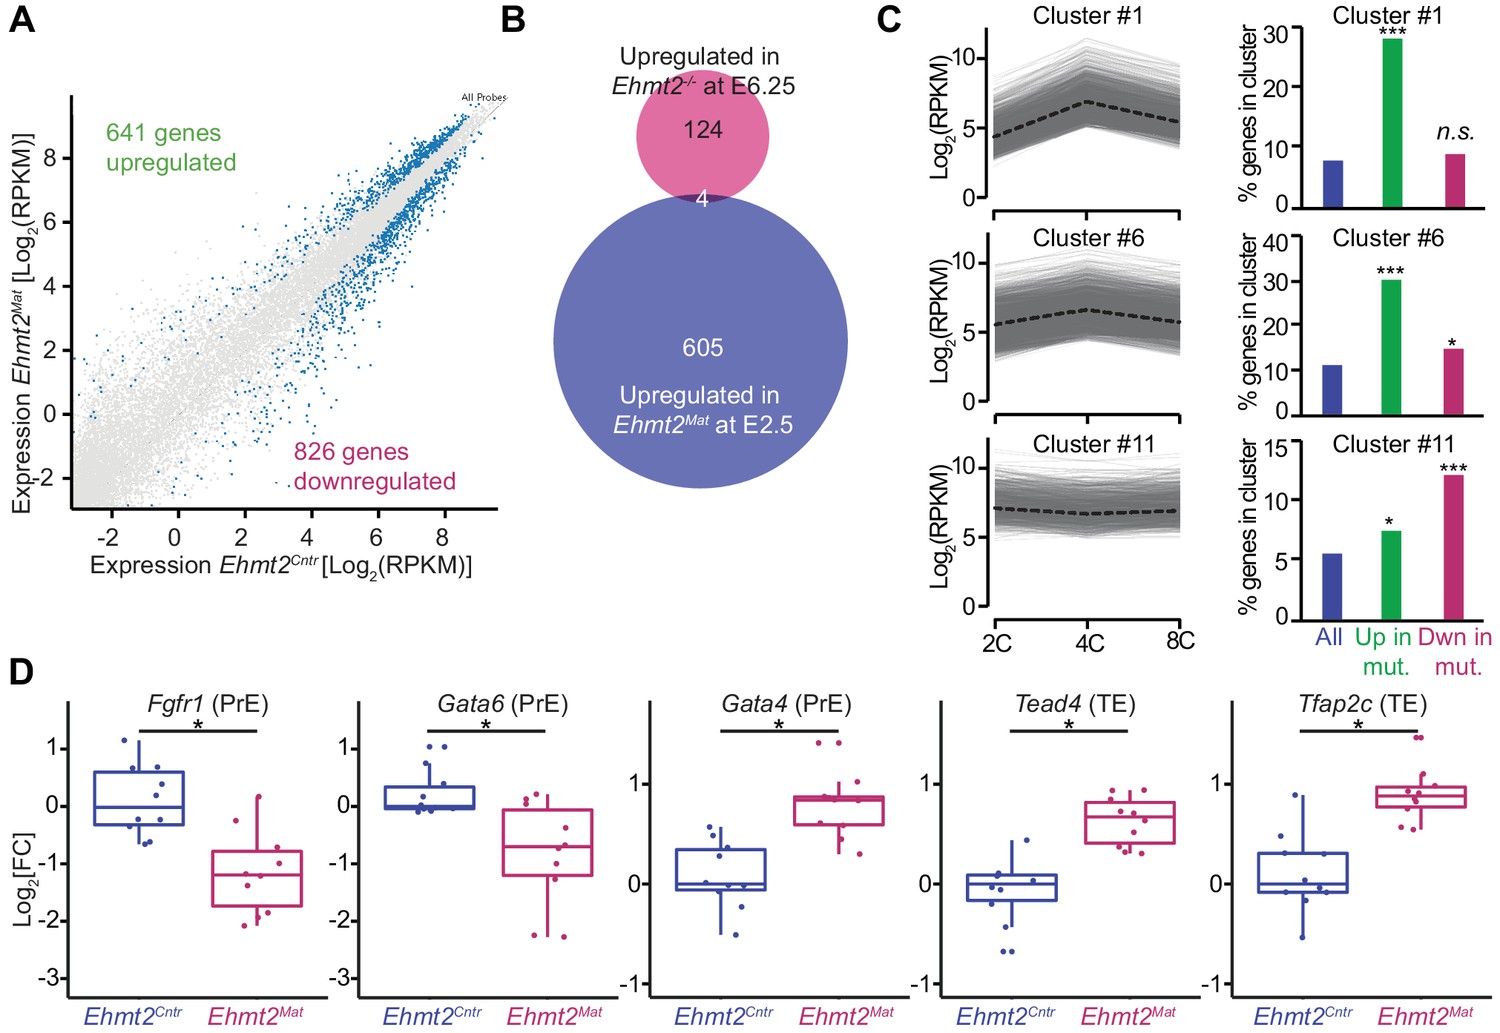
Maternal G9a represses a subset of genes induced at 4 cell stage.
(A) Scatter plot showing transcript expression levels in Ehmt2Cntr and Ehmt2Mat 8C (E2.5) stage embryos. Blue points are differentially expressed genes (adjusted p<0.05 in DEseq2). Shown is the average from ten biological replicates. (B) Venn diagram showing the overlap between upregulated genes upon maternal loss of G9a (Ehmt2Mat) at 8C (E2.5) and those upregulated in zygotic Ehmt2 deletion in E6.25 epiblast (Zylicz et al., 2015). (C) Expression profiles of genes within specific clusters during wildtype development from 2C to 8C (left panels). Dotted line represents mean expression within the cluster. Data from GSE22182 (Tang et al., 2011) was used and within all expressed genes 14 specific clusters were identified. Shown are clusters most enriched for genes becoming derepressed (Clusters 1 and 6) or downregulated (Cluster 11) at 8C in Ehmt2Mat. Right panel of bar plots shows the percentage of genes upregulated (Green) or downregulated (Red) at 8C in Ehmt2Mat, which belong to identified clusters. Significance of enrichments was calculated using Chi2 test (* 10−5 < p < 0.05; ** 10−10 < p < 10−5; ***p<10−10). (D) Fold expression changes of PrE (Fgfr1, Gata6, Gata4) and TE (Tead4, Tfap2c) marker genes in Ehmt2Matcompared to Ehmt2Cntr 8C embryos. Box plots show median and interquartile range (IQR), with whiskers drawn 1.5xIQR away from the lower and upper quartiles. Each dot is a single embryo and data was normalised to median expression levels in Ehmt2Cntr. (*adjusted p<0.05 in DEseq2). 2C: 2 cell embryo, 4C: 4 cell embryo; 8C: 8 cell embryo; Ehmt2Cntr: control embryos with maternally inherited G9a; Ehmt2Mat embryos maternally depleted of G9a; Fgfr1: fibroblast growth factor receptor 1; Gata4: GATA binding protein 4; Gata6: GATA binding protein 6; IQR: interquartile range; Tcfap2c: Transcription factor AP-2 gamma; TE: trophectoderm; Tead4: TEA domain transcription factor 4. Also see Figure 3—figure supplements 1–3 and Figure 3—source data 1–3.
-
Figure 3—source data 1
List of all single-embryo RNAseq samples sequenced.
Shown are numbers of uniquely mapped reads as well as the genotype of each embryo.
- https://doi.org/10.7554/eLife.33361.011
-
Figure 3—source data 2
List of differentially expressed genes between Ehmt2Cntr and Ehmt2Mat at 8C stage embryos.
Differentially expressed genes were identified using DEseq2 with adjusted p-value<0.05.
- https://doi.org/10.7554/eLife.33361.012
-
Figure 3—source data 3
List of enriched GO terms in genes upregulated or downregulated in 8C Ehmt2Mat embryos.
GO term enrichment for biological processes was calculated using DAVID software with minimum five genes in a category and EASE p-value<0.05.
- https://doi.org/10.7554/eLife.33361.013
For further insight into the role of G9a in regulating early development, we performed Gene Ontology (GO) enrichment analysis (Figure 3—source data 3). Consistent with the reduced blastocyst size and loss of ICM cells at E4.5, the GO terms indicated down regulation of genes involved in cell cycle (p<10−8), transcription (p<10−4) and stem cell population maintenance (p<10−4), in Ehmt2Mat 8C embryos (Figure 3—figure supplement 1B). However, the GO term most strikingly enriched was chromatin silencing (p<10−11), which is entirely due to reduced levels of 18 transcripts coding for H2A, MacroH2A and H2A.J (Figure 3—figure supplement 1B,C). Invariably, these histones are already upregulated in a subset of Ehmt2Cntr embryos by E2.5, which is not the case in the mutants (Figure 3—figure supplement 1D,E)(Wu et al., 2014). Thus, despite being morphologically indistinguishable from controls, Ehmt2Mat 8C embryos deviate from them concerning developmental progression. On the other hand, there was high enrichment of genes for GO terms such as rRNA processing (p<10−23) and mRNA processing (p<10−17) indicating that G9a preferentially represses genes linked to RNA metabolism (Figure 3—figure supplement 1F).
To put these results in the context of the developmental progression, we have integrated our results with an independent single-cell RNAseq dataset of wildtype mouse preimplantation embryos (Tang et al., 2011). Firstly, we performed clustering of genes using Gaussian mixture fitting based on their dynamic expression between 2C and 8C stages (Wang et al., 2012). To describe the expression dynamics, we found an optimal number of 14 clusters of genes. Next, we overlapped genes within clusters with those upregulated or downregulated at the 8C stage in Ehmt2Mat embryos (Figure 3C). Strikingly, of the upregulated genes, 28% and 30% were part of cluster 1 and 6, respectively (Chi2 <10−68 and Chi2 <10−48). Genes within those clusters are transiently upregulated at the 4C stage. On the other hand, cluster 11 of stably expressed genes, is most enriched for genes downregulated upon loss of maternal G9a (12% of genes, Chi2 <10−15, Figure 3C). To further validate the specific derepression of 4C genes in mutants, we have also analysed gene expression changes between 2C and 4C, as well as 4C and 8C stages in wildtype embryos (Figure 3—figure supplement 2A). Our analysis revealed that genes upregulated in Ehmt2Mat 8C embryos (green box), show a significant increase in expression at 4C stage, which are silenced later in wildtype embryos. Our findings indicate that during preimplantation development, G9a mediates silencing of a specific set of genes, which are transiently upregulated at 4C stages. Whereas there is significant accumulation of H3K9me2 globally as judged by IF analysis at the 4C stage (Figure 1A,B), the precise distribution of the mark within the genome cannot be ascertained by this observation. We propose that it is only at the 8C stage that the increasing levels of G9a levels allow H3K9me2 deposition at the 4C-specific genes.
Next, to explore the roots of lineage destabilisation in maternally depleted embryos, we focused on the misexpression of transcriptional factors (TFs) in our RNAseq dataset (n = 71) (Figure 3—figure supplement 2B). Consistent with fewer PrE and more TE cells, there was a reduction in the levels of PrE specifiers (Gata6, Fgfr1), and an increase in the expression of TE markers (Tead4, Tcfap2c) in maternally deleted mutants compared to controls (Figure 3D). Intriguingly, expression of Gata4, normally seen in late blastocysts, already shows upregulation in mutant embryos (Plusa et al., 2008) (Figure 3D). These results indicate that maternal loss of G9a results in destabilisation of specific gene regulatory networks involved in pre-implantation development. Efficient setting up of such transcriptional circuitry as early as the 8C stage seems necessary for subsequent timely lineage segregation. However, it remains unclear which subset of the differentially expressed genes directly results in PrE defects. Indeed, this might be linked to increased expression of a critical trophectoderm specifier Tead4 (Yagi et al., 2007), or downregulation of vital PrE regulators Fgfr1 (Kang et al., 2017; Molotkov et al., 2017) and Gata6 (Schrode et al., 2014). Alternatively, ICM cells might show increased sensitivity to the deregulation of such processes as RNA metabolism and cell cycle. Importantly, derepression of transposable elements (TE) might also result in increased DNA damage and cell death (Ancelin et al., 2016).
To address the latter hypothesis, we performed differential TE expression analysis on our RNA-seq dataset. Of particular interest are murine endogenous retrovirus-like elements (MuERV-L), which were shown to be derepressed upon loss of G9a in embryonic stem cells (ESCs)(Maksakova et al., 2013). This class of TEs is transiently expressed at the 2C stage (Kigami et al., 2003; Macfarlan et al., 2012; Peaston et al., 2004) and regulates zygotic genome activation, transcriptional networks and developmenal progression (Huang et al., 2017; Kigami et al., 2003). Our TE analysis of mutant embryos however revealed only a very mild reactivation of the ERV-L family of TEs, which contains MuERV-L (Figure 3—figure supplement 3). Thus, G9a is dispensible for timely repression of these retrotransposons. We have however observed persistent H3K9me2 staning at DAPI-dense foci in Ehmt2M/Z at the 8C stage (Figure 2A), suggesting that another histone methyltransferase is likely to deposit silent chromatin marks at repetetive elements in the absence of G9a. Indeed, a recent study suggests that a loss of SETDB1, an H3K9 methyltransferase, results in upregulation of both ERV and LINE1 elements in oocytes (Kim et al., 2016).
In conclusion, the role of G9a during preimplantation development is distinct from that observed during postimplantation development. Notably, G9a is required for the repression of a specific set of transiently upregulated 4C genes in preimplantation embryos. Moreover, maternal G9a allows for the appropriate setting of transcriptional circuits, which promote developmental progression, timely PrE specification and stabilisation of ICM lineages. Together with PRDM14 and arginine methylation reported previously (Burton et al., 2013; Torres-Padilla et al., 2007), our findings suggest that the earliest epigenetic programming events at the onset of development are involved in creating a competent environment for cell fate choices that ensue. These epigenetic regulators, amongst others, ensure establishment of stable transcriptional circuitry, which instructs lineage segregation later in development.
Materials and methods
Key resources table
| Reagent type (species) or resource | Designation | Source or reference |
|---|---|---|
| Strain (mouse) | Ehmt2Flox/Flox | PMID:17707231 |
| Strain (mouse) | Zp3-Cre | PMID: 10686600 |
GO term enrichment analysis were performed exactly as in (Zylicz et al., 2015).
Mouse breading, embryo collection
Request a detailed protocolTimed natural matings were used for all experiments unless otherwise stated. Noon of the day when the vaginal plugs of mated females were identified was scored as E0.5. For Ehmt2 matings a published conditional allele was used (Sampath et al., 2007). To obtain Ehmt2Cntr or Ehmt2Mat embryos, Ehmt2F/+ Zp3-Cre+ve or Ehmt2F/- Zp3-Cre+ve females were used respectively (de Vries et al., 2000). When stated a ΔPE-Pou5f1-EGFP reporter line was crossed in (GGOF) (Yeom et al., 1996). All husbandry and experiments involving mice were carried out according to the local ethics committee and were performed in a facility designated by the Home Office.
Immunofluorescence
Request a detailed protocolEmbryos were treated as previously described (Nichols and Smith, 2009). Primary antibodies used are as follows: anti-CDX2 (Biogenex, clone CDX2-88), anti-H3K9me2 (Abcam, UK, ab1220), anti-GFP (Nacalai tesque, Japan, GF090R), anti-G9a (Cell Signaling, MA, 68851T), anti-GLP (Research and Diagnostic Systems, MN, PP-B0422-00), anti-SOX2 (Abcam, UK, ab92494), anti-SOX17(Research and Diagnostic Systems, MN, AF1924). Mean nuclear intensities of IF and DAPI signal were quantified using mageJ and corrected for the staining background. As nuclear size is changing between stages all IF measurements were normalised to DAPI signal as a proxy for DNA content.
Single-Embryo RNAseq
Request a detailed protocolThe embryos used were from natural matings and were morphologically assessed to ensure only viable samples were collected. cDNA was prepared and amplified as earlier described (Tang et al., 2010). Illumina libraries were prepared as published (Huang et al., 2017). Single-end 50 bp sequencing was performed with HiSeq4000 (Illumina, San Diego, CA). RNA-seq reads were adapter- and quality-trimmed, and aligned with Tophat2 (Kim et al., 2013) against the mouse reference (GRCm38/mm10) genome. Read counts per ENSEMBL transcript were obtained by SeqMonk. Differential expression was evaluated with the DESeq2 package (Love et al., 2014). Gene was deemed differentially expressed when p-value<0.05 after Benjamini and Hochberg correction. For clustering the dynamics of gene expression in distinct environments we have used an R package GeneClusterNet based on Gaussian mixture fitting (Wang et al., 2012). For this analysis data was downloaded from GEO (GSE22182) (Tang et al., 2011). Optimal numbers of clusters (14) was identified by finding minimal Bayesian Information Criterion. For TE analysis, RNA-seq reads were aligned with bowtie (options: ‘-m 1 – v1 --best --strata’) selecting for uniquely mapping reads only. RepeatMasker annotations of individual TE elements were downloaded from the UCSC Table Browser. Read counts per TE elements were obtained by featureCounts (http://bioinf.wehi.edu.au/featureCounts). Data is available under GSE106790.
Data availability
Sequencing data have been deposited in GEO under accession codes GSE106790.
-
G9a regulates temporal preimplantation developmental program and lineage segregation in blastocystPublicly available at the NCBI Gene Expression Omnibus (accession no: GSE106790).
-
Global Deterministic and Stochastic Allelic Specific Gene Expression in Single Blastomeres of Mouse Early EmbryosPublicly available at the NCBI Gene Expression Omnibus (accession no: GSE22182).
-
The landscape of accessible chromatin in mammalian pre-implantation embryos (RNA-Seq)Publicly available at the NCBI Gene Expression Omnibus (accession no: GSE66582).
References
-
The effects of inhibitors of RNA synthesis (alpha-amanitin and actinomycin D) on preimplantation mouse embryogenesisJournal of Experimental Zoology 186:207–216.https://doi.org/10.1002/jez.1401860211
-
Involvement of G9A-like protein (GLP) in the development of mouse preimplantation embryos in vitroReproduction, fertility, and development.https://doi.org/10.1071/RD14341
-
MuERV-L is one of the earliest transcribed genes in mouse one-cell embryosBiology of Reproduction 68:651–654.https://doi.org/10.1095/biolreprod.102.007906
-
G9a co-localized with histone H3 lysine 9 monomethylation but not dimethylation in a nuclear membrane-dependent manner during mouse preimplantation embryo developmentJournal of Assisted Reproduction and Genetics 30:441–448.https://doi.org/10.1007/s10815-012-9911-y
-
Maternal control of early mouse developmentDevelopment 137:859–870.https://doi.org/10.1242/dev.039487
-
Naive and primed pluripotent statesCell Stem Cell 4:487–492.https://doi.org/10.1016/j.stem.2009.05.015
-
How to cluster gene expression dynamics in response to environmental signalsBriefings in Bioinformatics 13:162–174.https://doi.org/10.1093/bib/bbr032
-
Localization and expression of histone H2A variants during mouse oogenesis and preimplantation embryo developmentGenetics and Molecular Research 13:5929–5939.https://doi.org/10.4238/2014.August.7.8
-
Germline regulatory element of Oct-4 specific for the totipotent cycle of embryonal cellsDevelopment 122:881–894.
Article and author information
Author details
Funding
Wellcome (096738)
- Jan J Zylicz
- Maud Borensztein
- Yun Huang
- Caroline Lee
- Sabine Dietmann
- M Azim Surani
Wellcome (RG44593)
- Jan J Zylicz
H2020 Marie Skłodowska-Curie Actions (706144)
- Maud Borensztein
Cancer Research UK (C6946/A14492)
- Jan J Zylicz
- Maud Borensztein
- Yun Huang
- Caroline Lee
- Sabine Dietmann
- M Azim Surani
James Baird Fund, University of Cambridge
- Yun Huang
Wellcome (092096)
- Jan J Zylicz
- Maud Borensztein
- Yun Huang
- Caroline Lee
- Sabine Dietmann
- M Azim Surani
The funders had no role in study design, data collection and interpretation, or the decision to submit the work for publication.
Acknowledgements
We are grateful to Alexander Tarakhovsky and Dónal O'Carroll for sharing G9a conditional knockout mice. We thank Dang Vinh Do for critical input into the project and members of the Surani Lab for helpful discussions.
Ethics
Animal experimentation: Animal experimentation: All husbandry and experiments involving mice were authorised by a UK Home Office Project Licenses 80/2637 and PE596D1FE and carried out in a Home Office-designated facility.
Version history
- Received: November 14, 2017
- Accepted: May 9, 2018
- Accepted Manuscript published: May 10, 2018 (version 1)
- Version of Record published: May 18, 2018 (version 2)
Copyright
© 2018, Zylicz et al.
This article is distributed under the terms of the Creative Commons Attribution License, which permits unrestricted use and redistribution provided that the original author and source are credited.
Metrics
-
- 2,368
- views
-
- 410
- downloads
-
- 26
- citations
Views, downloads and citations are aggregated across all versions of this paper published by eLife.
Download links
A two-part list of links to download the article, or parts of the article, in various formats.
Downloads (link to download the article as PDF)
Open citations (links to open the citations from this article in various online reference manager services)
Cite this article (links to download the citations from this article in formats compatible with various reference manager tools)
G9a regulates temporal preimplantation developmental program and lineage segregation in blastocyst
eLife 7:e33361.
https://doi.org/10.7554/eLife.33361
Further reading
-
- Chromosomes and Gene Expression
- Immunology and Inflammation
Ikaros is a transcriptional factor required for conventional T cell development, differentiation, and anergy. While the related factors Helios and Eos have defined roles in regulatory T cells (Treg), a role for Ikaros has not been established. To determine the function of Ikaros in the Treg lineage, we generated mice with Treg-specific deletion of the Ikaros gene (Ikzf1). We find that Ikaros cooperates with Foxp3 to establish a major portion of the Treg epigenome and transcriptome. Ikaros-deficient Treg exhibit Th1-like gene expression with abnormal production of IL-2, IFNg, TNFa, and factors involved in Wnt and Notch signaling. While Ikzf1-Treg-cko mice do not develop spontaneous autoimmunity, Ikaros-deficient Treg are unable to control conventional T cell-mediated immune pathology in response to TCR and inflammatory stimuli in models of IBD and organ transplantation. These studies establish Ikaros as a core factor required in Treg for tolerance and the control of inflammatory immune responses.
-
- Cell Biology
- Chromosomes and Gene Expression
Heat stress is a major threat to global crop production, and understanding its impact on plant fertility is crucial for developing climate-resilient crops. Despite the known negative effects of heat stress on plant reproduction, the underlying molecular mechanisms remain poorly understood. Here, we investigated the impact of elevated temperature on centromere structure and chromosome segregation during meiosis in Arabidopsis thaliana. Consistent with previous studies, heat stress leads to a decline in fertility and micronuclei formation in pollen mother cells. Our results reveal that elevated temperature causes a decrease in the amount of centromeric histone and the kinetochore protein BMF1 at meiotic centromeres with increasing temperature. Furthermore, we show that heat stress increases the duration of meiotic divisions and prolongs the activity of the spindle assembly checkpoint during meiosis I, indicating an impaired efficiency of the kinetochore attachments to spindle microtubules. Our analysis of mutants with reduced levels of centromeric histone suggests that weakened centromeres sensitize plants to elevated temperature, resulting in meiotic defects and reduced fertility even at moderate temperatures. These results indicate that the structure and functionality of meiotic centromeres in Arabidopsis are highly sensitive to heat stress, and suggest that centromeres and kinetochores may represent a critical bottleneck in plant adaptation to increasing temperatures.


