G9a regulates temporal preimplantation developmental program and lineage segregation in blastocyst
- Wellcome Trust/Cancer Research United Kingdom Gurdon Institute, University of Cambridge, United Kingdom
- University of Cambridge, United Kingdom
- Wellcome Trust/Medical Research Council Stem Cell Institute, University of Cambridge, United Kingdom
Figures
Figure 1 with 2 supplements

H3K9me2 and G9a accumulate at 4- and 8 cell stage.
(A) Whole-mount IF staining for H3K9me2 (top panels) and G9a (bottom panels) in E1.5, E2.0, E2.5 and E4.5 embryos. DAPI intensity has been adjusted between time points for visualisation purposes (scale bar = 20 μm). IF signal is quantified (B) and visualised using box plots of median and interquartile range (IQR), with whiskers drawn 1.5xIQR away from the lower and upper quartiles. Data shows IF intensity normalised to DAPI for individual cells. At least 9 embryos were quantified for each time point. (*p<0.05 by Wilcoxon rank sum test). 2C: 2 cell stage; 4C: 4 cell stage; 8C: 8 cell stage; DAPI: 4',6-diamidino-2-phenylindole; H3K9me2: histone H3 lysine 9 dimethylation; IF: immunofluorescence; IQR: interquartile range. Also see Figure 1—figure supplements 1 and 2.
Figure 1—figure supplement 1
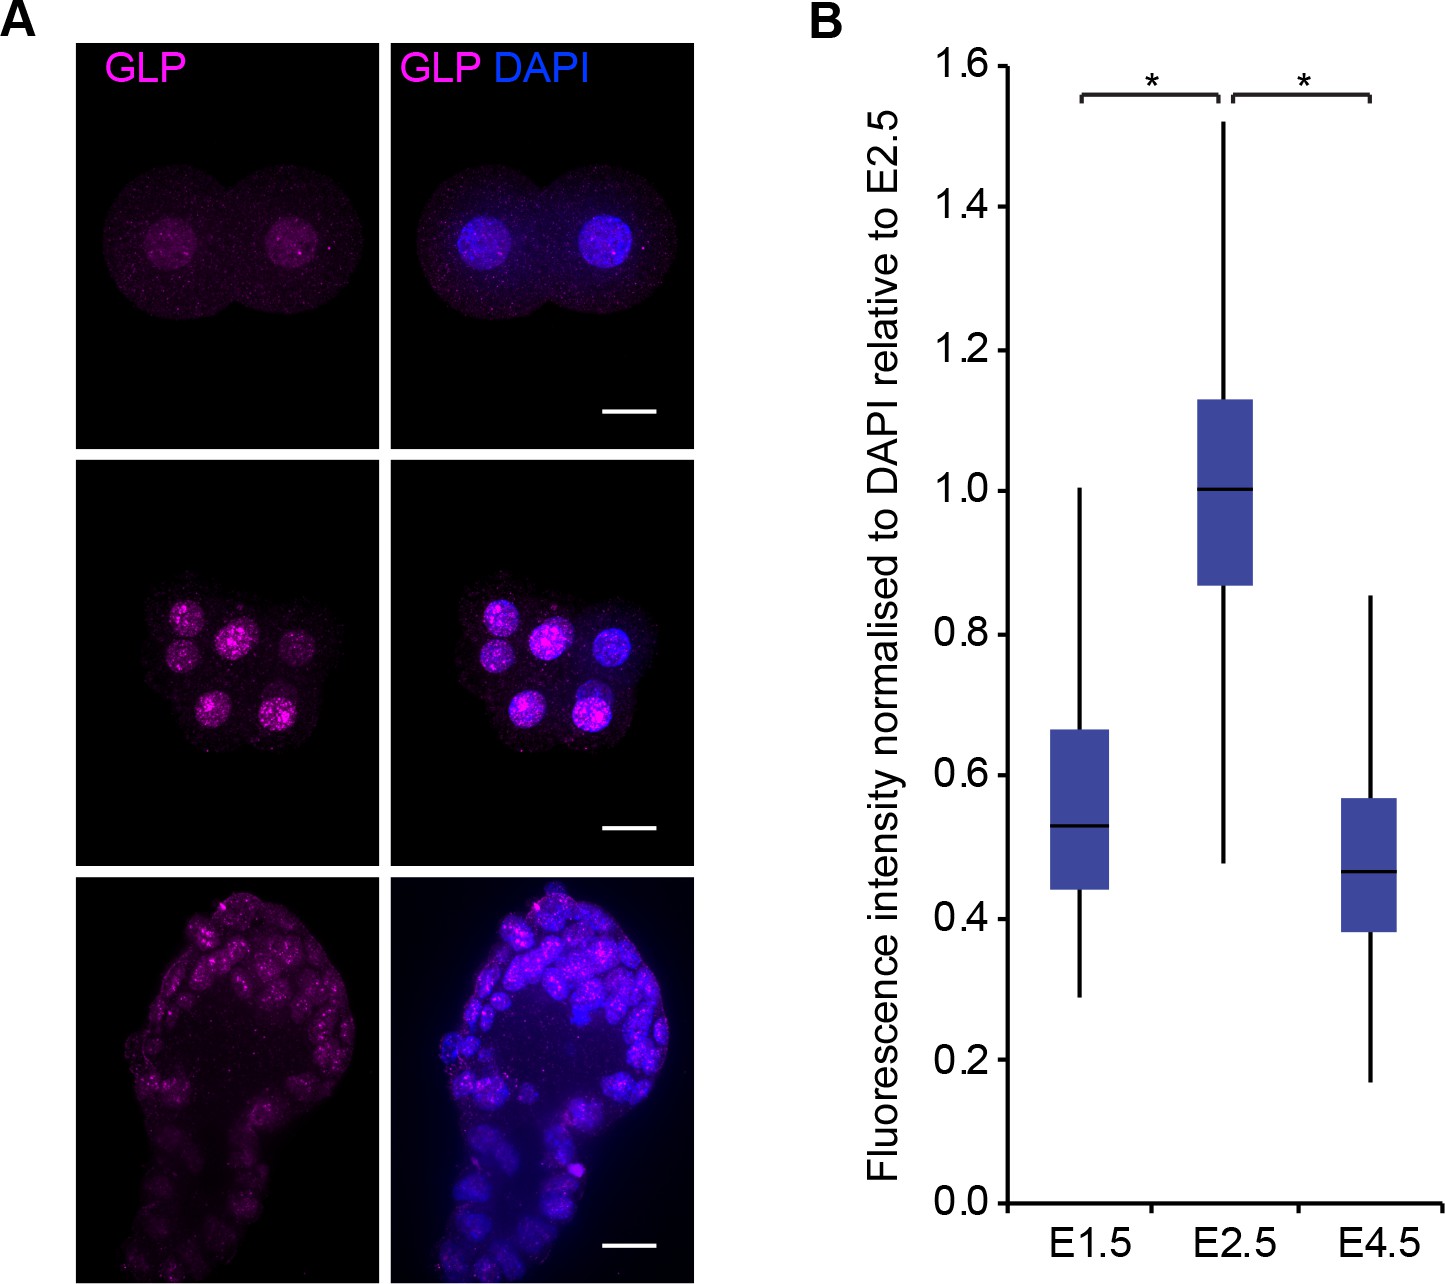
GLP accumulates at 8C (E2.5) stage.
(A) Whole-mount IF staining for GLP in E1.5, E2.0, E2.5 and E4.5 embryos. DAPI intensity has been adjusted between time points for visualisation purposes (scale bar = 20 μm). IF signal is quantified (B) and visualised using box plots of median and interquartile range (IQR), with whiskers drawn 1.5xIQR away from the lower and upper quartiles. Data shows IF intensity normalised to DAPI for individual cells. At least 10 embryos and 19 nuclei were quantified for each time point. (*p<0.05 by Wilcoxon rank sum test). 2C: 2 cell stage; 4C: 4 cell stage; 8C: 8 cell stage; DAPI: 4',6-diamidino-2-phenylindole; GLP: G9a-like protein; IF: immunofluorescence; IQR: interquartile range.
Figure 1—figure supplement 2
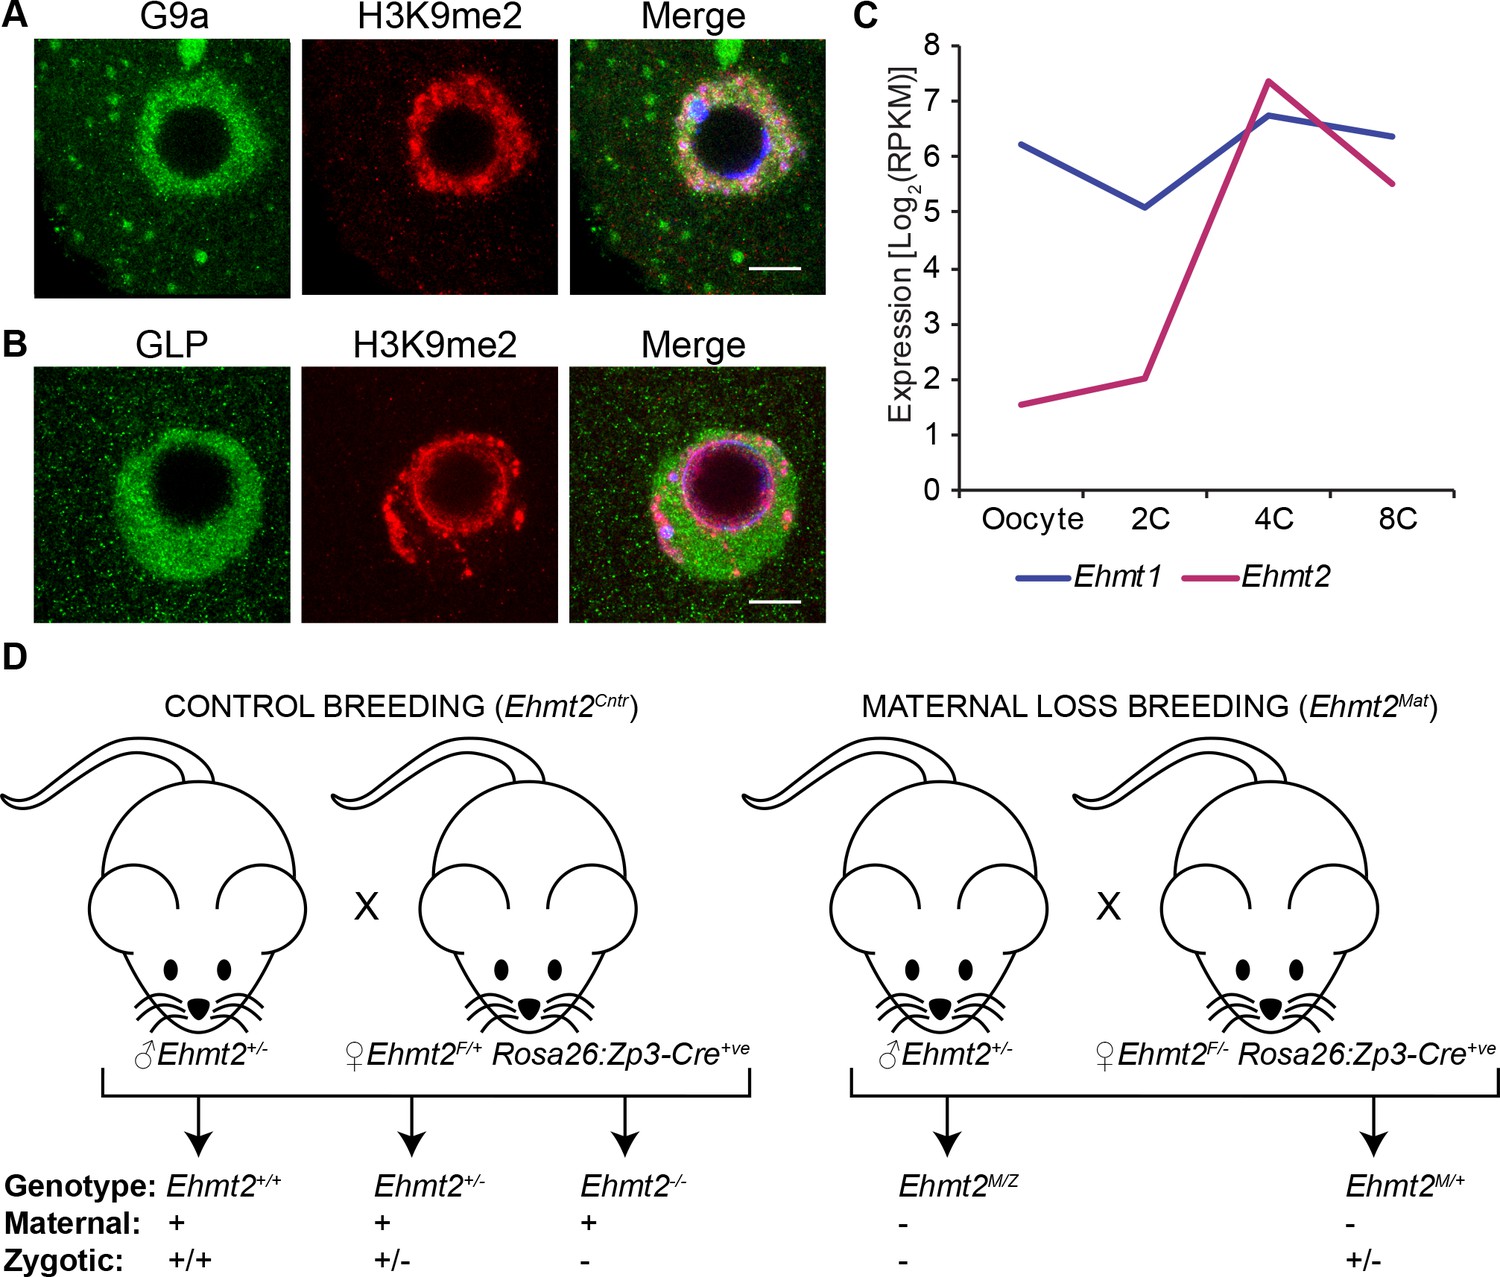
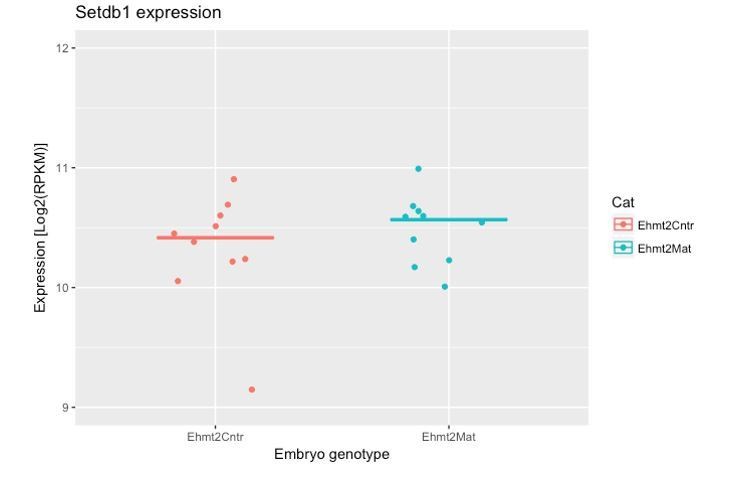
Both G9a and GLP are maternally inherited.
(A–B) Whole-mount IF staining on wildtype germinal-vesicle stage oocyte using anti-G9a (A) and anti-GLP (B) antibodies. Shown is a representative image of the germinal vesicle. seven oocytes were imaged per staining. Scale bar = 10 μm. (C) Expression profile of Ehmt1 (encoding GLP) and Ehmt2 (encoding G9a) during early preimplantation development. Dataset used for this this analysis is from GSE22182 (Tang et al., 2011). Presence of both Ehmt1 and Ehmt2 transcripts is detectable (>1 Log2RPKM) at oocyte stage. (D) Schematics of breading plan used to obtain both control embryos (Ehmt2Cntr) as well as maternally depleted ones (Ehmt2Mat). 2C: 2 cell embryo, 4C: 4 cell embryo; 8C: 8 cell embryo; Ehmt2Cntr: control embryos with maternally inherited G9a; Ehmt2M/+ embryos maternally depleted but with zygotic expression of G9a; Ehmt2M/Z embryos without both maternal and zygotic expression of G9a; Ehmt2Mat embryos maternally depleted of G9a; GLP: G9a-like protein; H3K9me2: histone H3 lysine nine dimethylation; IF: immunofluorescence; RPKM: reads per kilobase of transcript per million of mapped reads.
Figure 2 with 1 supplement
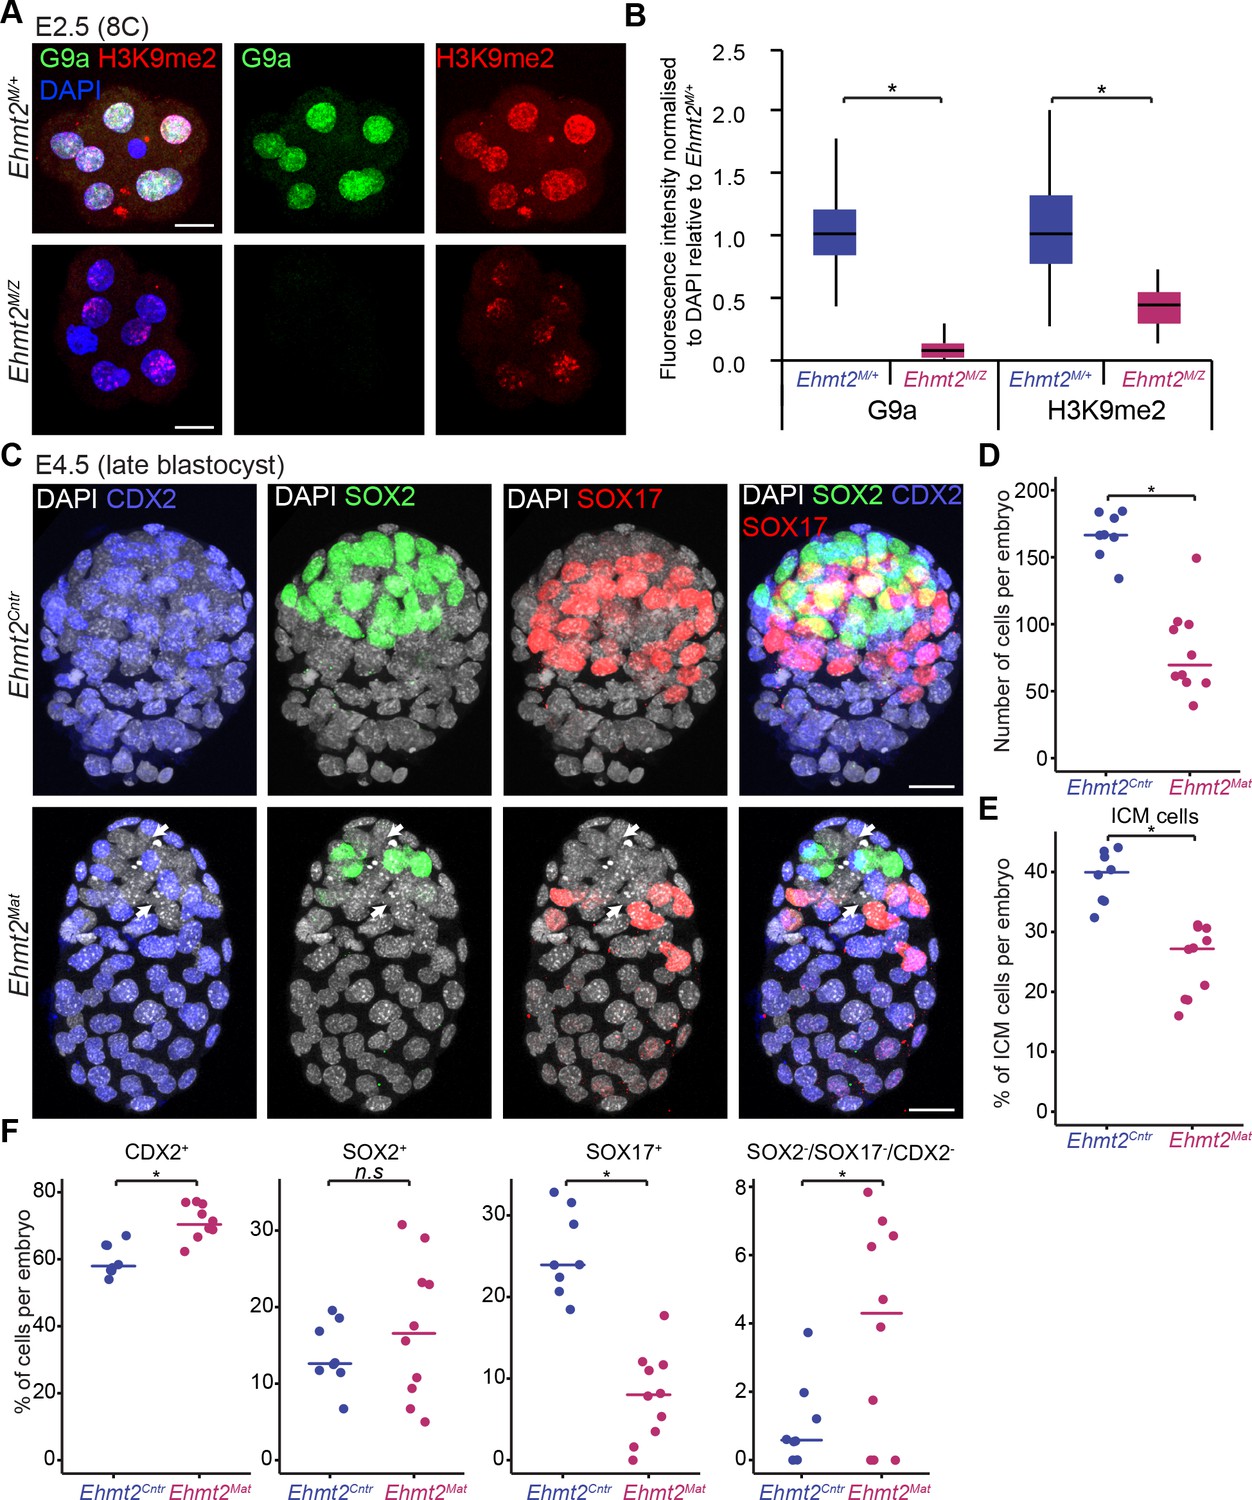
Lack of maternal G9a leads to smaller blastocysts with fewer PrE cells.
(A) Whole-mount IF staining for G9a and H3K9me2 in E2.5 Ehmt2M/Z and Ehmt2M/+ embryos. (Scale bar = 20 μm). (B) IF signal quantification for G9a and H3K9me2 from Figure 2A. Box plots show median and interquartile range (IQR), with whiskers drawn 1.5xIQR away from the lower and upper quartiles. Data shows IF intensity normalised to DAPI. At least six embryos were quantified for each genotype. (*p<0.05 in Wilcoxon rank sum test). (C) Whole-mount IF staining of E4.5 Ehmt2Mat and Ehmt2Cntr blastocysts using anti-CDX2 (TE, Blue), anti-SOX2 (Epi, Green) and anti-SOX17 (PrE, Red) antibodies. White arrows point towards nuclei devoid of staining for any lineage marker. (Scale bar = 20 μm). (D–F) Dot plots showing IF quantification from Figure 2C in relation to embryo genotypes. Each dot represents one embryo, 10 Ehmt2Mat and 8 Ehmt2Cntr embryos were quantified. (D) Total number of cells in an embryo. (E) Percentage of cells within the ICM (SOX2+ or SOX17+). (F) Percentage of cells within each lineage or showing no marker gene expression (SOX2-SOX17-CDX2-). Line shows the median. (*p<0.05 in Wilcoxon rank sum test). CDX2: Caudal Type Homeobox 2; DAPI: 4',6-diamidino-2-phenylindole; Ehmt2Cntr: control embryos with maternally inherited G9a; Ehmt2M/+ embryos maternally depleted but with zygotic expression of G9a; Ehmt2M/Z embryos without both maternal and zygotic expression of G9a; Ehmt2Mat embryos maternally depleted of G9a;Epi: pre-epiblast; H3K9me2: histone H3 lysine 9 dimethylation; ICM: inner cell mass; IF: immunofluorescence; IQR: interquartile range; PrE: primitive endoderm; SOX2: SRY box 2; SOX17: SRY box 17; TE: trophectoderm. Also see Figure 2—figure supplement 1.
Figure 2—figure supplement 1
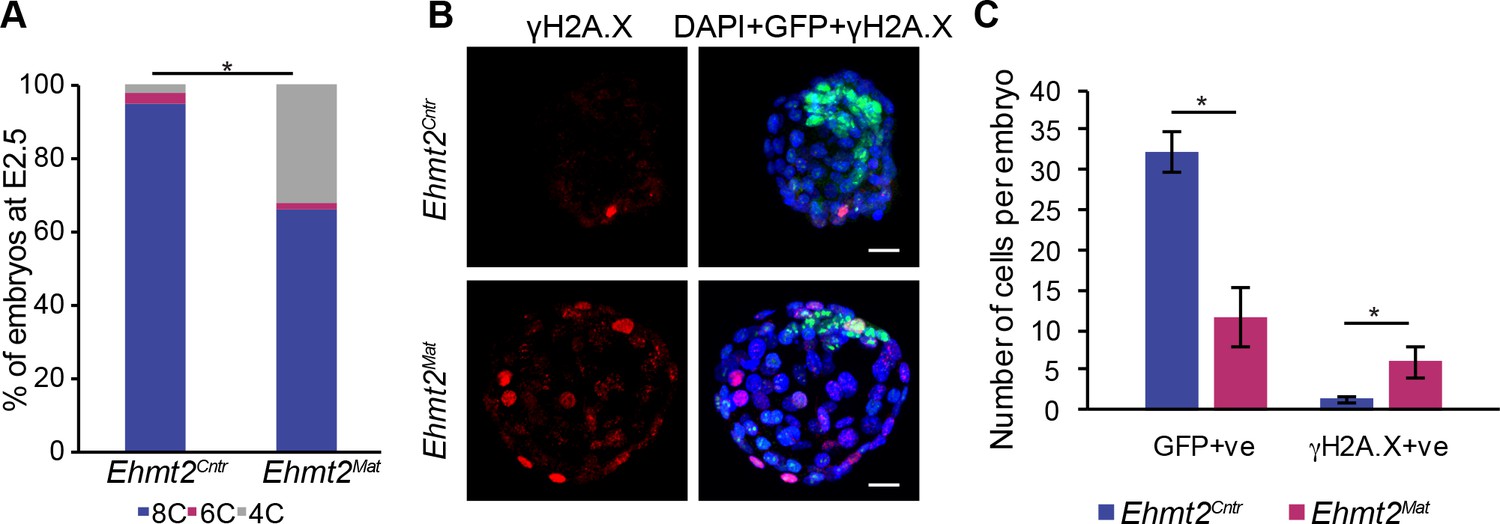
Loss of maternal G9a results in developmental delay and increased γH2A.X staining with fewer ICM cells.
(A) Bar-plot quantification of Ehmt2Cntr and Ehmt2Mat embryo morphology at E2.5. At least 42 embryos per genotype were assessed (*p<0.05 in Chi2 test). (B) Whole-mount IF staining for γH2A.X of in vitro cultured E4.5 equivalent Ehmt2Mat and Ehmt2Cntr embryos. These embryos express GFP under a ΔPE-Pou5f1 promoter thus marking ICM cells but not allowing for the distinguishing of the Epi from PrE cells. γH2A.X is associated with cell cycle progression and a marker of DNA damage. (Scale bar = 20 μm). (C) Bar plot showing quantification of Pou5f1-GFP-positive and γH2A.X-positive cells in blastocysts depending on their genotype. Data are represented as mean (±SEM) from four embryos (*p<0.05 in Wilcoxon rank sum test). ΔPE: proximal enhancer deletion; Ehmt2Cntr: control embryos with maternally inherited G9a; Ehmt2Mat embryos maternally depleted of G9a; γH2A.X: phospho-S139 H2A histone family member X; GFP: green fluorescent protein; IF: immunofluorescence.
Figure 3 with 3 supplements
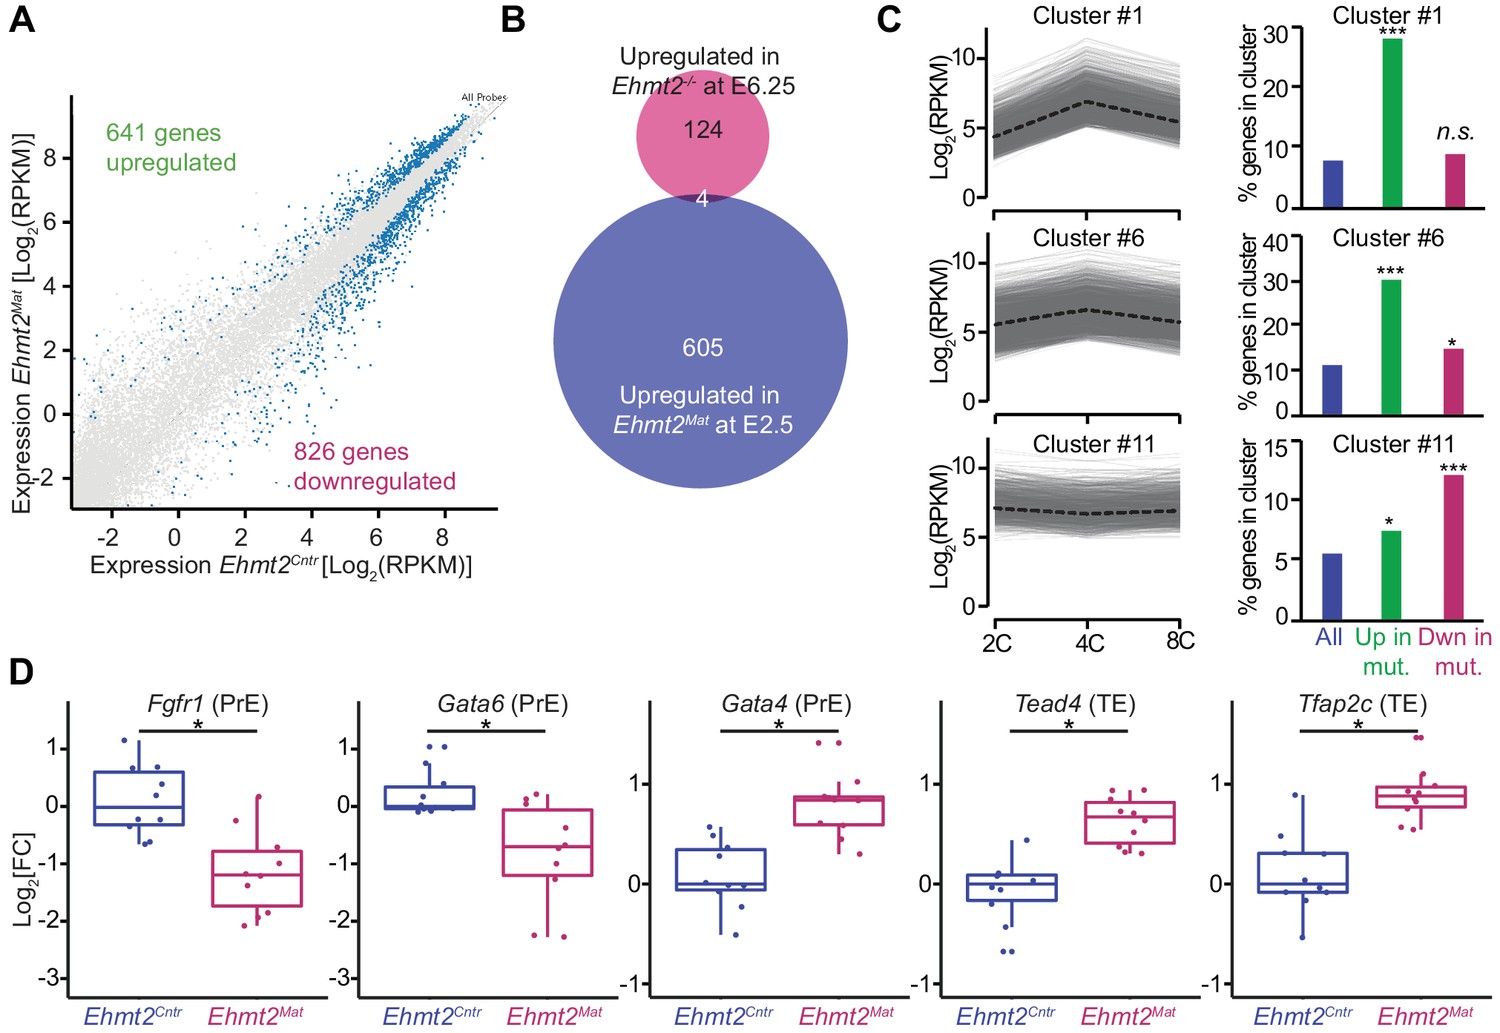
Maternal G9a represses a subset of genes induced at 4 cell stage.
(A) Scatter plot showing transcript expression levels in Ehmt2Cntr and Ehmt2Mat 8C (E2.5) stage embryos. Blue points are differentially expressed genes (adjusted p<0.05 in DEseq2). Shown is the average from ten biological replicates. (B) Venn diagram showing the overlap between upregulated genes upon maternal loss of G9a (Ehmt2Mat) at 8C (E2.5) and those upregulated in zygotic Ehmt2 deletion in E6.25 epiblast (Zylicz et al., 2015). (C) Expression profiles of genes within specific clusters during wildtype development from 2C to 8C (left panels). Dotted line represents mean expression within the cluster. Data from GSE22182 (Tang et al., 2011) was used and within all expressed genes 14 specific clusters were identified. Shown are clusters most enriched for genes becoming derepressed (Clusters 1 and 6) or downregulated (Cluster 11) at 8C in Ehmt2Mat. Right panel of bar plots shows the percentage of genes upregulated (Green) or downregulated (Red) at 8C in Ehmt2Mat, which belong to identified clusters. Significance of enrichments was calculated using Chi2 test (* 10−5 < p < 0.05; ** 10−10 < p < 10−5; ***p<10−10). (D) Fold expression changes of PrE (Fgfr1, Gata6, Gata4) and TE (Tead4, Tfap2c) marker genes in Ehmt2Matcompared to Ehmt2Cntr 8C embryos. Box plots show median and interquartile range (IQR), with whiskers drawn 1.5xIQR away from the lower and upper quartiles. Each dot is a single embryo and data was normalised to median expression levels in Ehmt2Cntr. (*adjusted p<0.05 in DEseq2). 2C: 2 cell embryo, 4C: 4 cell embryo; 8C: 8 cell embryo; Ehmt2Cntr: control embryos with maternally inherited G9a; Ehmt2Mat embryos maternally depleted of G9a; Fgfr1: fibroblast growth factor receptor 1; Gata4: GATA binding protein 4; Gata6: GATA binding protein 6; IQR: interquartile range; Tcfap2c: Transcription factor AP-2 gamma; TE: trophectoderm; Tead4: TEA domain transcription factor 4. Also see Figure 3—figure supplements 1–3 and Figure 3—source data 1–3.
-
Figure 3—source data 1
List of all single-embryo RNAseq samples sequenced.
Shown are numbers of uniquely mapped reads as well as the genotype of each embryo.
- https://doi.org/10.7554/eLife.33361.011
-
Figure 3—source data 2
List of differentially expressed genes between Ehmt2Cntr and Ehmt2Mat at 8C stage embryos.
Differentially expressed genes were identified using DEseq2 with adjusted p-value<0.05.
- https://doi.org/10.7554/eLife.33361.012
-
Figure 3—source data 3
List of enriched GO terms in genes upregulated or downregulated in 8C Ehmt2Mat embryos.
GO term enrichment for biological processes was calculated using DAVID software with minimum five genes in a category and EASE p-value<0.05.
- https://doi.org/10.7554/eLife.33361.013
Figure 3—figure supplement 1
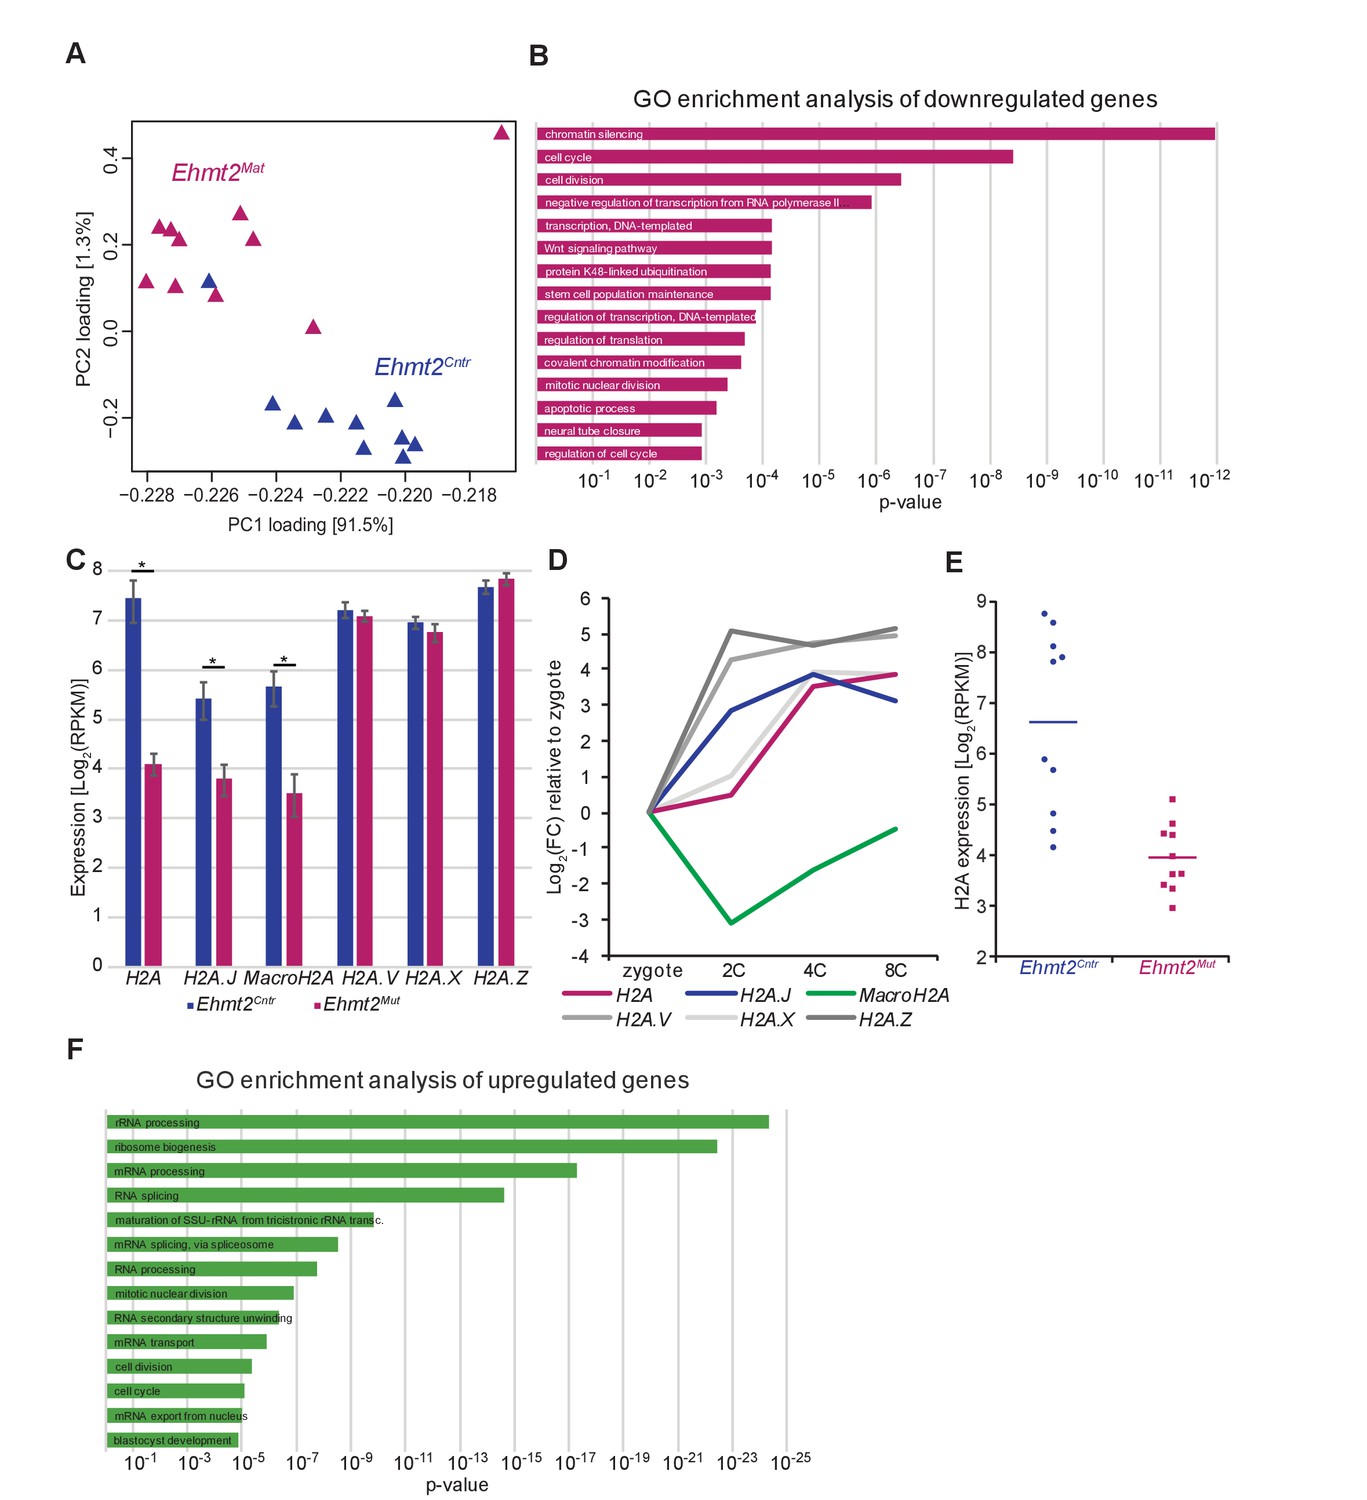
G9a regulates transcription of specific gene sets.
(A) A score plot of the first two principal components for 20 embryos. Genotype is represented by colour. (B) Bar plot showing top 15 enriched GO terms in genes downregulated upon maternal loss of G9a. (C) Bar plot showing expression levels of H2A and H2A histone variants in Ehmt2Cntr and Ehmt2Mat 8C embryos. Shown is total expression originating from all histone genes coding for a given histone variant. Data are represented as mean (±SEM) from ten independent biological replicates (*adjusted p-value<0.05 from DEseq2). (D) Line plot of H2A and H2A histone variant expression dynamics during early development. Data was extracted from a dataset allowing for identification of reads originating from individual histone gene clusters (GSE66582) (Wu et al., 2016) and normalised to zygote expression. (E) Dot-plot showing H2A expression levels in individual Ehmt2Cntr and Ehmt2Mat 8C embryos. Bar represents data median, each dot represents a single embryo. (F) Bar plot showing top 15 enriched GO terms in genes upregulated upon maternal loss of G9a. 2C: 2 cell embryo, 4C: 4 cell embryo; 8C: 8 cell embryo; Ehmt2Cntr: control embryos with maternally inherited G9a; Ehmt2Mat embryos maternally depleted of G9a; FC: fold change; GO: gene ontology; PC: principal component; RPKM: reads per kilobase of transcript per million of mapped reads; SEM: standard error of the mean.
Figure 3—figure supplement 2
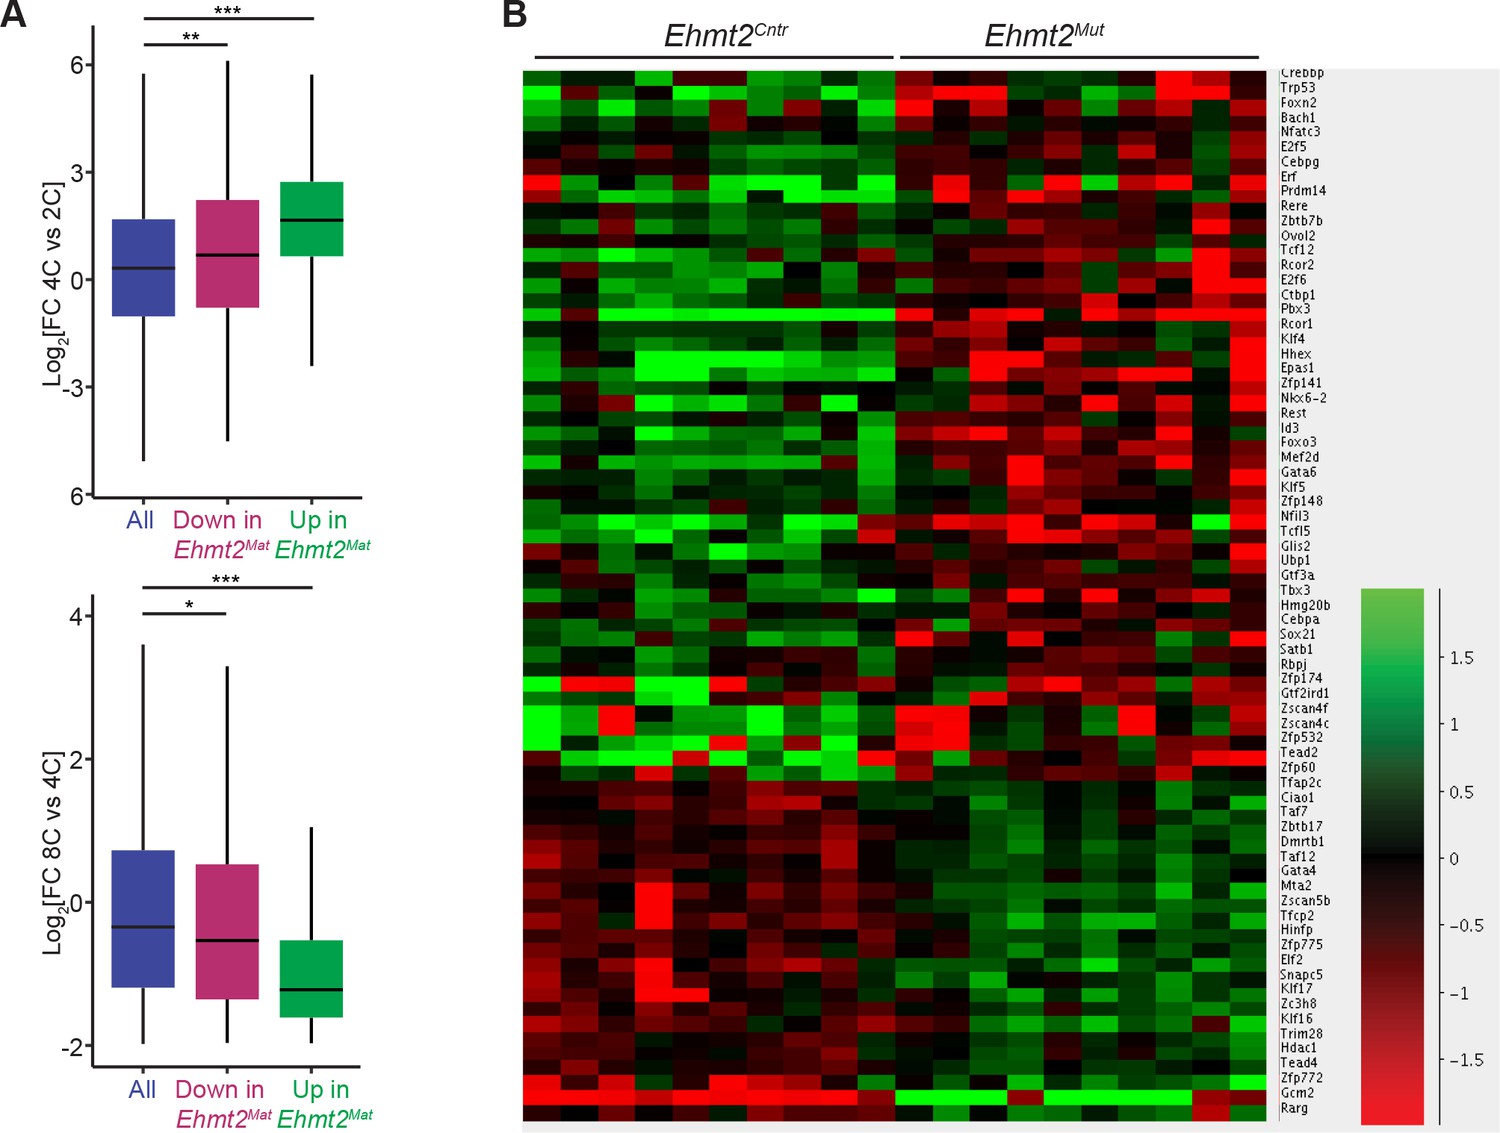
G9a represses a subset of genes upregulated at 4 cell stage.
(A) Box plots showing the fold expression changes occurring during WT embryo development at the transition from 2C to 4C stage (top), as well as from 4C and 8C (bottom). Blue boxes represent distribution observed between all genes while those downregulated (Down) and upregulated (Up) in 8C Ehmt2Mat are represented as red and green boxes respectively. (* 10−5<p<0.05; ** 10−10<p<10−5; ***p<10−10 in Wilcoxon rank sum test). Dataset used for this this analysis is from GSE22182 (Tang et al., 2011). (B) Heatmap showing expression of transcription factor-coding genes in Ehmt2Cntr and Ehmt2Mat 8C embryos. Data was normalised to average from all 20 embryos and shown is Log2FC. 2C: 2 cell embryo, 4C: 4 cell embryo; 8C: 8 cell embryo; FC: fold change.
Figure 3—figure supplement 3
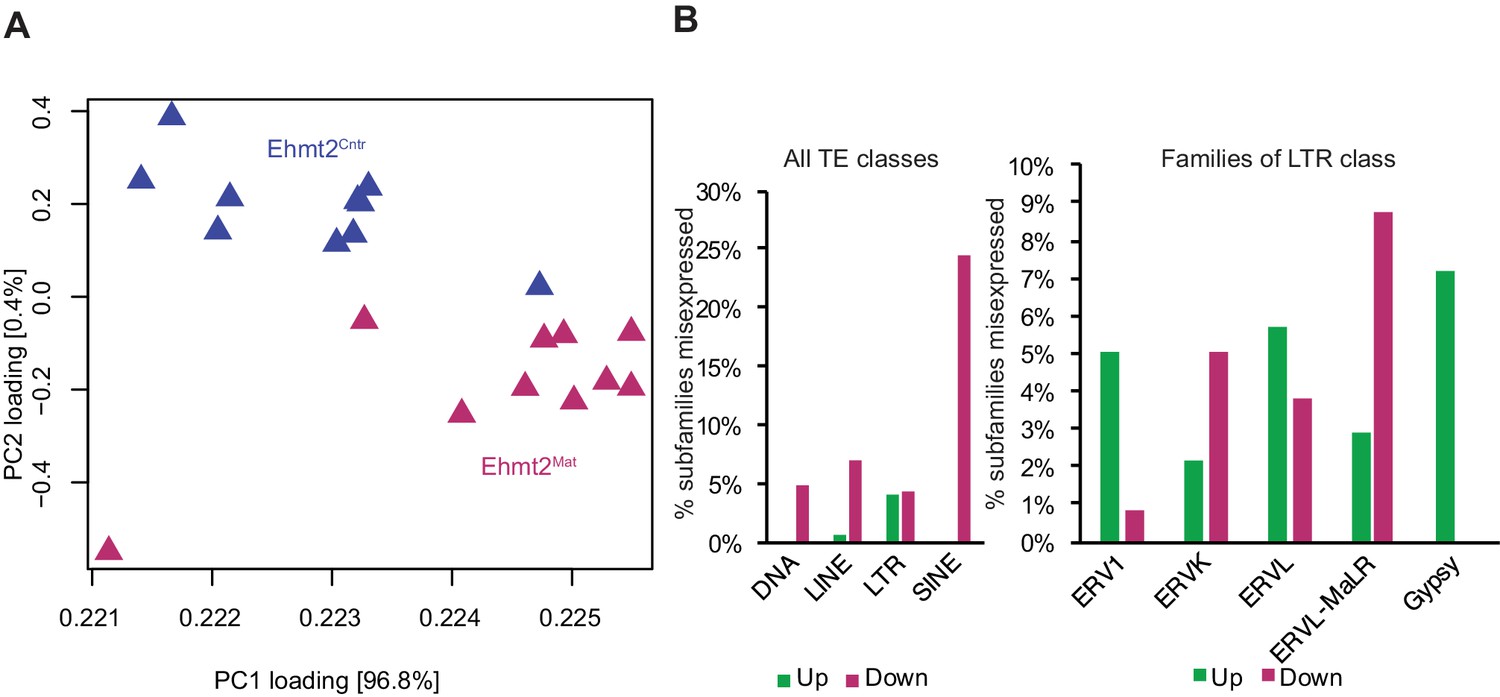
Maternal G9a is dispensable for TE repression.
(A) Score plot of the first two principal components for 20 embryos using transcripts from repetitive elements. Genotype is represented by colour. (B) Bar plot showing the percentage of subfamilies upregulated (Up; green) or downregulated (Down; red) in 8C embryos upon maternal loss of G9a compared to controls. Shown are percentages within all TE classes (left panel) as well as within the LTR class (right panel). Ehmt2Cntr: control embryos with maternally inherited G9a; Ehmt2Mat embryos maternally depleted of G9a; ERV: endogenous retrovirus group; LINE: large interspersed nuclear element; LTR: long terminal repeat; MaLR: Mammalian apparent LTR retrotransposon; PC: principal component; SINE: small interspersed nuclear element; TE: transposable element.
Author response image 1
Author response image 2
Tables
Key resources table
| Reagent type (species) or resource | Designation | Source or reference |
|---|---|---|
| Strain (mouse) | Ehmt2Flox/Flox | PMID:17707231 |
| Strain (mouse) | Zp3-Cre | PMID: 10686600 |
Additional files
-
Transparent reporting form
- https://doi.org/10.7554/eLife.33361.014
Download links
A two-part list of links to download the article, or parts of the article, in various formats.
Downloads (link to download the article as PDF)
Open citations (links to open the citations from this article in various online reference manager services)
Cite this article (links to download the citations from this article in formats compatible with various reference manager tools)
G9a regulates temporal preimplantation developmental program and lineage segregation in blastocyst
eLife 7:e33361.
https://doi.org/10.7554/eLife.33361


