EDF1 coordinates cellular responses to ribosome collisions
- Department of Molecular Biology and Genetics, Howard Hughes Medical Institute, Johns Hopkins University School of Medicine, United States
- Department of Cell Biology, Blavatnik Institute of Harvard Medical School, United States
- Gene Center, Department of Biochemistry, Ludwig-Maximilians-Universität München, Germany
- Section of Cell and Developmental Biology, Division of Biological Sciences, University of California, San Diego, United States
Figures
Figure 1 with 1 supplement
Polysome proteomics pipeline identifies EDF1 as a ribosome-mediated quality control factor.
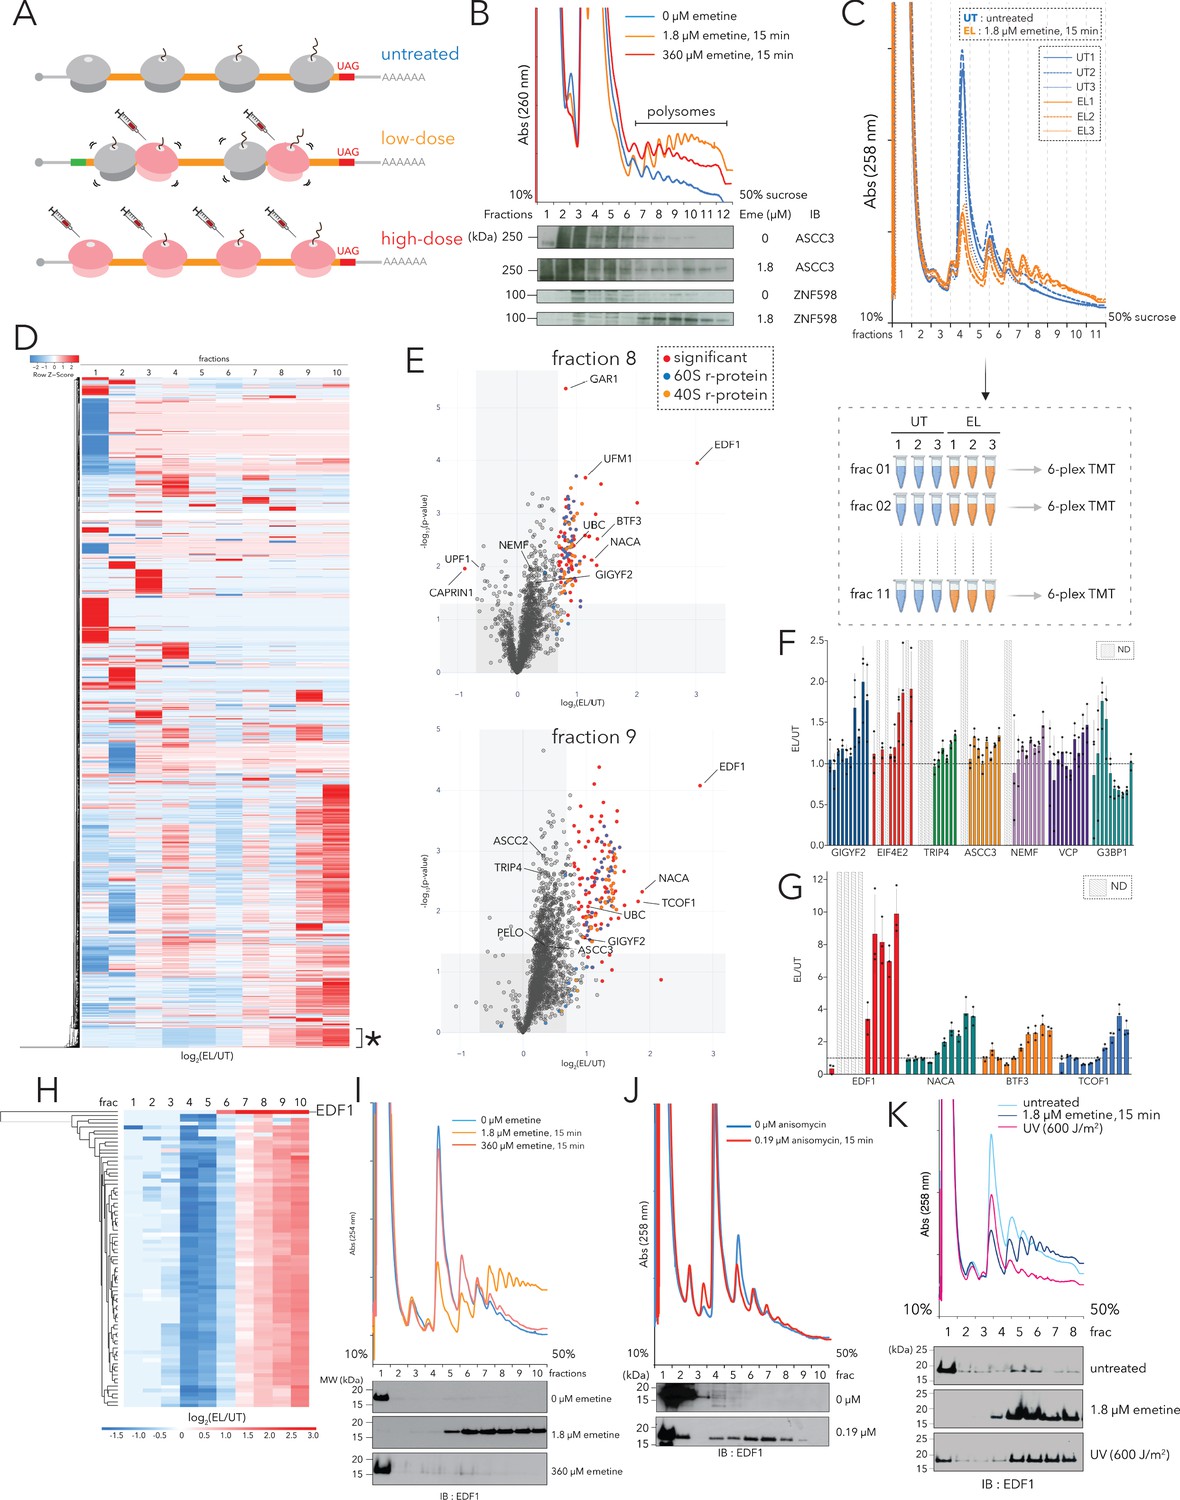
(A) Schematic representation of transcriptome-wide ribosomal collisions induced over a range of emetine concentrations; untreated, low-dose (1.8 µM emetine), high-dose (360 µM emetine). (B) Lysates of HCT116 cells treated with no emetine (0 µM, green), 1.8 µM emetine (orange) and 360 µM emetine (red) for 15 min were fractionated over 10-50% sucrose gradients and the resulting UV (A260) absorbance across collected fractions is shown. TCA precipitated proteins were resolved by SDS-PAGE and immunoblotted with antibodies against the indicated proteins. (n=2) (C) (Top) UV (A258) absorbance across 10-50% sucrose gradients from lysates of HCT116 cells left untreated (untreated, UT x 3, blue traces) or treated with 1.8 µM emetine (low-dose emetine, EL x 3, orange traces) for 15 min. (Bottom) Overview of quantitative polysome proteomics pipeline to monitor fold change in intensity of proteins in low-dose emetine-treated compared to untreated samples. (D) Hierarchical clustering of 4288 proteins identified across all fractions. Columns refer to log2(EL/UT) across density gradient fractions (1-10), rows represent individual proteins. *, cluster of proteins (see text) that exhibits progressive enrichment in log2(EL/UT) that track with A260 profile. (E) Volcano plots of fold change in the abundance of identified proteins in low-dose emetine-treated compared to untreated samples (log2(EL/UT), x-axis) against its statistical significance (-log10(p-value), y-axis); red: significant, fold change (EL/UT) ≥1.6, p-value ≤ 0.05. Top panel, fraction 8; bottom panel, fraction 9 (also see Figure 1—figure supplement 1). (F, G) Mean value of the ratio of relative TMT intensity (EL/UT) for indicated proteins; error bars, SD for n=3. (H) Hierarchical clustering of EDF1 and r-proteins. Columns, log2(EL/UT) across fractions; rows, individual proteins. (I) UV (A258) absorbance across 10-50% sucrose gradients from lysates of HCT116 cells untreated (blue) or treated with 1.8 µM (orange, low-dose) or 360 µM (red, high-dose) emetine for 15 min. TCA precipitated fractions were analyzed by immunoblotting (IB) for EDF1. (n=3) (J) Same as panel (I) except with 0.19 µM anisomycin treatment, 15 min (red). (n=2) (K) Same as panel (I) except samples were treated with 600J/m2 UV (magenta). (n=2) See also Figure 1—figure supplement 1 and Figure 1—source data 1.
-
Figure 1—source data 1
Related to Figure 1C–H and Figure 1—figure supplement 1B–1P; Sucrose gradient fraction analysis (polysome proteome profiling) with or without low-dose emetine treatment (1.8 µM, 15 min).
Eleven 6-plex TMT-MS3 analysis of HCT116 cells.
- https://cdn.elifesciences.org/articles/58828/elife-58828-fig1-data1-v2.xlsx
Figure 1—figure supplement 1
Polysome proteomics as a platform to identify proteins associated with ribosomes.
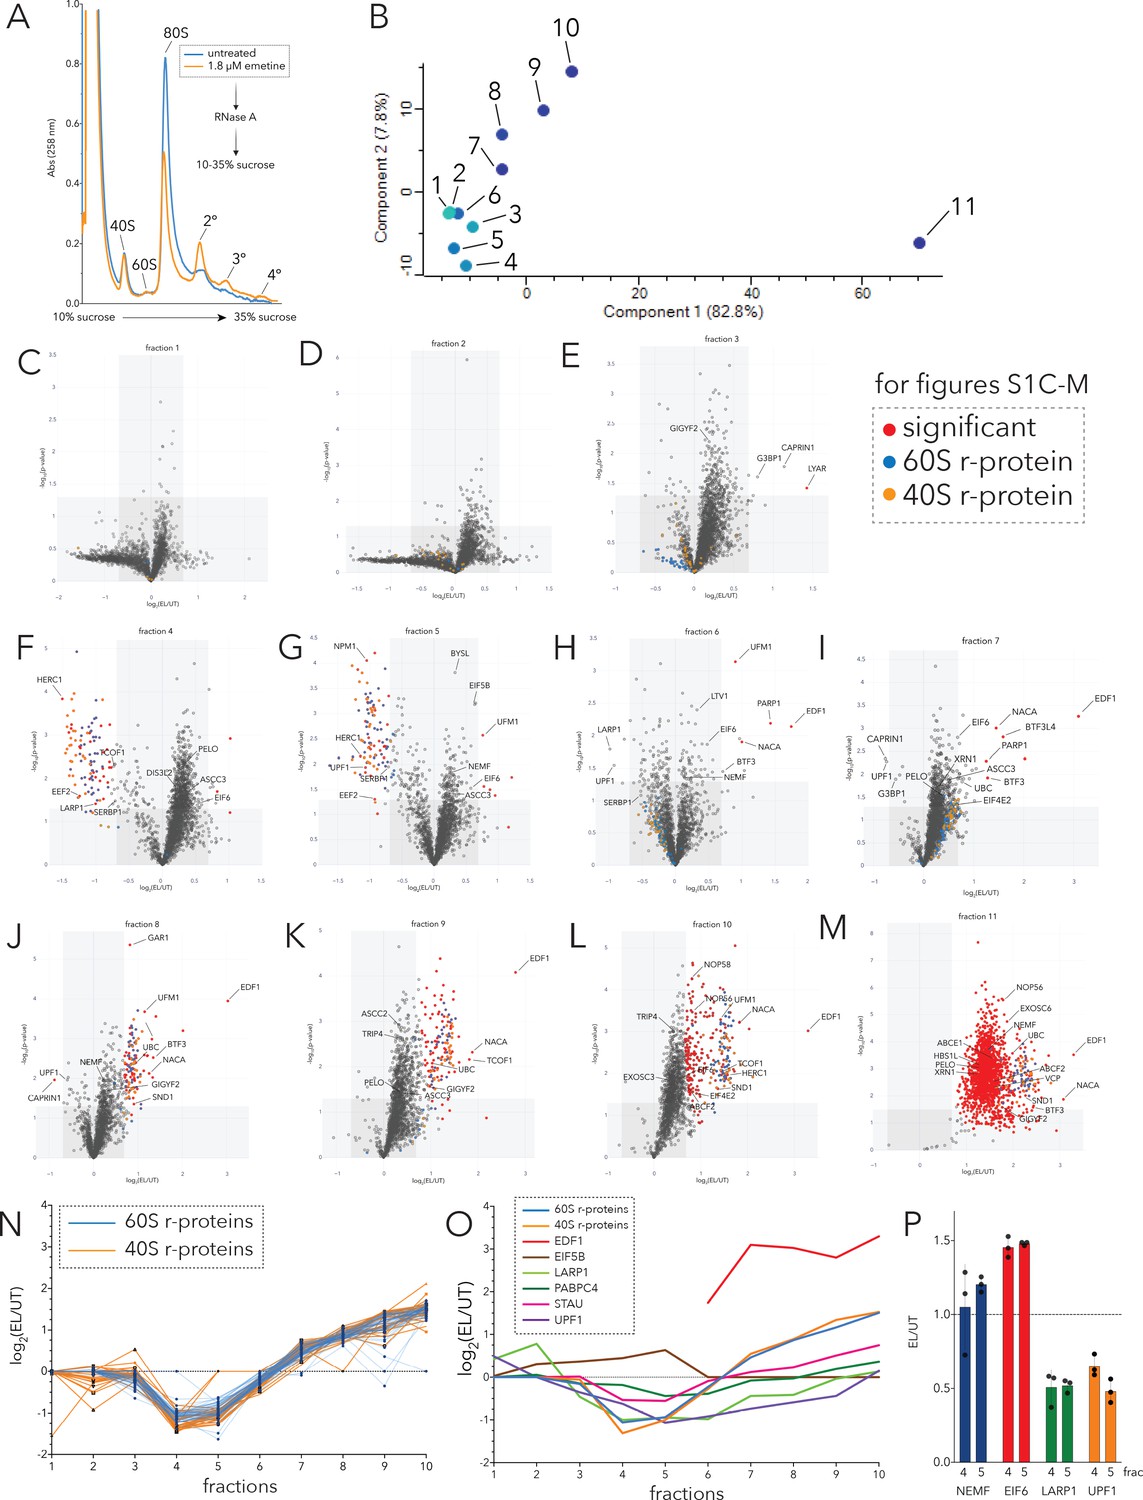
(A) UV (A258) absorbance across 10-35% sucrose gradients from RNase A digested lysates of HCT116 cells treated with 0 µM emetine (blue trace) or 1.8 µM emetine (orange trace) for 15 min. (B) PCA plots of fractions 1-11 across the polysome profile. Symbols for fractions 1-11 colored from light to dark blue. PC1 (x-axis) and PC2 (y-axis) accounted for 82.8% and 7.8% respectively, of the contribution of the variance. (C–M) Volcano plots of the fold change in the intensity of identified proteins in low-dose emetine-treated compared to untreated samples (log2(EL/UT), x-axis) against its statistical significance (-log10(p-value), y-axis) across fractions 1-11; red: significant; gray square: fold change (EL/UT) >1.6, p-value ≤ 0.05; blue dots, 60S r-proteins; orange dots, 40S r-proteins. Candidates of interest are indicated with arrows. (N) Line plots of log2(EL/UT) for 60S (blue) and 40S r-proteins (orange) across fractions 1-10. (O) Median log2(EL/UT) for 60S (blue) and 40S r-proteins (orange) are plotted across fractions 1-10 with log2(EL/UT) of indicated proteins. (P) Mean value of the ratio of relative TMT intensity (EL/UT) in fraction 4 and fraction 5 (monosomes) for specified factors; error bars, SD for n=3.
Figure 2 with 2 supplements
Recruitment of EDF1 to collided ribosomes is ZNF598 independent but RACK1 dependent.
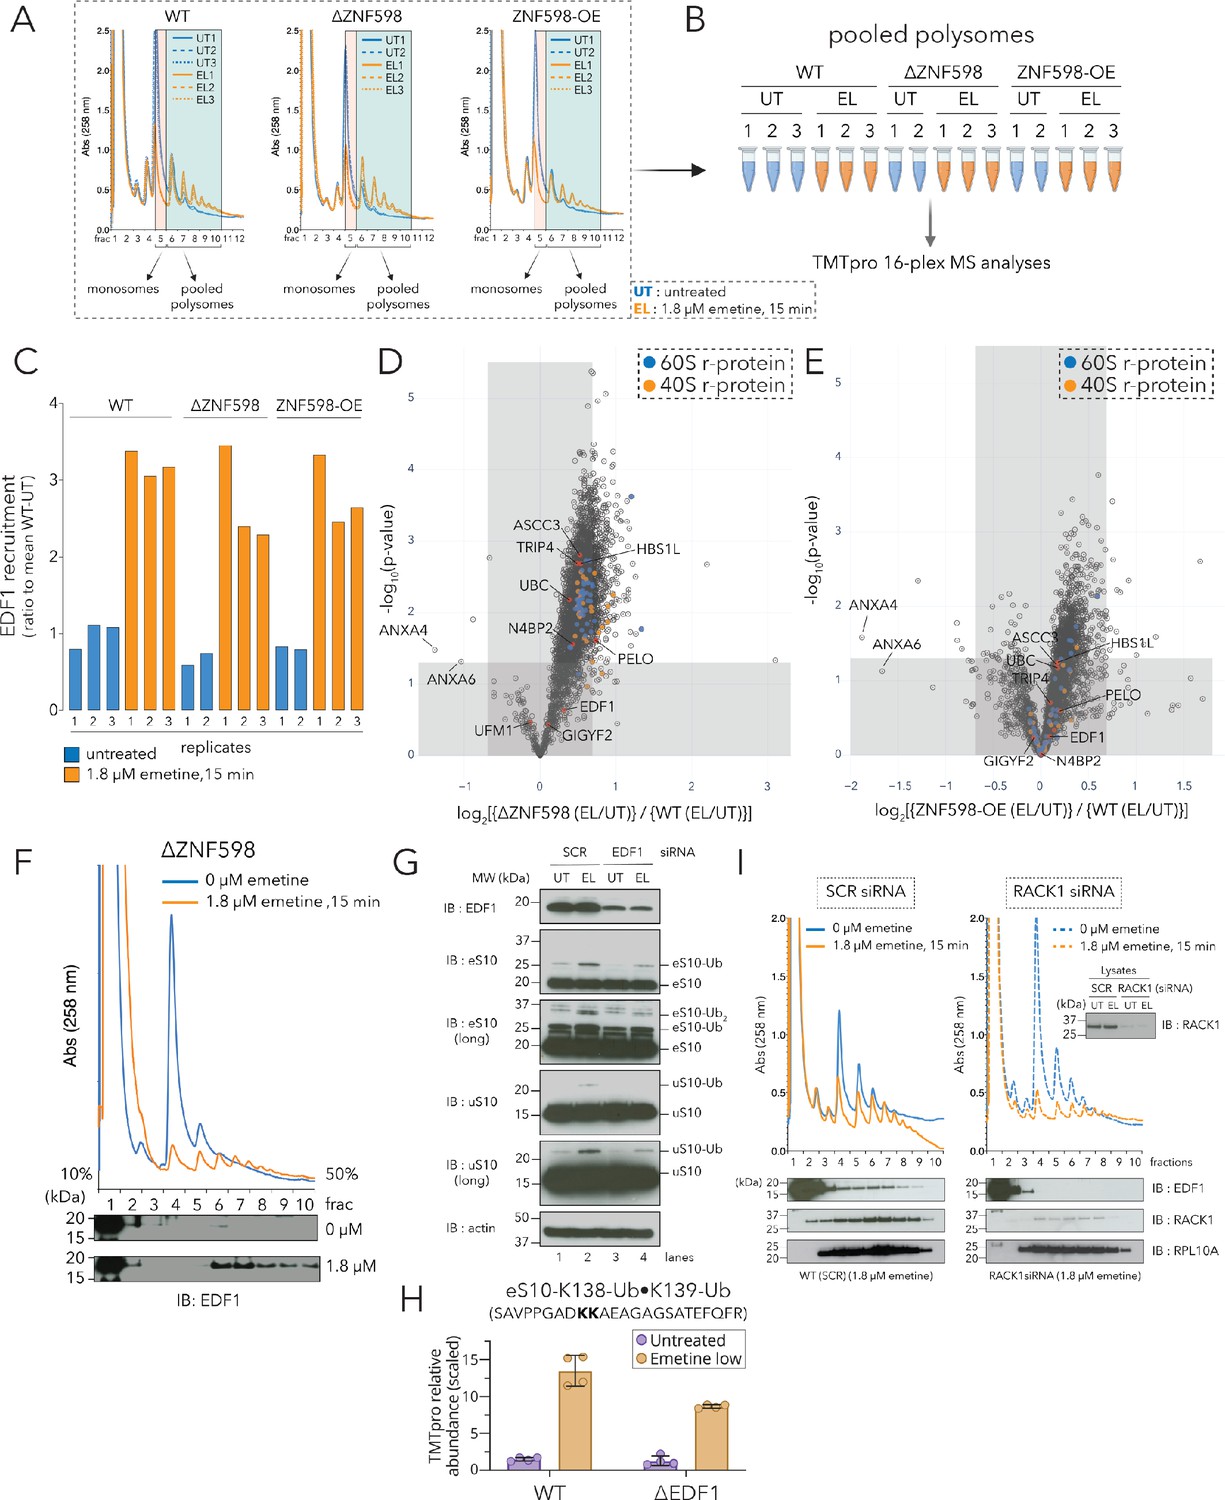
(A) UV (A258) absorbance across 10–50% sucrose gradients from lysates of HCT116 WT, ΔZNF598 and ZNF598-overexpression (OE) cells treated with 0 µM emetine (untreated, UT, blue traces) or 1.8 µM emetine (low-dose emetine, EL, orange traces) for 15 min; fraction five isolated for monosomes; fractions 6–10 pooled for polysomes. (B) Schematic of polysome proteomics pipeline to monitor fold change in protein intensity in response to emetine treatment between ΔZNF598 or ZNF598-OE and parental (WT) HCT116 cells. (C) Ratio of relative TMT intensity of individual replicates to mean WT-UT intensity for EDF1 in untreated (blue) or low dose (1.8 µM) emetine treated (orange) samples. (D, E) Volcano plot of ratio of fold change in protein abundance in response to emetine treatment between ΔZNF598 and WT cells (D), or ZNF598-OE and WT cells (E). (F) UV (A258) absorbance across 10–50% sucrose gradients from lysates of HCT116-ΔZNF598 cells left untreated (blue) or treated with 1.8 µM emetine for 15 min (orange). TCA precipitated fractions analyzed by immunoblotting with EDF1 antibodies (n = 3). (G) Whole cell extracts from untreated (UT) or low-dose of emetine (EL, 1.8 µM, 15 min) treated cells transfected with non-targeting (SCR) or EDF1 siRNAs were analyzed by SDS-PAGE and immunoblotted (IB) with the indicated antibodies. The ubiquitin-modified proteins are indicated. Long, denotes longer exposure. (n = 3) (H) Quantification of relative TMT abundance (n = 4) of the doubly modified diGly eS10-K138/139 peptide (SAVPPGADKKAEAGAGSATEFQFR) normalized to eS10 protein abundance from polysomes of WT and ΔEDF1 cells treated with or without low dose emetine (1.8 µM) for 15 min (also see Figure 2—figure supplement 2F). Error bars denote SD for n = 4. (I) UV absorbance across 10–50% sucrose gradients from lysates of HCT116 cells treated with non-targeting (SCR) or RACK1 siRNAs with 0 µM emetine (blue) or 1.8 µM emetine treatment for 15 min (orange). TCA precipitated fractions were analyzed by immunoblotting with EDF1, RACK1, or RPL10A antibodies (n = 3). Total lysates (inset) analyzed for RACK1 depletion after siRNA treatment using RACK1 antibody. See also Figure 2—figure supplement 1, Figure 2—figure supplement 2, Figure 2—source data 1 and Figure 2—figure supplement 2—source data 1.
-
Figure 2—source data 1
Related to Figure 2A-E and Figure 2—figure supplement 1A-C; Polysome sucrose gradient fraction (pooled) analysis with or without low-dose emetine treatment (1.8 µM, 15 min).
16plex TMT-MS3 analysis of HCT116 WT, ΔZNF598, and ZNF598-OE cells.
- https://cdn.elifesciences.org/articles/58828/elife-58828-fig2-data1-v2.xlsx
Figure 2—figure supplement 1
Recruitment of several known ribosome-mediated QC factors to collided ribosomes is ZNF598 independent.
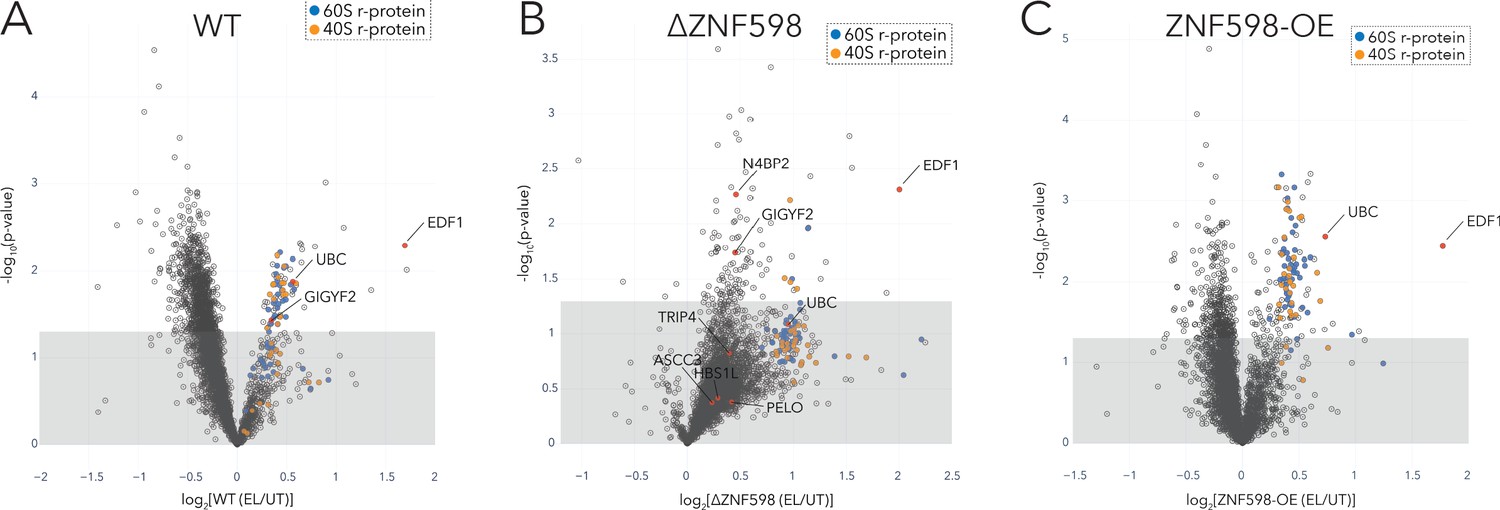
(A) Volcano plots of fold change in the intensity of proteins identified in pooled polysomes of low-dose emetine-treated HCT116 WT cells compared to untreated cells. Gray square: p-value cutoff ≤ 0.05; 60S and 40S r-proteins denoted in blue and orange respectively. (B–C) Volcano plots of log2(EL/UT) against -log10(p-value) for ΔZNF598 cells (B), and ZNF598-OE cells (C). Candidate proteins of interest are indicated with arrows.
Figure 2—figure supplement 2
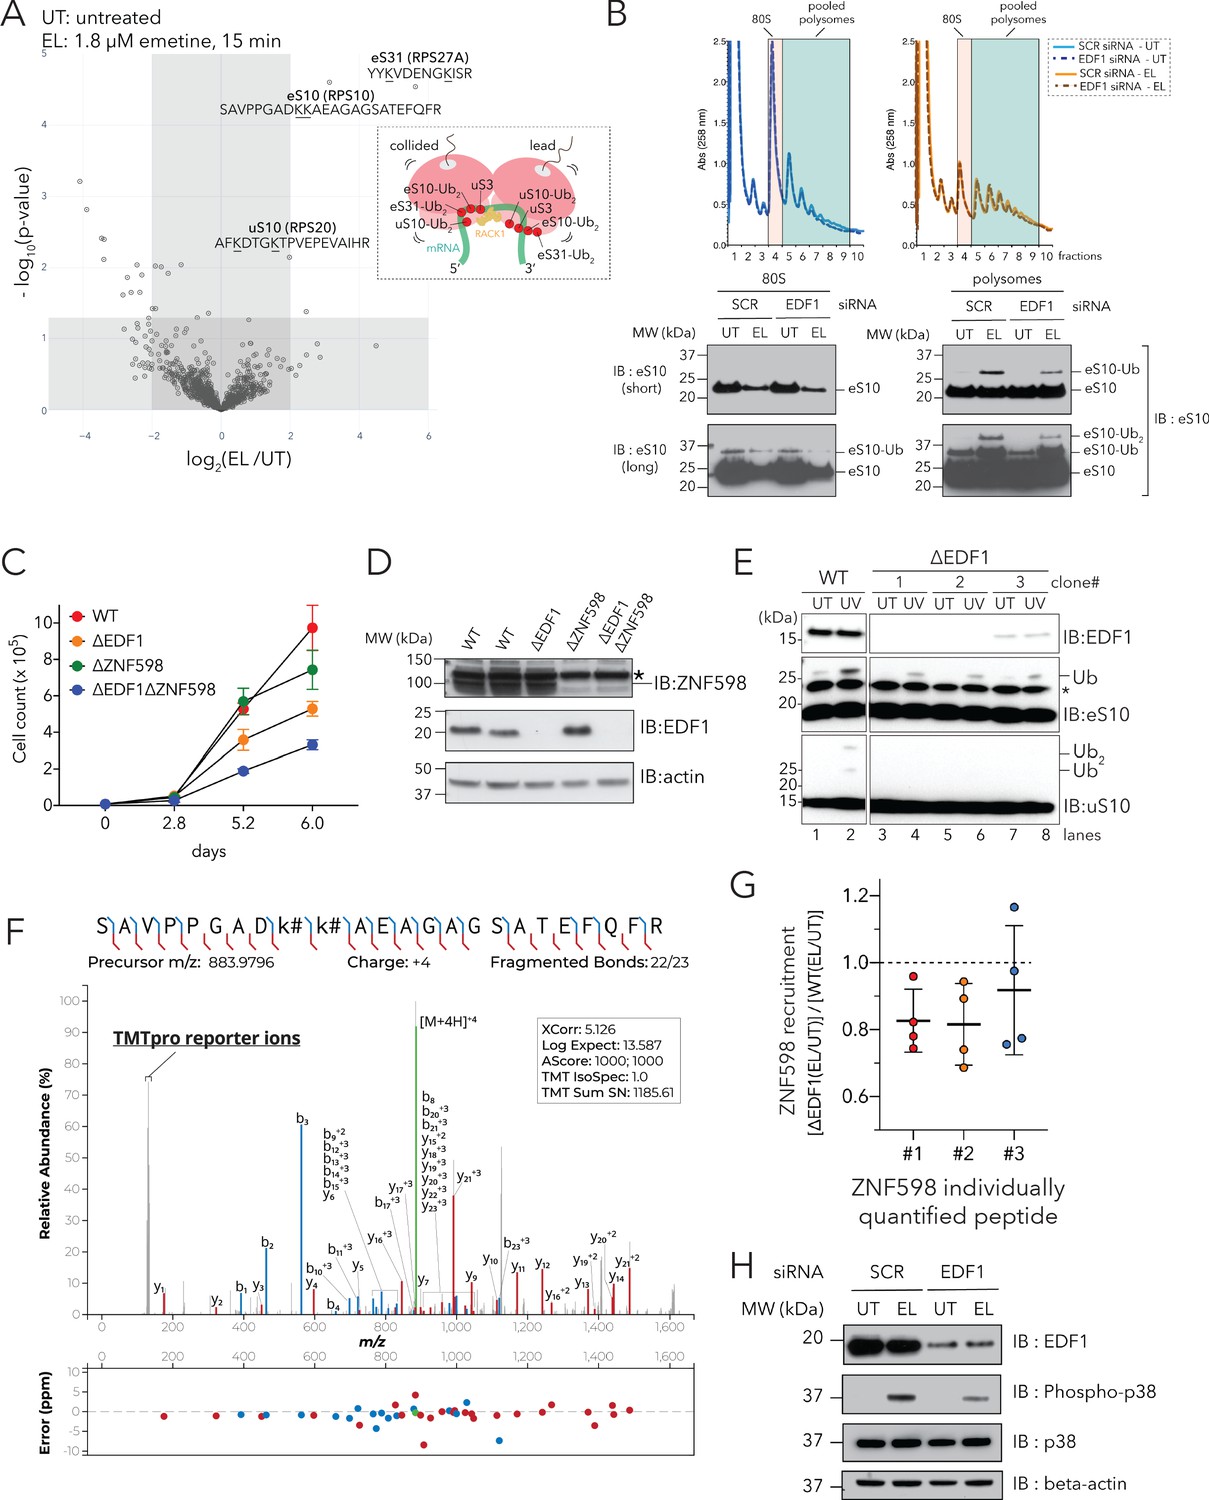
Loss of EDF1 decreases ZNF598-mediated ubiquitylation of eS10 and uS10, and ZAKα-mediated phosphorylation of p38.
(A) Ubiquitin remnant proteomic profiling of HEK293T cells treated with 0 µM (UT) or 1.8 µM (EL) emetine for 15 min. Volcano plot of fold change in abundance of identified peptides (log2(EL/UT), x-axis) against -log10(p-value), y-axis. Inset: cartoon of collided ribosomes showing uS3, uS10, eS10 and eS31 decorating the disome interface. (also see Figure 2—figure supplement 2—source data 1). (B) (Top) UV (A258) absorbance across 10-50% sucrose gradients from lysates of HEK293T cells transfected with non-targeting (SCR) or EDF1 siRNAs, and treated with 0 µM (UT) or 1.8 µM (EL) emetine for 15 min; (bottom) Immunoblots of monosomes or pooled polysomes showing eS10 ubiquitylation in untreated (UT) or 1.8 µM emetine-treated (EL) samples. Long, indicates longer exposure. (n=2). (C) Growth curves at 37°C. At each time point, cells were trypsinized from three plates, pooled, and three measurements were taken for each condition. Result shown is quantified for one experiment representative of ≥ 3 independent observations. (D) Representative immunoblots from whole cell lysates demonstrating loss of EDF1 protein in ΔEDF1 cells, and loss of EDF1 and ZNF598 proteins in ΔEDF1ΔZNF598 cells. *, non-specific band observed with ZNF598 antibody in whole cell lysates. (E) HEK293 Flp-In T-REx WT and ΔEDF1 cells were left untreated or subjected to UV irradiation (0.02 J/cm2) and allowed to recover for 1 h. Cell extracts were collected, analyzed by SDS-PAGE and immunoblotted for EDF1, eS10 and uS10. (F) MS/MS spectrum annotation of quantified eS10 peptide modified with K-GG at both K138 and K139 positions (SAVPPGADKKAEAGAGSATEFQFR). Peptide sequence (top) marked with the locations of matched fragment ions, the annotated mass spectrum (middle), and visualization of mass error in parts-per-million for all matched fragment ions (bottom). (G) Effect of EDF1 deletion on the emetine-induced recruitment of ZNF598 to polysomes of WT and ΔEDF1 cells treated with or without low dose emetine (1.8 µM) for 15 min. Unique identified and quantified peptides for ZNF598 are shown. Error bars, SD for n=4. Dashed line at 1 indicates no abundance change in emetine-dependent recruitment to polysomes between WT and ΔEDF1 cells. (H) Immunoblots of whole cell extracts showing levels of total and phospho-p38 induced by low-dose emetine treatment (EL, 1.8 µM, 15 min) compared to untreated cells (UT) in HEK293T cells transfected with non-targeting (SCR) or EDF1 siRNAs (n=2).
-
Figure 2—figure supplement 2—source data 1
Related to Figure 2—figure supplement 2A; Ubiquitin remnant profiling of HEK293T cells treated with 0 µM emetine (UT) or 1.8 µM emetine (EL) for 15 min.
- https://cdn.elifesciences.org/articles/58828/elife-58828-fig2-figsupp2-data1-v2.xlsx
Figure 3 with 2 supplements
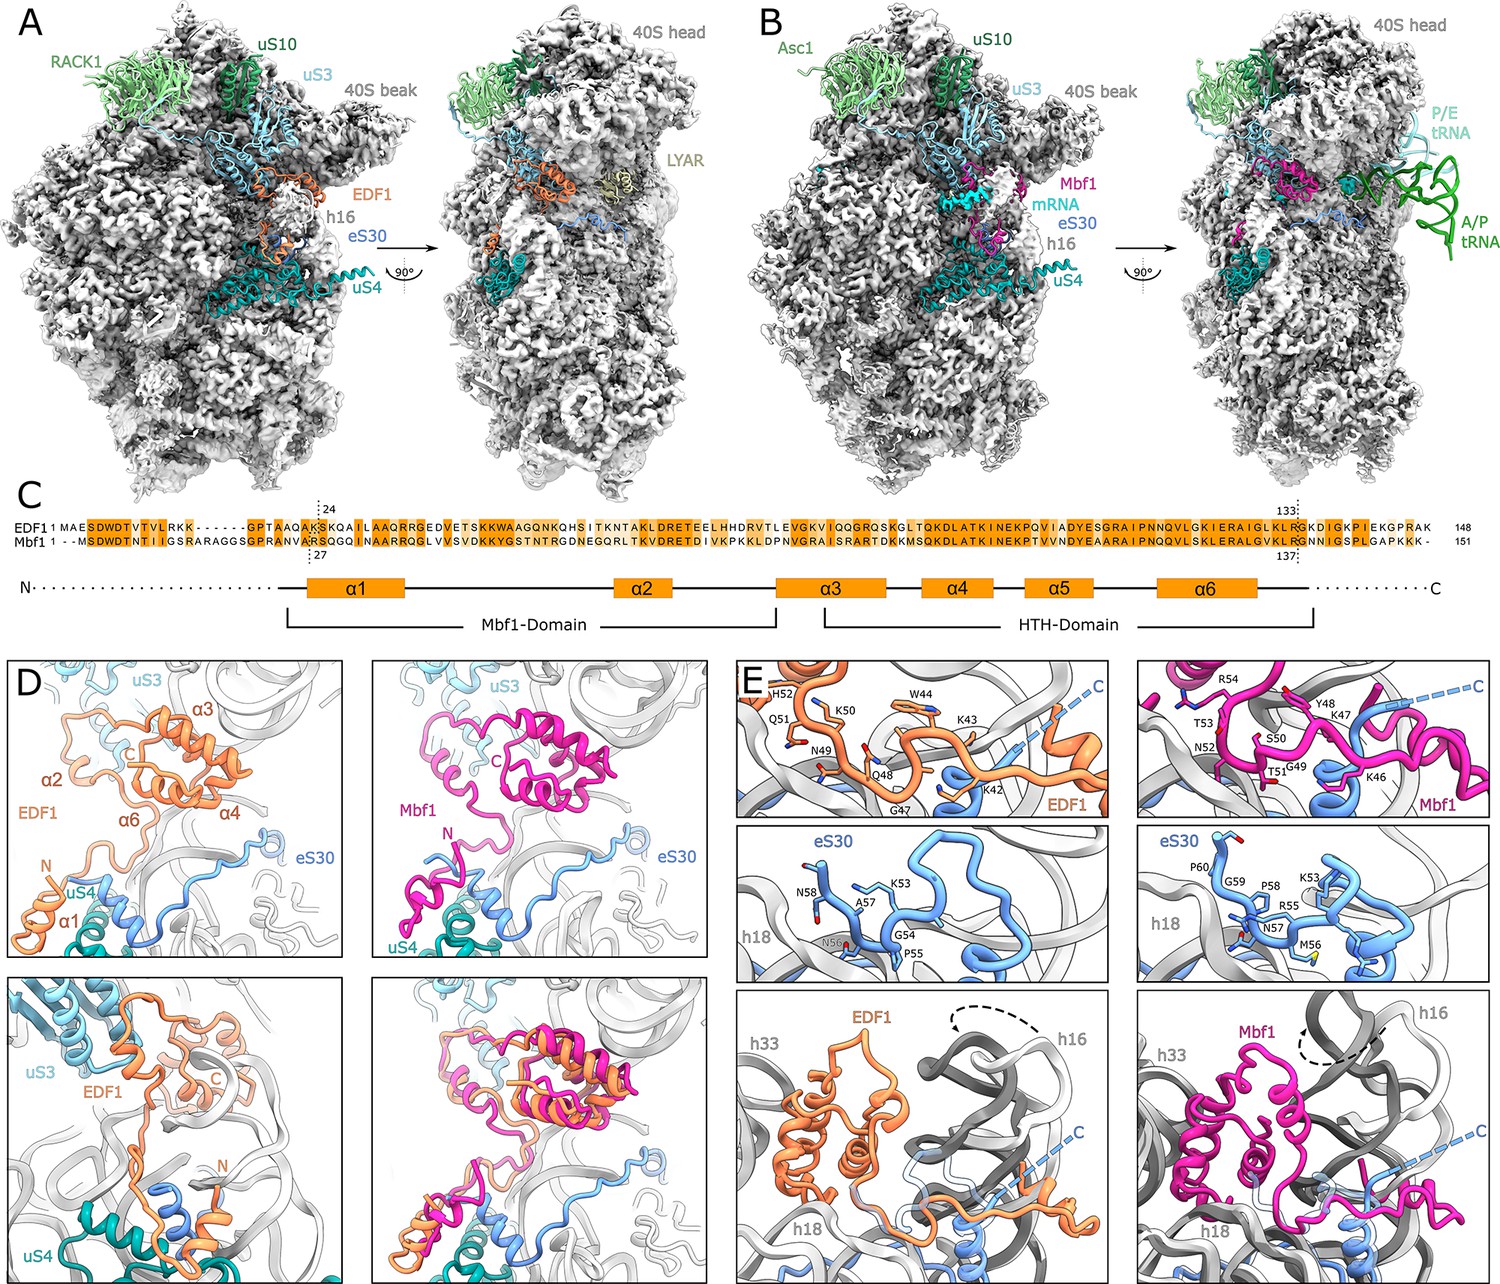
Structural analysis of ribosome-bound EDF1 and Mbf1.
(A) Overview of EM map and models of the 40S subunit of human non-rotated EDF1-bound ribosome. Selected r-proteins and EDF1 (orange) are shown as models in the EDF1•80S map (PDB: 6ZVH). (B) Overview of Mbf1 (violet red) bound to the yeast rotated ribosome with hybrid tRNAs. (PDB: 6ZVI). (C) Alignment of EDF1 and Mbf1 sequences colored by conservation and domain architecture of EDF1. (D) Overall structure of ribosome-bound EDF1 and Mbf1 showing a highly similar fold and binding mode with the C-terminus sandwiched between helix 16 (h16) and helix 33 (h33) of the 18S rRNA and the r-protein uS3 close to the mRNA entry channel, and the N-terminus forming a helix at the base of helix 16. (E) EDF1 and Mbf1 interact with rRNA helix 18 (h18), displacing the C-terminus of eS30. Binding of EDF1 and Mbf1 shifts helix 16 towards the ribosome, resulting in a clash of the canonical eS30 position with the new position of helix 16. See also Figure 3—figure supplement 1, Figure 3—figure supplement 2 and Figure 3—source data 1.
-
Figure 3—source data 1
Cryo-EM data collection, refinement and validation statistics.
- https://cdn.elifesciences.org/articles/58828/elife-58828-fig3-data1-v2.docx
Figure 3—figure supplement 1
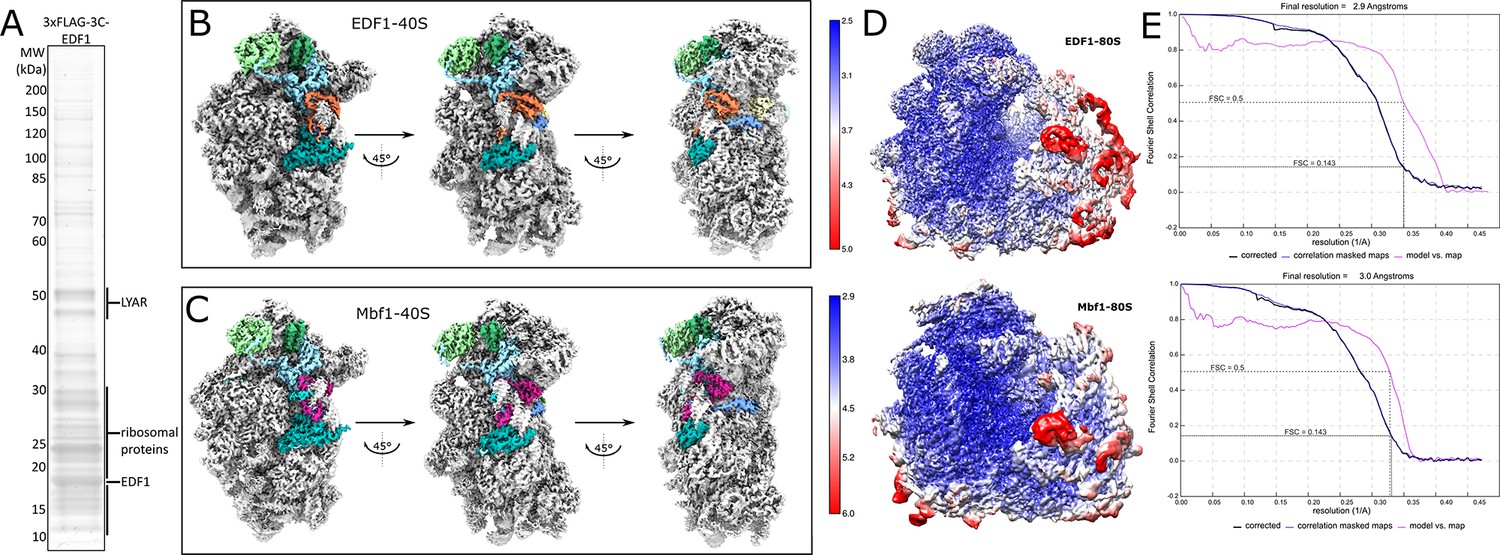
Sample preparation, cryo-EM maps, local resolution distribution, refinement and model statistics.
(A) SDS-PAGE of the 3xFLAG-3C-EDF1 immunoprecipitation. (B) Cryo-EM map of the EDF1-ribosome. (C) Cryo-EM map of the Mbf1-ribosome. (D) Map of the final EDF1- and Mbf1-ribosome, filtered and colored according to local resolution (E) Fourier shell correlation (FSC) curves corresponding to the final volumes shown in (D). FSC curves of the final cryo-EM density maps (black), indicating average resolutions (FSC = 0.143, dashed black line), and FSC curves calculated between the cryo-EM density map and the final model (purple) as calculated by Relion.
Figure 3—figure supplement 2

Cryo-EM data processing scheme for EDF1-ribosome and Mbf1-ribosome datasets.
(A, B) In silico classification scheme. Intermediate densities are shown with the ribosome in grey and masked regions are colored. For details see experimental methods section for data processing.
Figure 4
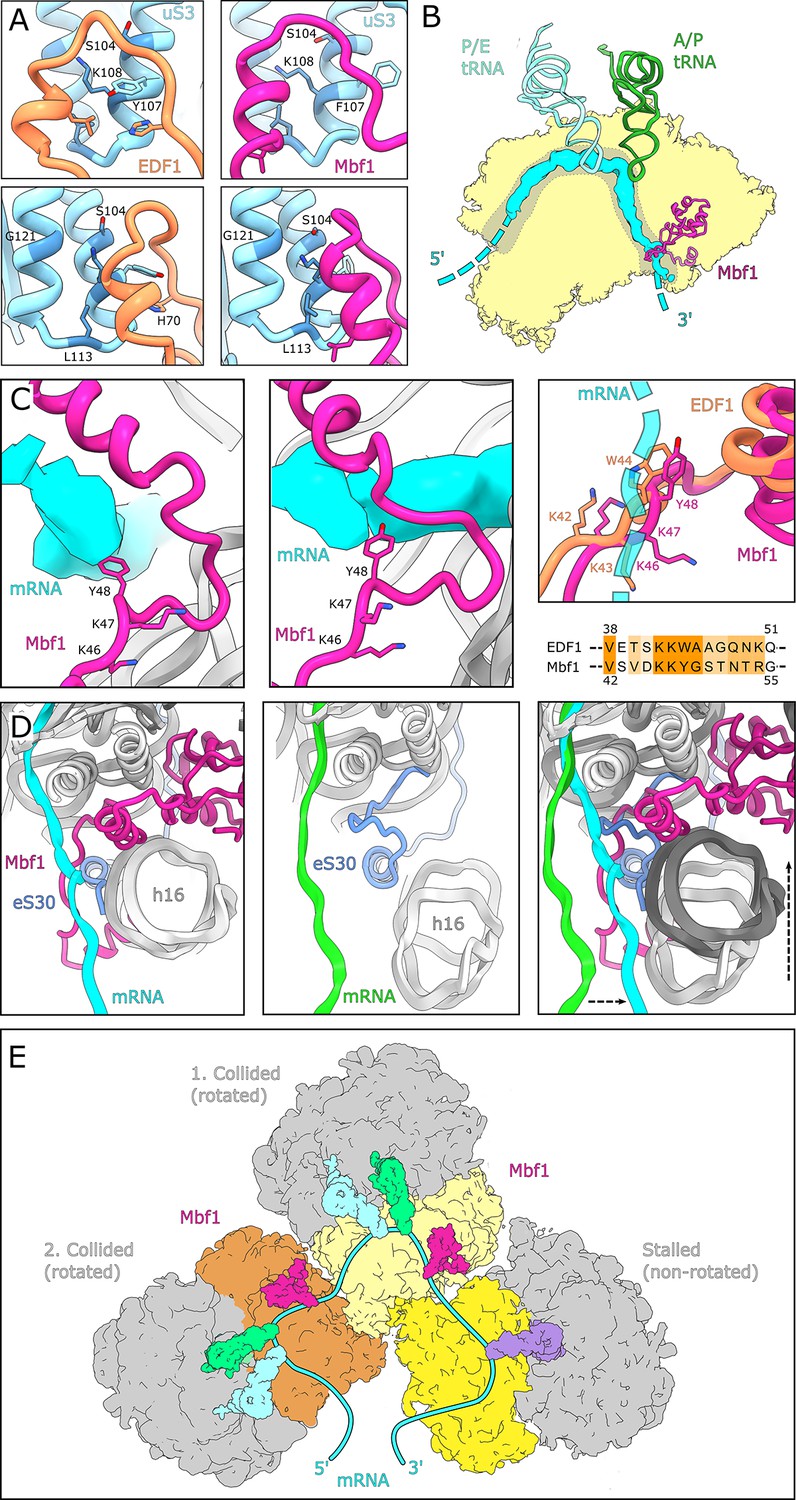
Interactions and functional implications of EDF1 and Mbf1.
(A) EDF1 (orange) and Mbf1 (violet red) interact with ribosomal protein uS3 via a helix-helix interaction. In the human structure, Y107 of uS3 is stacks with H70 of EDF1. Conserved residues required for frameshift inhibition in yeast are colored in steel blue. (B) Overview of Mbf1’s position with respect to the mRNA path on the 40S ribosomal subunit. (C) Mbf1 clamps the mRNA into a headlock, with the aromatic amino acid Y48 exposed to facilitate interaction with the mRNA. The KKY-motif is well conserved between Mbf1 and EDF1 (KKW). (D) Comparison of the mRNA path of a Mbf1-bound colliding ribosome with that of a canonical colliding ribosome (PDB: 6I7O). The mRNA and helix 16 are shifted in Mbf1-bound ribosomes. (E) Overview of the Mbf1-ribosome interaction in collided polysomes. Mbf1 binds the second and third ribosomes of the trisome unit.
Figure 5 with 1 supplement
Interaction analyses of EDF1 under basal growth and ribotoxic-stress conditions.
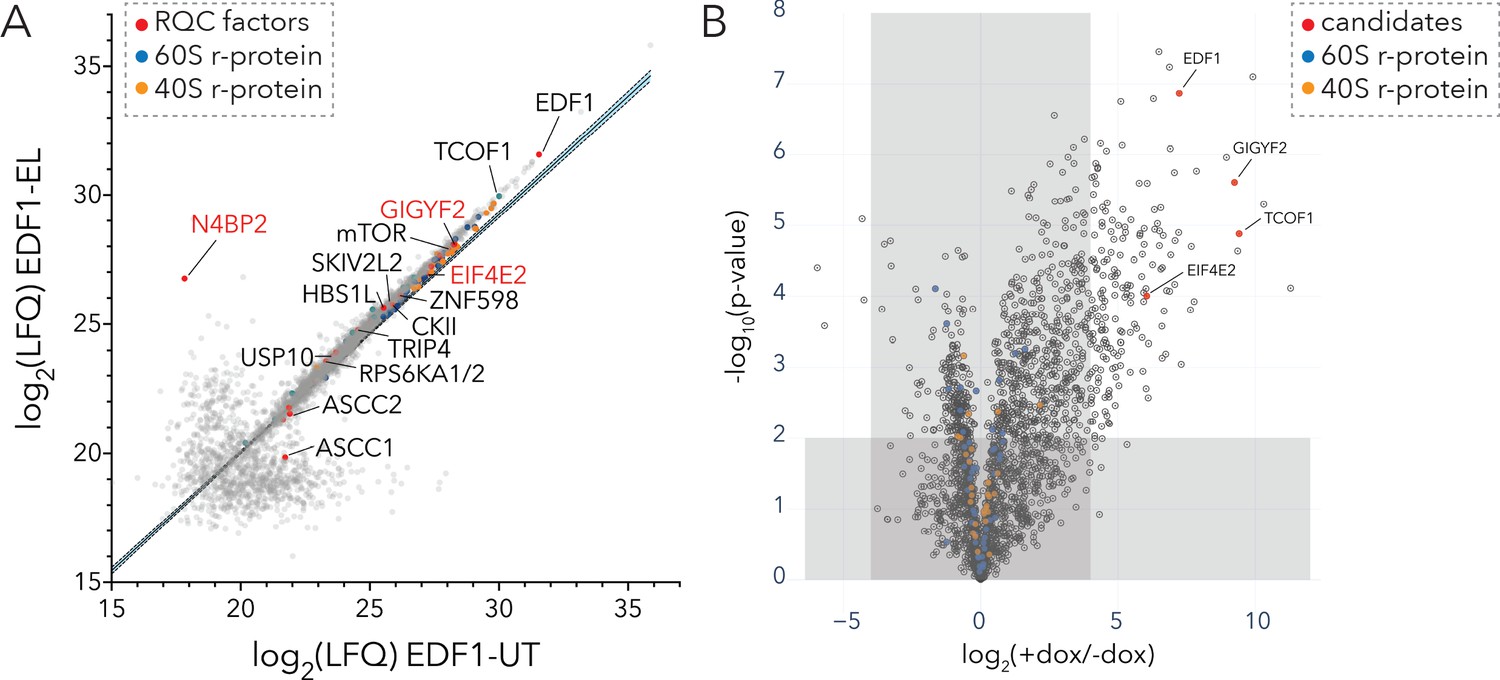
(A) Immunoaffinity purification of endogenous EDF1 from untreated (UT) or low dose emetine treated (EL; 1.8 µM, 15 min) HEK293T cells using Protein A-coupled EDF1-antibody. Scatter plot showing log2(LFQ) intensity of proteins identified under EL (y-axis) and UT (x-axis) conditions. (B) BioID analyses of BirA*-EDF1 with and without doxycycline induction. Volcano plot of fold change in protein LFQ intensity with or without BirA*-EDF1 expression induction by doxycycline (dox). Selected candidates highlighted in red. A cutoff of (+dox/-dox) ≥16 fold and p-value ≤ 0.01 was set to eliminate known BioID contaminants. See also Figure 5—figure supplement 1, Figure 5—source data 1, and Figure 5—source data 2.
-
Figure 5—source data 1
Related to Figure 5A; Immunoaffinity purification of endogenous EDF1 from untreated (UT) and 1.8 µM emetine treated (EL) HEK293T cells for 15 min.
- https://cdn.elifesciences.org/articles/58828/elife-58828-fig5-data1-v2.xlsx
-
Figure 5—source data 2
Related to Figure 5B and Figure 5—figure supplement 1B–1C; BioID analyses of BirA*-EDF1 with or without doxycycline induction for 16 hr.
- https://cdn.elifesciences.org/articles/58828/elife-58828-fig5-data2-v2.xlsx
Figure 5—figure supplement 1
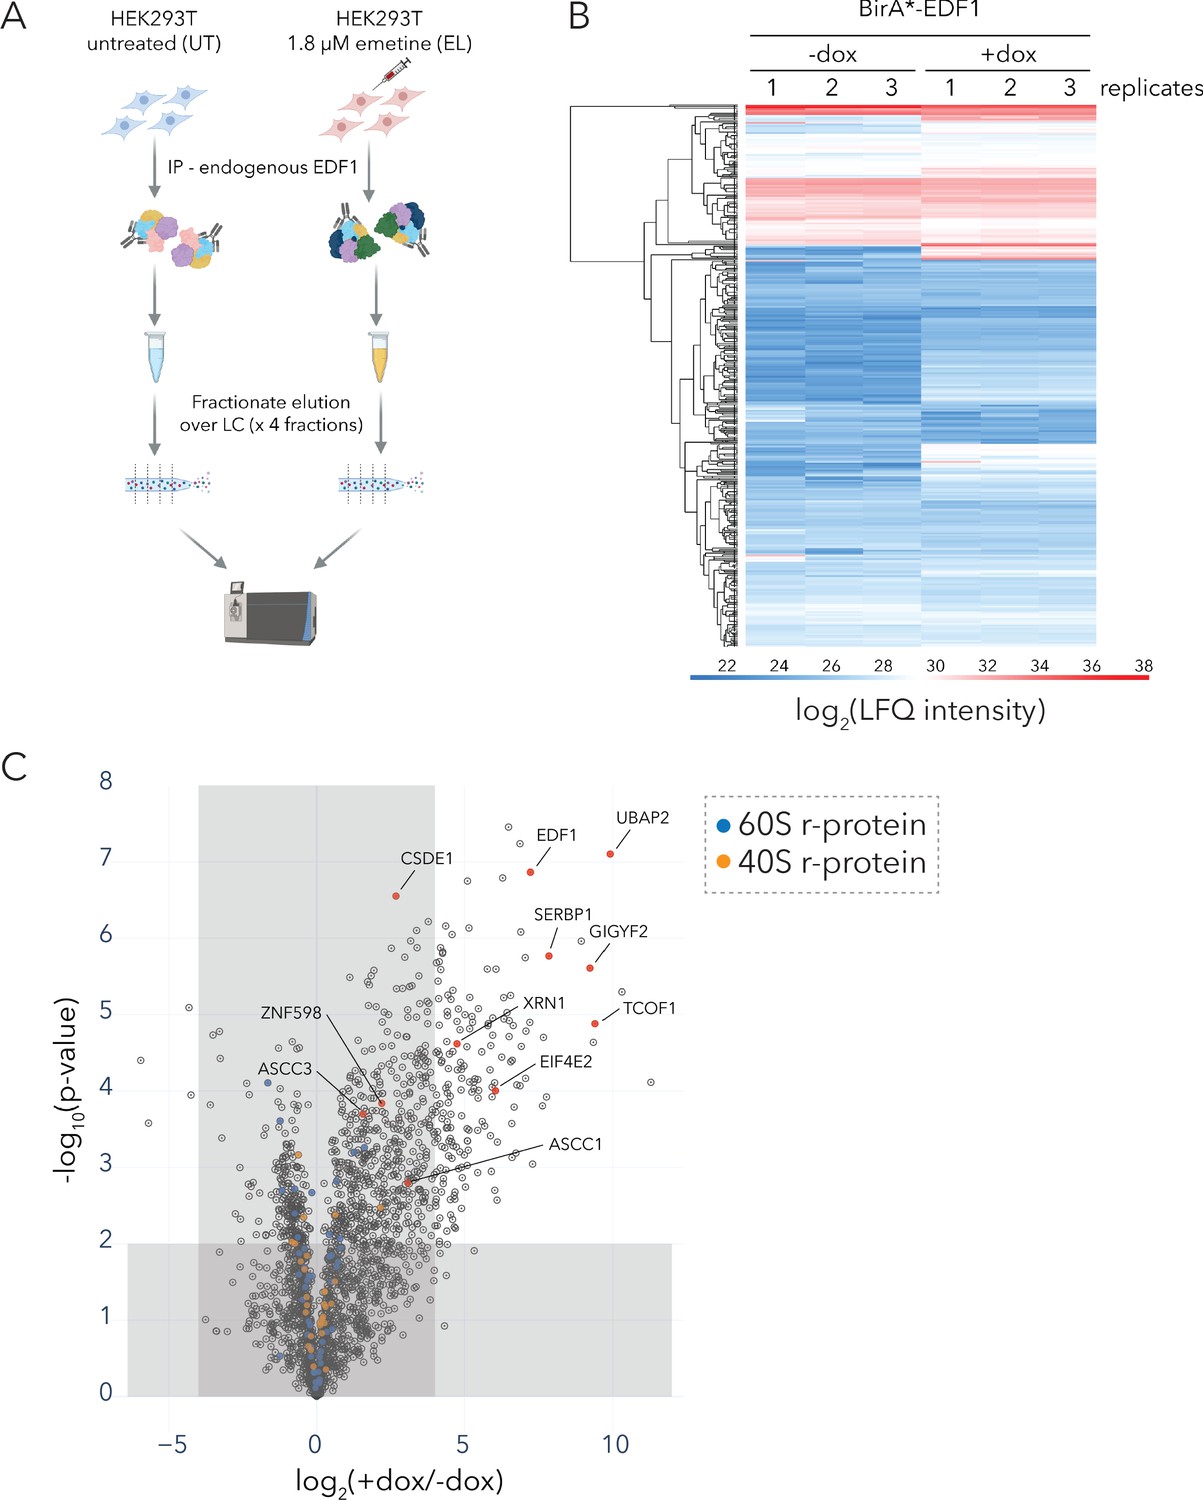
Schematic for AP-MS of endogenous EDF1, and analyses of BirA*-EDF1 interactors identified by BioID.
(A) Schematic for immunoaffinity purification of endogenous EDF1 from untreated (UT) or low dose emetine treated (EL; 1.8 µM, 15 min) HEK293T cells. (B) BioID analyses of BirA*-EDF1 with and without doxycycline induction for 16 hr. Hierarchical clustering of proteins identified with or without BirA*-EDF1 induction. Columns refer to LFQ intensity of replicates +/- doxycycline induction, rows represent individual proteins. (C) Volcano plot of fold change in protein intensity with or without BirA*-EDF1 induction against -log10(p-value). Exemplary interactors not depicted in Figure 5B now highlighted in red.
Figure 6 with 2 supplements

EDF1 recruits GIGYF2•EIF4E2 to collided ribosomes.
(A) (Left) UV (A258) absorbance across 10–50% sucrose gradients from lysates of HEK293 Flp-In TREx WT and ΔEDF1 cells left untreated (UT, blue trace) or treated with 1.8 µM emetine (EL, orange trace) for 15 min; fractions 6–8 pooled for light polysomes; fractions 9–11 pooled for heavy polysomes (n = 4). (Right) Schematic of polysome proteomics pipeline to monitor relative change in protein intensity in response to emetine treatment in light and heavy polysomes between WT and ΔEDF1 cells. (B, C) Volcano plot of log2 indicated ratio (x-axis) against -log10(p-value) (y-axis) for light (B) or heavy (B) polysomes. (D) UV (A258) absorbance across 10–50% sucrose gradients from lysates of HEK293-Flp-In TREx WT and ΔEDF1 cells left untreated (UT, blue trace) or treated with 1.8 µM emetine (EL, orange trace) for 15 min; TCA precipitated proteins from individual fractions were resolved by SDS-PAGE and analyzed by immunoblotting using GIGYF2 and uS3 antibodies. (n = 2) (E) Relative GFP intensity from HEK293 Flp-In TREx WT, ΔEDF1, ΔZNF598, and ΔEDF1ΔZNF598 cells transfected with the GFP-(KAAA)20-RFP stalling reporter without (white bars, non-targeting siRNA, SCRi) or with siRNA-mediated depletion of GIGYF2 and EIF4E2 (green bars; GIGYF2i•EIF4E2i). Error bars denote SD for n = 3. p-values were determined by one-way ANOVA and Tukey’s post hoc correction for multiple comparisons. See also Figure 6—figure supplement 1, Figure 6—figure supplement 2 and Figure 6—source data 1.
-
Figure 6—source data 1
Related to Figure 6B-C and Figure 6—figure supplement 1; Pooled sucrose gradient fractions (light and heavy polysomes) analysis with or without low-dose emetine treatment (1.8 µM, 15 min).
16plex TMT-MS3 analysis of HEK293 Flp-In T-REx cells (WT vs ΔEDF1).
- https://cdn.elifesciences.org/articles/58828/elife-58828-fig6-data1-v2.xlsx
Figure 6—figure supplement 1
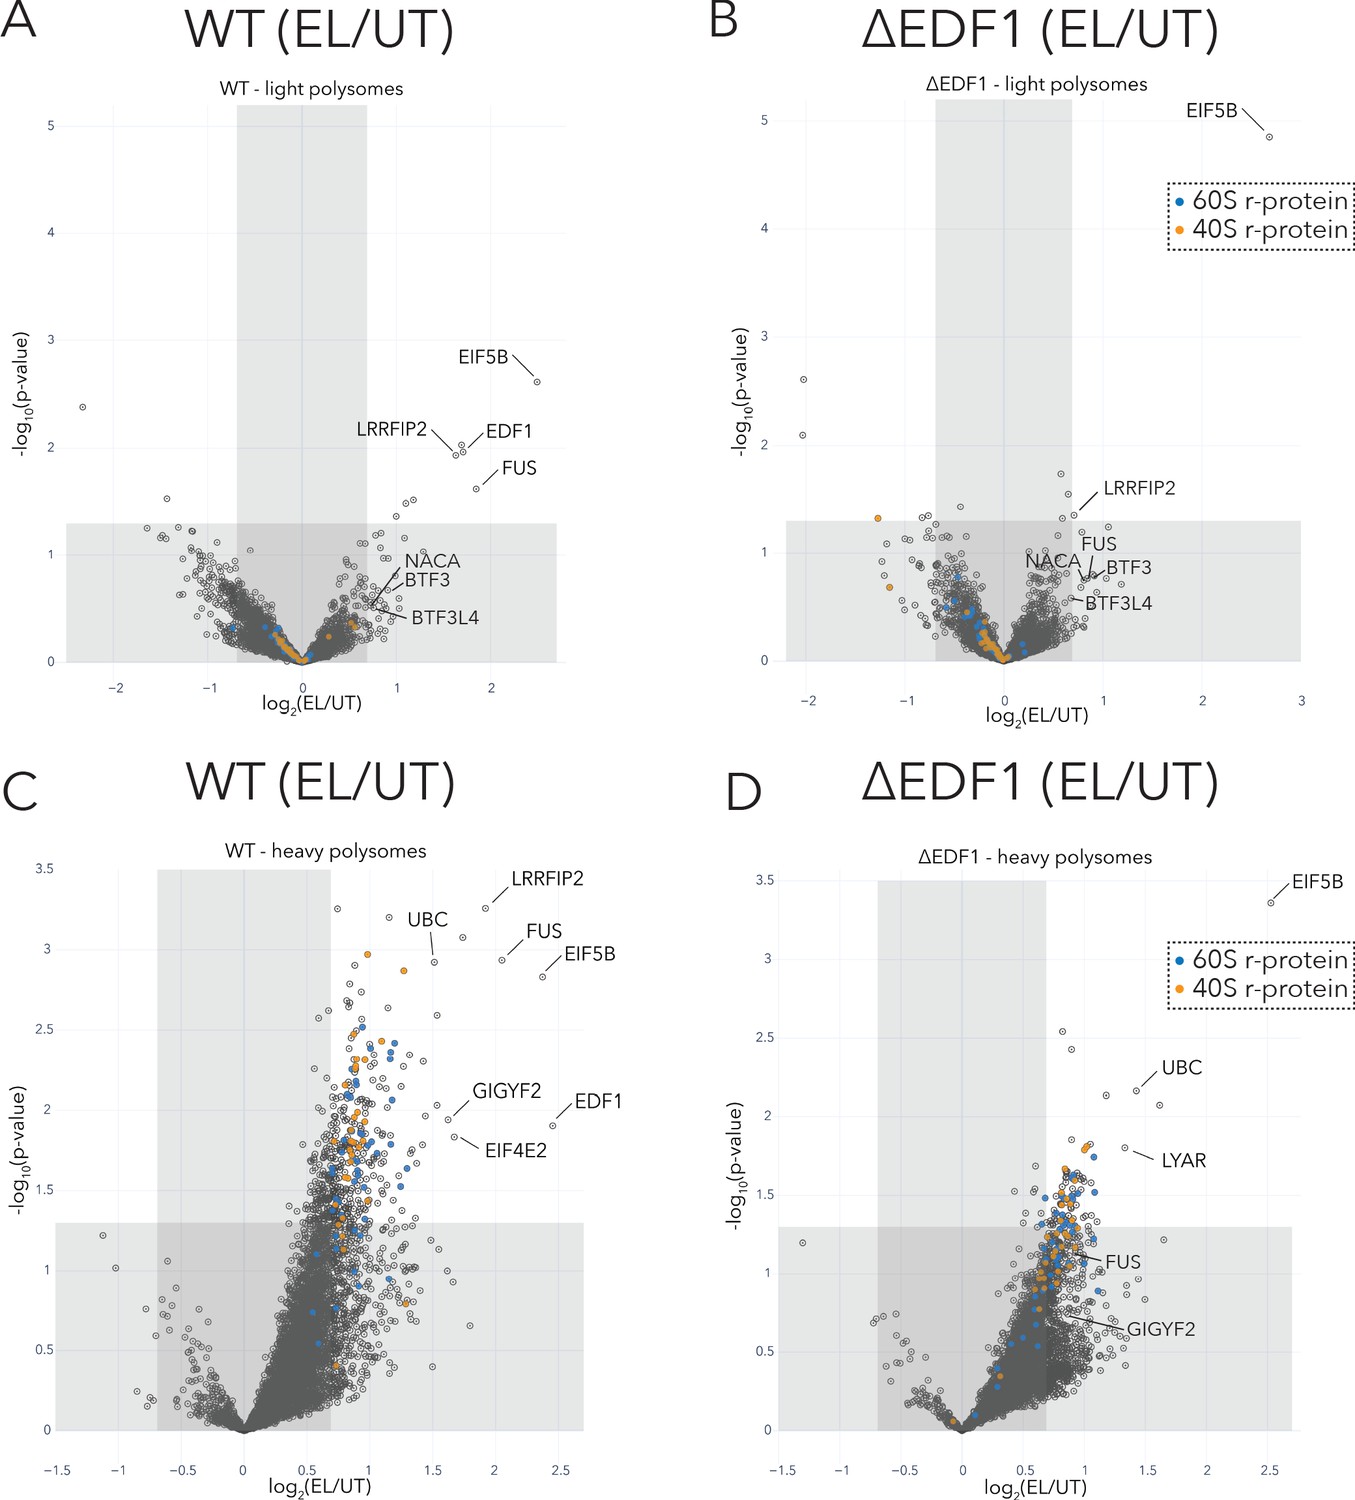
Identification of factors whose recruitment to collided ribosomes depends on EDF1.
(A) Volcano plot of the fold change in the intensity of proteins identified in light polysomes of low-dose emetine-treated HEK293-Flp-In TREx WT cells compared to untreated cells (log2(EL/UT), x-axis) against -log10(p-value) (y-axis). (B) Volcano plot of log2(EL/UT) against -log10(p-value) for light polysomes in HEK293-Flp-In TREx ΔEDF1 cells. (C) Volcano plot of log2(EL/UT) against -log10(p-value) for heavy polysomes in HEK293-Flp-In TREx WT cells. (D) Volcano plots of log2(EL/UT) against -log10(p-value) for heavy polysomes in HEK293-Flp-In TREx ΔEDF1 cells.
Figure 6—figure supplement 2

Loss of EDF1 and GIGYF2 increases the bulk translational output of polyA- and Xbp1u-mediated stalling reporters.
(A) Relative GFP intensity from HEK293-Flp-In TREx WT, GIGYF2i•EIF4E2i, ΔEDF1 and ΔEDF1 cell lines rescued with C-terminal Strep II-tagged full-length EDF1 (ΔEDF1:EDF1FL), or an N-terminal fragment of EDF1 (ΔEDF1:EDF1N-term, amino acids 1–74), or a C-terminal fragment of EDF1 (ΔEDF1:EDF1C-term, amino acids 73–148). Cells were transfected with the GFP-(KAAA)20-RFP stalling reporter. Error bars denote SD for n = 3. p-values were determined by one-way ANOVA and Tukey’s post hoc correction for multiple comparisons. (B) Whole cell extracts from ΔEDF1:EDF1FL, ΔEDF1:EDF1N-term and ΔEDF1:EDF1C-term cells were analyzed by SDS-PAGE and immunoblotted with a Strep II antibody. (C) 10–50% sucrose gradients from lysates of ΔEDF1:EDF1FL, ΔEDF1:EDF1N-term and ΔEDF1:EDF1C-term cells untreated (UT) or treated with low-dose emetine (EL, 1.8 µM, 15 min) were fractionated and analyzed by immunoblotting with a Strep II antibody. (D) Relative RFP:GFP ratio from HEK293 Flp-In TREx WT, ΔEDF1, ΔZNF598, and ΔEDF1ΔZNF598 cells transfected with the GFP-(KAAA)20-RFP stalling reporter without (white bars, non-targeting siRNA, SCRi) or with siRNA-mediated depletion of GIGYF2 and EIF4E2 (green bars; GIGYF2i•EIF4E2i). Error bars denote SD for n = 3. p-values were determined by one-way ANOVA and Tukey’s post hoc correction for multiple comparisons (related to Figure 6E). (E) The corresponding RFP:GFP ratios for the experiment described in A. Error bars, SD for n = 3. p-values were determined by one-way ANOVA and Tukey’s post hoc correction for multiple comparisons. (F) Relative GFP intensity from HEK293 Flp-In TREx WT, ΔEDF1, ΔZNF598, and ΔEDF1ΔZNF598 cells transfected with the GFP-RFP reporter with no intermediate stalling sequence [(KAAA)0 reporter] without (white bars, non-targeting siRNA, SCRi) or with siRNA-mediated depletion of GIGYF2 and EIF4E2 (green bars; GIGYF2i•EIF4E2i). Error bars represent SD for n = 3. p-values were determined by one-way ANOVA and Tukey’s post hoc correction for multiple comparisons. (G) The corresponding RFP:GFP ratios are depicted for the experiment described in F. (H) Relative Renilla luciferase (RLuc) intensity from HEK293 Flp-In TREx WT, ΔEDF1, ΔZNF598 cells, and ΔEDF1ΔZNF598 cells transfected with the RLuc-2A-XBP1u-2A-FLuc stalling reporter or a control reporter with no intervening XBP1u stalling sequence. Values for individual biological replicates (n = 5 or 6) plotted with median represented as black bar. p-values were determined by one-way ANOVA and Tukey’s post hoc correction for multiple comparisons. (I) The corresponding FLuc: RLuc ratios for the experiment described in H.
Figure 7 with 1 supplement

EDF1 is critical for JUN-centric transcriptional response to ribosomal collisions.
(A) Immunoblots of HEK293-Flp-In TREx WT cell extracts showing phosphorylation of JUN at serine 73, and ubiquitylation of eS10 in response to emetine treatment at the indicated concentrations for 15 min. (n = 2) (B) Schematic for RNA sequencing analyses of HEK293-Flp-In TREx WT and ΔEDF1 treated with 0 µM (UT) and 1.8 µM emetine for 30 (EL30) and 120 min (EL120). (C) Volcano plots of fold change of normalized transcript reads in emetine-treated compared to untreated samples for HEK293-Flp-In TREx WT cells at 30 (left) and 120 (right) minutes. (D) Scatter plot of log2(EL/UT) fold change of normalized transcript reads from emetine-treated HEK293-Flp-In TREx WT cells after 30 min (x-axis) or 120 min (y-axis). (E) Volcano plots of the ratio of fold change in normalized transcript abundance in response to emetine treatment between ΔEDF1 and WT cells at 30 (left) and 120 (right) minutes. (F) Normalized transcript reads of selected genes for untreated (UT) and 1.8 µM emetine treated samples at 30 (EL30) and 120 min (EL120) in WT (filled circle) and ΔEDF1 (open circle) cell lines. (G) Cartoon showing the multifaceted roles of EDF1 in coordinating different arms of the ribosome-mediated QC pathway and promoting a JUN-centric transcriptional program in response to ribosome collisions. See also Figure 7—figure supplement 1.
Figure 7—figure supplement 1
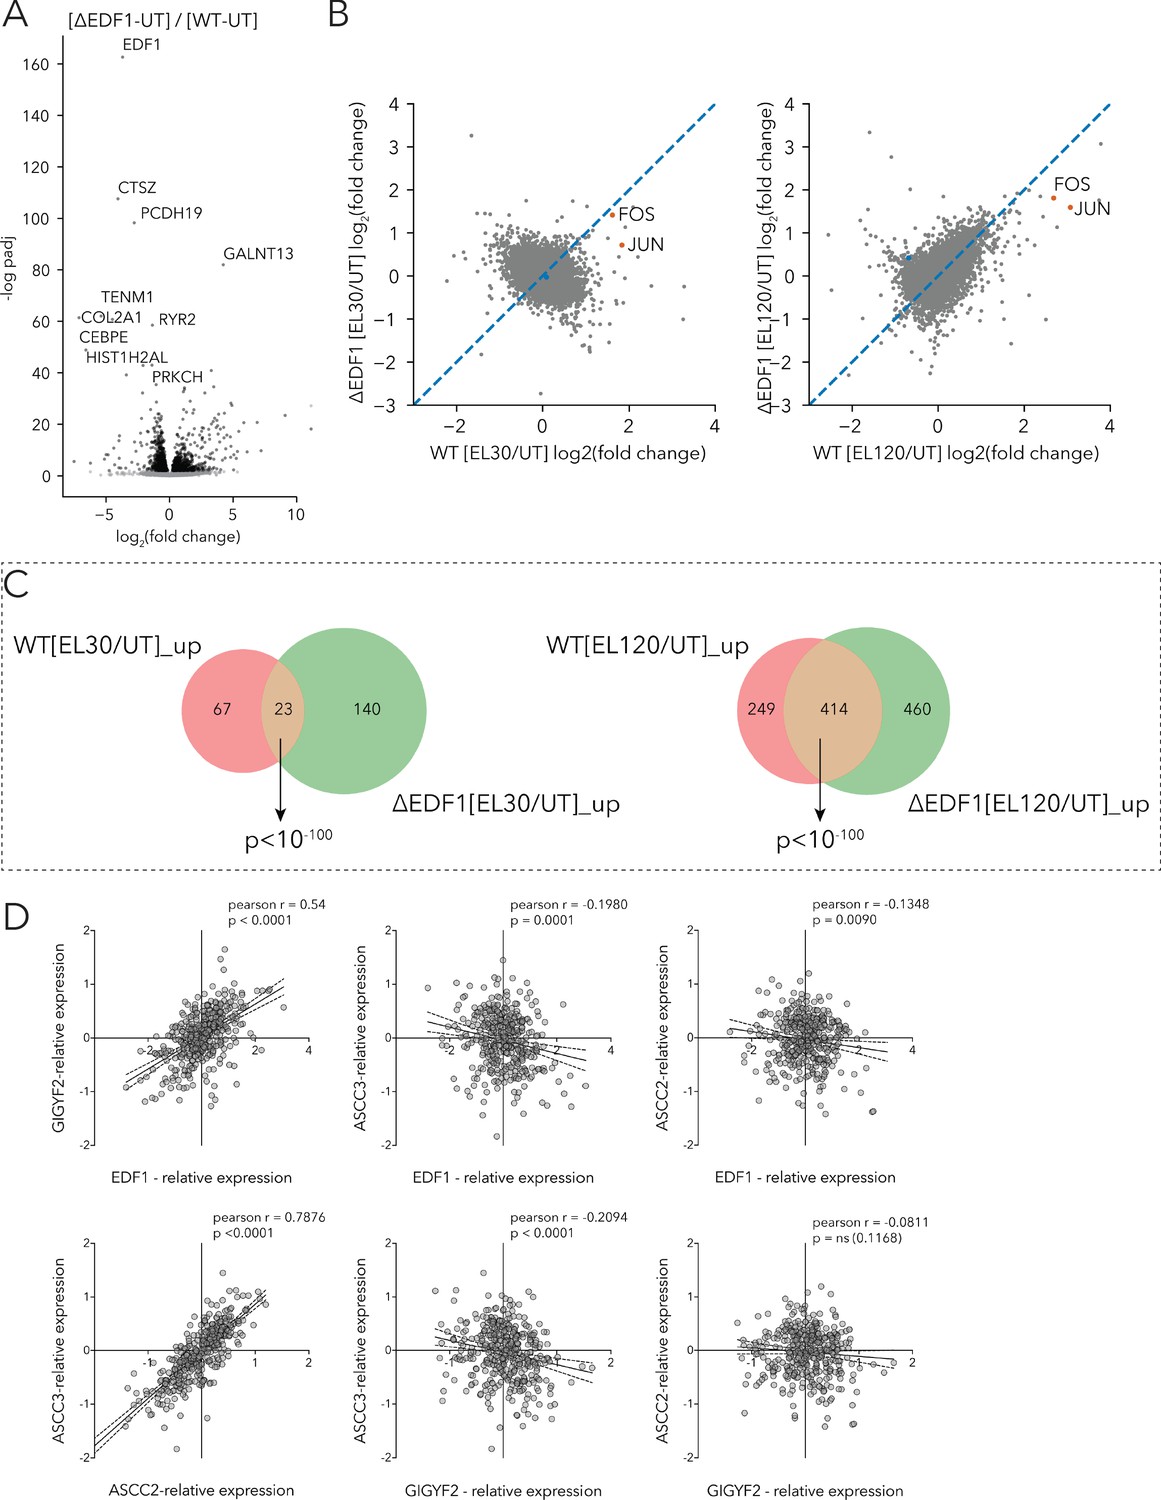
RNA sequencing analyses of WT and ΔEDF1 cells, and comparison of relative protein expression profiles of ribosome-mediated QC factors.
(A) Volcano plot of fold change in normalized transcript abundance in untreated ΔEDF1 and WT cells (log2[{ΔEDF1-UT}/{WT-UT}], x-axis) against -log10(p-value) (y-axis). (B) Scatter plots of fold change in normalized transcript abundance in response to emetine treatment between WT (log2[WT(EL/UT)], x-axis) and ΔEDF1 (log2[ΔEDF1(EL/UT)], y-axis) cells at 30 min (left) and at 120 min (right). (C) Overlap between genes upregulated in response to emetine treatment at 30 (left) and 120 min (right) in HEK293-Flp-In TREx WT compared to HEK293-Flp-In TREx ΔEDF1 cells. p-values computed using hypergeometric test. (D) Comparison of relative expression profiles of the indicated proteins across the proteome of 375 cell lines from the Cancer Cell Line Encyclopedia (Nusinow et al., 2020). Data were sourced from https://depmap.org. Pearson’s correlation coefficients (r) and two-tailed p-values for the indicated comparisons are reported.
Tables
Key resources table
| Reagent type (species) or resource | Designation | Source or reference | Identifiers | Additional information |
|---|---|---|---|---|
| Antibody | Anti-phospho-p38 (Thr180/Tyr182) (rabbit monoclonal) | Cell Signaling Technology | Cat #4511S RRID:AB_2139682 | WB (1:1000) |
| Antibody | Anti-p38 (rabbit polyclonal) | Cell Signaling Technology | Cat #9212 RRID:AB_330713 | WB (1:1000) |
| Antibody | Anti-β-actin (13E5)-HRP conjugate (rabbit monoclonal) | Cell Signaling Technology | Cat #5125 RRID:AB_1903890 | WB (1:1000) |
| Antibody | Anti-ASCC3 (rabbit polyclonal) | Bethyl Laboratories | Cat #A304-014A RRID:AB_2620362 | WB (1:1000) |
| Antibody | Anti-ZNF598 (rabbit polyclonal) | Bethyl Laboratories | Cat #A305-108A RRID:AB_2631503 | WB (1:2000) |
| Antibody | Anti-EDF1 (rabbit polyclonal) | Abcam | Cat #ab174651 | WB (1:1000) |
| Antibody | Anti-RACK1 (rabbit monoclonal) | Cell Signaling Technology | Cat #5432 RRID:AB_10705522 | WB (1:1000) |
| Antibody | Anti-FLAG (mouse monoclonal) | Sigma | Cat #A8592 RRID:AB_439702 | WB (1:1000) |
| Antibody | Anti-RPL10A (rabbit polyclonal) | Bethyl Laboratories | Cat #A305-062A RRID:AB_2631457 | WB (1:2000) |
| Antibody | Anti-RPS10 (eS10) (rabbit polyclonal) | LS Bio | Cat #LS-C335612-20 | WB (1:500) |
| Antibody | Anti-RPS20 (uS10) (rabbit monoclonal) | Abcam | Cat #ab133776 RRID:AB_2714148 | WB (1:1000) |
| Antibody | Anti-RPS3 (uS3) (rabbit polyclonal) | Abcam | Cat #ab140688 | WB (1:2000) |
| Antibody | Anti-GIGYF2 (mouse monoclonal) | Santa Cruz Biotechnology | Cat #Sc-393918 | WB (1:100) |
| Antibody | Anti-EIF4E2 (mouse monoclonal) | Novus Biological | Cat #H00009470-M01 RRID:AB_1505961 | WB (1:500) |
| Antibody | Anti-phospho-c-Jun (Ser73) (rabbit polyclonal) | Cell Signaling | Cat #9164 RRID:AB_330892 | WB (1:1000) |
| Antibody | Anti-c-Jun (60A8) (rabbit monoclonal) | Cell Signaling | Cat #9165 RRID:AB_2130165 | WB (1:1000) |
| Antibody | Anti-Strep II (rabbit polyclonal) | Novus Biologicals | Cat #NBP2-41075 | WB (1:1000) |
| Antibody | Mouse anti-rabbit IgG-HRP (mouse monoclonal) | Santa Cruz Biotechnology | Cat #sc-2357 RRID:AB_628497 | WB (1:5000) |
| Antibody | Goat anti-mouse IgG2a-HRP (goat polyclonal) | Jackson Immuno Research Laboratories Inc | Cat #115-035-2006 | WB (1:5000) |
| Antibody | anti-Diglycyl Lysine (Clone GX41) antibody (mouse monoclonal) | Millipore Sigma | Cat #MABS27 RRID:AB_10807824 | Ubiquitin remnant immunoaffinity profiling |
| Sequence-based reagent | CRISPR: EDF1 sgRNA exon 1 | GPP, Broad Institute | EDF1 sgRNA exon 1 | 5’-GAGCGACTGGGACACGGTGA-3’ |
| Sequence-based reagent | CRISPR: EDF1 sgRNA exon 3 | GPP, Broad Institute | EDF1 sgRNA exon 3 | 5’-ACATTCTATTACCAAGAACA-3’ |
| Sequence-based reagent | siRNA: ON-TARGETplus non-targeting control pool siRNA | Horizon Discovery | Cat #D-001810-01-50 | SMARTPool |
| Sequence-based reagent | siRNA: ON-TARGETplus RACK1 siRNA | Horizon Discovery | Cat #L-006876-00-0020 | SMARTPool |
| Sequence-based reagent | siRNA: ON-TARGETplus EDF1 siRNA | Horizon Discovery | Cat #L-009697-00-0020 | SMARTPool |
| Sequence-based reagent | siRNA: ON-TARGETplus Human GIGYF2 siRNA | Horizon Discovery | Cat #L-013918-01-0020 | SMARTPool |
| Sequence-based reagent | siRNA: ON-TARGETplus Human EIF4E2 siRNA | Horizon Discovery | Cat #L-019870-01-0020 | SMARTPool |
| Recombinant DNA reagent | pCMV-GFP-2A-VHP-(KAAA)20-2A-ChFP | Juszkiewicz and Hegde, 2017 | Addgene Cat #105688 | Stalling reporter based on poly(A) sequence |
| Recombinant DNA reagent | pCMV-GFP-2A-VHP-2A-ChFP (linker control) | Juszkiewicz and Hegde, 2017 | Addgene Cat #105686 | Linker control without the internal poly(A) stalling sequence |
| Recombinant DNA reagent | psiCHECK2-Renilla-2A-3xFLAG-MsXbp1u-2A-Firefly | Han et al., 2020 | N/A | Stalling reporter based on Xbp1u peptide stalling sequence |
| Recombinant DNA reagent | psiCHECK2-Renilla-2A-3xFLAG-2A-Firefly (linker control) | This study | N/A | Linker control without the internal Xbp1u stalling sequence |
| Recombinant DNA reagent | pOG44 Flp-recombinase expression vector | Thermo Fisher | Cat #V600520 | Expression of Flp recombinase in mammalian cells when co-transfected with pcDNA5/FRT plasmid. |
| Recombinant DNA reagent | pcDNA5-FRT-tetO-FLAG-BirA*-EDF1 | This study | N/A | Human EDF1 tagged with FLAG-BirA* at the N-terminus for mammalian expression. |
| Recombinant DNA reagent | pcDNA5-FRT-tetO-EDF1-FL (full-length) Strep II | This study | N/A | Human EDF1 tagged with Strep-II at the C-terminus for mammalian expression. |
| Recombinant DNA reagent | pcDNA5-FRT-tetO-EDF1-N-term (1-74) Strep II | This study | N/A | Human EDF1 truncation (amino acids 1–74) tagged with Strep-II at the C-terminus for mammalian expression. |
| Recombinant DNA reagent | pcDNA5-FRT-tetO-EDF1-C-term (73-148) Strep II | This study | N/A | Human EDF1 truncation (amino acids 73–148) tagged with Strep-II at the C-terminus for mammalian expression. |
| Recombinant DNA reagent | pcDNA5-FRT-tetO-3xFLAG-3C-EDF1 | This study | N/A | Human EDF1 tagged with 3xFLAG-HRV-3C at the N-terminus for mammalian expression. |
| Recombinant DNA reagent | pLentiCrisprV2 | Addgene | Cat #52961 RRID:Addgene_52961 | |
| Cell line (H. sapiens) | HEK293T WT | ATCC | CRL-3216 RRID:CVCL_0063 | |
| Cell line (H. sapiens) | HCT116 WT | ATCC | CCL-247 RRID:CVCL_0291 | |
| cell line (H. sapiens) | HCT116 ∆ZNF598 | Sundaramoorthy et al., 2017 | N/A | |
| cell line (H. sapiens) | HCT116 ZNF598-OE | Sundaramoorthy et al., 2017 | N/A | |
| cell line (H. sapiens) | HEK293-Flp-In T-REx-WT | Thermo Fisher | R78007 RRID:CVCL_U427 | |
| Cell line (H. sapiens) | HEK293-Flp-In T-REx-∆ZNF598 | Garzia et al., 2017 | N/A | |
| Cell line (H. sapiens) | HEK293-Flp-In T-REx-∆EDF1 #3–1 | This study | N/A | CRISPR/Cas9 targeting EDF1, clonal selection |
| Cell line (H. sapiens) | HEK293-Flp-In T-REx-∆EDF1∆ZNF598 #1–5 | This study | N/A | CRISPR/Cas9 targeting EDF1 and ZNF598, clonal selection |
| Cell line (H. sapiens) | HEK293-Flp-In T-REx-∆EDF1:EDF1-FL (full-length) Strep II | This study | N/A | ∆EDF1 cells co-transfected with pcDNA5-FRT-tetO-EDF1-FL (full-length) Strep II and pOG44 Flp-recombinase expression vectors, and selected with hygromycin. |
| Cell line (H. sapiens) | HEK293-Flp-In T-REx-∆EDF1:EDF1-N-term (1-74) Strep II | This study | N/A | ∆EDF1 cells co-transfected with pcDNA5-FRT-tetO-EDF1-N-term (1-74) Strep II and pOG44 Flp-recombinase expression vectors, and selected with hygromycin. |
| Cell line (H. sapiens) | HEK293-Flp-In T-REx-∆EDF1:EDF1-C-term (73-148) Strep II | This study | N/A | ∆EDF1 cells co-transfected with pcDNA5-FRT-tetO-EDF1-C-term (73-148) Strep II and pOG44 Flp-recombinase expression vectors, and selected with hygromycin. |
| Cell line (H. sapiens) | HEK293-Flp-In T-REx-3xFLAG-3C-EDF1 | This study | N/A | HEK293-Flp-In T-Rex co-transfected with pcDNA5-FRT-tetO-3xFLAG-3C-EDF1 and pOG44 Flp-recombinase expression vectors, and selected with hygromycin. |
| Chemical compound, drug | Emetine | Cayman Chemical | Cat #21048 | Used to induce ribosome collisions |
| Chemical compound, drug | Anisomycin | Sigma-Aldrich | Cat #A9789 | Used to induce ribosome collisions |
| Chemical compound, drug | Doxycycline | Sigma | D9891-10G | Used to induce gene expression in Flp-In T-Rex cell lines |
| Chemical compound, drug | Hygromycin | ThermoFisher | 10687010 | selection antibiotic |
| Chemical compound, drug | Puromycin | InvivoGen | ant-pr-1 | selection antibiotic |
| Other | Trypsin | Promega | V511C | |
| Other | Lys-C | Wako | 129–02541 | |
| Other | SUPERase•In RNase inhibitor | Ambion | AM2696 | |
| Peptide, recombinant protein | RNAse A | Ambion | AM2270 | |
| Peptide, recombinant protein | Superscript III | Invitrogen | 56575 | |
| Other | Gateway BP Clonase II Enzyme mix | ThermoFisher | 11789020 | |
| Other | Gateway LR Clonase II Enzyme Mix | ThermoFisher | 11791020 | |
| Peptide, recombinant protein | Turbo DNAse | ThermoFisher | AM2239 | |
| Other | Phosphatase inhibitor | Cell Signaling Technology | 5870S | |
| Other | cOmplete, EDTA-free Protease Inhibitor Cocktail | Roche | 5056489001 | |
| Other | Mammalian Protease Inhibitor Cocktail | Sigma | P8340-5mL | |
| Commercial assay, kit | Dual-Glo Luciferase Assay System | Promega | E2940 | |
| Commercial assay, kit | Direct-zolRNA Miniprep kit | Zymo Research | R2051 | |
| Commercial assay, kit | Zymo-Seq RiboFree Total RNA Library Kit | Zymo Research | R3000 | |
| Commercial assay, kit | Dynabeads Protein A | Thermo Fisher | 10008D | |
| Commercial assay, kit | Dynabeads Protein G | Thermo Fisher | 10009D | |
| Commercial assay, kit | ANTI-FLAG M2 Affinity Gel | Sigma-Aldrich | A2220 | |
| Commercial assay, kit | PierceStreptavidin-conjugated agarose beads | Thermo Fisher | 20353 | |
| Commercial assay, kit | TMT 6plex Label Reagent | Thermo Fisher | 90068 | |
| Commercial assay, kit | TMTpro 16plex Label Reagent | Thermo Fisher | A44520 | |
| Commercial assay, kit | 3M Empore SPE Disks C18 | Sigma | 66883 U | |
| Commercial assay, kit | Sep-Pak C18 Cartridge | Waters Corporation | WAT054960 and WAT054925 | |
| Commercial assay, kit | High pH Reversed-Phase Peptide Fractionation Kit | Thermo Fisher | 84868 | |
| Commercial assay, kit | Pierce Quantitative Colorimetric Peptide Assay | Thermo Fisher | 23275 | |
| Software, algorithm | Maxquant | Tyanova et al., 2016a | Version 1.6.10.43 RRID:SCR_014485 | Data analysis, mass spectrometry-based proteomics |
| Software, algorithm | Comet-based (v2018.01 rev.2) in-house software pipeline | Eng et al., 2013; Huttlin et al., 2010 | N/A | Data analysis, mass spectrometry-based proteomics |
| Software, algorithm | Perseus | Tyanova et al., 2016b | Version 1.6.10 RRID:SCR_015753 | Statistical analysis of proteomics data |
| Software, algorithm | Differential Expression Proteomics (DEP) | Zhang et al., 2018 | N/A | Statistical analysis of proteomics data |
| Software, algorithm | InCyte software for Guava easyCyte | Millipore Sigma | 0500–4120 | Data analysis for single-cell flow-cytometry |
| Software, algorithm | STAR | Dobin et al., 2013 | STAR_2.5.3a_modified RRID:SCR_015899 | RNA-seq aligner |
| Software, algorithm | Salmon | Patro et al., 2017 | Version 1.2.1 | Transcript quantification, RNA-seq |
| Software, algorithm | DESeq2 | Love et al., 2014 | Version 3.11 RRID:SCR_015687 | Differential gene expression analysis, RNA-seq |
| Software, algorithm | Gencode | Frankish et al., 2019 | v33 RRID:SCR_014966 | Genome annotation, RNA-seq |
| Software, algorithm | Custom software (Python 2.7) for RNA sequencing analysis | https://github.com/greenlabjhmi/EDF1_elife_2020 (Zinshteyn and Green, 2020; copy archived at https://github.com/elifesciences-publications/EDF1_elife_2020) | Analyses and visualization of RNA-seq data | |
| Software, algorithm | Relion | Zivanov et al., 2018 | 3.0 and 3.1 RRID:SCR_016274 | Single particle analyses and reconstruction, cryo-EM |
| Software, algorithm | PHENIX | Adams et al., 2010 | 1.18 | Tool for automated structure refinement, cryo-EM |
| Software, algorithm | WinCOOT | Emsley et al., 2010 | 0.8.9.2 | Model building, refinement and validation, Cryo-EM |
| Software, algorithm | ChimeraX | Goddard et al., 2018 | 1.0 | Visualization of cryo-EM data |
| Software, algorithm | GraphPad Prism | GraphPad Software Inc | Version 8.4.1 | Statistical analysis, graphs |
Additional files
Download links
A two-part list of links to download the article, or parts of the article, in various formats.
Downloads (link to download the article as PDF)
Open citations (links to open the citations from this article in various online reference manager services)
Cite this article (links to download the citations from this article in formats compatible with various reference manager tools)
EDF1 coordinates cellular responses to ribosome collisions
eLife 9:e58828.
https://doi.org/10.7554/eLife.58828


