NHR-49/PPAR-α and HLH-30/TFEB cooperate for C. elegans host defense via a flavin-containing monooxygenase
- Department of Microbiology and Physiological Systems, UMass Medical School, United States
- Department of Medical Genetics, University of British Columbia, Canada
- Department of Pediatrics, University of Pittsburgh School of Medicine, United States
- Department of Developmental Biology, University of Pittsburgh School of Medicine, United States
- Department of Cell Biology, University of Pittsburgh School of Medicine, United States
- Department of Physiology, University of Pittsburgh School of Medicine, United States
Abstract
The model organism Caenorhabditis elegans mounts transcriptional defense responses against intestinal bacterial infections that elicit overlapping starvation and infection responses, the regulation of which is not well understood. Direct comparison of C. elegans that were starved or infected with Staphylococcus aureus revealed a large infection-specific transcriptional signature, which was almost completely abrogated by deletion of transcription factor hlh-30/TFEB, except for six genes including a flavin-containing monooxygenase (FMO) gene, fmo-2/FMO5. Deletion of fmo-2/FMO5 severely compromised infection survival, thus identifying the first FMO with innate immunity functions in animals. Moreover, fmo-2/FMO5 induction required the nuclear hormone receptor, NHR-49/PPAR-α, which controlled host defense cell non-autonomously. These findings reveal an infection-specific host response to S. aureus, identify HLH-30/TFEB as its main regulator, reveal FMOs as important innate immunity effectors in animals, and identify the mechanism of FMO regulation through NHR-49/PPAR-α during S. aureus infection, with implications for host defense and inflammation in higher organisms.
Introduction
In their natural habitat, C. elegans feed on microbes that grow on rotting vegetable matter, and thus face a high likelihood of ingesting pathogens (Schulenburg and Félix, 2017). To defend against infection, C. elegans possess innate host defense mechanisms that promote their survival (Ermolaeva and Schumacher, 2014; Kim and Ewbank, 2018). In the laboratory, model human pathogenic bacteria cause intestinal pathology and death through poorly understood mechanisms (Irazoqui et al., 2010a). Infected animals experience both chemical signals that reveal the pathogen’s presence and organismal stress caused by the infection. Over the last 15 years, several studies have identified and characterized C. elegans gene expression changes in response to pathogenic bacteria, fungi, and viruses, mounted through evolutionarily conserved mechanisms (Irazoqui et al., 2010b; Kim and Ewbank, 2018). However, the relative contributions of pathogen sensing and organismal stress mechanisms to the total pathogen-induced response remain unclear.
We previously showed that ingested Gram-positive bacterium Staphylococcus aureus causes drastic cytopathology in C. elegans (Irazoqui et al., 2010a). Infection with S. aureus results in progressive effacement and lysis of intestinal epithelial cells, whole-body cellular breakdown, and death (Irazoqui et al., 2010a). Therefore, S. aureus-infected C. elegans experience dietary changes from its laboratory food of nonpathogenic E. coli, as well as intestinal destruction, cellular stress, and putative molecular signals produced by the pathogen.
In previous work, we showed that C. elegans mount a pathogen-specific transcriptional host response against S. aureus, which includes genes that encode antimicrobial proteins (e.g. lysozymes, antimicrobial peptides, and secreted C-type lectins) and cytoprotective factors (e.g. autophagy genes, lysosomal factors, and chaperones) that are necessary and sufficient for survival (Irazoqui et al., 2010a). Moreover, we discovered that C. elegans still induced select host defense genes even when exposed to heat-killed S. aureus, which did not cause intestinal destruction (Irazoqui et al., 2010a). However, the relative contributions of organismal stress and pathogen detection to the induction of the overall host defense response remain unknown.
We recently discovered that the induction of a large majority of the transcriptional host response to S. aureus requires HLH-30, the C. elegans homolog of mammalian transcription factor EB (TFEB) (Visvikis et al., 2014). TFEB belongs to the MiT family of transcription factors, which in mammals and C. elegans controls the transcription of autophagy and lysosomal genes in response to nutritional stress in addition to infection (Lapierre et al., 2013; Raben and Puertollano, 2016). HLH-30 and TFEB also regulate lipid store mobilization during nutritional deprivation (O'Rourke and Ruvkun, 2013; Settembre et al., 2013). Thus, HLH-30/TFEB could potentially integrate organismal stress, metabolism, and pathogen recognition to elicit coordinated host responses to infection. How HLH-30/TFEB integrates this information to produce stress-specific responses and what other factors are involved in such specificity are poorly understood. Specifically, the genes that are induced during infection independently of nutritional stress are not known.
Here, we report that S. aureus infection in C. elegans elicits a transcriptional response that is distinct from that induced by nutritional deprivation, thus defining an infection-specific transcriptional signature. Both the starvation response and the infection-specific signature were largely dependent on HLH-30/TFEB, highlighting its key role as a transcriptional integrator of organismal stress during infection. Moreover, we identified six genes that were specifically induced during infection even in the absence of HLH-30/TFEB, potentially revealing an alternative transcriptional host response signaling pathway. The induction of two of the six genes, fmo-2/FMO5 and K08C7.4, was entirely dependent on transcription factor NHR-49/PPAR-α (Van Gilst et al., 2005), suggesting that NHR-49/PPAR-α defines an additional host defense pathway during S. aureus infection. NHR-49/PPAR-α was required non cell-autonomously for fmo-2/FMO5 induction and host defense against S. aureus. Moreover, functional characterization of fmo-2/FMO5 suggested that its enzymatic activity is specifically required for host defense against S. aureus, revealing that FMO-2/FMO5 is a key host defense effector. Thus, our work demonstrates for the first time that flavin-containing monooxygenases are important for host defense against infection in animals.
Results
Starvation and infection trigger distinct transcriptional responses
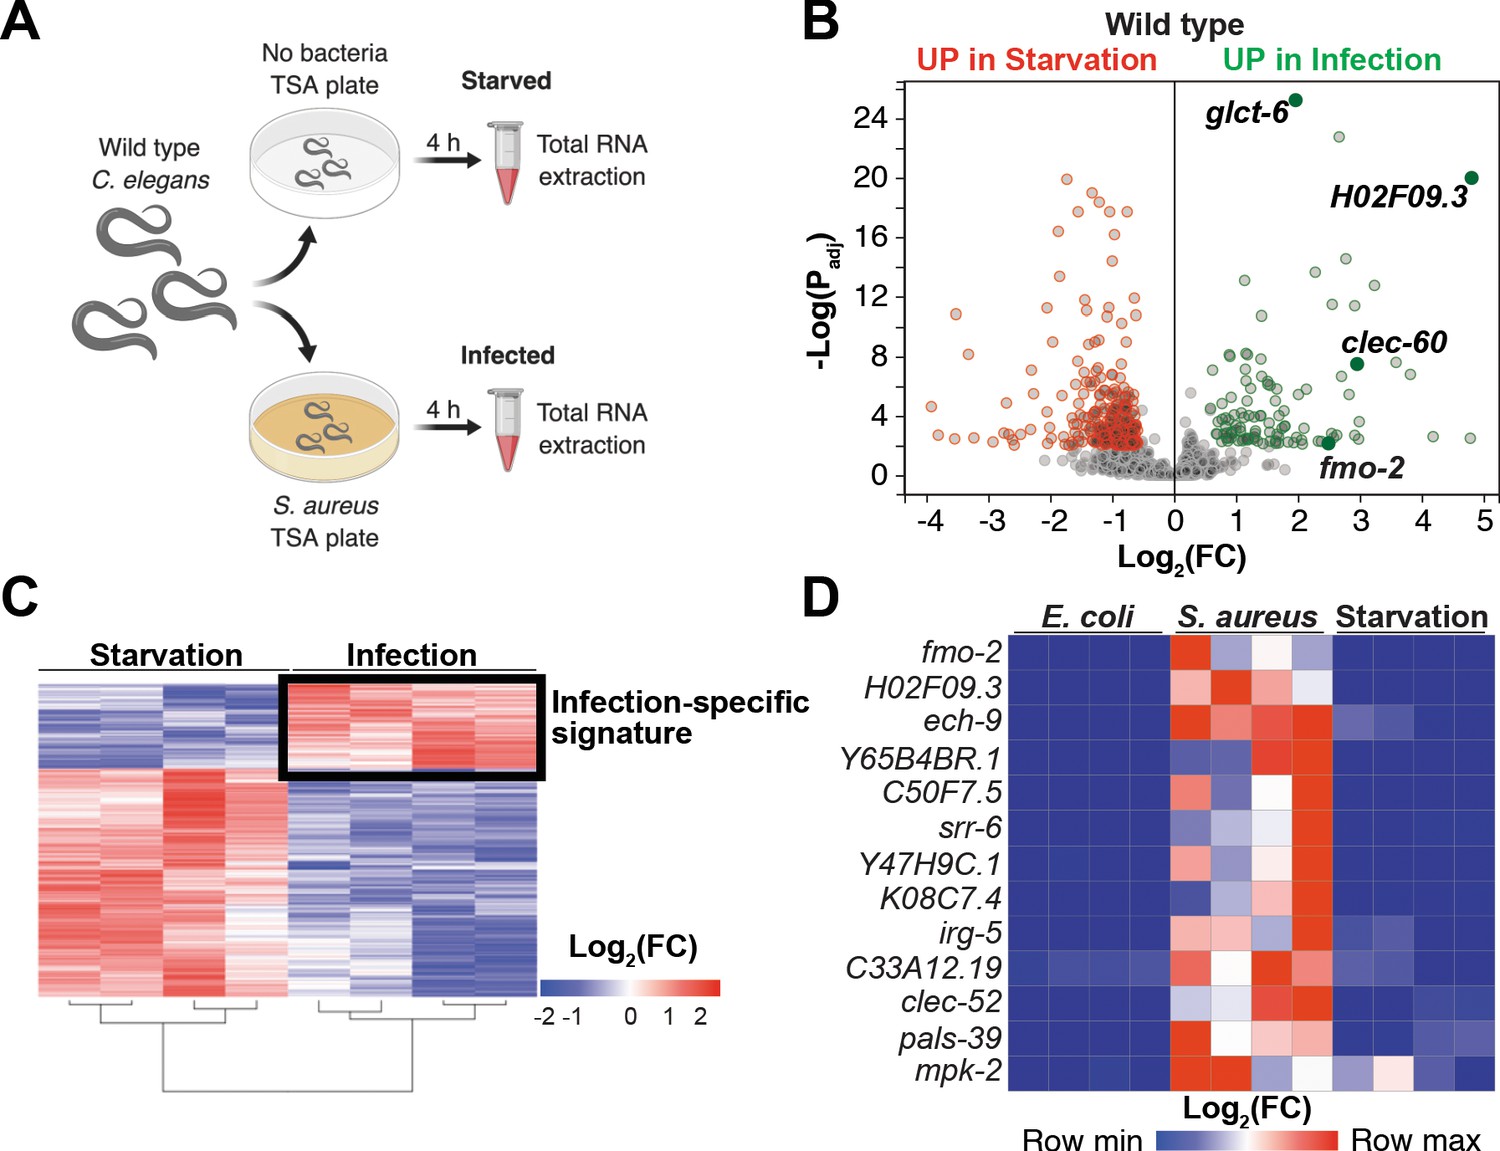
Our prior studies showed that S. aureus infection of C. elegans causes a robust host transcriptional response that results in the upregulation of 825 genes (Irazoqui et al., 2010a). Moreover, the ‘early’ phase of this response was already upregulated by 4 hr infection (Irazoqui et al., 2010a). It is likely that this transcriptional response to infection is compounded with nutritional stress, due to nutritional differences between laboratory food (nonpathogenic E. coli) and S. aureus, and due to intestinal destruction caused by the pathogen (Irazoqui et al., 2010a). To identify genes that are induced during infection independently of nutritional stress, we used whole-animal RNA-seq to directly compare infected and starved animals (Figure 1A). We identified 388 genes that were differentially expressed between these two conditions (Figure 1B,C, Supplementary file 1). About 70% (283) of differentially expressed genes were upregulated by starvation, while about 30% (105) were upregulated by infection (Supplementary file 1). Gene ontology (GO) analysis showed the starvation-induced genes to belong mostly to metabolic processes, whereas the infection-specific signature was highly enriched for innate immune response genes (Supplementary file 2). RT-qPCR of the 13 most highly infection-induced genes relative to animals that were starved or fed nonpathogenic E. coli laboratory food confirmed their S. aureus -specific induction (Figure 1D, Figure 1—figure supplement 1A). Thus, we identified an infection-specific signature of genes that excludes expression changes that are caused by starvation, indicating that the host responses to nutritional deprivation and S. aureus infection have distinct and specific features.
Figure 1 with 1 supplement see all
Starvation and S. aureus infection trigger distinct transcriptional responses.
(A) Schematic overview of experimental approach for RNA-seq conditions. Synchronized young adults were subjected to either starvation or infection for 4 hr before RNA extraction. (B) Volcano plot of differentially expressed genes (Padj ≤ 0.01). Genes that were induced in each condition relative to the other are indicated in red (for starvation) and green (for infection). FC, fold change. Padj, adjusted p value. (C) Heat map of differentially expressed genes [Log2(FC)] comparing infection with S. aureus SH1000 to starvation by RNA-seq. The boxed area represents the designated infection-specific expression signature. (D) Heat map of a set of 13 genes most highly induced by S. aureus SH1000 compared to starvation, whose relative transcript levels were measured by RT-qPCR and plotted as row-normalized log2(relative expression), or -ΔCt. Conditions include nonpathogenic E. coli, S. aureus (4 hr), and starvation (4 hr). Columns represent independent biological replicates.
HLH-30/TFEB is critical for host responses to starvation and infection
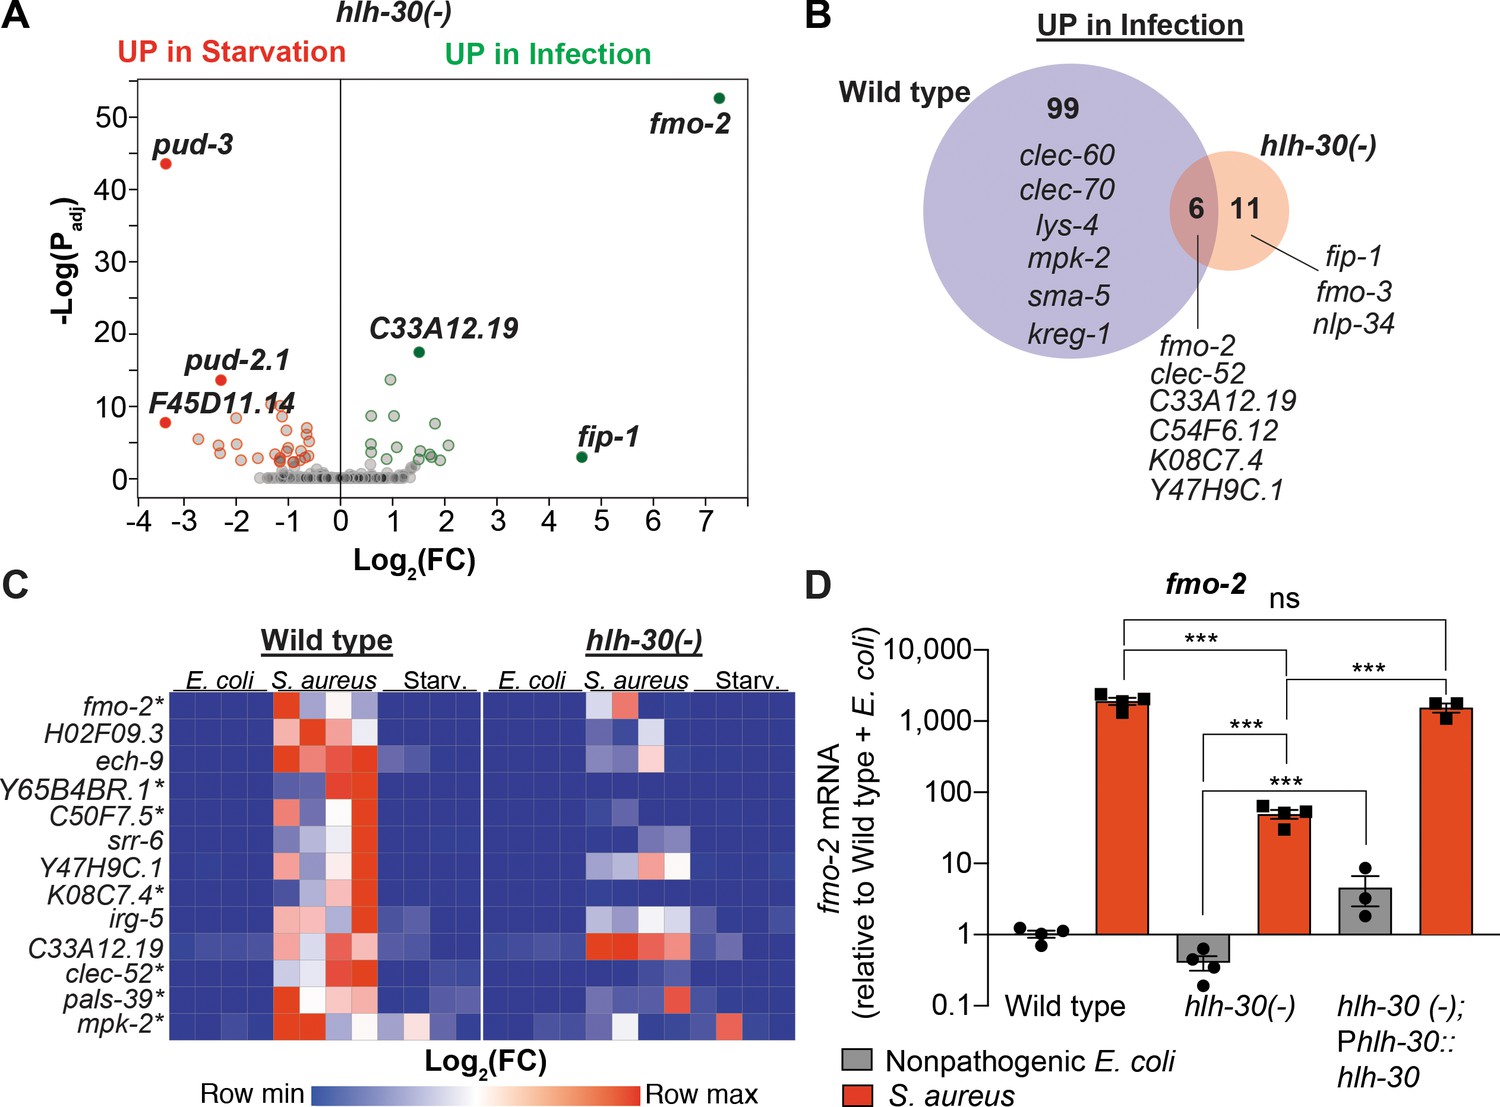
HLH-30/TFEB was shown to be important for gene induction during dietary challenge and during infection (O'Rourke and Ruvkun, 2013; Settembre et al., 2013; Visvikis et al., 2014). However, whether HLH-30/TFEB regulates the infection-specific response was not known. To assess the relevance of HLH-30/TFEB to the infection-specific signature, we compared starved and infected hlh-30/TFEB loss-of-function mutants by RNA-seq. To our surprise, in hlh-30/TFEB mutants differential gene expression between starvation and infection was almost completely abrogated (Figure 2A, Supplementary file 3). Of the 105 genes in the infection-specific signature, only six were induced in hlh-30/TFEB mutants (Figure 2B), including clec-52, fmo-2/FMO5, and the uncharacterized genes C33A12.19, C54F6.12, K08C7.4, and Y47H9C.1 (Supplementary file 3). RT-qPCR confirmed the predicted results for the selected 13 top induced genes (Figure 2C, Figure 1—figure supplement 1B). Particularly, we verified that fmo-2/FMO5 was partially induced in hlh-30/TFEB mutants compared to wild type (Figure 2D). Partial induction of fmo-2/FMO5 in hlh-30/TFEB mutants was rescued by transgenic re-expression of hlh-30/TFEB driven by its endogenous promoter (Figure 2D). Altogether, these results showed that HLH-30/TFEB is crucial for both the starvation and the infection-specific responses, and hinted at an HLH-30/TFEB-independent pathway for the induction of six infection-specific genes.
Figure 2
HLH-30/TFEB is critical for host responses to starvation and infection.
(A) Volcano plot of differentially expressed genes in hlh-30/TFEB loss-of-function mutants (PAdj. ≤0.01). Genes that were induced in each condition relative to the other are indicated in red (for starvation) and green (for infection). (B) Venn diagram representing genes that were upregulated during infection compared to starvation in wild type and hlh-30/TFEB mutants. A few selected genes are indicated for reference. (C) Heat map of RT-qPCR (-ΔCt) relative expression values of a set of 13 genes most highly induced by S. aureus v starvation , measured in wild type and hlh-30/TFEB mutants. Conditions include nonpathogenic E. coli, S. aureus, and starvation. Columns represent independent biological replicates. * indicates genes that were highly induced in wild type compared to hlh-30/TFEB mutants during infection, and thus were partially or completely HLH-30/TFEB-dependent. 'Starv.', starvation. (D) RT-qPCR of fmo-2/FMO5 transcript in wild type, hlh-30/TFEB loss-of-function mutants, and hlh-30(-); Phlh-30::hlh-30::gfp (complemented) animals fed nonpathogenic E. coli or infected with S. aureus (4 hr). Data are normalized to wild-type fed nonpathogenic E. coli, means ± SEM (3–4 independent biological replicates). ***p≤0.001, ns = not significant, one-way ANOVA followed by Šídák’s test for multiple comparisons.
-
Figure 2—source data 1
fmo-2 mRNA levels in wild type, hlh-30(-), and hlh-30(-); Phlh-30::hlh-30::gfp (complemented) animals fed nonpathogenic E. coli or infected with S. aureus.
- https://cdn.elifesciences.org/articles/62775/elife-62775-fig2-data1-v3.xlsx
Infection induces fmo-2/FMO5 via NHR-49/PPAR-α
As the most highly induced infection-specific gene in hlh-30/TFEB mutants (Figure 2A, Supplementary file 3), fmo-2/FMO5 attracted our attention. As shown previously (Irazoqui et al., 2010a) fmo-2/FMO5 expression was induced several thousand-fold in S. aureus-infected animals relative to nonpathogenic E. coli controls (Figure 3—figure supplement 1A). In contrast, animals infected with Gram-negative pathogen Pseudomonas aeruginosa exhibited no significant change (Figure 3—figure supplement 1A), consistent with previous results (Irazoqui et al., 2008; Irazoqui et al., 2010a; Wong et al., 2007). The fluorescent in vivo fmo-2/FMO5 transcriptional reporter showed faint GFP expression, mostly in the anterior intestine and head of noninfected animals (Figure 3—figure supplement 1B). Starvation modestly increased GFP expression in the intestine and nervous system (Figure 3—figure supplement 1C), while P. aeruginosa seemed to repress it below the levels observed in noninfected animals (Figure 3—figure supplement 1D) but upon quantification the difference was not significant (Figure 3—figure supplement 1F). In stark contrast, S. aureus caused high GFP induction in all tissues, except in gonads and eggs (Figure 3—figure supplement 1E). These observations confirmed that fmo-2/FMO5 is strongly induced in a pathogen-specific manner. Our prior studies also showed that infection causes fmo-2/FMO5 induction independently of previously identified host defense pathways, including p38 MAPK, TGF-β, ERK, insulin, Wnt, and HIF-1 pathways (Irazoqui et al., 2008; Irazoqui et al., 2010a; Luhachack et al., 2012; Visvikis et al., 2014). Additionally, we found that fmo-2/FMO5 can be partially induced independently of HLH-30/TFEB (Figure 2 and Visvikis et al., 2014). Therefore, additional transcriptional regulators must be involved in fmo-2/FMO5 induction.
Previous studies identified NHR-49, a nuclear receptor homologous to human PPAR-α and HNF4-α, as essential for fmo-2/FMO5 induction during exogenous oxidative stress (Goh et al., 2018; Hu et al., 2018). To examine the role of NHR-49/PPAR-α during S. aureus infection, we measured fmo-2/FMO5 expression in nhr-49/PPARA null mutants (Liu et al., 1999; Van Gilst et al., 2005). We found that in these mutants, expression of the fmo-2/FMO5 fluorescent transcriptional reporter was barely induced (Figure 3F,G) and, importantly, was undetectable in the intestinal epithelium (Figure 3H–K). In contrast, fmo-2/FMO5 induction by S. aureus was partially dependent on hlh-30/TFEB, as predicted by RNA-seq (Figure 3A–D and G, Figure 2); in these mutants, expression was preserved in the pharyngeal isthmus, pharyngeal-intestinal valve, and in the intestinal epithelium, albeit to lower levels compared to wild type (Figure 3H,I and K). Thus, nhr-49/PPARA appeared to be essential for the induction of fmo-2/FMO5 in the entire body. Consistently, noninfected nhr-49/PPARA mutants exhibited about 10-fold lower fmo-2/FMO5 expression than wild type by RT-qPCR (Figure 3L). After infection, nhr-49/PPARA mutants completely failed to induce fmo-2/FMO5 (Figure 3L). Transgenic rescue of nhr-49/PPARA driven by its endogenous promoter partially restored fmo-2/FMO5 induction (Figure 3L). Therefore, nhr-49/PPARA was absolutely required for fmo-2/FMO5 expression in infected and noninfected animals.
Figure 3 with 3 supplements see all

Infection induces fmo-2/FMO5 via NHR-49/PPAR-α.
(A–F) Epifluorescence micrographs of animals carrying Pfmo-2::nls::gfp in wild type (A, B), hlh-30/TFEB (C, D), and nhr-49/PPARA mutant backgrounds (E, F) after feeding on E. coli OP50 or infection with S. aureus SH1000 (4 hr). Scale bar = 1000 μm. (G) Quantification of whole-animal Pfmo-2::nls::gfp fluorescence in wild type, hlh-30/TFEB, and nhr-49/PPARA mutant animals after feeding on nonpathogenic E. coli or S. aureus (4 hr). Numbers atop bars indicate total number of animals in each condition. Error bars represent mean ± SEM. **p≤0.01, ***p≤0.001, unpaired two-sample two-tailed t-test. (H–J) High magnification epifluorescence images of Pfmo-2::nls::gfp transgenic animals in wild type, hlh-30(-), or nhr-49(-) mutant backgrounds after infection with S. aureus (4 hr). Scale bar = 300 μm. (K) Quantification of Pfmo-2::nls::gfp fluorescence in the intestines of wild type, hlh-30(-), and nhr-49(-) mutants after infection with S. aureus (4 hr). Numbers atop bars indicate total number of animals in each condition. Error bars represent mean ± SEM. ***p≤0.001, unpaired two-sample two-tailed t-test. (L) Relative expression of fmo-2/FMO5 transcript (RT-qPCR -ΔCt) in wild type, nhr-49(-) mutants, and nhr-49(-); Pnhr-49::nhr-49 (complemented) animals fed nonpathogenic E. coli OP50 or infected with S. aureus SH1000 (4 hr). Data are normalized to wild type on E. coli, means ± SEM (three to four independent biological replicates). ***p≤0.001, ns = not significant, one-way ANOVA followed by Šídák’s test for multiple comparisons.
-
Figure 3—source data 1
Quantification of whole-animal Pfmo-2::nls::gfp fluorescence in wild type, hlh-30(-), and nhr-49(-) animals after feeding on nonpathogenic E. coli or infected with S. aureus.
- https://cdn.elifesciences.org/articles/62775/elife-62775-fig3-data1-v3.xlsx
-
Figure 3—source data 2
Quantification of Pfmo-2::nls::gfp fluorescence in the intestines of wild type, hlh-30(-), and nhr-49(-) mutants after infection with S. aureus.
- https://cdn.elifesciences.org/articles/62775/elife-62775-fig3-data2-v3.xlsx
-
Figure 3—source data 3
fmo-2 mRNA levels in wild type, nhr-49(-) mutants, and nhr-49(-); Pnhr-49::nhr-49 (complemented) animals fed nonpathogenic E. coli or infected with S. aureus.
- https://cdn.elifesciences.org/articles/62775/elife-62775-fig3-data3-v3.xlsx
RT-qPCR of the other five HLH-30-independent genes showed that only K08C7.4 induction by S. aureus was also dependent on NHR-49/PPAR-α (Figure 3—figure supplement 2). We generated a K08C7.4 GFP transcriptional reporter strain and examined fluorescence in infected and noninfected wild type and nhr-49/PPARA mutants. In this strain, GFP was visible in noninfected animals in the anterior and posterior intestinal epithelium but was strongest in two unidentified head sensory neurons (as previously reported, potentially AFD neurons [Lockhead et al., 2016; Mounsey et al., 2002]), additional unidentified head and nerve ring neurons, ventral nerve cord, and an unidentified pair of tail neurons (Figure 3—figure supplement 3A). In infected animals, this expression pattern remained unchanged but increased slightly in intensity (Figure 3—figure supplement 3B,E). In contrast, nhr-49/PPARA mutants exhibited similar GFP expression in infected and noninfected animals (Figure 3—figure supplement 3C–E). Together, these data showed that nhr-49/PPARA was absolutely required for fmo-2/PPARA expression and induction, while it was only partially required for induction of K08C7.4. For this reason, we designated K08C7.4 as nfds-1 for ‘NHR-forty-nine-dependent induction by S. aureus, member 1’; nfds-1 appears to have homologs only in nematodes. These data also suggested that NHR-49/PPAR-α contributes to the induction of some of the HLH-30-independent host defense genes, but the biological significance of NHR-49/PPAR-α to host defense was not clear.
NHR-49/PPAR-α is required for host defense
Compared to wild type, nhr-49/PPARA null mutants showed defective survival of S. aureus infection (Figure 4A) and shorter lifespan when fed nonpathogenic E. coli (Figure 4B), as previously reported (Van Gilst et al., 2005), suggesting that NHR-49/PPAR-α may have important roles in both host defense and aging. Transgenic rescue of nhr-49/PPARA driven by its endogenous promoter completely rescued the infection survival defect (Figure 4A) but only partially restored the total lifespan on E. coli (Figure 4B), suggesting that distinct thresholds of NHR-49/PPAR-α function exist in infection and aging. Moreover, relative to wild type, two distinct nhr-49/PPARA gain-of-function mutants (Lee et al., 2016; Svensk et al., 2013) showed enhanced infection survival (Figure 4C). In contrast, gain-of-function mutant nhr-49(et7) (gf1) exhibited prolonged lifespan on E. coli, while nhr-49(et8) (gf2) exhibited shortened lifespan (Figure 4D), consistent with previous results (Lee et al., 2016). These results showed that NHR-49/PPAR-α promotes host infection survival, while its function in aging may be more complex.
Figure 4 with 1 supplement see all

NHR-49/PPAR-α is required for host defense against infection.
(A) Survival of wild type, nhr-49/PPARA loss-of-function, and nhr-49(-); Pnhr-49::nhr-49 (complemented) animals infected with S. aureus SH1000. Data are representative of two independent trials. ****p≤0.0001 (Log-Rank test). (B) Lifespan on nonpathogenic E. coli OP50 of wild type, nhr-49/PPARA loss-of-function, and nhr-49(-); Pnhr-49::nhr-49 animals. Data are representative of two independent trials. ****p≤0.0001 (Log-Rank test). (C) Survival of wild type and two nhr-49/PPARA gain-of-function mutants (gf1 = et7 and gf2 = et8) infected with S. aureus SH1000. Data are representative of two independent trials. ****p≤0.0001 (Log-Rank test). (D) Lifespan of wild type and nhr-49/PPARA gain-of-function mutants on E. coli OP50. Data are representative of three independent trials. ****p≤0.0001 (Log-Rank test). (E) Relative expression of fmo-2/FMO5 transcript (RT-qPCR -ΔCt) in wild type and nhr-49/PPARA gain-of-function mutants fed nonpathogenic E. coli OP50 or infected with S. aureus SH1000 (4 hr). Data are normalized to wild type on E. coli, means ± SEM (two to five independent biological replicates). *p≤0.05, **p≤0.01, unpaired two-sample two-tailed t-test. (F–I) Epifluorescence micrographs of Pfmo-2::nls::gfp in wild type (F–G) and nhr-49(gf2) mutants (H–I) fed nonpathogenic E. coli OP50 or infected with S. aureus SH1000 (4 hr). Scale bar = 1000 μm. (J) Quantification of GFP fluorescence in wild type and nhr-49(gf2) animals expressing Pfmo-2::nls::gfp, after feeding on E. coli or infection with S. aureus (4 hr). Number of animals is indicated atop the bars. Error bars represent mean ± SEM. ***p≤0.001, unpaired two-sample two-tailed t-test.
-
Figure 4—source data 1
Survival of wild type, nhr-49(-) mutant, and nhr-49(-); Pnhr-49::nhr-49 (complemented) animals infected with S. aureus.
- https://cdn.elifesciences.org/articles/62775/elife-62775-fig4-data1-v3.xlsx
-
Figure 4—source data 2
Lifespan of wild type, nhr-49(-) mutant, and nhr-49(-); Pnhr-49::nhr-49 (complemented) animals on nonpathogenic E. coli.
- https://cdn.elifesciences.org/articles/62775/elife-62775-fig4-data2-v3.xlsx
-
Figure 4—source data 3
Survival of wild type and nhr-49 gain-of-function mutants (et7 and et8) infected with S. aureus.
- https://cdn.elifesciences.org/articles/62775/elife-62775-fig4-data3-v3.xlsx
-
Figure 4—source data 4
Lifespan of wild type and nhr-49 gain-of-function mutants (et7 and et8) on nonpathogenic E. coli.
- https://cdn.elifesciences.org/articles/62775/elife-62775-fig4-data4-v3.xlsx
-
Figure 4—source data 5
fmo-2 transcript levels in wild type and nhr-49 gain-of-function mutants (et7 and et8) fed nonpathogenic E. coli or infected with S. aureus.
- https://cdn.elifesciences.org/articles/62775/elife-62775-fig4-data5-v3.xlsx
-
Figure 4—source data 6
Quantification of Pfmo-2::nls::gfp fluorescence in wild type and nhr-49(et8) animals fed E. coli or infected with S. aureus.
- https://cdn.elifesciences.org/articles/62775/elife-62775-fig4-data6-v3.xlsx
Also in line with previous results (Lee et al., 2016), RT-qPCR of noninfected animals showed constitutively elevated fmo-2/FMO5 expression in gain-of-function nhr-49/PPARA mutants relative to wild type (Figure 4E), consistent with the observed pro-survival function of NHR-49/PPAR-α. Upon infection, both gain-of-function mutants exhibited further fmo-2/FMO5 induction, reaching higher fmo-2/FMO5 expression than wild type controls (Figure 4E). Consistently, on nonpathogenic E. coli nhr-49/PPARA gain-of-function mutants exhibited constitutively high fmo-2/FMO5 reporter GFP expression in the anterior pharynx, pharyngeal isthmus, nervous system, and the intestinal epithelium (Figure 4F,H, Figure 4—figure supplement 1). Infection further increased reporter expression throughout the body in nhr-49/PPARA gain-of-function mutants, becoming much stronger than wild-type animals (Figure 4G,I,J, Figure 4—figure supplement 1). These results suggested that nhr-49/PPARA activation is sufficient for fmo-2/FMO5 expression in a spatially restricted pattern, and confirmed that infection synergistically upregulates fmo-2/FMO5 expression throughout the entire body. Interestingly, the pattern of fmo-2/FMO5 expression in noninfected nhr-49/PPARA gain-of-function mutants (Figure 4H, Figure 4—figure supplement 1) resembled that observed in infected hlh-30/TFEB null mutants, where NHR-49/PPAR-α would be expected to be active (Figure 3D,I, Figure 4—figure supplement 1).
NHR-49/PPAR-α functions in multiple tissues for host defense
nhr-49/PPARA is expressed in multiple tissues (Ratnappan et al., 2014). To identify specific tissues where nhr-49/PPARA is sufficient for host defense against S. aureus, we reintroduced wild type nhr-49/PPARA into nhr-49/PPARA mutants driven by tissue-specific promoters, including intestine, neurons, muscle, and epidermis (i.e. hypodermis). We examined these rescue lines for fmo-2/FMO5 induction and survival of infection. Intestinal rescue of nhr-49/PPARA fully restored both basal and induced fmo-2/FMO5 expression (Figure 5A). Re-expression of nhr-49/PPARA partially restored fmo-2/FMO5 induction in other lines (Figure 5D,G,J). Consistently, expression in each of these tissues also rescued the infection survival defect of nhr-49/PPARA mutants. In fact, intestinal, neuronal, and muscular expression enhanced infection survival compared to wild type (Figure 5B,E,H), while epidermal expression rescued infection survival to a level similar to wild type (Figure 5K). These results suggested that nhr-49/PPARA can function from any of these tissues to promote host defense against infection.
Figure 5

NHR-49/PPAR-α functions in multiple tissues for host defense.
(A, D, G, J) Relative expression of fmo-2/FMO5 transcript (RT-qPCR -ΔCt) in wild type, nhr-49/PPARA loss-of-function mutants, and tissue-specific nhr-49/PPARA rescue lines: Pglp-19 for intestine, (Pglp-19::nhr-49::gfp), Prgef-1 for nervous system (Prgef-1::nhr-49::gfp), Pmyo-3 for body wall muscle (Pmyo-3::nhr-49::gfp), and Pcol-12 for epidermis (Pcol-12::nhr-49::gfp); fed nonpathogenic E. coli OP50 or infected with S. aureus SH1000 (4 hr). Data are normalized to wild type on E. coli, means ± SEM (three to six independent biological replicates,). ***p≤0.001, ns = not significant, one-way ANOVA followed by Šídák’s test for multiple comparisons. (B, E, H, K) Survival of wild type, nhr-49/PPARA loss of function, and tissue-specific nhr-49/PPARA rescue lines infected with S. aureus. Data are representative of two independent trials. ****p≤0.0001 (Log-Rank test). Comparisons are made between nhr-49(-) and the rescue lines. (C, F, I, L) Lifespan of wild type, nhr-49/PPARA loss of function, and tissue-specific nhr-49 rescue lines on nonpathogenic E. coli. Data are representative of three independent trials. ****p≤0.0001 (Log-Rank test). Comparisons are made between nhr-49(-) and the rescue lines.
-
Figure 5—source data 1
fmo-2 mRNA levels in wild type, nhr-49(-) mutant, and intestine-specific (using gly-19 promoter) nhr-49 rescue line animals.
- https://cdn.elifesciences.org/articles/62775/elife-62775-fig5-data1-v3.xlsx
-
Figure 5—source data 2
Survival of wild type, nhr-49(-) mutant, and intestine-specific (using gly-19 promoter) nhr-49 rescue line animals infected with S. aureus.
- https://cdn.elifesciences.org/articles/62775/elife-62775-fig5-data2-v3.xlsx
-
Figure 5—source data 3
Lifespan of wild type, nhr-49(-) mutant, and intestine-specific (using gly-19 promoter) nhr-49 rescue line animals on nonpathogenic E. coli.
- https://cdn.elifesciences.org/articles/62775/elife-62775-fig5-data3-v3.xlsx
-
Figure 5—source data 4
fmo-2 mRNA levels in wild type, nhr-49(-) mutant, and neuron-specific (using rgef-1 promoter) nhr-49 rescue line animals.
- https://cdn.elifesciences.org/articles/62775/elife-62775-fig5-data4-v3.xlsx
-
Figure 5—source data 5
Survival of wild type, nhr-49(-) mutant, and neuron-specific (using rgef-1 promoter) nhr-49 rescue line animals infected with S. aureus.
- https://cdn.elifesciences.org/articles/62775/elife-62775-fig5-data5-v3.xlsx
-
Figure 5—source data 6
Lifespan of wild type, nhr-49(-) mutant, and neuron-specific (using rgef-1 promoter) nhr-49 rescue line animals on nonpathogenic E. coli.
- https://cdn.elifesciences.org/articles/62775/elife-62775-fig5-data6-v3.xlsx
-
Figure 5—source data 7
fmo-2 mRNA levels in wild type, nhr-49(-) mutant, and muscle-specific (using myo-3 promoter) nhr-49 rescue line animals.
- https://cdn.elifesciences.org/articles/62775/elife-62775-fig5-data7-v3.xlsx
-
Figure 5—source data 8
Survival of wild type, nhr-49(-) mutant, and muscle-specific (using myo-3 promoter) nhr-49 rescue line animals infected with S. aureus.
- https://cdn.elifesciences.org/articles/62775/elife-62775-fig5-data8-v3.xlsx
-
Figure 5—source data 9
Lifespan of wild type, nhr-49(-) mutant, and muscle-specific (using myo-3 promoter) nhr-49 rescue line animals on nonpathogenic E. coli.
- https://cdn.elifesciences.org/articles/62775/elife-62775-fig5-data9-v3.xlsx
-
Figure 5—source data 10
fmo-2 mRNA levels in wild type, nhr-49(-) mutant, and epidermis-specific (using col-12 promoter) nhr-49 rescue line animals.
- https://cdn.elifesciences.org/articles/62775/elife-62775-fig5-data10-v3.xlsx
-
Figure 5—source data 11
Survival of wild type, nhr-49(-) mutant, and epidermis-specific (using col-12 promoter) nhr-49 rescue line animals infected with S. aureus.
- https://cdn.elifesciences.org/articles/62775/elife-62775-fig5-data11-v3.xlsx
-
Figure 5—source data 12
Lifespan of wild type, nhr-49(-) mutant, and epidermis-specific (using col-12 promoter) nhr-49 rescue line animals on nonpathogenic E. coli.
- https://cdn.elifesciences.org/articles/62775/elife-62775-fig5-data12-v3.xlsx
In contrast, tissue-specific complementation of nhr-49/PPARA had more complex effects on normal lifespan on nonpathogenic E. coli. Intestinal and epidermal re-expression prolonged lifespan compared to wild type (Figure 5C,L). Neuronal expression rescued lifespan to the wild-type level (Figure 5F), and muscle expression yielded partial rescue (Figure 5I). Together, these data showed distinct and tissue-specific roles for nhr-49/PPARA in host defense and lifespan.
NHR-49/PPAR-α controls a fraction of the infection-specific transcriptional signature
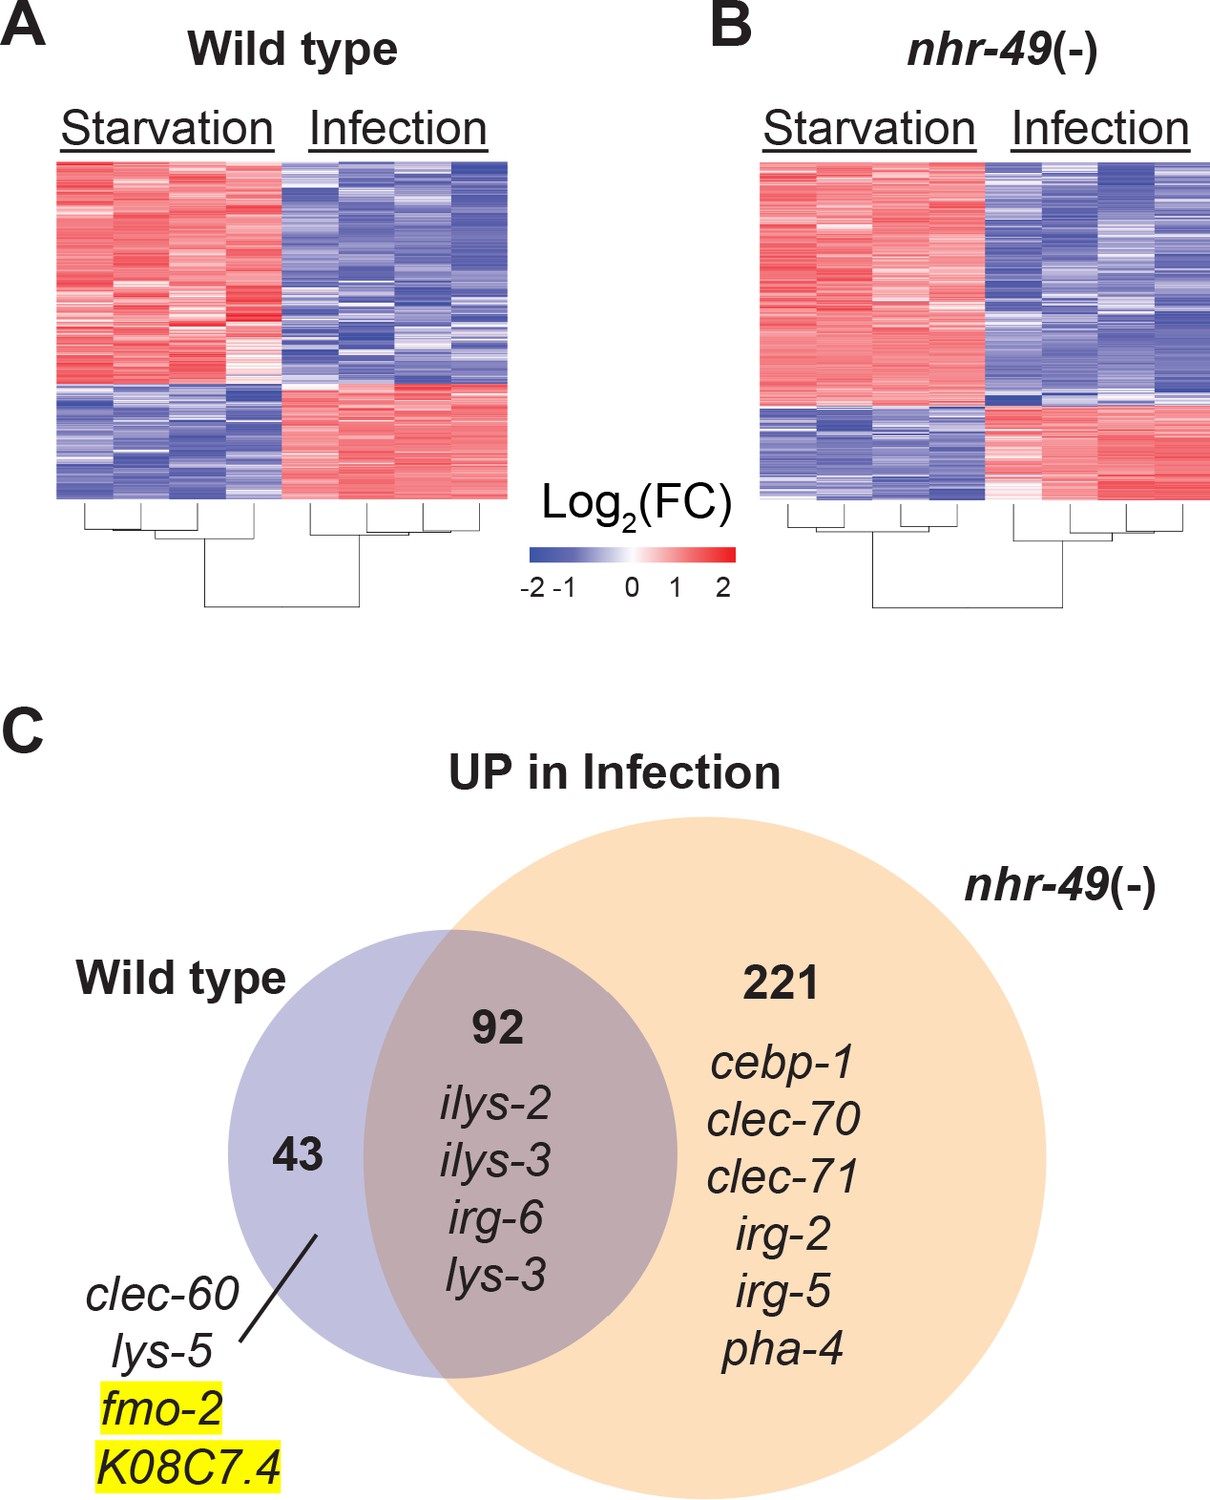
To better understand the biological relevance of nhr-49/PPARA to the infection-specific host response, we compared the transcriptomes of starved and infected nhr-49/PPARA mutants. In stark contrast to hlh-30/TFEB mutants, which showed a much-reduced differential response compared to wild type (Figure 2), nhr-49/PPARA mutants exhibited many more differentially expressed genes than wild type between these two conditions (e.g. 313 v. 135 upregulated, Figure 6 and Supplementary file 4). Moreover, 92 (68%) of the 135 infection-upregulated genes in wild type were also upregulated in nhr-49/PPARA mutants, and we categorized them as NHR-49/PPAR-α-independent (Figure 6C and Supplementary file 4). GO analysis detected overrepresentation of molecular function categories related to Lysozyme Activity (GO:0003796, Padj = 0.033808778, genes: ilys-2, ilys-3, and lys-3), and of biological process categories related to Innate Immune Response (GO:0045087, Padj = 6.62E-16, genes including clec-86, dct-17, dod-19, and tsp-1). Although KEGG pathway analysis did not detect overrepresentation of any known pathways, analysis of TRANSFAC motifs identified great overrepresentation of aryl hydrocarbon receptor (AHR) motif (M00000, Padj = 1.11E-26) and of the consensus motif for ELT-3 (GATA2, M07154, Padj = 1.20E-10). These data imply that in wild type animals, the NHR-49-independent component of the infection-specific signature is enriched for antimicrobial enzymes and innate immune response genes, potentially driven by AHR and ELT-3.
Figure 6
NHR-49/PPAR-α is required for one-third of the infection-specific transcriptional signature.
(A–B) Heat map of differentially expressed genes during starvation and infection in wild type (A) and nhr-49(-) (B) animals (RNA-seq, Log2(FC), PAdj ≤0.001). Columns represent a biological replicate each. (C) Venn diagram representing genes that are upregulated by 4 hr S. aureus infection compared with 4 hr starvation in wild type and nhr-49(-) animals. Shown are a few examples for reference.
Only 43 genes were induced by infection in wild type but not in nhr-49/PPARA mutants, and thus we categorized them as NHR-49-dependent (Figure 6C and Supplementary file 4). GO analysis of these genes detected over-representation of molecular function categories related to Monooxygenase Activity (GO:0004497, Padj = 0.000157209), NAD(P)H Oxidase H2O2-forming Activity (GO:0016174, Padj = 0.002332572), and Carbohydrate Binding (GO:0030246, Padj = 0.015473897). The first two relate to flavin-containing monooxygenase genes fmo-2 and fmo-5, in addition to drd-1 (FAXDC2 homolog) and cyp-14A3 (Cytochrome P450). The last category relates to the expression of C-type Lectin (CLEC) genes clec-52, clec-172, clec-204, and clec-265. Additionally, the most relevant overrepresented biological process categories were related to Lipid Metabolic Process (GO:0006629, Padj = 4.29265E-06, genes: Y73B6BL.37, Y65B4BR.1, Y46H3A.5, C39B5.14, pmp-1, drd-1, K05B2.4, and sptl-2, which is the entry point to the ceramide and sphingosine biosynthetic pathways) and Defense Response to Gram-Positive Bacterium (GO:0050830, Padj = 0.003214175). Examples included C-type lectin clec-60, lysozyme lys-5, fmo-2/FMO5, and K08C7.4. KEGG pathway analysis also detected overrepresentation of Cytochrome P450 Drug Metabolism (KEGG:00982), related to genes fmo-2, fmo-5, and gst-5. Analysis of TRANSFAC motifs also identified strong overrepresentation of the AHR motif (M00000, Padj = 4.59E-15) in this gene set. Therefore, we concluded that in wild-type animals, NHR-49/PPAR-α is required for the expression of redox enzymes, C-type lectins, and lipid metabolic enzymes, possibly involving AHR.
In contrast, 221 genes were induced by infection only in nhr-49/PPARA mutants, and thus it appeared that nhr-49/PPARA loss may be compensated by a large infection-specific response that does not normally occur in wild-type animals. By GO analysis, this group was enriched for one molecular function category related to Carbohydrate Binding (GO:0030246, Padj = 3.86602E-05), by genes clec-70, clec-71, clec-9, clec-118, clec-125, clec-186, clec-187, clec-221, and Y38H6C.8 (orthologous to mammalian antimicrobial C-type lectin HIP/PAP/REG3γ), galectin gene lec-11, and α-mannosidase gene aman-3. The most relevant overrepresented biological process categories were related to Response to External Biotic Stimulus (GO:0043207, Padj = 8.41E-33) and Innate Immune Response (GO:0045087, Padj = 2.15E-26), suggesting that in the absence of NHR-49/PPAR-α, infection induces an alternative innate immune response. Remarkably, KEGG pathway analysis did not detect overrepresentation of any known pathways, indicating that the compensatory response does not enhance any particular aspect of metabolism or signaling that can be detected by transcriptional analysis. TRANSFAC motif analysis again detected strong enrichment of the AHR motif (M00000, Padj = 3.80E-51) and of the ELT-3 motif (M07154, Padj = 9.65E-21), suggesting that AHR may have a broad role in the overall infection-specific signature, while ELT-3 has a more restricted role in the NHR-49-independent and compensatory signatures. TRANSFAC analysis also detected overrepresentation of the SKN-1/NRF2 motif (M00230, Padj = 0.007316808), suggesting that in the absence of NHR-49/PPAR-α, SKN-1/NRF2 may become activated during S. aureus infection.
HLH-30/TFEB genetically functions downstream of NHR-49/PPAR-α for host defense
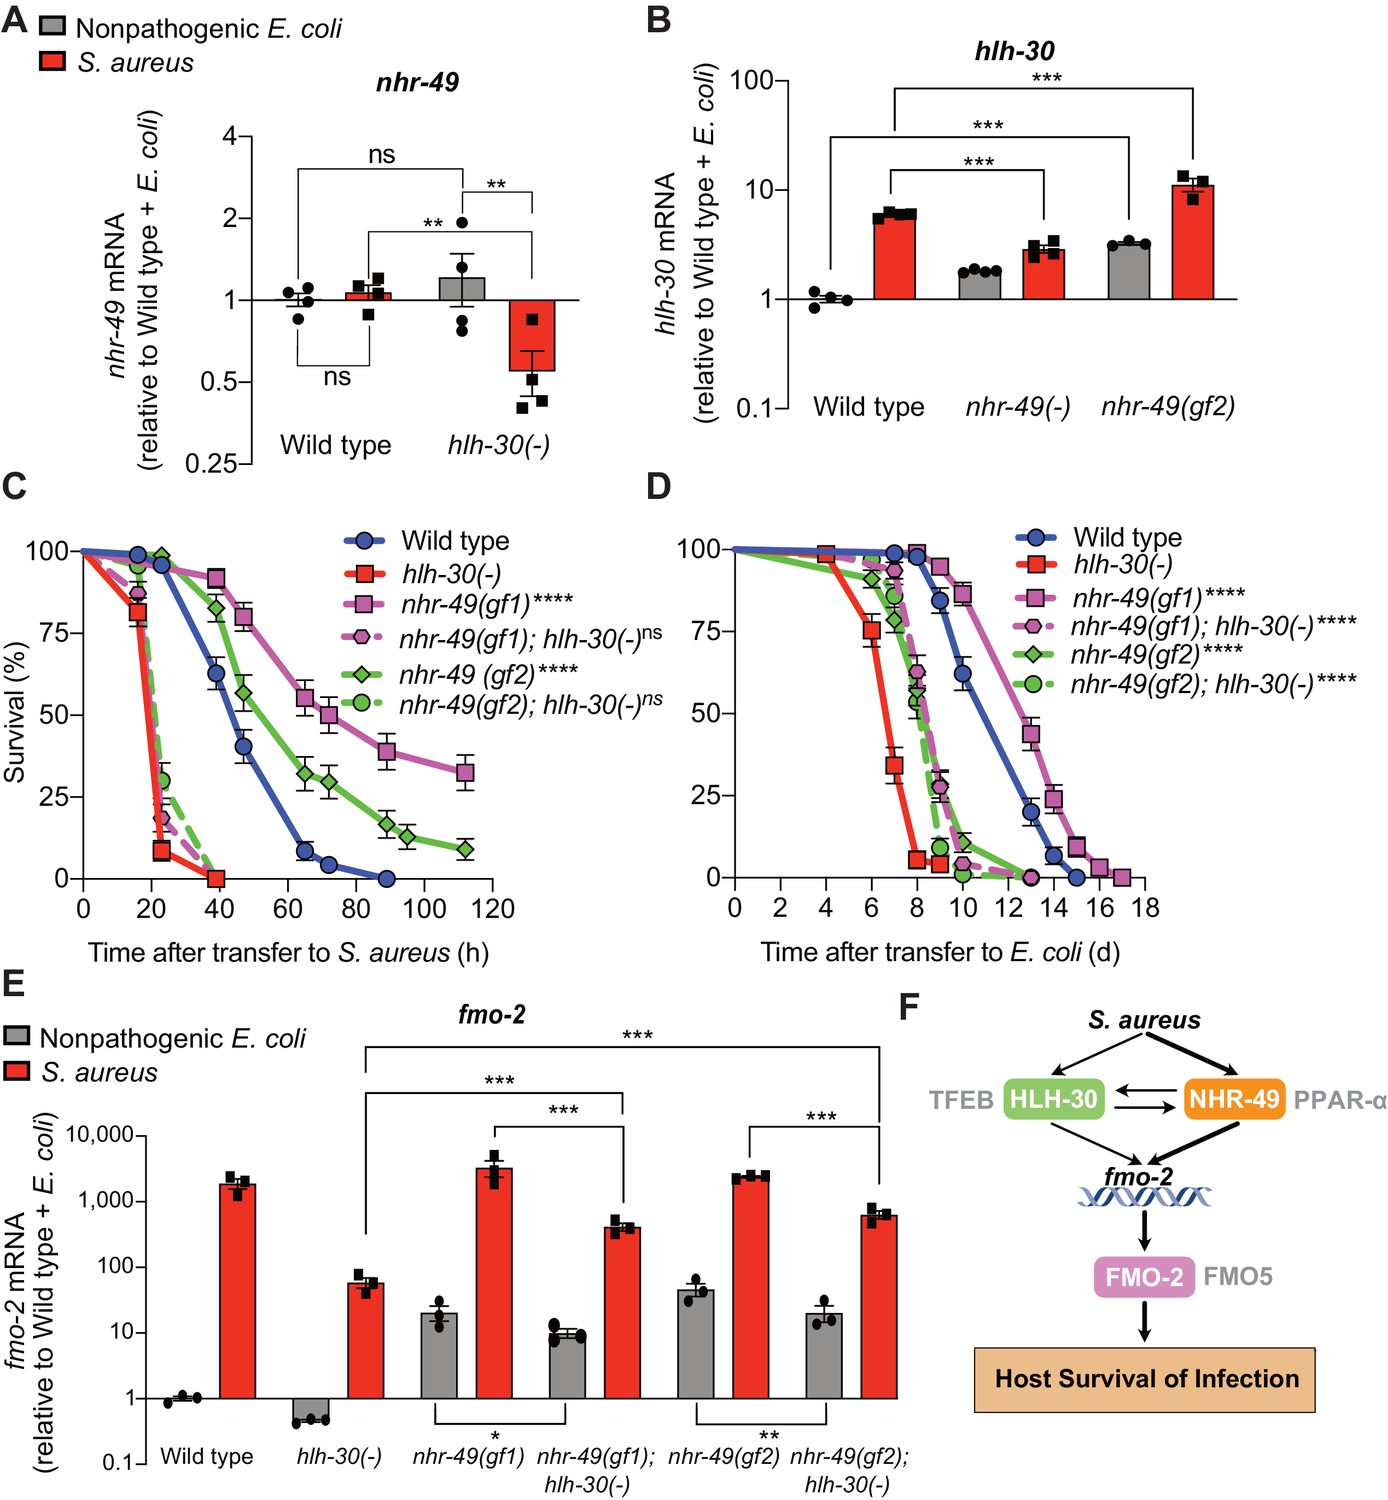
During infection, nhr-49/PPARA expression did not change in wild-type animals compared to uninfected controls (Figure 7A). Moreover, nhr-49/PPARA expression was similar in noninfected wild type and hlh-30/TFEB mutants. In contrast, in infected hlh-30/TFEB mutants compared with wild type, nhr-49/PPARA expression was lower (Figure 7A), indicating that HLH-30/TFEB contributes to nhr-49/PPARA expression during infection. Conversely, in nhr-49/PPARA null mutants hlh-30/TFEB baseline expression was higher than in wild type, yet its induction by infection was abrogated (Figure 7B). This indicated that nhr-49/PPARA is required for increased expression of hlh-30/TFEB during infection. Moreover, in nhr-49/PPARA gain-of-function mutants compared to wild type, both hlh-30/TFEB baseline expression and induction were higher (Figure 7B). Considered together, these data suggested that HLH-30/TFEB and NHR-49/PPAR-α contribute to each other’s expression in noninfected and infected animals in different ways.
Figure 7 with 1 supplement see all
HLH-30/TFEB genetically functions downstream of NHR-49/PPAR-α for host defense.
(A) Relative expression of nhr-49/PPARA transcript (RT-qPCR -ΔCt) in wild type and hlh-30/TFEB loss-of-function mutants fed nonpathogenic E. coli OP50 or infected with S. aureus SH1000 (8 hr). Data are normalized to wild type on E. coli, means ± SEM (four independent biological replicates). **p≤0.01, ns = not significant, one-way ANOVA followed by Šídák’s test for multiple comparisons. (B) Relative expression of hlh-30/TFEB transcript (RT-qPCR -ΔCt) in wild type, nhr-49/PPARA loss of function, and nhr-49/PPARA gain-of-function (gf2) mutants fed nonpathogenic E. coli OP50 or infected with S. aureus SH1000 (8 hr). Data are normalized to wild type on E. coli, means ± SEM (three to four independent biological replicates ). ***p≤0.001, one-way ANOVA followed by Šídák’s test for multiple comparisons. (C) Survival of wild type, hlh-30/TFEB loss of function, nhr-49(gf1), nhr-49(gf2), nhr-49(gf1); hlh-30(-), and nhr-49(gf2); hlh-30(-) animals infected with S. aureus SH1000. Data are representative of two independent trials. ****p≤0.0001 (Log-Rank test, compared to hlh-30(-) mutants). (D) Lifespan of wild type, hlh-30/TFEB loss of function, nhr-49(gf1), nhr-49(gf2), nhr-49(gf1); hlh-30(-), and nhr-49(gf2); hlh-30(-) animals on nonpathogenic E. coli OP50. Data are representative of two independent trials. ****p≤0.0001 (Log-Rank test, compared to hlh-30(-) mutants). (E) Relative expression of fmo-2/FMO5 transcript (RT-qPCR -ΔCt) in wild type, hlh-30(-), nhr-49(gf1), nhr-49(gf1); hlh-30(-), nhr-49(gf2), and nhr-49(gf2); hlh-30(-) animals fed nonpathogenic E. coli OP50 or infected with S. aureus SH1000 (4 hr). Data are normalized to wild type on E. coli, means ± SEM (three to four independent biological replicates). *p≤0.05, **p≤0.01, ***p≤0.001, one-way ANOVA followed by Šídák’s test for multiple comparisons. (F) Schematic representation of fmo-2/FMO5 regulation during infection with S. aureus. Human homologs of the C. elegans proteins are indicated in grey lettering.
-
Figure 7—source data 1
nhr-49 mRNA levels in wild type and hlh-30(-) mutant animals fed nonpathogenic E. coli or infected with S. aureus.
- https://cdn.elifesciences.org/articles/62775/elife-62775-fig7-data1-v3.xlsx
-
Figure 7—source data 2
hlh-30 mRNA levels in wild type, nhr-49(-), and nhr-49 gain-of-function (gf2) mutants fed nonpathogenic E. coli or infected with S. aureus.
- https://cdn.elifesciences.org/articles/62775/elife-62775-fig7-data2-v3.xlsx
-
Figure 7—source data 3
Survival of wild type, hlh-30(-), nhr-49(gf1), nhr-49(gf2), nhr-49(gf1); hlh-30(-), and nhr-49(gf2); hlh-30(-) animals infected with S. aureus.
- https://cdn.elifesciences.org/articles/62775/elife-62775-fig7-data3-v3.xlsx
-
Figure 7—source data 4
Lifespan of wild type, hlh-30(-), nhr-49(gf1), nhr-49(gf2), nhr-49(gf1);hlh-30(-), and nhr-49(gf2);hlh-30(-) animals on nonpathogenic E. coli.
- https://cdn.elifesciences.org/articles/62775/elife-62775-fig7-data4-v3.xlsx
-
Figure 7—source data 5
fmo-2 mRNA levels in wild type, hlh-30(-), nhr-49(gf1), nhr-49(gf1);hlh-30(-), nhr-49(gf2), and nhr-49(gf2);hlh-30(-) animals fed nonpathogenic E. coli or infected with S. aureus.
- https://cdn.elifesciences.org/articles/62775/elife-62775-fig7-data5-v3.xlsx
Because hlh-30/TFEB and nhr-49/PPARA contributed to both infection-specific fmo-2/FMO5 induction (Figure 2, Figure 3) and each other’s expression (Figure 7A–B), we examined their genetic interactions. To determine whether hlh-30/TFEB and nhr-49/PPARA genetically function in the same pathway, we first knocked down hlh-30/TFEB in wild type and nhr-49PPARA null mutants by RNA interference (RNAi). Whereas hlh-30/TFEB knockdown greatly impaired S. aureus infection survival in wild type animals, it did not affect nhr-49/PPARA mutants (Figure 7—figure supplement 1A). In contrast, hlh-30/TFEB knockdown shortened total lifespan in both wild type and nhr-49/PPARA mutants fedon nonpathogenic E. coli (Figure 7—figure supplement 1B). These results are consistent with a model in which hlh-30/TFEB and nhr-49/PPARA function in parallel pathways for longevity, while they function in the same pathway for infection survival.
To test the proposed model, we constructed nhr-49/PPARA (gain-of-function); hlh-30/TFEB (loss-of-function) double mutants. Remarkably, despite enhancing infection survival as single mutants (Figure 4C), in combination with hlh-30(-) neither nhr-49(gf1) nor nhr-49(gf2) affected host survival (Figure 7C). Therefore, hlh-30/TFEB deletion completely suppressed the enhanced survival phenotypes of nhr-49/PPARA gain-of-function alleles, which is consistent with hlh-30/TFEB functioning downstream of nhr-49/PPARA for host infection survival. In contrast, both double mutants showed increased lifespan on nonpathogenic E. coli compared to hlh-30/TFEB single mutants (Figure 7D), suggesting that nhr-49PPARA functions downstream of, or parallel to, hlh-30/TFEB for lifespan determination.
Analysis of fmo-2/FMO5 expression in the double mutants showed that hlh-30/TFEB was required for full induction by nhr-49/PPARA gain of function in both infected and noninfected animals (Figure 7E). Because hlh-30/TFEB mutation did not fully suppress either gain-of-function allele, for the fmo-2/FMO5 expression phenotype hlh-30/TFEB and nhr-49/PPARA appear to function in parallel (additive) pathways and thus, hlh-30/TFEB is only partially required for fmo-2/FMO5 expression.
FMO-2/FMO5 is required for host survival of infection
So far, we focused on fmo-2/FMO5 as a useful reporter of the broader infection-specific signature, but its biological relevance to infection survival was unknown. FMO-2 and FMO5 belong to the evolutionarily conserved flavin-containing monooxygenase (FMO) protein family (Huijbers et al., 2014). In mammals, FMO proteins are primarily known to function in the detoxification of foreign substances (xenobiotics) with prominent roles in drug metabolism (Krueger and Williams, 2005). C. elegans FMO-2 exhibits homology to human proteins FMO1-5, with closest similarity to FMO5 (42% identity). Previously, FMO-2/FMO5 had been implicated in dietary-restriction-mediated lifespan extension, and its forced expression resulted in stress resistance (Leiser et al., 2015). In plants, FMOs participate in host defense against bacterial and fungal infections (Bartsch et al., 2006; Koch et al., 2006). Whether animal FMOs also function in innate host defense was not known.
To determine the physiological relevance of fmo-2/FMO5 during infection, we examined mutants homozygous for an fmo-2/FMO5 deletion predicted to result in a null allele (C. elegans Deletion Mutant Consortium, 2012). Compared with wild type, fmo-2/FMO5 mutants exhibited greatly compromised survival of S. aureus infection (Figure 8A) but did not exhibit differences in survival of P. aeruginosa infection or in aging when fed nonpathogenic E. coli (Figure 8B–C). Deletion of fmo-2/FMO5 did not affect the induction of the nine most highly induced infection-specific signature genes (Figure 8—figure supplement 1). These data suggested that FMO-2/FMO5 may play an important role for host defense specifically during S. aureus infection, which is independent of the induction of many other host defense genes.
Figure 8 with 3 supplements see all

FMO-2/FMO5 is required for host survival of infection.
(A) Survival of wild type and fmo-2/FMO5 loss-of-function mutants infected with S. aureus SH1000. Data are representative of five independent trials. ****p≤0.0001 (Log-Rank test). (B) Survival of wild type and fmo-2/FMO5 loss-of-function mutants infected with P. aeruginosa PA14. Data are representative of two independent trials. ns = not significant (Log-Rank test). (C) Lifespan of wild type and fmo-2/FMO5 loss-of-function mutants fed nonpathogenic E. coli OP50. Data are representative of three independent trials. ns = not significant (Log-Rank test). (D) Survival of wild type, fmo-2/FMO5, fmo-2(FAD), fmo-2(NADPH), and fmo-2(FAD+NADPH) mutants infected with S. aureus SH1000. Data are representative of three independent trials. *p≤0.05, **p≤0.01, ns = not significant (Log-Rank test). Comparisons shown are between fmo-2(-) and the catalytic mutants. (E) Lifespan of wild type, fmo-2/FMO5, fmo-2(FAD), fmo-2(NADPH), and fmo-2(FAD +NADPH) mutants on E. coli OP50. Data are representative of 4 independent replicates. ns = not significant (Log-Rank test).
-
Figure 8—source data 1
Survival of wild type and fmo-2(-) mutant animals infected with S. aureus.
- https://cdn.elifesciences.org/articles/62775/elife-62775-fig8-data1-v3.xlsx
-
Figure 8—source data 2
Survival of wild type and fmo-2(-) mutant animals infected with P. aeruginosa.
- https://cdn.elifesciences.org/articles/62775/elife-62775-fig8-data2-v3.xlsx
-
Figure 8—source data 3
Lifespan of wild type and fmo-2(-) mutant animals fed nonpathogenic E. coli.
- https://cdn.elifesciences.org/articles/62775/elife-62775-fig8-data3-v3.xlsx
-
Figure 8—source data 4
Survival of wild type, fmo-2(-), fmo-2(FAD), fmo-2(NADPH), and fmo-2(FAD +NADPH) mutant animals infected with S. aureus.
- https://cdn.elifesciences.org/articles/62775/elife-62775-fig8-data4-v3.xlsx
-
Figure 8—source data 5
Lifespan of wild type, fmo-2(-), fmo-2(FAD), fmo-2(NADPH), and fmo-2(FAD +NADPH) mutant animals on nonpathogenic E. coli.
- https://cdn.elifesciences.org/articles/62775/elife-62775-fig8-data5-v3.xlsx
To determine whether such a role of FMO-2/FMO5 requires its catalytic activity, we used CRISPR-mediated genome editing to modify key conserved residues in the FMO-2/FMO5 FAD-binding domain, the NADPH-binding domain, or both (Figure 8—figure supplement 2A–B). Due to their conservation in FMOs from yeast, plants, and animals (Figure 8—figure supplement 2B), these residues are predicted to be required for electron transfer from organic substrates to cofactors FAD and NADPH (Kubo et al., 1997; Rescigno and Perham, 1994). Remarkably, mutations of either cofactor binding motif caused infection survival defects that were barely weaker than that of null fmo-2/FMO5 mutants. Simultaneous mutation of both motifs produced susceptibility that was indistinguishable from that of fmo-2/FMO5 null mutants (Figure 8D). These results suggested that both cofactor-binding sites were required for FMO-2/FMO5 function in host defense. In contrast, none of these mutations, alone or in combination, altered total lifespan on nonpathogenic E. coli (Figure 8E). Together, these data indicated that FMO-2/FMO5 catalytic activity may be specifically required for host defense against infection.
Simultaneous deletion of nhr-49/PPARA and fmo-2/FMO5 resulted in similarly impaired infection survival as the single mutants (Figure 9A), suggesting that nhr-49/PPARA and fmo-2/FMO5 function in the same pathway. On nonpathogenic E. coli, the lifespan defect of nhr-49(-) mutants was slightly improved by introduction of fmo-2(-) (Figure 9B). In contrast, introduction of fmo-2(-) in the two nhr-49(gof) mutant backgrounds almost completely suppressed the enhanced infection survival (Figure 9C), while their lifespan on nonpathogenic E. coli was also suppressed (for gf1) or slightly impaired (for gf2) (Figure 9D). These results show that that fmo-2/FMO5 is absolutely required for the enhancement of host infection survival by nhr-49/PPARA gain-of-function, consistent with fmo-2/FMO5 acting downstream of nhr-49/PPARA, while its effect on their lifespan is allele-specific.
Figure 9 with 1 supplement see all
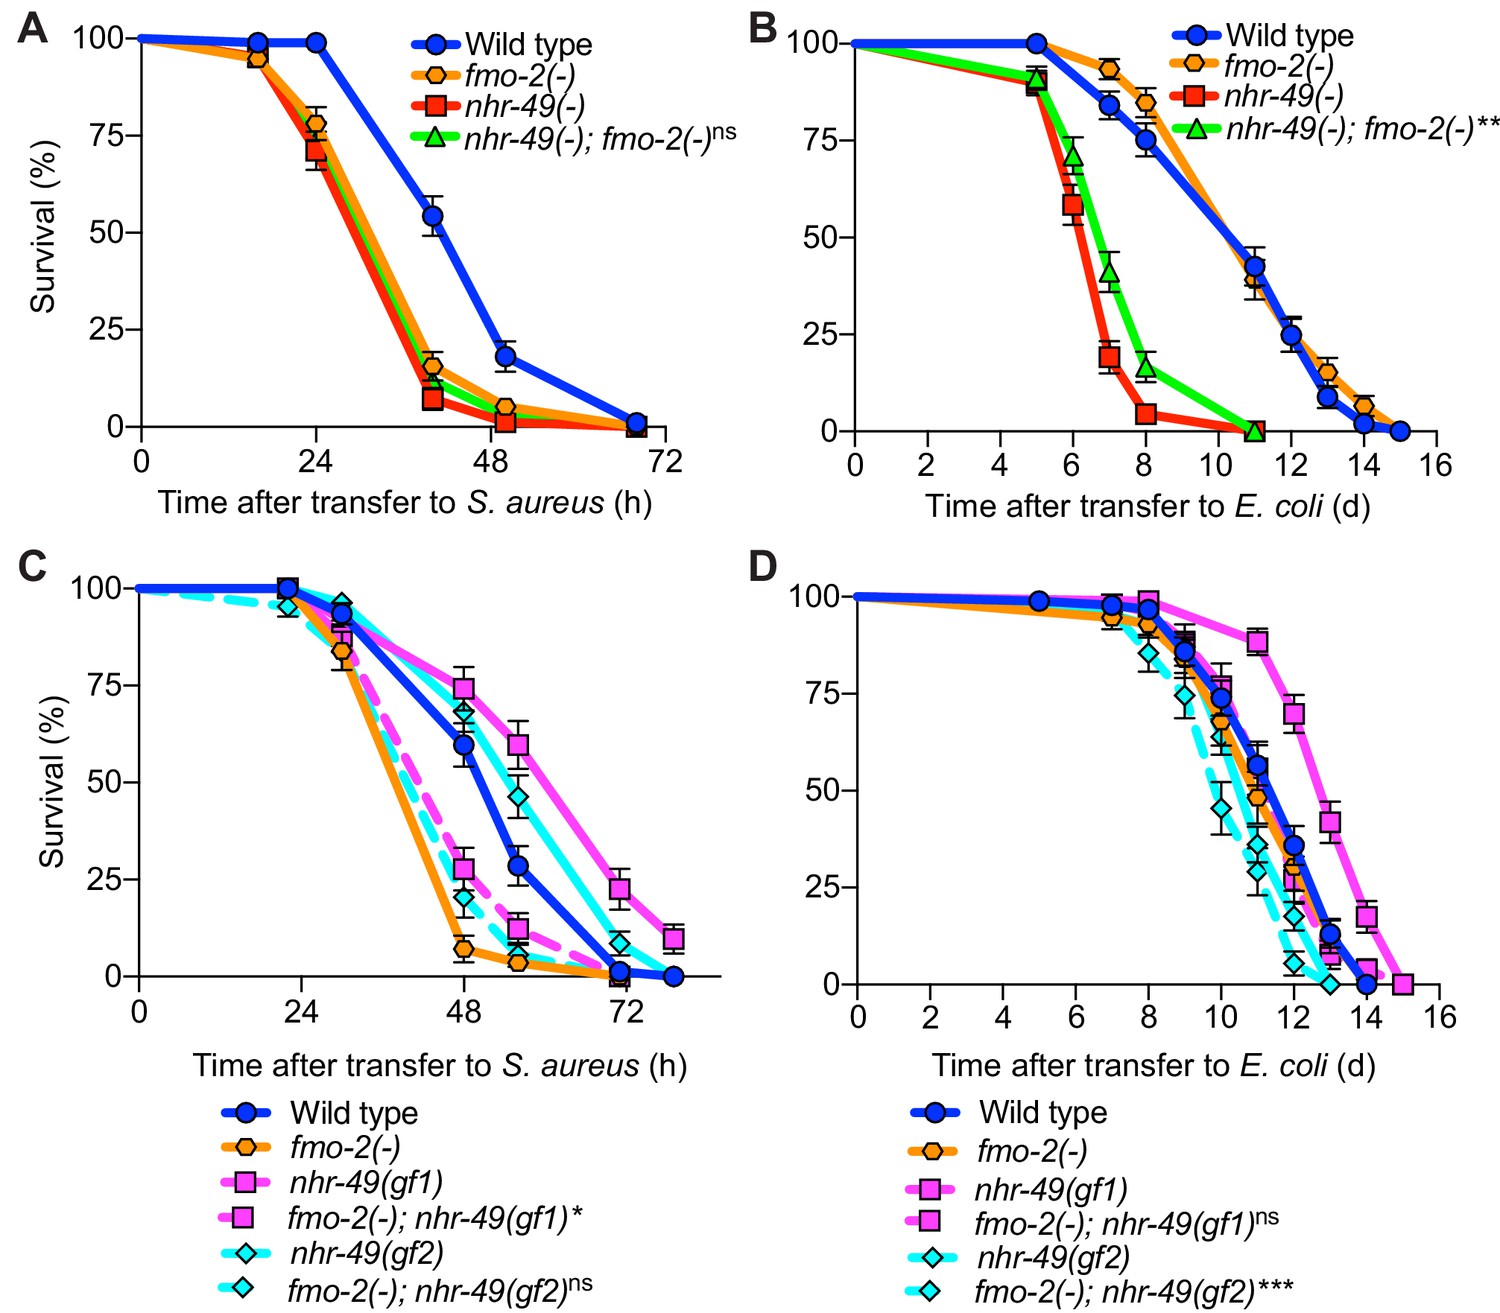
fmo-2/FMO5 and nhr-49/PPARA function in the same genetic pathway.
(A) Survival of wild type, nhr-49(-), and nhr-49(-);fmo-2(-) animals infected with S. aureus. Data are representative of two independent trials. ns = not significant (Log-Rank test). (B) Lifespan of wild type, nhr-49(-), and nhr-49(-);fmo-2(-) animals on nonpathogenic E. coli. Data are representative of two independent trials. **p≤0.01 (Log-Rank test, compared to nhr-49(-)). (C) Survival of wild type, fmo-2(-), nhr-49(gf1), fmo-2(-); nhr-49(gf1), nhr-49(gf2), and fmo-2(-); nhr-49(gf2) animals infected with S. aureus. Data are representative of two independent trials. *p≤0.05, ns = not significant (Log-Rank test, comparisons are between fmo-2(-) single and fmo-2(-); nhr-49(gf) double mutants). (D) Lifespan of wild type, fmo-2(-), nhr-49(gf1), fmo-2(-); nhr-49(gf1), nhr-49(gf2), and fmo-2(-); nhr-49(gf2) animals on nonpathogenic E. coli. Data are representative of two independent trials. ***p≤0.001, ns = not significant (Log-Rank test, comparisons are between fmo-2(-) single and fmo-2(-); nhr-49(gf) double mutants).
-
Figure 9—source data 1
Survival of wild type, nhr-49(-), and nhr-49(-);fmo-2(-) animals infected with S. aureus.
- https://cdn.elifesciences.org/articles/62775/elife-62775-fig9-data1-v3.xlsx
-
Figure 9—source data 2
Lifespan of wild type, nhr-49(-), and nhr-49(-);fmo-2(-) animals on nonpathogenic E. coli.
- https://cdn.elifesciences.org/articles/62775/elife-62775-fig9-data2-v3.xlsx
-
Figure 9—source data 3
Survival of wild type, fmo-2(-), nhr-49(gf1), fmo-2(-);nhr-49(gf1), nhr-49(gf2), and fmo-2(-); nhr-49(gf2) animals infected with S. aureus.
- https://cdn.elifesciences.org/articles/62775/elife-62775-fig9-data3-v3.xlsx
-
Figure 9—source data 4
Lifespan of wild type, fmo-2(-), nhr-49(gf1), fmo-2(-);nhr-49(gf1), nhr-49(gf2), and fmo-2(-);nhr-49(gf2) animals on nonpathogenic E. coli.
- https://cdn.elifesciences.org/articles/62775/elife-62775-fig9-data4-v3.xlsx
In addition, we found that intestinal-restricted fmo-2/FMO5 overexpression was sufficient to boost infection survival (Figure 8—figure supplement 3A). Interestingly, the lifespan of these animals was also extended on nonpathogenic E. coli (Figure 8—figure supplement 3B), confirming prior work (Leiser et al., 2015). These results suggested that elevating FMO-2/FMO5 levels in the intestine alone confers benefits not only in host defense but also against aging, possibly by increasing host resistance to food E. coli pathogenesis late in life (McGee et al., 2011; Zhao et al., 2017). Altogether, these observations suggested that fmo-2/FMO5 is necessary and sufficient for host defense against S. aureus.
Since K08C7.4/nfds-1 induction by infection was also dependent on NHR-49/PPAR-α (Figure 3—figure supplements 2 and 3), we examined genetic interactions between nhr-49/PPARA and K08C7.4/nfds-1 for S. aureus infection survival. K08C7.4/nfds-1 RNAi did not affect the phenotypes of wild type or nhr-49/PPARA null mutants compared with control RNAi animals (Figure 9—figure supplement 1A). Similarly, K08C7.4/nfds-1 RNAi had no effect on nhr-49(gf2) animals, and only a mild suppressive effect in nhr-49(gf1) animals (Figure 9—figure supplement 1B). Altogether, these observations suggest that K08C7.4/nfds-1 may be dispensable for host defense and may play a minor role downstream of nhr-49/PPARA.
Discussion
Because bacteria serve as nutritional source for C. elegans, and because intestinal infections cause destruction of the epithelium resulting in loss of nutrient absorption, transcriptional responses to nutritional challenges are likely intertwined with the transcriptional host defense response to infection itself. This raises the question of whether C. elegans senses infection as a stress per se, through its physiological consequences in the organism, or a combination of both. Here, by directly comparing transcriptomes of animals that were infected with S. aureus or were starved, we discovered that starvation and infection elicit large and distinct transcriptional signatures. This indicates that the C. elegans host response to S. aureus infection is not entirely the result of starvation, and enables the dissection of infection-specific and starvation-specific host response regulatory modules as shown here.
In the present study, we found that loss of HLH-30/TFEB almost completely abrogated differential gene expression between starvation and infection – implicating HLH-30/TFEB not just in a hypothetical overlapping response but also in each of these two distinct signatures. This strongly suggests that HLH-30/TFEB integrates metabolic and other stresses to contribute to stress-specific transcriptional responses. The molecular mechanisms that enable a single transcription factor to mediate specific transcriptional responses to distinct stresses may involve stress-specific signals or transcriptional co-factors.
By focusing on fmo-2/FMO5, which we first showed was highly and specifically induced by S. aureus infection (Irazoqui et al., 2008; Irazoqui et al., 2010a) and is only partially dependent on HLH-30/TFEB (Visvikis et al., 2014), we discovered a novel role for the nuclear receptor NHR-49/PPAR-α in host defense against S. aureus infection. This discovery is related to prior studies that showed that Enterococcus faecalis, an enteric Gram-positive human pathogen unrelated to S. aureus, induces fmo-2/FMO5 during infection of C. elegans (Dasgupta et al., 2020). In the same work, RNAi of nhr-49/PPARA resulted in enhanced susceptibility to P. aeruginosa, S. enterica serovar Typhimurium, and Candida albicans, but not S. aureus (Dasgupta et al., 2020). These results suggest that nhr-49/PPARA may play other roles in host defense against infection, aside from the induction of fmo-2/FMO5 (which is not induced by P. aeruginosa [Figure 3—figure supplement 1 and Irazoqui et al., 2008, Irazoqui et al., 2010a]). Moreover, nhr-49/PPARA RNAi did not abrogate Pfmo-2::gfp expression in the pharynx (Dasgupta et al., 2020). The reasons of these discrepancies with our observations remain unclear, but could be related to the use of RNAi instead of null alleles or to pathogen-intrinsic differences between S. aureus and E. faecalis. Nonetheless, fmo-2/FMO5 was first described as the most highly induced gene in E. faecalis -infected animals compared with E. coli controls several years ago (Wong et al., 2007; Yuen and Ausubel, 2018). Subsequent work showed that nhr-49/PPARA silencing impaired infection survival of E. faecalis (Sim and Hibberd, 2016), but the connection between nhr-49/PPARA and fmo-2/FMO5 during infection was not established until our present work and that of others (Dasgupta et al., 2020). Thus, NHR-49/PPAR-α appears to play an important role in defense against a broad range of bacteria, a conclusion that is reinforced by the recent identification of small molecules that protect germline-defective C. elegans from P. aeruginosa -mediated killing via NHR-49/PPAR-α (Hummell et al., 2021).
Recently, NHR-49/PPAR-α was shown to mediate the defense response to exogenous oxidative stress (Goh et al., 2018; Hu et al., 2018). Thus, NHR-49/PPAR-α participates in host defense against biotic and abiotic stressors, and should be considered a key player in the organismal stress response alongside SKN-1/NRF2, DAF-16/FOXO3, and HLH-30/TFEB (Blackwell et al., 2015; Lin et al., 2018; Tissenbaum, 2018). Our analysis showed that NHR-49/PPAR-α is not required for as large a portion of the host response to infection as HLH-30/TFEB, even though NHR-49/PPAR-α is partially required for HLH-30/TFEB induction. The larger HLH-30/TFEB regulon implies that during infection signals in addition to NHR-49/PPAR-α activation contribute to HLH-30/TFEB regulation. Similar to HLH-30/TFEB, how NHR-49/PPAR-α induces specific responses to distinct stresses is also unknown. These findings are relevant beyond nematodes, as PPAR-α regulates TFEB in mammalian cells (Kim et al., 2017). Moreover, the microbiota represses HNF4-α, a second NHR-49 homolog, in zebrafish and mice, to maintain intestinal homeostasis (Davison et al., 2017). Therefore, unraveling the control of NHR-49/PPAR-α in relation to intestinal microbiota and infection may provide useful information to understand vertebrate intestinal homeostasis and host defense.
NHR-49/PPAR-α is a known regulator of fat metabolism during starvation (Van Gilst et al., 2005). Lipid metabolism plays an important role in immune activation and host defense in C. elegans (Anderson et al., 2019; Nandakumar and Tan, 2008). Recent work showed that infection by E. faecalis results in NHR-49/PPAR-α-dependent upregulation of lipid catabolism and downregulation of lipid synthesis genes (Dasgupta et al., 2020). Whether this is also true of S. aureus infection is unknown, but our RNA-seq results suggest an enrichment of genes related to ‘Lipid Metabolic Process’ – including catabolism and anabolism, in infected wild type but not nhr-49/PPARA mutants. Thus, a mechanism of NHR-49/PPAR-α-mediated host defense could be by the regulation of fat metabolism, in parallel to induction of fmo-2/FMO5.
In addition to leading us to discover NHR-49/PPAR-α, FMO-2/FMO5 is interesting in its own right. Regulation of fmo-2/FMO5 is complex. During infection, NHR-49/PPAR-α appeared to be essential for fmo-2/FMO5 expression in the whole animal, while hlh-30/TFEB was partially dispensable in the intestine and pharynx. Hypoxia and dietary restriction induce fmo-2/FMO5 (Leiser et al., 2015; Shen et al., 2005), and so do gain-of-function mutations in hif-1/HIF1 or skn-1/NRF2 (Leiser et al., 2015; Nhan et al., 2019). Lifespan extension by dietary restriction or hif-1/HIF1 gain of function requires fmo-2/FMO5; moreover, hlh-30/TFEB loss of function quenches lifespan extension by hif-1/HIF1 and fmo-2/FMO5 induction by hypoxia and fasting (Leiser et al., 2015). These observations lend further support to our findings that HLH-30/TFEB partially induces fmo-2/FMO5 during infection.
In addition, we found that loss of FMO-2/FMO5 causes a severe defect in infection survival without affecting longevity. Thus, FMO-2/FMO5 represents a novel host defense effector. We previously examined the requirement for fmo-2/FMO5 using RNAi-mediated silencing, but such manipulation failed to produce a phenotype for reasons unknown (Irazoqui et al., 2010a). Moreover, the failure of tissue-specific RNAi to elicit a phenotype and the toxicity of fmo-2/FMO5 extrachromosomal transgenic constructs precluded our investigation of the tissues of fmo-2/FMO5 action for host defense. However, single copy intestinal expression of FMO-2/FMO5 boosted host defense, suggesting that FMO-2/FMO5 could play a major role in the intestine, a hub for host defense in C. elegans (McGhee, 2007). Nonetheless, FMO-2/FMO5 induction appears to be a major mechanism of host defense in C. elegans. Exactly how FMO-2/FMO5 promotes host infection survival is poorly understood, but site-directed mutagenesis of the NADPH and FAD-binding sites revealed that the mechanism of action requires its catalytic activity. In addition, human FMO5 can generate large amounts of H2O2 from O2 (Fiorentini et al., 2016). Thus, it is possible that FMO-2/FMO5 is an infection-specific NADPH oxidase that generates H2O2 with antimicrobial and signaling functions (McCallum and Garsin, 2016; Sies and Jones, 2020). The observed roles of fmo-2/FMO5 in survival of heat, di-thiothreitol, and tunicamycin stresses are consistent with a H2O2-mediated signaling role (Leiser et al., 2015). Alternatively, ER localization of FMOs may be important for regulation of ER stress or of the UPRER. Several infections induce ER stress, and the UPRER promotes host defense in many organisms (Choi and Song, 2019). In support of this, yeast FMO (yFMO), which localizes to the ER membrane, is activated by the UPRER and is required for protein folding in the ER (Suh and Robertus, 2000; Suh et al., 1999). Moreover, the five human FMOs localize to the ER membranes of cells of the liver, lung, and kidney (Dolphin et al., 1996; Phillips et al., 1995). Human FMO5 is also expressed in the intestine (Hernandez et al., 2004; Zhang and Cashman, 2006) and murine FMO5 is expressed in the epithelial cells of small and large intestine (Scott et al., 2017). While its subcellular localization in intestinal epithelial cells was not characterized, it is possible that FMO5 localizes to their ER membrane (Phillips et al., 1995). Further research is necessary to understand the precise connections linking infection, ER stress, and FMO function in nematodes and higher organisms.
Despite the paucity of information, FMOs are emerging as important host defense factors across phylogeny. In plants, FMO1 is required for the conversion of pipecolic acid to N-hydroxypipecolic acid, which provides systemic acquired resistance to bacterial and oomycete infections (Hartmann et al., 2018). In mammals, FMO3 is an evolutionarily ancient FMO that exhibits unique substrate specificity and catalyzes multiple drugs that is important for their detoxification (Krueger and Williams, 2005). Moreover, mammalian FMO proteins were recently shown to promote cellular stress resistance and alter cellular metabolism. Overexpression of each of the five mouse FMOs (FMO1-FMO5) in human hepatocytes and kidney epithelial cells conferred resistance to Cd2+, arsenite, paraquat, UV radiation, and rotenone (Huang et al., 2021). Additionally, FMO overexpression increased mitochondrial respiration with concomitant decrease in glycolytic activity (Huang et al., 2021). However, to date no reports have indicated an important role for FMO5, or other FMOs, in mammalian (or any animal) innate immunity. In mice, FMO5 is expressed in many tissues and organs, including the liver and the epithelium of the gastrointestinal tract (Scott et al., 2017). Mouse FMO5 is required for sensing the microbiota, and Fmo5-/- mutants exhibit altered metabolic profiles and microbiomes compared with wild-type mice (Scott et al., 2017). Furthermore, Fmo5-/- mutants exhibit a 70% reduction in plasma TNF-α compared with wild type (Scott et al., 2017). Together, these observations suggest that FMO5 is an important microbiota sensor and effector that modulates the intestinal microbiota, but the mechanism of action is unknown. Therefore, elucidation of mechanisms of host defense mediated by FMO-2 in nematodes and FMO5 in mammals will provide fundamental insight into evolutionarily conserved mechanisms of host defense against infection and identify therapeutic opportunities for infections and inflammatory diseases.
Materials and methods
Experimental model
Request a detailed protocolThe nematode C. elegans was used as the experimental model for this study. Strains were maintained at 15–20°C on Nematode Growth Media (NGM) plates seeded with StrR E. coli OP50-1 strain using standard methods (Stiernagle, 2006).
Method details
Infection assays
Request a detailed protocolS. aureus SH1000 strain was grown overnight in tryptic soy broth (TSB) containing 50 μg/ml kanamycin (KAN). Overnight cultures were diluted 1:1 with TSB and 10 μl of the diluted culture was uniformly spread on the entire surface of 35 mm tryptic soy agar (TSA) plates containing 10 μg/ml KAN. Plates were incubated for 5–6 hr at 37°C, then stored overnight at 4°C. P. aeruginosa isolate PA14 was grown overnight in Luria broth. 10 μl of the overnight culture was uniformly spread on the entire surface of 35 mm NGM plates. Plates were incubated at 37°C for 24 hr followed by 25°C for 48 hr (Powell and Ausubel, 2008). Animals were treated with 100 μg/ml 5-fluoro-2′-deoxyuridine (FUDR) at L4 larval stage for ~24 hr at 15–20°C before transfer to S. aureus or P. aeruginosa plates. Three plates were assayed for each strain in each replicate, with 20–40 animals per plate. Infection assays were carried out at 25°C except for the RNAi experiments. We found that feeding wild type animals with E. coli strain HT115(DE3) prior to putting them on SH1000 made them die much faster than when fed on regular E. coli OP50 food. Therefore, to determine any differences in survival to SH1000 upon RNAi of the target genes, infection assays were carried out at 20°C to slow down the growth of S. aureus. Survival was quantified using standard methods (Powell and Ausubel, 2008). Animals that crawled off the plate or died of bursting vulva were censored. Infection assays were carried out at least twice.
S. aureus infection for RNA analysis
Request a detailed protocolTo prepare infection plates, S. aureus SH1000 was grown overnight in TSB containing 50 μg/ml KAN. 500–1000 μl of overnight culture was uniformly spread on the entire surface of freshly prepared 100 mm TSA plates supplemented with 10 μg/ml KAN. The plates were incubated for 6 hr at 37°C, then stored overnight at 4°C. To prepare P. aeruginosa plates, P. aeruginosa isolate PA14 was grown overnight in Luria broth. 1 ml of overnight culture was uniformly spread on the entire surface of freshly prepared 100 mm NGM plates. The plates were first incubated at 37°C for 24 hr and then at 25°C for 48 hr. To prepare control plates with nonpathogenic E. coli, 1 ml of 10–20X concentrated overnight culture of OP50-1 bacteria was spread on 100 mm NGM plates, incubated for 5–6 hr at 37°C, and then stored at 4°C, similar to S. aureus plates. To prepare plates for starvation, TSA plates were treated similarly to infection plates, except that nothing was added to them. Synchronized young adults of wild type and mutants were seeded the next day on S. aureus, P. aeruginosa, OP50-1, and starvation plates that were previously warmed to room temperature. After 4 hr incubation at 25°C, animals for all conditions were washed 3–4 times in water, and then lysed in 1 ml of TRIzol reagent (Invitrogen). The samples were snap frozen in liquid nitrogen, then stored at −80°C. RNA was extracted using 1–bromo–3–chloropropane (MRC) followed by purification with isopropanol-ethanol precipitation. RNA was analyzed by qPCR or sequencing. In some experiments, the magnitude of fmo-2 expression measured by RT-qPCR showed some inter-trial variation. The reasons for this are not fully understood, but could be related to the very low expression in infected animals or to variation in environmental variables, such as plate batch. Regardless, the results strongly support our conclusions regarding hlh-30 and nhr-49 dependency. For sequencing, RNA was additionally purified using PureLink RNA Mini Kit (Invitrogen). Four independent biological replicates were submitted to BGI for library preparation and sequencing using BGI-seq 500.
Quantitative RT-PCR
Request a detailed protocolAfter each treatment, C. elegans were collected in sterile water and lysed using TRIzol Reagent (Invitrogen). Total RNA was extracted and purified as described before and then digested with DNAse (Bio-Rad). 100–1000 ng of total RNA was used for cDNA synthesis using iScript cDNA synthesis kit (Bio-Rad). RT-qPCR was performed using SYBR Green Supermix (Bio-Rad) using a ViiA7 Real-Time qPCR system (Applied Biosystems). Primer sequences are provided in Supplementary file 5. At least two independent biological replicates were used for each treatment and C. elegans strain. qPCR Ct values were normalized to the snb-1 control gene, which did not change with the conditions tested, to calculate RT-qPCR ΔCt values. Data analysis was carried out using the Pfaffl, 2001 method. Heat maps were generated using open access online tool Morpheus (https://software.broadinstitute.org/morpheus).
RNA sequencing analysis
Request a detailed protocolBGI provided clean reads in FASTQ format. Clean FASTQ files were verified using FastQC (https://www.bioinformatics.babraham.ac.uk/projects/fastqc) using Bioconductor in RStudio (Loraine et al., 2015) and used as input for read mapping in Salmon v.0.9.1 (Patro et al., 2017) using WBCel.235.cdna from Ensembl (http://www.ensembl.org) as reference transcriptome. Salmon outputs in quant format were used for input in DESeq2 (Love et al., 2014) in Bioconductor in RStudio for count per gene estimation using batch correction. Total counts per gene tables from DESeq2 were used as input for DEBrowser (Kucukural et al., 2019) for verification of transcriptome replicate similarity, data analysis using the built-in DESeq2 algorithm for differential gene expression analysis (adjusted p value ≤ 0.01 was considered significant), visualization, and interactive data mining. Overlap between gene sets was determined using the Venn tool in BioInfoRx (https://bioinforx.com). GO representation analysis was performed using online tool g:Profiler (Raudvere et al., 2019) (https://biit.cs.ut.ee/gprofiler/gost).
Longevity (aging) assays
Request a detailed protocolAnimals were transferred to 60 mm NGM plates seeded with 10–20X concentrated E. coli OP50-1 bacteria supplemented with 100 μg/ml FUDR. For consistency with infection assays, longevity assays were also performed at 25°C. Three plates were assayed for each strain in each replicate, with 20–40 animals per plate. Experiments were repeated at least twice. Animals that did not respond to prodding were scored as dead, and the animals that died from bursting vulva or crawled off the plate were censored.
RNA interference (RNAi)
Request a detailed protocolKnockdown of genes was carried out by feeding C. elegans the E. coli strain HT115(DE3) expressing double-stranded RNA against the target gene using standard methods (Kamath et al., 2001). Briefly, glycerol stocks of RNAi clones containing the appropriate vectors were streaked out on LB media plates containing ampicillin (50 μg/ml) and tetracycline (10 μg/ml) and the bacteria were allowed to grow at 37°C for 16 hr. Single colonies of the clones were then grown in LB liquid media containing ampicillin (50 μg/ml) for 16 hr at 37°C with constant shaking. The cultures were concentrated 10X and 300–500 μl were plated on NGM plates containing ampicillin (50 μg/ml) and IPTG (1 mM). Plates were dried in a fume hood and left overnight at room temperature for dsRNA induction. Next day, five L4 animals were placed on the plates and then allowed to grow at 20°C for 4 days to get enough L4 progeny of the next generation. FUDR (100 μg/ml) was placed on the plates and next day young adult animals were picked and placed on TSA plates containing uniformly spread SH1000. Survival on SH1000 was performed as described above in Infection Assays. For assessing lifespan after RNAi of the target genes, L4 animals were picked and placed on OP50 containing NGM plates supplemented with 100 μg/ml FUDR and then placed at 25°C. Lifespan was carried out as described above in Longevity (aging) assays.
Generation of transgenic strains
Request a detailed protocolTo construct Pnhr-49::nhr-49::gfp containing plasmid, a 6.6 kb genomic fragment of nhr-49 gene (comprising of 4.4 kb coding region covering all nhr-49 transcripts plus 2.2 kb sequence upstream of ATG) was cloned into the GFP expression vector pPD95.77 (Addgene #1495), as reported previously (Ratnappan et al., 2014). For generating tissue-specific constructs, the nhr-49 promoter was replaced with tissue-specific promoters using SbfI and SalI restriction enzymes. The primers that were used to amplify tissue-specific promoters are listed in Supplementary file 5. For the generation of rescue strains, each rescue plasmid (100 ng/μl) was injected along with pharyngeal muscle-specific Pmyo-2::mCherry co-injection marker (25 ng/μl) into nhr-49(nr2041) mutant strain, using standard methods (Mello and Fire, 1995). Strains were maintained by picking animals that were positive for both GFP and mCherry.
To construct PK08C7.4::gfp containing plasmid, a 2 kb 5’ upstream sequence (upstream of ATG) was amplified from C. elegans genomic DNA, and then cloned into the GFP expression vector pPD95.75 (Addgene #1494) using Gibson Assembly (Gibson et al., 2009). Promoter and vector sequences were assembled using Gibson Assembly Kit (NEB #E2611). For the generation of transgenic strains, PK08C7.4::gfp containing plasmid was injected into wild-type animals (100 ng/μl) along with rol-6(su1006) con-injection marker (for a total of 700 ng), using standard methods (Mello and Fire, 1995). Strains were maintained by picking animals that were rollers as well as positive for GFP. The primers that were used to amplify K08C7.4 promoter and pPD95.75 vector sequences used in the Gibson Assembly are listed in Supplementary file 5.
fmo-2(FAD), fmo-2(NADPH), and fmo-2(FAD+NADPH) strains were generated using CRISPR-Cas9 genome editing as described (Dokshin et al., 2018). Residues for mutation were selected based on protein sequence alignment and as previously reported (Bartsch et al., 2006). To isolate worms with mutated residue(s) in FAD or NADPH motifs, silent mutations that resulted in restriction enzyme sites (PvuII for FAD, and AvaII for NADPH) without any change in the amino acid(s) were created in the repair templates. A PCR fragment spanning the mutated nucleotides was amplified from the progeny of the injected worms, followed by digestion with the above-mentioned restriction enzymes. Mutations in FAD and NADPH motifs were confirmed by sequencing PCR fragments amplified from the corresponding regions in the mutant animals. To generate fmo-2(FAD+NADPH) double mutant, the fmo-2(NADPH) mutant strain was used as a background for a second round of CRISPR microinjections. Sequences for crRNAs, repair templates, and the genotyping primers used for the construction of these strains are listed in Supplementary file 5.
Image analysis
Request a detailed protocolImages were captured using a Lionheart FX Automatic Microscope (BioTek Instruments) under a 4X or 20X objective. Twenty to 50 animals were anesthetized using 20–100 mM NaN3 on a 2% agarose pad immediately prior to imaging. Comparable images were captured with the same exposure time and magnification. Fluorescence microscopy analysis was independently replicated at least three times. Fluorescence intensity was quantified using ImageJ. Intestinal fluorescent intensity was quantified by outlining the intestine in the DIC images and then quantifying the corresponding fluorescent signals in the GFP images using ImageJ. There are several potential factors that may cause differences between RT-qPCR of fmo-2 transcript and quantification of images of the Pfmo-2::gfp transcriptional reporter: (1) fluorescence microscopy does not possess the same sensitivity and linear range as RT-qPCR, which is the preferred method for expression analysis; (2) the Pfmo-2::gfp transcriptional reporter is a transgene that only contains 1536 bp of upstream (promoter) sequence plus the first 16 codons of fmo-2 (Goh et al., 2018), and thus could be missing regulatory elements that are present in the endogenous (chromosomal) locus; (3) steady-state mRNA levels (measured by RT-qPCR) are the net result of the rates of transcription and degradation, and so mRNA stabilization could play a role in increased fmo-2 expression, which would not be reproduced by the GFP reporter.
Quantification and statistical analysis
Request a detailed protocolPrism 8 (GraphPad) was used for statistical analyses. Survival data were compared using the Log-Rank (Mantel-Cox) test. A p value ≤ 0.05 was considered significantly different from control. For comparisons to a single reference, two-sample, two-tailed t tests were performed to evaluate differences between ΔCt values (Schmittgen and Livak, 2008). For multiple comparisons, statistical significance was examined by one-way ANOVA followed by Šídák’s post-hoc test. A p value ≤ 0.05 was considered significant.
Data availability
RNA-seq reads are deposited in SRA (NCBI/NIH).
-
NCBI BioProjectID PRJNA727590. S. aureus SH1000 vs Starvation transcriptional profiling (by RNA sequencing) in C. elegans and its dependence on HLH-30.
-
NCBI BioProjectID PRJNA728096. S. aureus SH1000 vs Starvation transcriptional profiling (by RNA sequencing) in C. elegans and its dependence on NHR-49.
References
-
SKN-1/Nrf, stress responses, and aging in Caenorhabditis elegansFree Radical Biology & Medicine 88:290–301.https://doi.org/10.1016/j.freeradbiomed.2015.06.008
-
large-scale screening for targeted knockouts in the Caenorhabditis elegans genomeG3: Genes, Genomes, Genetics 2:1415–1425.https://doi.org/10.1534/g3.112.003830
-
Insights Into the Role of Endoplasmic Reticulum Stress in Infectious DiseasesFrontiers in Immunology 10:3147.https://doi.org/10.3389/fimmu.2019.03147
-
Insights from the worm: the C. elegans model for innate immunitySeminars in Immunology 26:303–309.https://doi.org/10.1016/j.smim.2014.04.005
-
The Caenorhabditis elegans oxidative stress response requires the NHR-49 transcription factorG3: Genes, Genomes, Genetics 8:3857–3863.https://doi.org/10.1534/g3.118.200727
-
Flavin-Containing monooxygenases are conserved regulators of stress resistance and metabolism. frontCell & Developmental Biology 9:630188.https://doi.org/10.3389/fcell.2021.630188
-
Flavin dependent monooxygenasesArchives of Biochemistry and Biophysics 544:2–17.https://doi.org/10.1016/j.abb.2013.12.005
-
Evolution of host innate defence: insights from Caenorhabditis elegans and primitive invertebratesNature Reviews Immunology 10:47–58.https://doi.org/10.1038/nri2689
-
PPAR-α activation mediates innate host defense through induction of TFEB and lipid catabolismThe Journal of Immunology 198:3283–3295.https://doi.org/10.4049/jimmunol.1601920
-
Determination of FAD-binding domain in flavin-containing monooxygenase 1 (FMO1)Archives of Biochemistry and Biophysics 345:271–277.https://doi.org/10.1006/abbi.1997.0242
-
The tubulin repertoire of C. elegans sensory neurons and its context-dependent role in process outgrowthMolecular Biology of the Cell 27:3717–3728.https://doi.org/10.1091/mbc.E16-06-0473
-
Analysis and visualization of RNA-Seq expression data using RStudio, Bioconductor, and integrated genome browserMethods Mol. Biol. Clifton NJ 1284:481–501.https://doi.org/10.1007/978-1-4939-2444-8_24
-
DNA transformationMethods in Cell Biology 48:451–482.https://doi.org/10.1016/S0091-679X(08)61399-0
-
MXL-3 and HLH-30 transcriptionally link lipolysis and autophagy to nutrient availabilityNature Cell Biology 15:668–676.https://doi.org/10.1038/ncb2741
-
A new mathematical model for relative quantification in real-time RT-PCRNucleic Acids Research 29:45.https://doi.org/10.1093/nar/29.9.e45
-
The molecular biology of the flavin-containing monooxygenases of manChemico-Biological Interactions 96:17–32.https://doi.org/10.1016/0009-2797(94)03580-2
-
Models of Caenorhabditis elegans infection by bacterial and fungal pathogensMethods in Molecular Biology 415:403–427.https://doi.org/10.1007/978-1-59745-570-1_24
-
TFEB and TFE3: linking lysosomes to cellular adaptation to stressAnnual Review of Cell and Developmental Biology 32:255–278.https://doi.org/10.1146/annurev-cellbio-111315-125407
-
G:profiler: a web server for functional enrichment analysis and conversions of gene lists (2019 update)Nucleic Acids Research 47:W191–W198.https://doi.org/10.1093/nar/gkz369
-
Analyzing real-time PCR data by the comparative C(T) methodNature Protocols 3:1101–1108.https://doi.org/10.1038/nprot.2008.73
-
TFEB controls cellular lipid metabolism through a starvation-induced autoregulatory loopNature Cell Biology 15:647–658.https://doi.org/10.1038/ncb2718
-
Roles of the HIF-1 hypoxia-inducible factor during hypoxia response in Caenorhabditis elegansJournal of Biological Chemistry 280:20580–20588.https://doi.org/10.1074/jbc.M501894200
-
Reactive oxygen species (ROS) as pleiotropic physiological signalling agentsNature Reviews Molecular Cell Biology 21:363–383.https://doi.org/10.1038/s41580-020-0230-3
-
DAF-16: foxo in the context of C. elegansCurrent Topics in Developmental Biology 127:1–21.https://doi.org/10.1016/bs.ctdb.2017.11.007
-
Quantitative analysis of FMO gene mRNA levels in human tissuesDrug Metabolism and Disposition: The Biological Fate of Chemicals 34:19–26.https://doi.org/10.1124/dmd.105.006171
-
Two forms of death in ageing Caenorhabditis elegansNature Communications 8:15458.https://doi.org/10.1038/ncomms15458
Article and author information
Author details
Funding
National Institute of General Medical Sciences (R01-GM101056)
- Javier E Irazoqui
National Science Foundation (NSF1457055)
- Javier E Irazoqui
NIA (R01AG051659)
- Arjumand Ghazi
Canadian Institutes of Health Research (CIHR) (PJT-153199)
- Stefan Taubert
The funders had no role in study design, data collection and interpretation, or the decision to submit the work for publication.
Acknowledgements
The authors are grateful to members of the Irazoqui laboratory, the Program in Innate Immunity, and the Department of Microbiology and Physiological Systems for helpful insights and discussions. Joyce Barrett, Linda Benson, Richard Fish, Amy Parker, Cheryl Barry, and Tammy Bailey provided expert facilities and administrative assistance. Scott F Leiser (University of Michigan) provided KAE11 strain. Some strains used in this study were provided by the Caenorhabditis Genetics Center, which is funded by the NIH Office of Research Infrastructure Programs (P40-OD010440). Research reported in this publication was supported by the National Institute of General Medical Sciences of the National Institutes of Health under award number GM101056, and by the National Science Foundation under award number NSF1457055 (to JEI), and by a grant from the National Institutes of Aging (R01AG051659) to AG. The content is solely the responsibility of the authors and does not necessarily represent the official views of the National Institutes of Health.
Version history
- Received: September 4, 2020
- Accepted: April 29, 2021
- Accepted Manuscript published: May 12, 2021 (version 1)
- Accepted Manuscript updated: May 17, 2021 (version 2)
- Version of Record published: May 21, 2021 (version 3)
Copyright
© 2021, Wani et al.
This article is distributed under the terms of the Creative Commons Attribution License, which permits unrestricted use and redistribution provided that the original author and source are credited.
Metrics
-
- 2,641
- views
-
- 329
- downloads
-
- 38
- citations
Views, downloads and citations are aggregated across all versions of this paper published by eLife.
Download links
A two-part list of links to download the article, or parts of the article, in various formats.
Downloads (link to download the article as PDF)
Open citations (links to open the citations from this article in various online reference manager services)
Cite this article (links to download the citations from this article in formats compatible with various reference manager tools)
NHR-49/PPAR-α and HLH-30/TFEB cooperate for C. elegans host defense via a flavin-containing monooxygenase
eLife 10:e62775.
https://doi.org/10.7554/eLife.62775
Further reading
-
- Immunology and Inflammation
Environmental air irritants including nanosized carbon black (nCB) can drive systemic inflammation, promoting chronic obstructive pulmonary disease (COPD) and emphysema development. The let-7 microRNA (Mirlet7 miRNA) family is associated with IL-17-driven T cell inflammation, a canonical signature of lung inflammation. Recent evidence suggests the Mirlet7 family is downregulated in patients with COPD, however, whether this repression conveys a functional consequence on emphysema pathology has not been elucidated. Here, we show that overall expression of the Mirlet7 clusters, Mirlet7b/Mirlet7c2 and Mirlet7a1/Mirlet7f1/Mirlet7d, are reduced in the lungs and T cells of smokers with emphysema as well as in mice with cigarette smoke (CS)- or nCB-elicited emphysema. We demonstrate that loss of the Mirlet7b/Mirlet7c2 cluster in T cells predisposed mice to exaggerated CS- or nCB-elicited emphysema. Furthermore, ablation of the Mirlet7b/Mirlet7c2 cluster enhanced CD8+IL17a+ T cells (Tc17) formation in emphysema development in mice. Additionally, transgenic mice overexpressing Mirlet7g in T cells are resistant to Tc17 and CD4+IL17a+ T cells (Th17) development when exposed to nCB. Mechanistically, our findings reveal the master regulator of Tc17/Th17 differentiation, RAR-related orphan receptor gamma t (RORγt), as a direct target of Mirlet7 in T cells. Overall, our findings shed light on the Mirlet7/RORγt axis with Mirlet7 acting as a molecular brake in the generation of Tc17 cells and suggest a novel therapeutic approach for tempering the augmented IL-17-mediated response in emphysema.
-
- Immunology and Inflammation
SARS-CoV-2 vaccines have been used worldwide to combat COVID-19 pandemic. To elucidate the factors that determine the longevity of spike (S)-specific antibodies, we traced the characteristics of S-specific T cell clonotypes together with their epitopes and anti-S antibody titers before and after BNT162b2 vaccination over time. T cell receptor (TCR) αβ sequences and mRNA expression of the S-responded T cells were investigated using single-cell TCR- and RNA-sequencing. Highly expanded 199 TCR clonotypes upon stimulation with S peptide pools were reconstituted into a reporter T cell line for the determination of epitopes and restricting HLAs. Among them, we could determine 78 S epitopes, most of which were conserved in variants of concern (VOCs). After the 2nd vaccination, T cell clonotypes highly responsive to recall S stimulation were polarized to follicular helper T (Tfh)-like cells in donors exhibiting sustained anti-S antibody titers (designated as ‘sustainers’), but not in ‘decliners’. Even before vaccination, S-reactive CD4+ T cell clonotypes did exist, most of which cross-reacted with environmental or symbiotic microbes. However, these clonotypes contracted after vaccination. Conversely, S-reactive clonotypes dominated after vaccination were undetectable in pre-vaccinated T cell pool, suggesting that highly responding S-reactive T cells were established by vaccination from rare clonotypes. These results suggest that de novo acquisition of memory Tfh-like cells upon vaccination may contribute to the longevity of anti-S antibody titers.


