Social-like responses are inducible in asocial Mexican cavefish despite the exhibition of strong repetitive behavior
- School of Life Sciences, the University of Hawai‘i at Manoa, United States
Figures
Figure 1 with 1 supplement
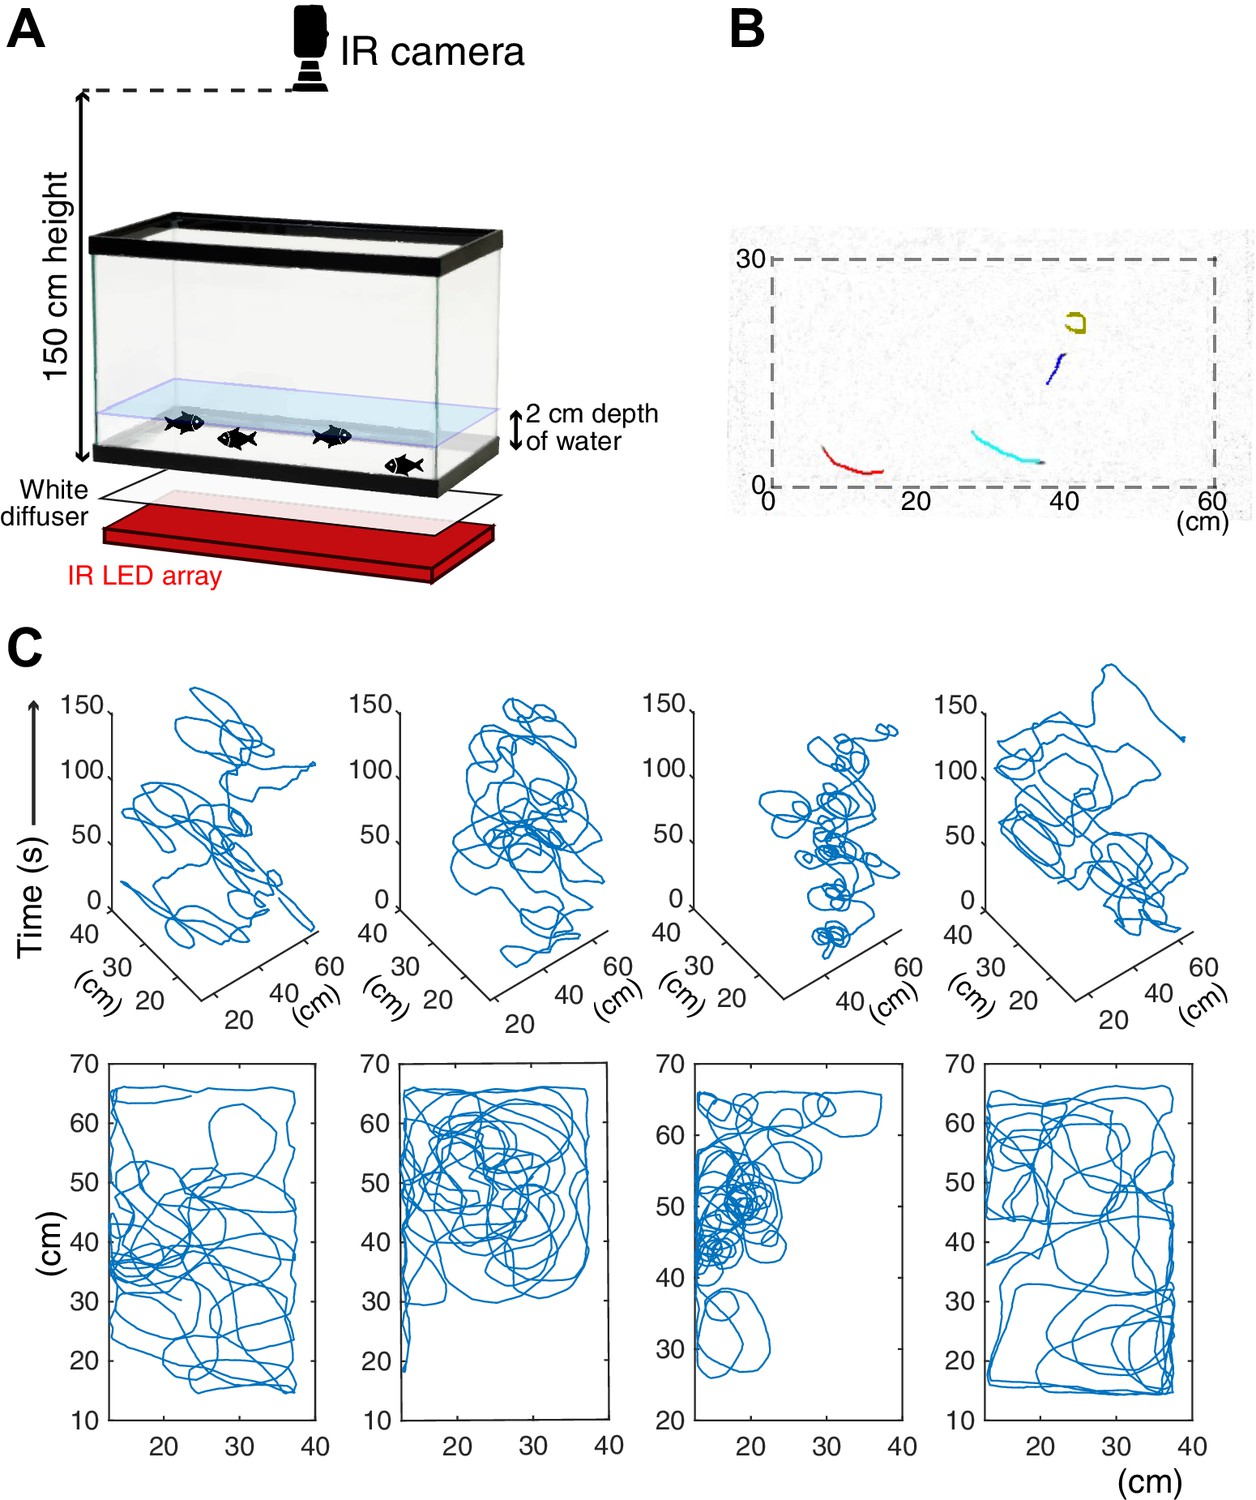
Schematics of the behavioral assay.
(A) Schematics of the assay system. The recording tank was back-lighted by an infrared (IR) LED array with a white paper diffuser. The IR camera was set at the top of the tank, and fish movement was recorded. (B) One example frame of recorded cavefish video. Coloured lines represent the 1 s (20 frames) trajectories of individual fish detected by idTracker software. (C) Example trajectories of each cavefish from a 2.5 min recording. Each fish shape’s ID was determined by idTracker, and its X-Y coordinates were traced across the entire recording time. The top row (four panels) shows the X-Y-time traces of each of four fish. The bottom row represents the X-Y traces by stacking the time series of the corresponding top row panel.
Figure 1—figure supplement 1

No visual response to the back light emitted from the 850 nm infrared (IR) LED.
(A) Top view of the recording arena. Half of the area was IR illuminated from the bottom, and the other half was not illuminated. The areas of these two regions were exactly the same. (B) No probability difference between these two areas was detected in surface fish or cavefish. These probability scores were at chance level (0.5). Values are the means ± 95% confidence intervals (N = 4 groups, each).
-
Figure 1—figure supplement 1—source data 1
Number of fish found in the infrared-lighted or shaded area within a 5 min period.
- https://cdn.elifesciences.org/articles/72463/elife-72463-fig1-figsupp1-data1-v2.csv
Figure 2 with 4 supplements
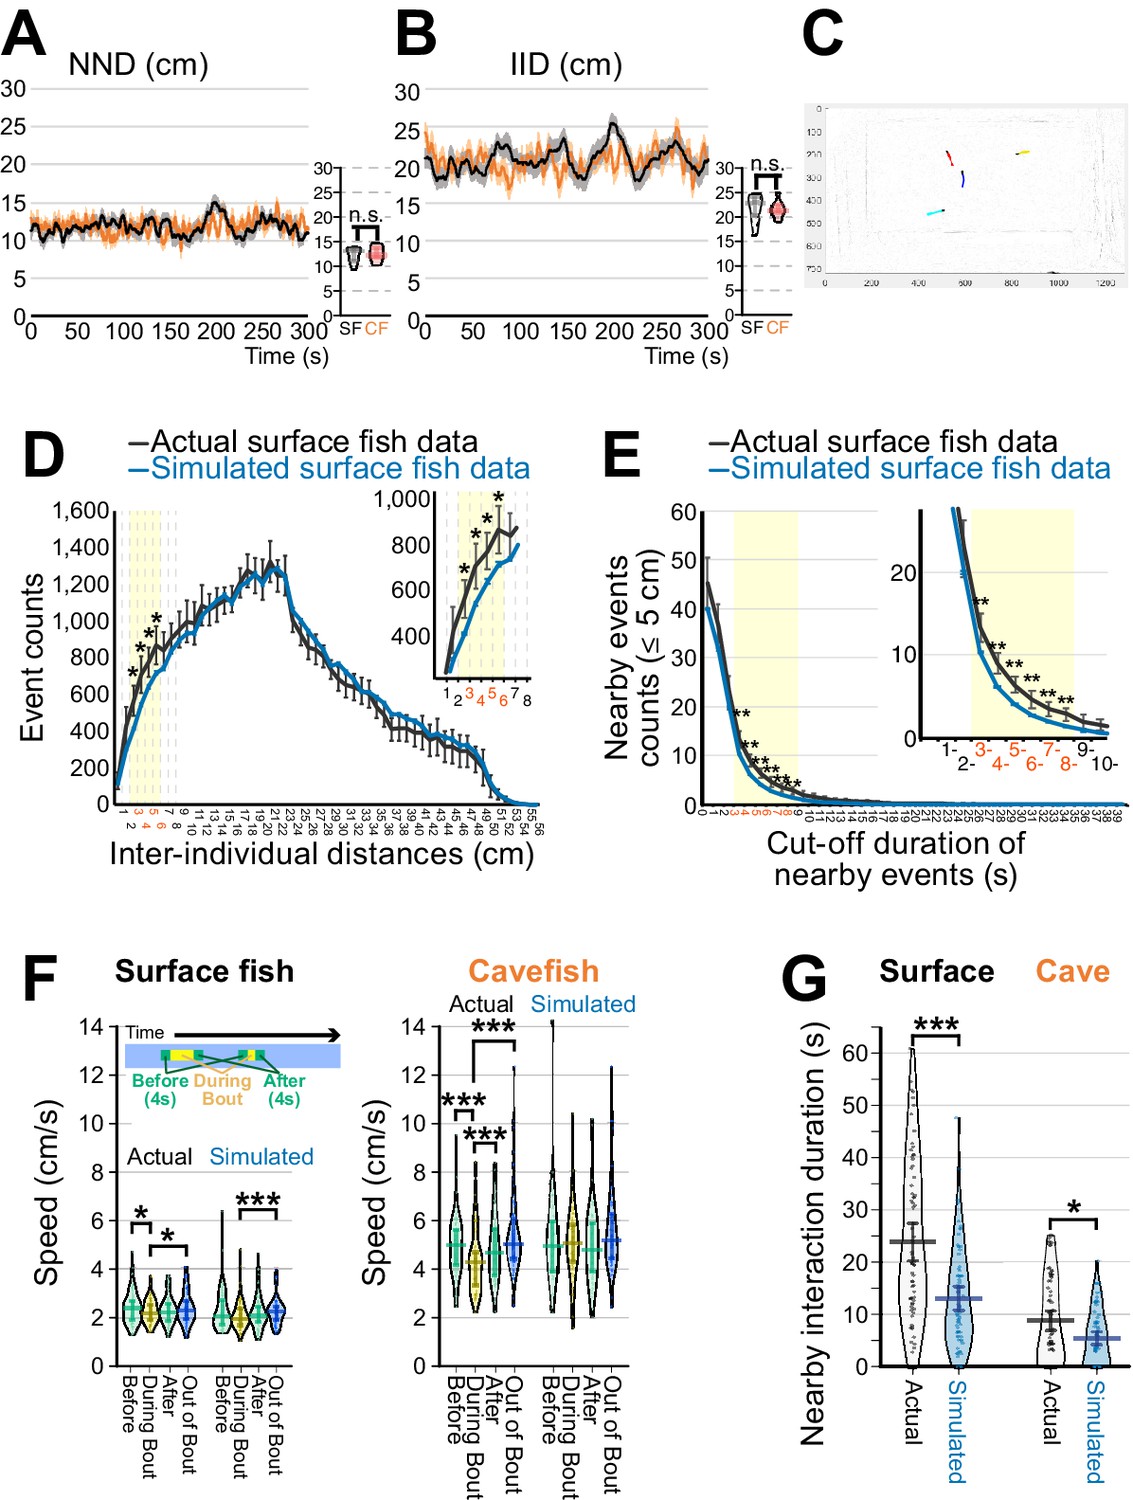
Detection of social-like nearby interactions.
(A, B) Measurements of nearest neighbour distance (NND) (A) and interindividual distance (IID) (B). Surface fish are shown as black lines, and cavefish are shown as orange lines (N = 18 groups of four each). The means ± standard errors of the mean (s.e.m.) in each frame are shown. Smaller panels on the right side of each of (A) and (B) show averages of NND or IID sampled every 30 s of the 300 s assays. n.s.: not significant. (C) An example frame of recorded surface fish video. Coloured lines represent trajectories of individual fish detected by idTracker software (1 s/20-frame trajectories). A red-labeled fish was followed by a blue-labelled fish. (D) Distribution of IID across all frames of 18 surface fish groups, where each group yields six IIDs from each pair among the four fish (4C2 = 6, black line: means ± 95 % confidence intervals (CIs)). Similarly, the distribution of IIDs was calculated from 1,280 simulated randomly sampled groups (blue line: means ± 95% CI). IID between 3 and 6 cm showed significant separation between actual and simulated IIDs (yellow shaded areas). Inset shows the magnified 3–6 cm interval. *: p < 0.05, t-test between the actual and simulated data adjusted by the Holm correction within the yellow shaded area. (E) Inverse cumulative distribution of the nearby-event durations. The inverse cumulative distributions for the event durations whose IIDs were less than 5 cm are shown, where the black lines represent the results from the actual 18 surface fish groups (means ± 95% CI) and the blue lines represent the results of the 1,280 simulated groups (means ± 95% CI). In the actual surface fish data, the nearby-interaction durations between 3 and 8 s were significantly higher than the simulated surface fish data. **: p < 0.01, t-test between the actual and simulated data adjusted by the Holm correction within the yellow shaded area. (F) Swimming velocity during or out of nearby interactions. The mean swimming speeds (1) during the 4 s before the nearby-interaction bout, (2) during the bout, (3) during 4 s after the bout, and (4) during out-of-bout periods are shown for surface fish (left) and cavefish (right) by using the actual and simulated dataset (N = 72 from 18 groups for each of surface fish and cavefish and for each of the actual and randomly sampled data). Swimming speeds are lower in the cavefish during the bout in the actual data. (G) Pirate plots depicting nearby-interaction durations detected by the newly developed method. The plot of the actual data is shown in black and white, and the simulated data are shown in light blue (N = 72 from 18 groups for each of the surface fish and cavefish). The thicknesses of the beans represent data density. *: p < 0.05, ***: p < 0.001. All statistical scores are available in Supplementary file 1. The new detection protocol for determining nearby interactions is described in Materials and methods and Figure 2—figure supplements 1–3. The involvement of the lateral line sensory system in the nearby interaction was tested, and the data are presented in Figure 2—figure supplement 4.
-
Figure 2—source data 1
Surface fish’s and cavefish’s inter-individual distance (cm) in every 0.05 s.
- https://cdn.elifesciences.org/articles/72463/elife-72463-fig2-data1-v2.csv
-
Figure 2—source data 2
Surface fish’s and cavefish’s inter-individual distance (cm) in every 0.05 s.
- https://cdn.elifesciences.org/articles/72463/elife-72463-fig2-data2-v2.csv
-
Figure 2—source data 3
Event numbers counted under the cut-off distances between pairs of fish in the actual and simulated surface fish data.
- https://cdn.elifesciences.org/articles/72463/elife-72463-fig2-data3-v2.csv
-
Figure 2—source data 4
Nearby event numbers shorter than 5 cm distance counted more than cut-off duration between pairs of fish in the actual and simulated surface fish data.
- https://cdn.elifesciences.org/articles/72463/elife-72463-fig2-data4-v2.csv
-
Figure 2—source data 5
Speed (cm/s) during the nearby interaction events and other periods, and the detected nearby interaction duration (s) comparing between the actual and simulated random data.
- https://cdn.elifesciences.org/articles/72463/elife-72463-fig2-data5-v2.csv
Figure 2—figure supplement 1
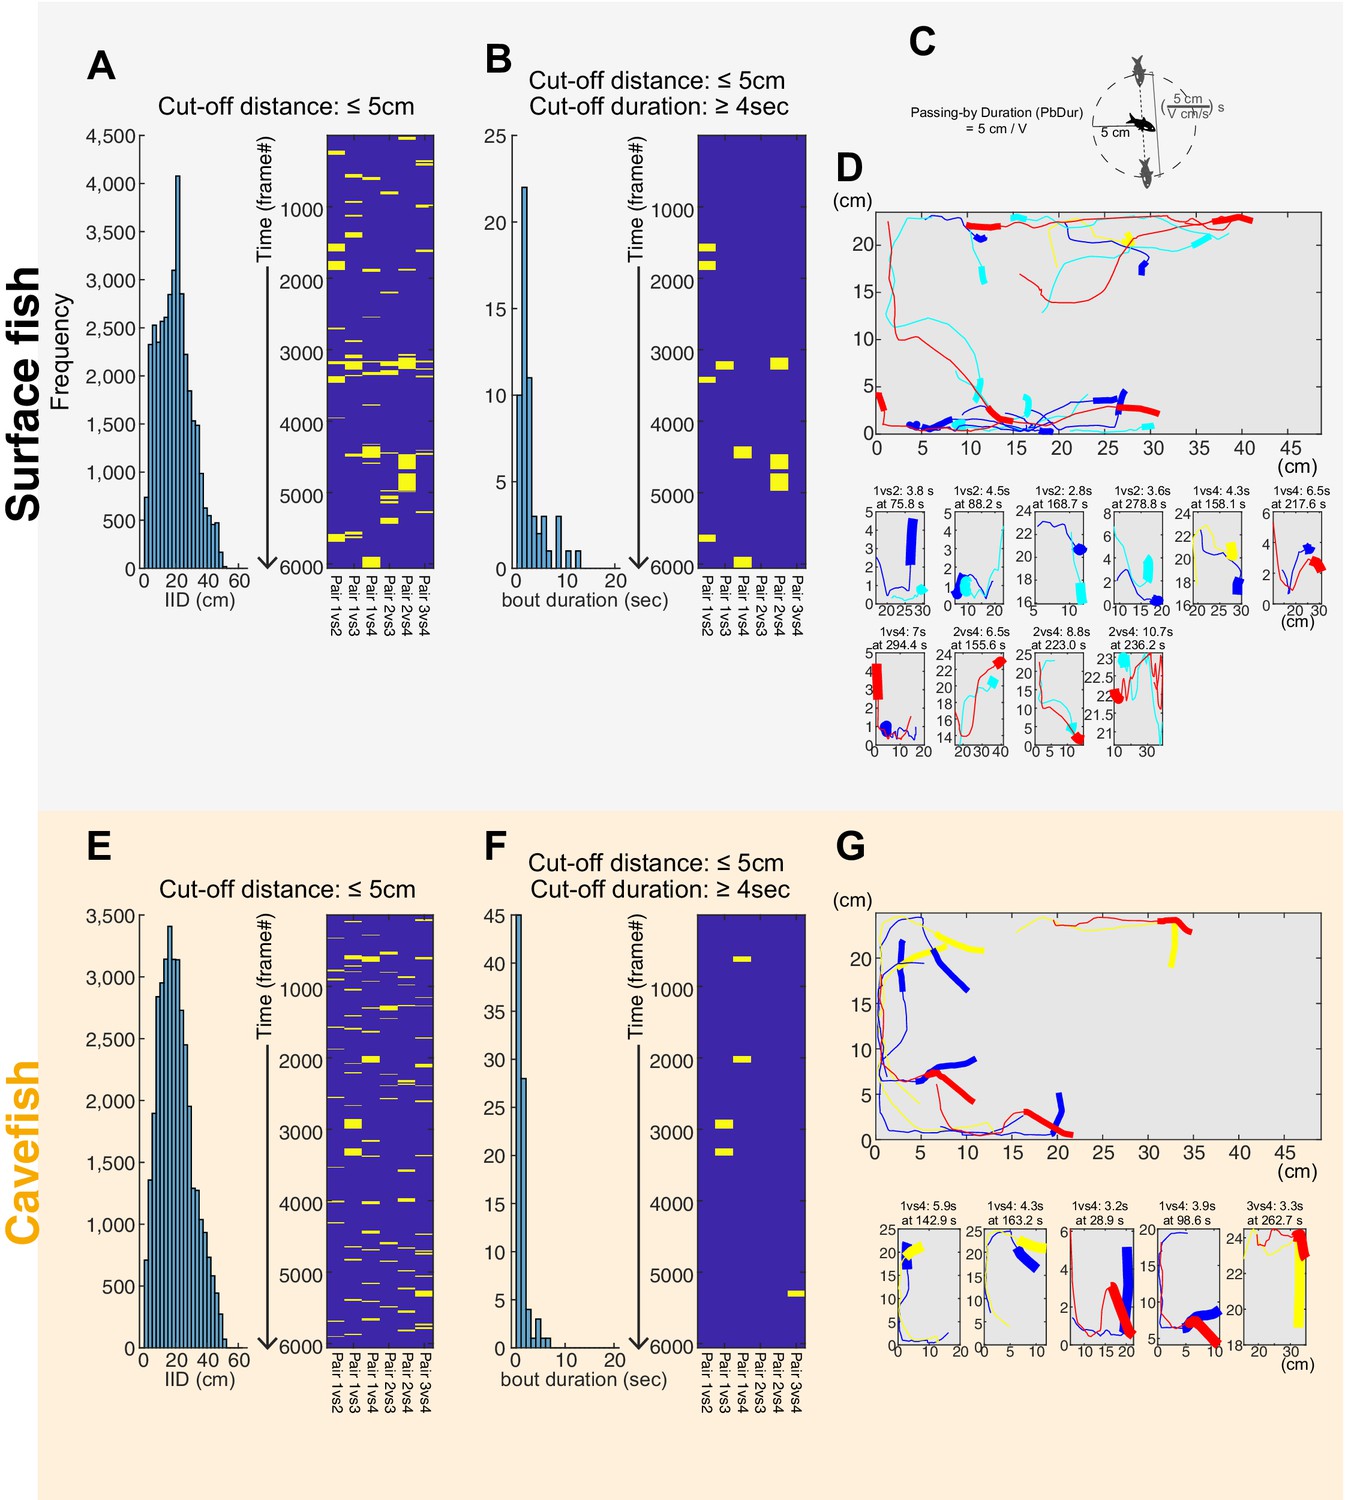
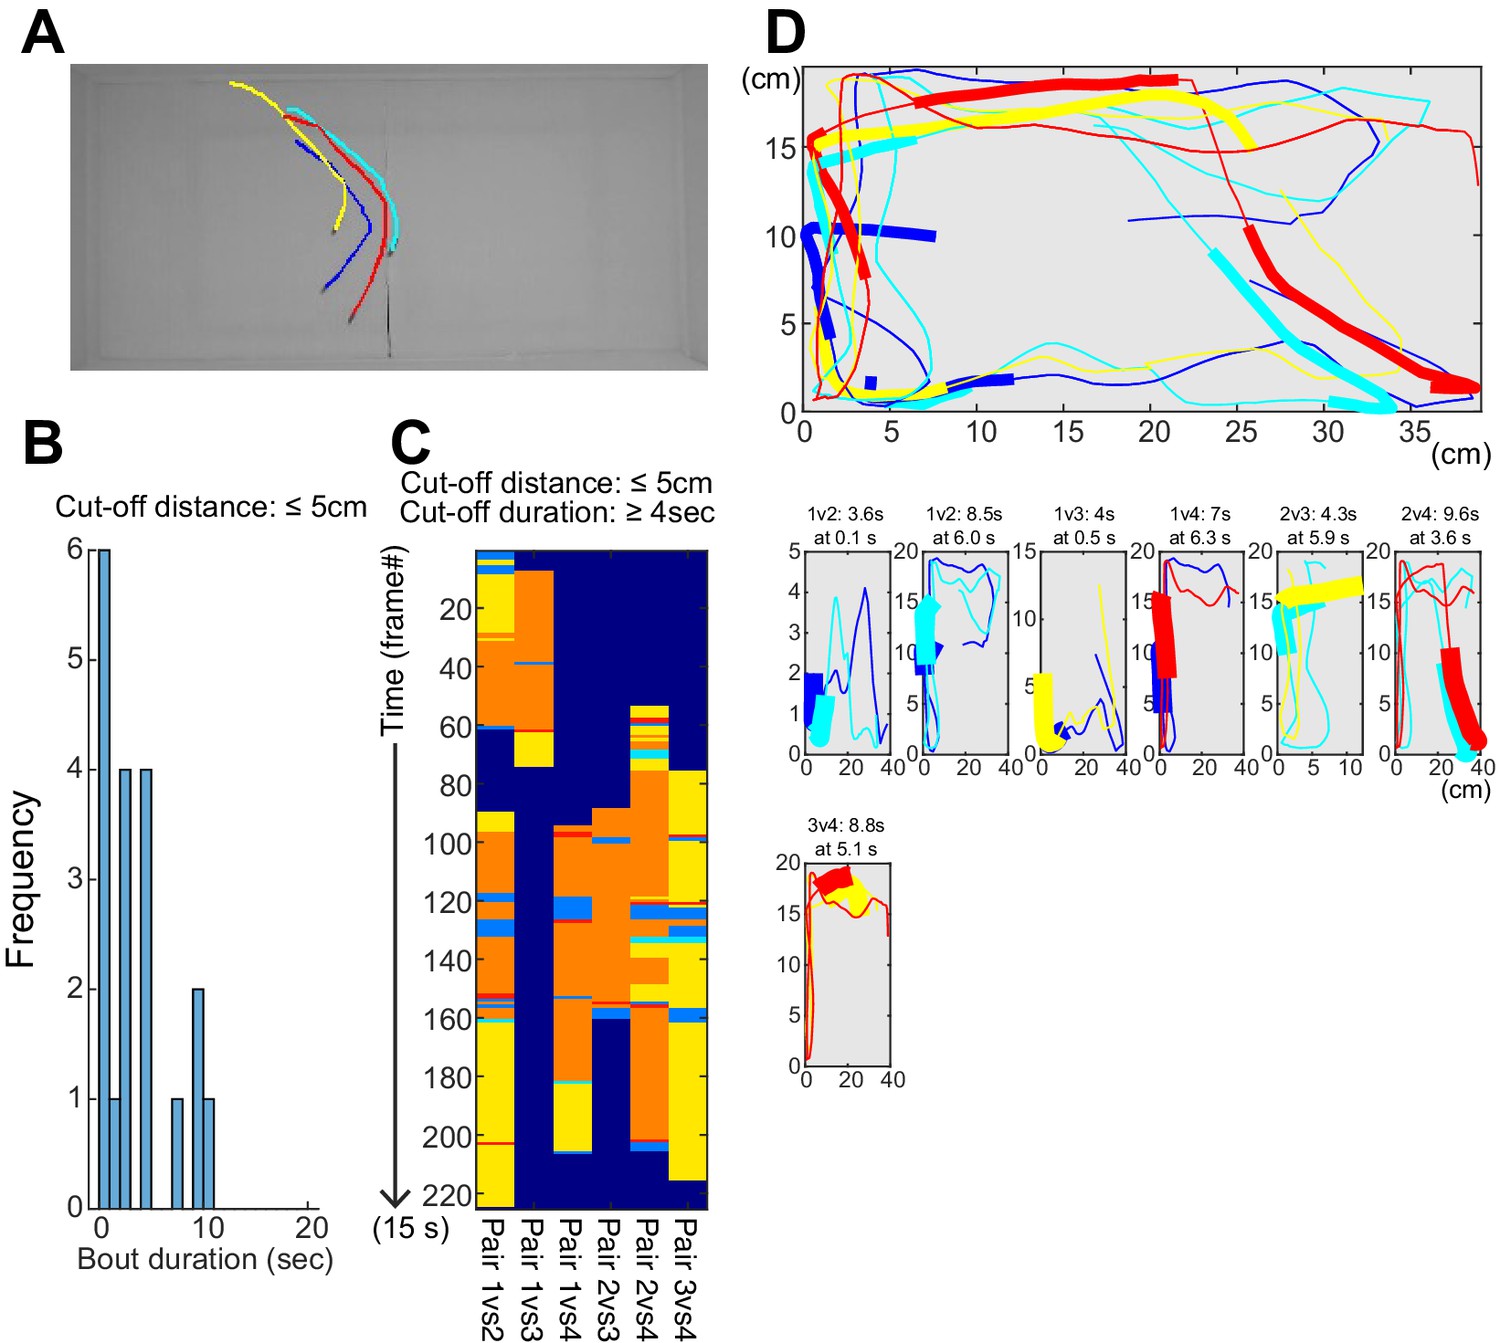
Determine the cut-off distance and cut-off duration for detecting nearby interactions.
(A, B and D) An example of nearby-interaction profiles in surface fish (a four-fish group). (A) A histogram of inter-individual distance (IID; left) and raster plot for the nearby-interaction events (blue background with yellow bars)—each pair of IIDs under the cut-off distance: 5 cm or less (right). IIDs were calculated across all frames (6,000 frames = 5 min) from all six pairs (4C2 = 6 pairs). Six columns in the raster plot represent six pairs of 4 fish (e.g. fish 1 vs fish 2, fish 1 vs fish 3, fish 1 vs fish 4, fish 2 vs fish 3, fish 2 vs fish 4, and fish 3 vs fish 4). (B) The histogram of the bout durations for a given cut-off distance (5 cm or less) (left) and the raster plot of the bouts filtered by the cut-off duration (4 s or more) (right). (C) The schematic explains the average passing-by duration (PbDur). PbDur was subtracted from the durations of each nearby-interaction event, which standardized the nearby-interaction durations based on the means of swimming distance in a group. Please also see Materials and methods. (D) Fish trajectories during nearby interactions detected using the ≤5 cm and ≥4 s criteria with surface fish. Different line colors represent the trajectories of each of four fish. The thick lines represent the two fish trajectories in the first second of the bout, followed by thin lines, indicating the following trajectories during the bout. The top panel shows all nearby interactions from the top view of the arena. Bottom panels show each nearby interaction from the top view. The X- and Y-axes indicate positions of fish, and annotations for each panel show which pair (e.g. fish 1 vs fish two at the far left-second bottom panel), how long (e.g. 3.8 s), and which time point (e.g. at 75.8 s = frame 1516). (E–G) are shown for an example of cavefish data corresponding to figures A, B, and D.
-
Figure 2—figure supplement 1—source data 1
The X-Y coordinates (cm) and distances of each pair (cm) of a four-surface fish group in the dark.
- https://cdn.elifesciences.org/articles/72463/elife-72463-fig2-figsupp1-data1-v2.csv
-
Figure 2—figure supplement 1—source data 2
The X-Y coordinates (cm) and distances of each pair (cm) of a four-cavefish group in the dark.
- https://cdn.elifesciences.org/articles/72463/elife-72463-fig2-figsupp1-data2-v2.csv
Figure 2—figure supplement 2
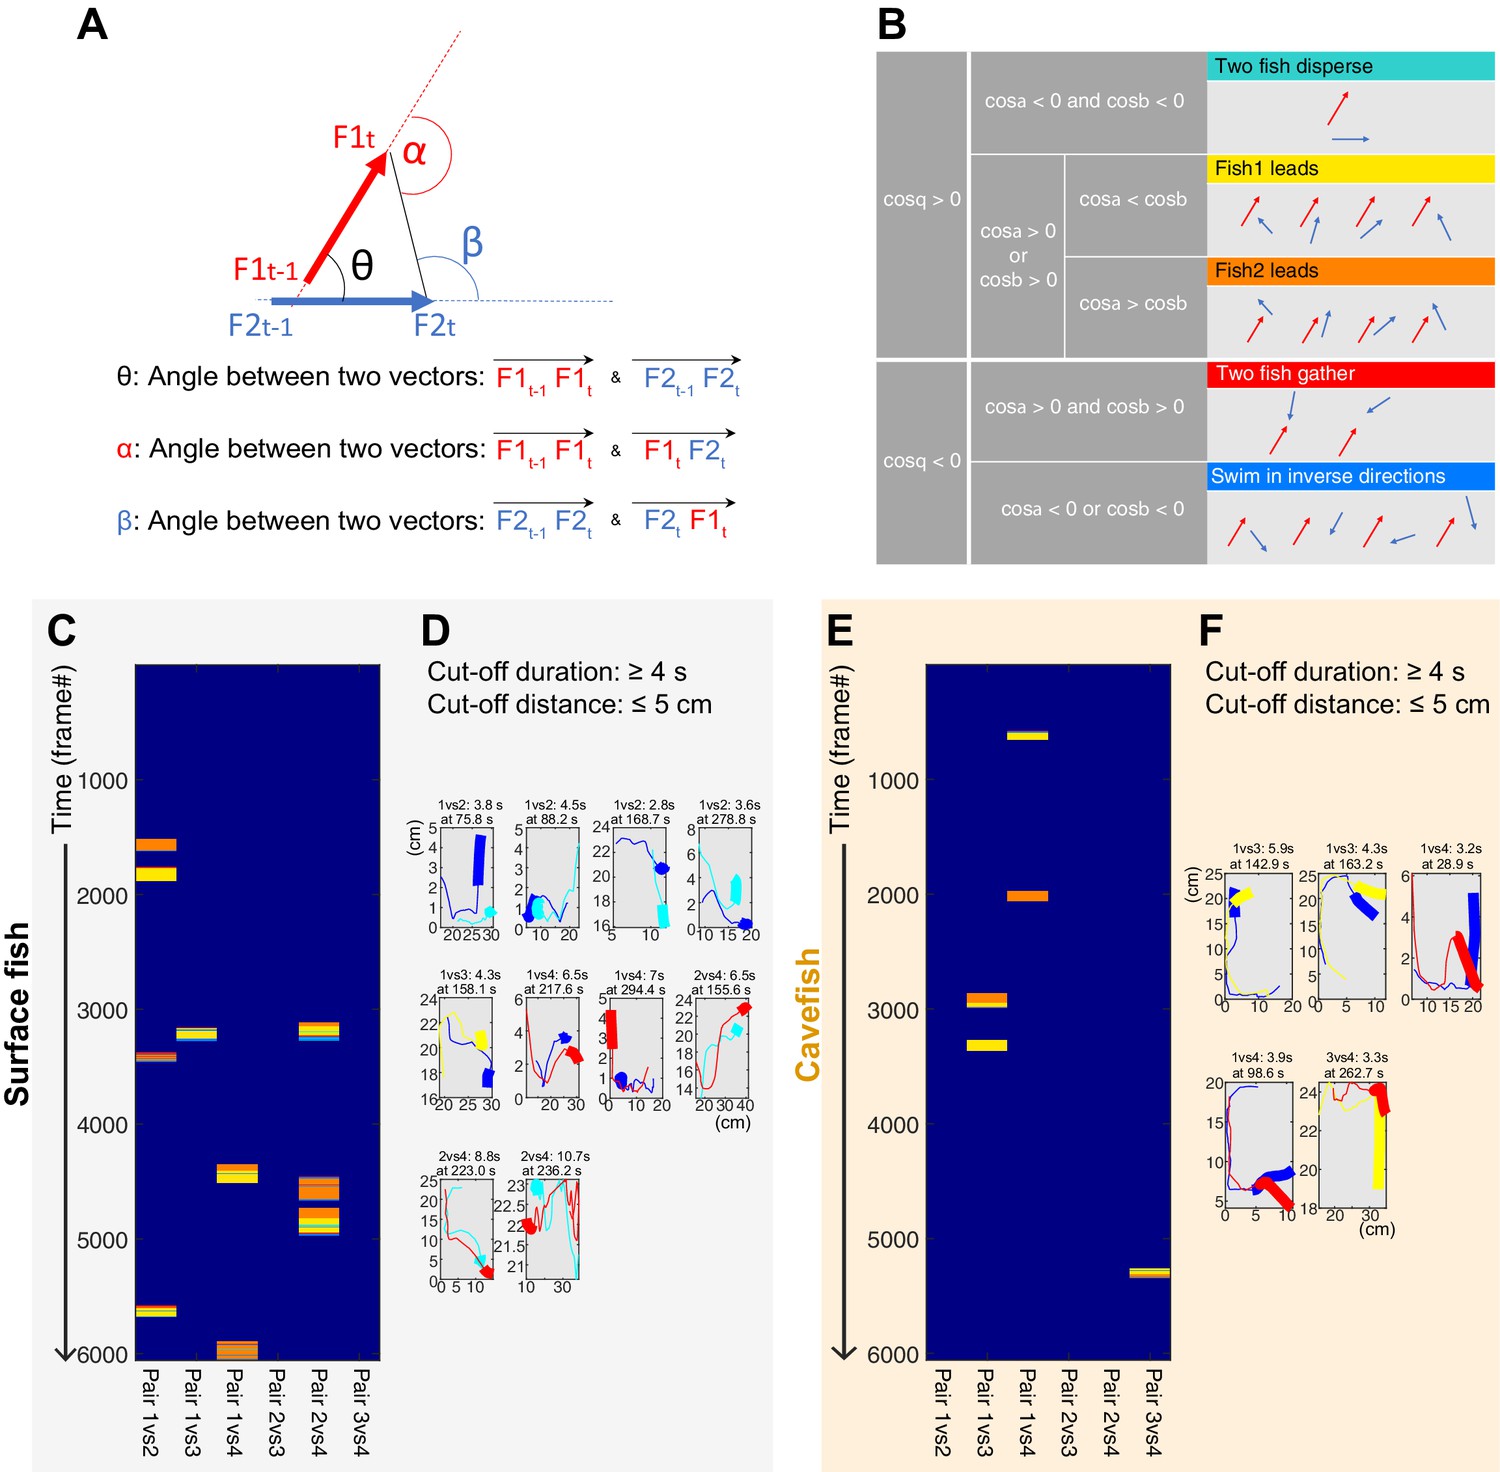
Details of nearby interactions were obtained by classifying them into five categories.
(A) Vector set and their angles for classifying interactions between a fish pair. F1t and F1t-1 are the positions of fish one at times t and t-1, respectively. Similarly, the positions of fish two are expressed as F2t and F2t-1. The angles were calculated across each frame of 6000 frames (5 min). (B) Classifying the nearby interactions into five categories based on the angles between two fish; (1) turquoise: two fish disperse each other; (2) blue: two fish swim in inverse directions; (3) red: two fish gather together; (4) yellow: fish one leads; (5) orange: fish two leads. (C) A raster plot example of nearby interactions in a surface fish group (four fish), where the interactions of fish pairs are color-coded as in (B). Each pair (each column) shows frequent switches of the leading fish. (D) Each nearby interaction from the top view. The thick lines represent the fish trajectories during the first second of the bout. The thin lines represent the fish trajectories during the remainder of the bout, as shown in Figure 2—figure supplement 1D and G. (E, F) Example plots for a cavefish group (four fish) presented as in (C) and (D), respectively. As seen with surface fish (C and D), each cavefish pair (each column) also showed switches of the leading fish (e.g., pair 1 vs 3 and pair 1 vs 4 in (E)).
Figure 2—figure supplement 3
Nearby interactions of surface fish in lighted conditions.
(A) An example frame of recorded surface fish video. Coloured lines represent trajectories of each individual fish detected by idTracker software. Trajectories for 1 s (20 frames) are shown. (B) A histogram for the bout durations filtered by the cut-off distance (5 cm or less) in a 15 s recording (surface fish group: N = 4). (C) A raster plot of the nearby-interaction bouts filtered by ≤5 cm and ≥4 s. The interaction categories for a fish pair are the same in Figure 2—figure supplement 2B. Frequent changes in the leading fish appeared within each pair and within each bout (i.e. frequent switches between orange (fish one leading) and yellow colours (fish two leading)). (D) Each nearby interaction from the top view. The thick lines represent the fish trajectories during the first second of the bout. The thin lines represent the fish trajectories during the remainder of the bout, as shown in Figure 2—figure supplement 1D and G.
-
Figure 2—figure supplement 3—source data 1
The X-Y coordinates (cm) and distances of each pair (cm) of a four-surface fish group under the light.
- https://cdn.elifesciences.org/articles/72463/elife-72463-fig2-figsupp3-data1-v2.csv
Figure 2—figure supplement 4
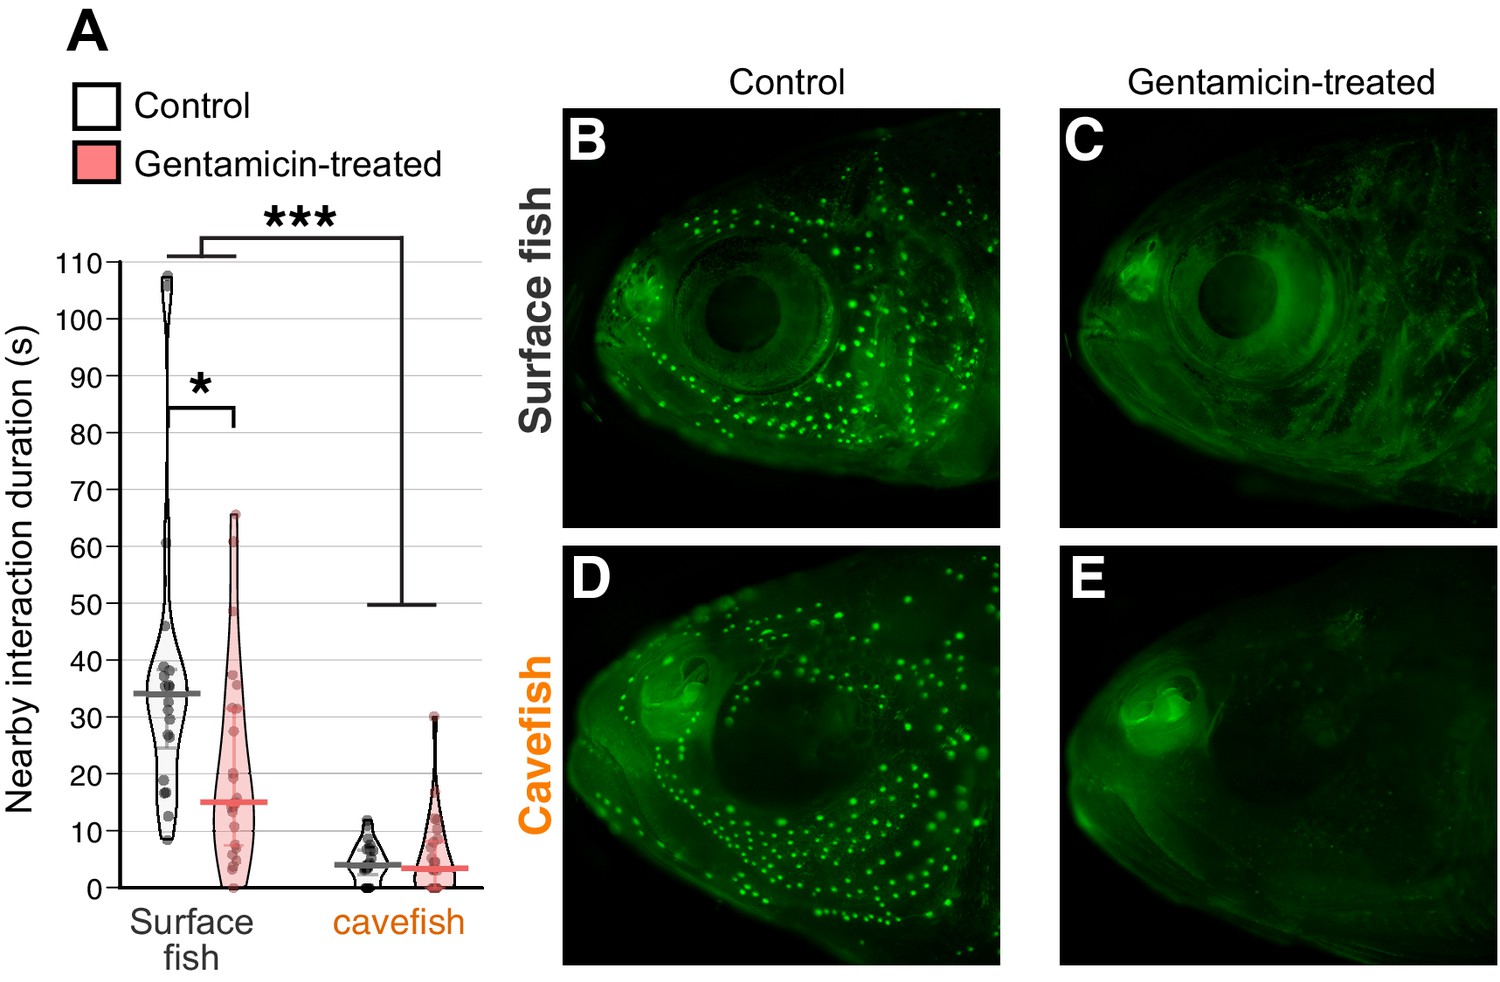
Pharmacological ablation of the lateral line by gentamicin antibiotics reduced nearby interactions.
Fish were bath-treated with 0.002% gentamicin for approximately 16 hours before the behavioral assay in an unfamiliar environment. The bath treatment was performed in home trays (15.6 × 15.6 × 5.7 cm Ziplock containers). Then, fish behaviors were recorded on the recording tray without gentamicin. The control treatment was performed with 1/1000× diluted phosphate buffered saline, which was gentamicin’s solvent. (A) The nearby-interaction durations indicated a significant difference between populations and treatments. Post hoc tests indicated a significant decrease in nearby interactions in the gentamicin-treated groups of surface fish. (B–E) The neuromasts, units of the mechanosensory lateral line system, were visualized with DASPMI vital dye (green dots; Materials and methods) after the behavioral assay. DASPMI is incorporated into the mitochondrial cell membrane of functional hair cells and emits fluorescein; therefore, it labels only active neuromasts with functional hair cells (Jørgensen, 1989). Accordingly, there were many functional neuromasts following control treatment (B, D), and gentamicin-treated fish lost most of the stained (functional) neuromasts (C, E). N = 20 for control surface fish from five groups; N = 24 for gentamicin surface fish from six groups; N = 24 for control cavefish from six groups; and N = 24 for gentamicin cavefish from six groups. *: p < 0.05, ***: p < 0.001. All statistical scores are available in Supplementary file 1.
-
Figure 2—figure supplement 4—source data 1
Nearby interaction duration (s) under the gentamicin treatment.
- https://cdn.elifesciences.org/articles/72463/elife-72463-fig2-figsupp4-data1-v2.csv
Figure 3
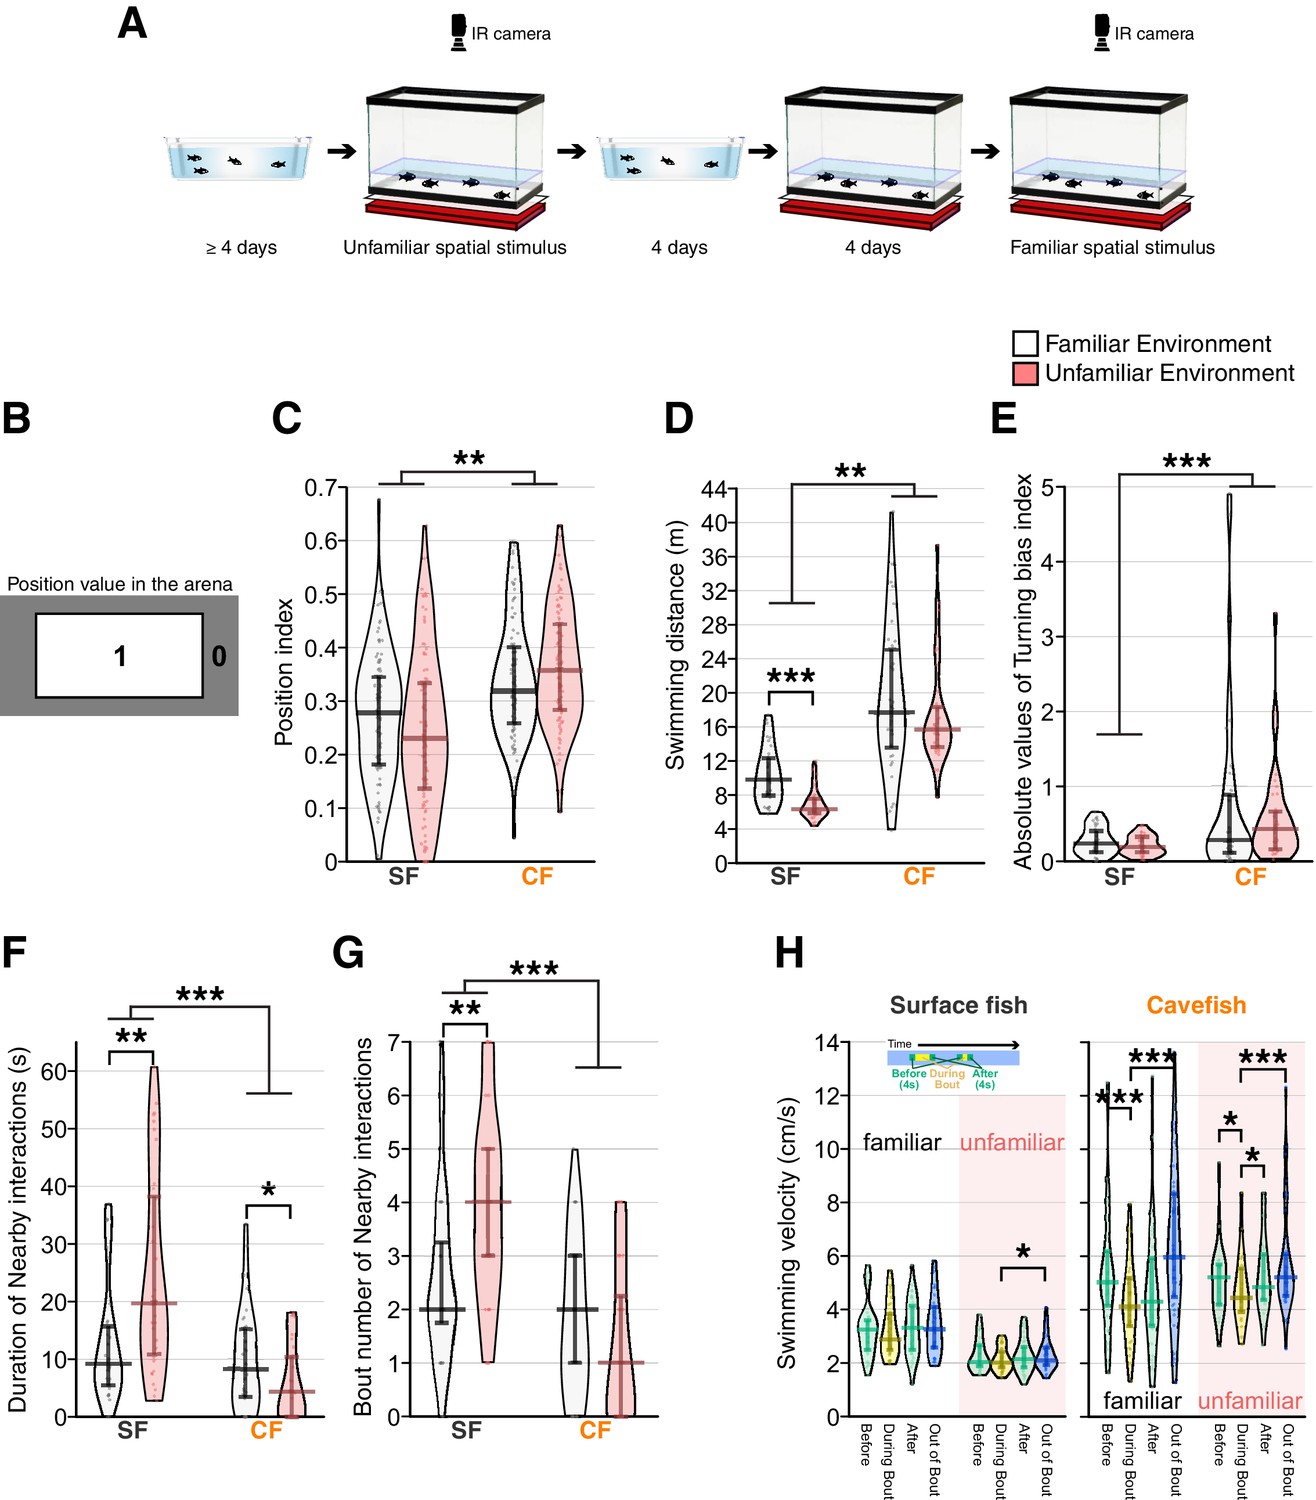
Reduced social-like nearby interactions in cavefish in unfamiliar environments compared with familiar environments.
(A) Schematics of experimental procedure. Fish were acclimated in the home tray for more than 4 days and were transferred to the recording tank in this unfamiliar environment. After the recording, fish were returned to the home tray where they remained for more than 4 days. Then, the fish were returned to the recording tank and acclimated to the recording tank for 4 days. After acclimation, an infrared (IR) LED array was set to illuminate fish, and fish movements were recorded in this familiar environment. (B) The position index to characterize location preference (top view of the recording arena). Region one represents the centre, and region 0 represents the peripheral area of the recording. The areas of both region 1 and 0 are exactly the same. (C) Plots for the positional preference of the fish for region 1. The longer bars at the middle of the beans represent medians, and shorter bars represent 25th (bottom bar) and 75th (top) percentiles. Positional preference showed no significant change between the familiar and unfamiliar environments, but surface fish preferred the peripheral area more than cavefish. (D) Swimming distance plots indicated that cavefish swam significantly longer distances than surface fish. Surface fish had lower swimming distances in the unfamiliar environment. (E) The turning bias index indicated that cavefish turned more unidirectionally than surface fish, and the environmental shift did not affect the turning bias. (F, G) The duration (F) and the number of nearby-interaction bouts: both scores supported a significantly higher level of nearby interactions in surface fish. Notably, the nearby-interactions durations (G) showed similar scores in the familiar environment between surface fish and cavefish, yet the unfamiliar stimulus increased (surface fish) or decreased (cavefish) the duration, resulting in a significant Env× Pop interaction in the generalized linear model (Supplementary file 1). (H) Swimming velocity during or out-of-nearby interactions. The mean swimming speeds (1) during 4 s before the nearby-interaction bout, (2) during the bout, (3) during 4 s after the bout, and (4) during the out-of-bout period are plotted for surface fish (left) and cavefish (right) in the familiar and nonfamiliar environments. The average speed was reduced during the bout in cavefish under both familiar and unfamiliar environments. In contrast, the surface fish changed their speed profile only in the unfamiliar environment. SF: surface fish (N = 36 from nine groups); CF: cavefish (N = 36 from nine groups). **: p < 0.01, ***: p < 0.001. All detailed statistical scores are available in Supplementary file 1.
-
Figure 3—source data 1
Position-indices in the recording arena under the familiar or unfamiliar environment.
- https://cdn.elifesciences.org/articles/72463/elife-72463-fig3-data1-v2.csv
-
Figure 3—source data 2
The swimming distances, absolute values of the turning indices, nearby interaction durations, nearby interaction event numbers, and swimming speeds under the familiar or unfamiliar environment.
- https://cdn.elifesciences.org/articles/72463/elife-72463-fig3-data2-v2.csv
Figure 4 with 1 supplement
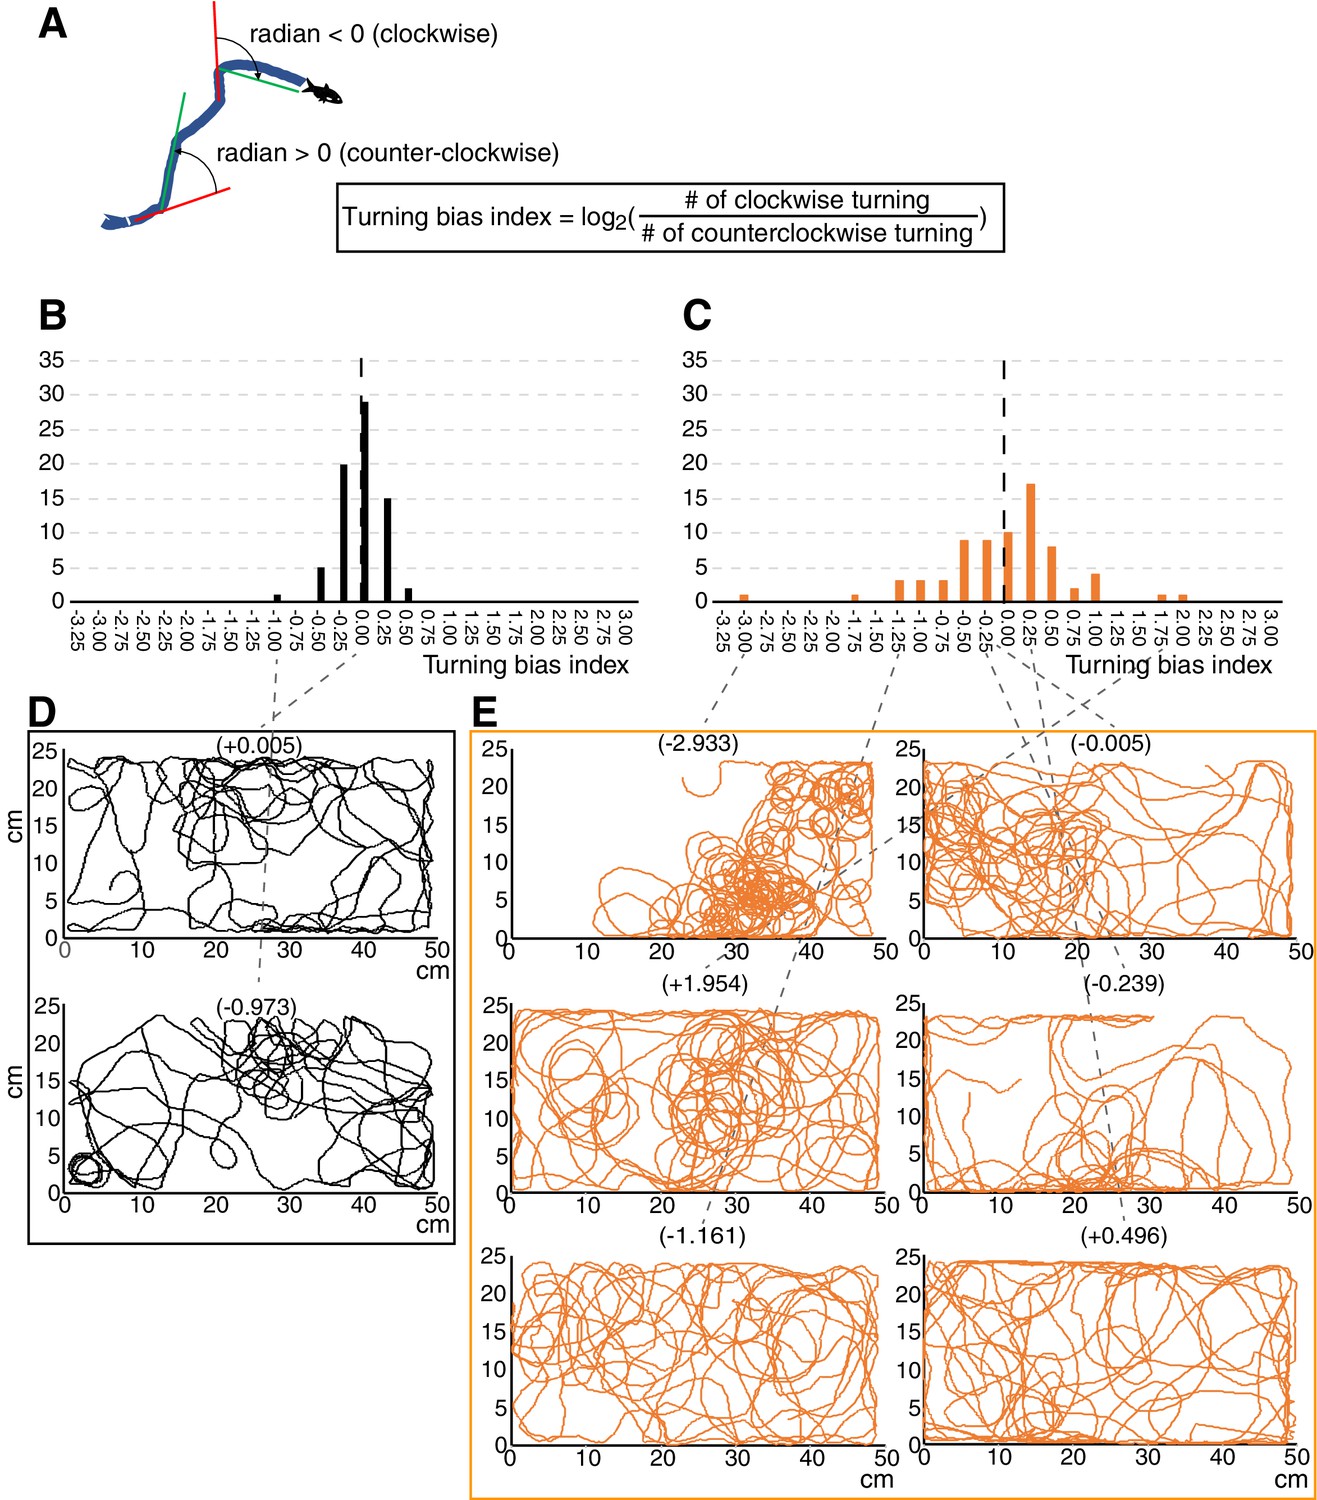
Turning bias index showed strong biased turning in cavefish.
(A) Diagram showing the calculation formula for the turning bias index. The changes in travelling directions were calculated every five frames (every 0.25 s) across all trajectories and were expressed as radians. Positive radian values represent left (anticlockwise) turning, and vice versa. Then, the log2 of the ratio between the numbers of clockwise and anticlockwise turns was used as the turning bias index. (B, C) Histograms of the turning bias index for 72 surface fish (B) and 72 cavefish (C) in the unfamiliar environment (see the main text). (D, E) Swimming trajectories representing a range of turning bias indices in surface fish (D) and cavefish (E). The replication test regarding turning bias in cavefish is shown in Figure 4—figure supplement 1. The source data for the histogram are available in Figure 4—source data 1.
-
Figure 4—source data 1
The turning indices of surface fish and cavefish.
- https://cdn.elifesciences.org/articles/72463/elife-72463-fig4-data1-v2.csv
Figure 4—figure supplement 1
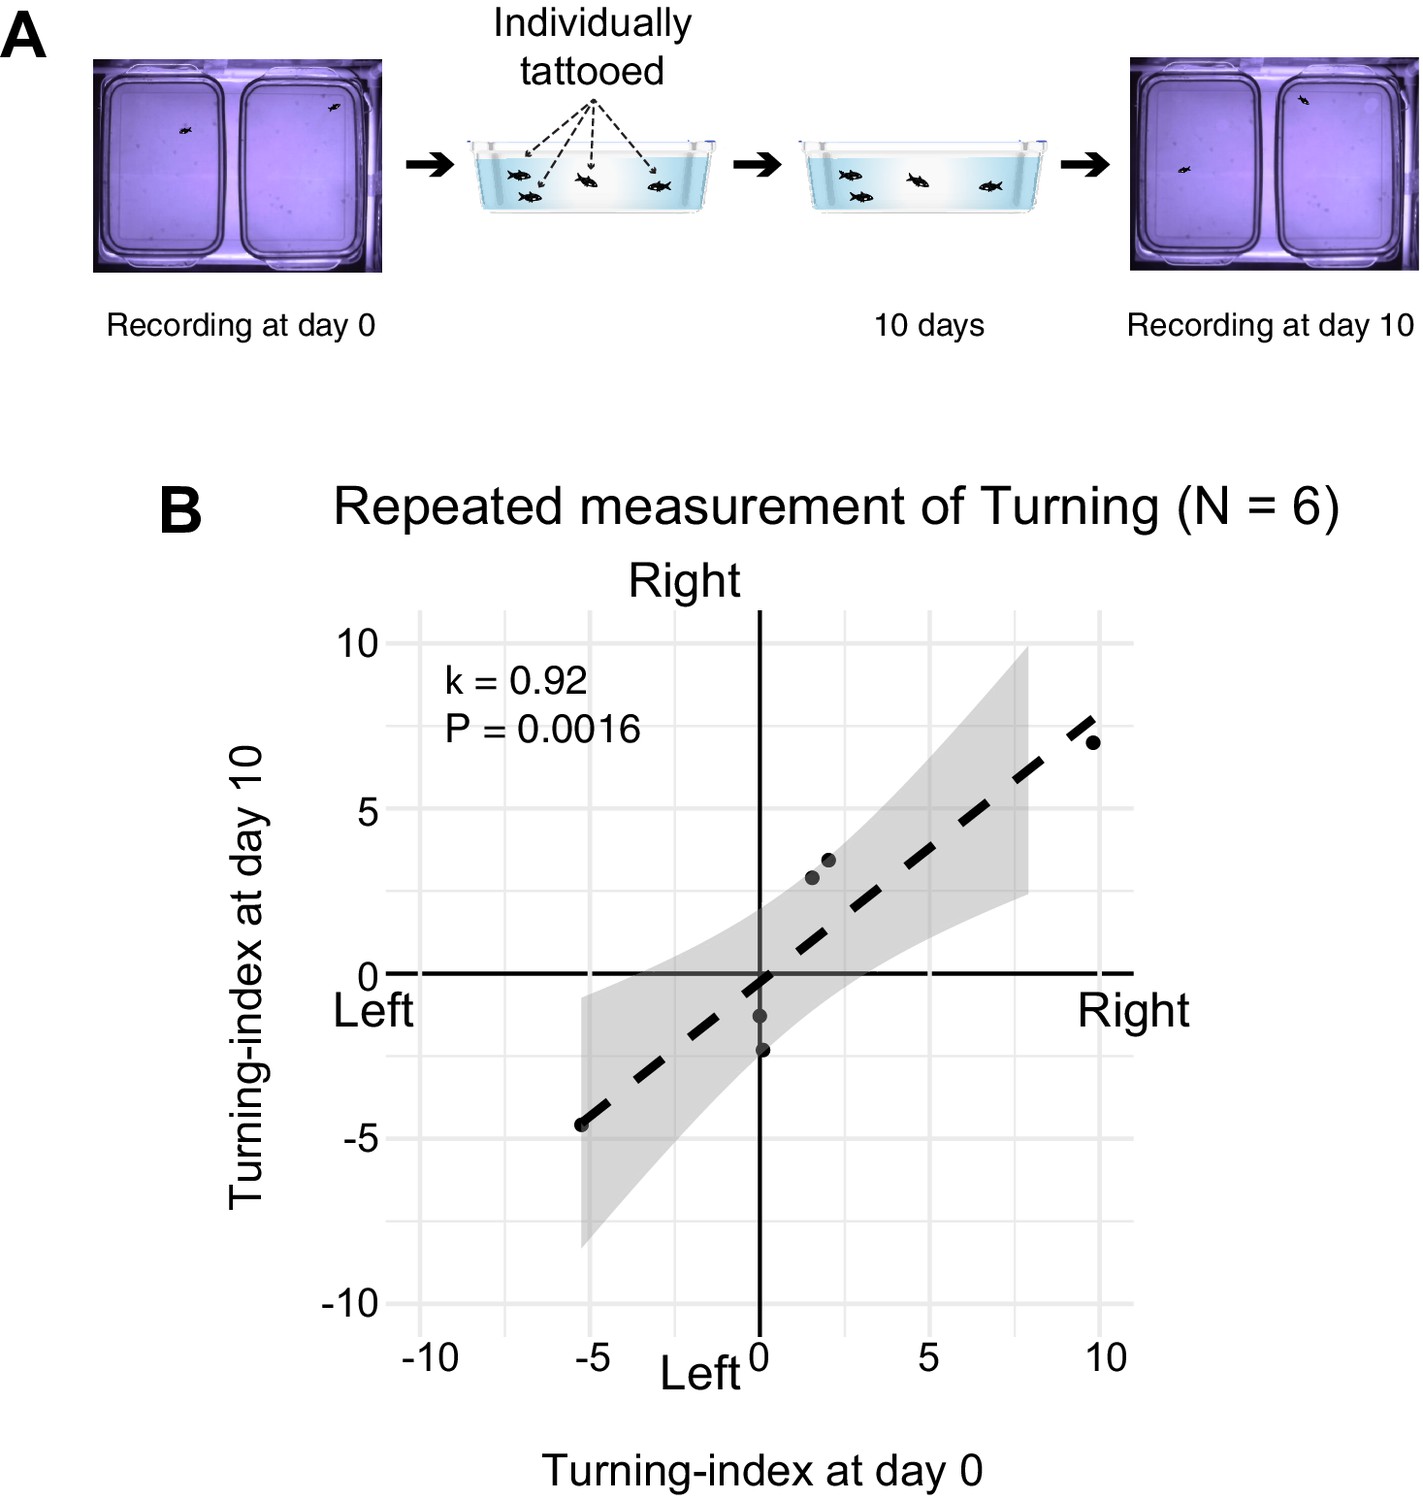
Replication test assessing turning bias in cavefish.
(A) Each cavefish was first subjected to the turning assay in the individual recording arena to track their ID. After the initial recording, each cavefish was tattooed with visible implant elastomer according to the manufacturer’s instructions under anesthesia and then recovered in the home tray. Note that the elastomer tag was not visible in the video, and the cavefish appeared similar to each other. Then, 10 days after the initial recording, fish movements were recorded again. (B) Scatterplot of turning bias on the two different days. The individual fish that showed a strong left-turning bias consistently showed the same tendency 10 days later, and vice versa. Interclass correlation: kappa = 0.92, p = 0.0016, N = 6: the test-retest based on the two-way random effect models and ‘single rater’ unit.
-
Figure 4—figure supplement 1—source data 1
Repeated measurement of turning indices.
- https://cdn.elifesciences.org/articles/72463/elife-72463-fig4-figsupp1-data1-v2.csv
Figure 5

The relationship between repetitive turning behavior and nearby social-like behavior in cavefish.
(A, B) In the familiar environment, the logarithmic transformed turning bias index and aspects of nearby interactions were significantly negatively correlated, F1,34 = 9.6, adjusted R2 = 0.198, p = 0.0038 for the turning bias index against the nearby-interaction durations (A); F1,34 = 10.0, adjusted R2 = 0.204, p = 0.0033 for the turning bias index against the number of nearby-interaction bouts (B). (C, D) In contrast, in the unfamiliar environment, aspects of the nearby interactions were reduced, and lower correlations were detected, F1,34 = 3.6, adjusted R2 = 0.069, p = 0.0659 for the turning bias index against the nearby-interaction durations (C); F1,34 = 4.6, adjusted R2 = 0.094, p = 0.0384 for the turning bias index against the number of nearby-interaction bouts (D). *: p < 0.05, **: p < 0.01. Red dashed lines: regression lines with the logarithmic transformation on the x-axis. Gray shades represent 95% confidence intervals of the regression lines (N = 36 from nine groups).
-
Figure 5—source data 1
The turning bias indices and nearby interaction under the familiar or unfamiliar environment.
- https://cdn.elifesciences.org/articles/72463/elife-72463-fig5-data1-v2.csv
Figure 6 with 2 supplements
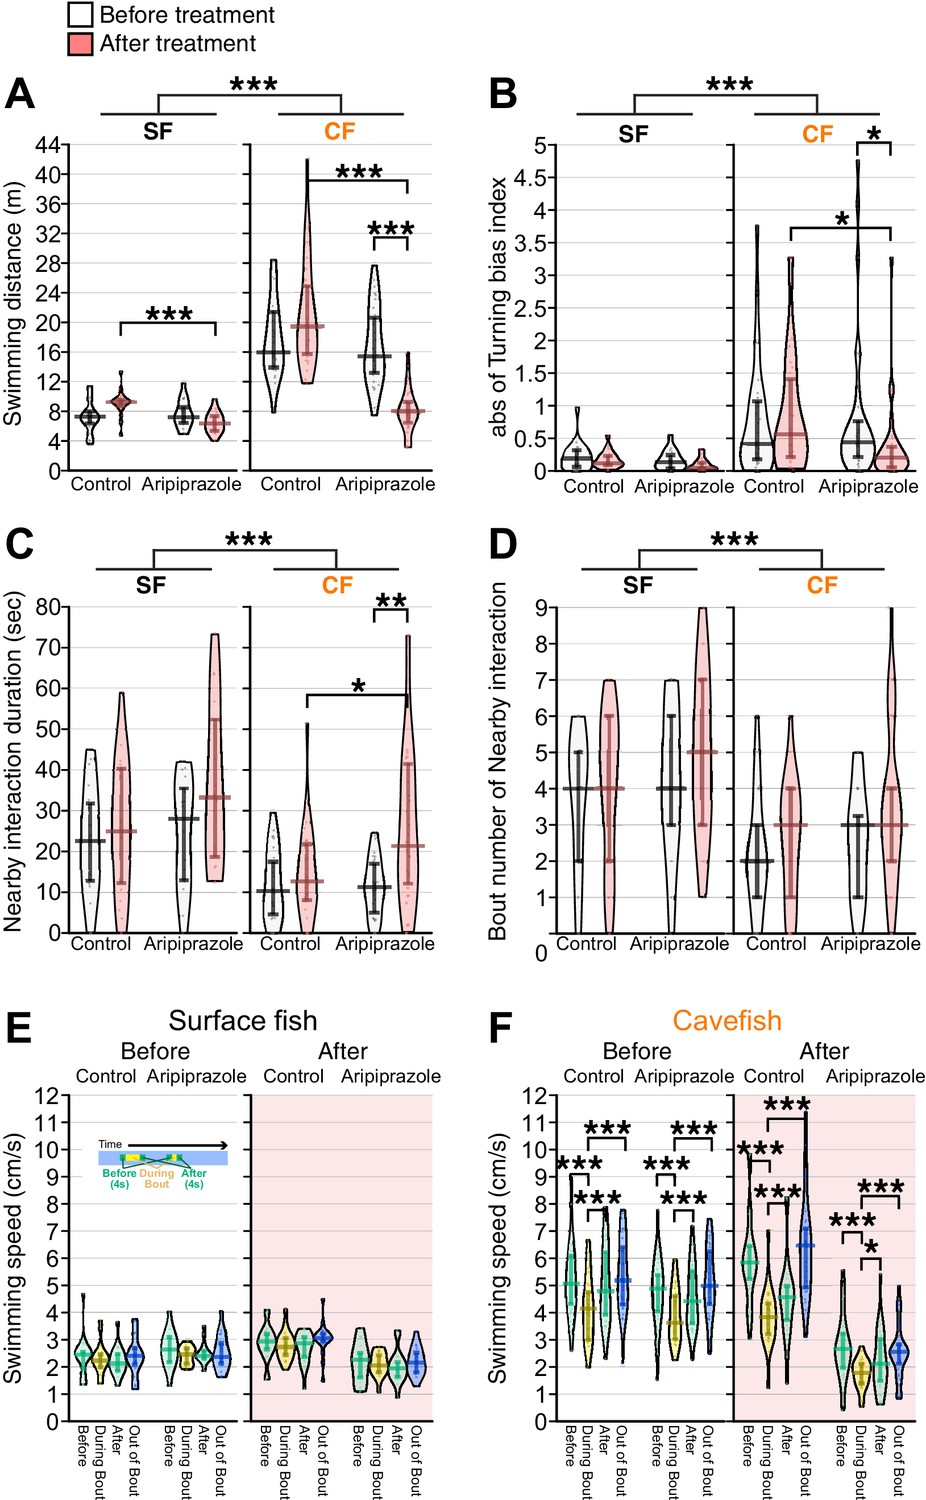
The partial agonist of the D2 receptor aripiprazole enhanced nearby interactions and reduced turning bias in cavefish.
The pre-treatment behaviors were recorded for more than four days before the aripiprazole treatment. Aripiprazole and the control DMSO were administered for ~16 hr before the post-treatment recording in an unfamiliar environment. (A) Total swimming distances before (black and white) and after (red shaded) the treatment, between the aripiprazole and control treatments, and between surface fish and cavefish. The cavefish had significantly reduced swimming distances after aripiprazole treatment. (B) The turning bias index indicated that cavefish significantly reduced biased turning after aripiprazole treatment. (C) The nearby-interaction durations showed a significant difference in Pop (surface fish and cavefish) and a significant interaction with PrePost (pre- and post-treatment)× Pop via a general linearized model (Supplementary file 1). Post hoc tests indicated a significant increase in nearby interactions in the aripiprazole-treated cavefish. (D) Significant difference in Pop (surface fish and cavefish). (E, F) Swimming speed during bouts or out-of-bout periods in surface fish (E) and cavefish (F). Aripiprazole treatment did not change the speed profiles in either the surface fish or cavefish. N = 20 from five groups for surface fish control; N = 16 from four groups for aripiprazole-treated surface fish; N = 28 from seven groups for cavefish control; N = 32 from eight groups for aripiprazole-treated cavefish. *: p < 0.05, **: p < 0.01, ***: p < 0.001. All statistical scores are available in Supplementary file 1. Regression plots between the nearby-interaction durations and swimming speeds are available in Figure 6—figure supplement 1.
-
Figure 6—source data 1
The swimming distances, absolute values of the turning indices, nearby interaction durations, nearby interaction event numbers, and swimming speeds under the aripiprazole treatment.
- https://cdn.elifesciences.org/articles/72463/elife-72463-fig6-data1-v2.csv
Figure 6—figure supplement 1

Nearby-interaction durations were significantly longer in the actual fish than in the simulated random data in the aripiprazole treatment.
The plot of the actual data is shown in black and white, and the simulated data are shown in light blue (N = 16 for both actual and simulated surface fish; N = 20 for both actual and simulated cavefish). The simulated random data were generated by using the X-Y coordinates of the aripiprazole-treated fish (also see Materials and methods). The thicknesses of the beans represent data density. **: p < 0.01, ***: p < 0.001. All statistical scores are available in Supplementary file 1.
-
Figure 6—figure supplement 1—source data 1
The swimming speed and nearby interaction duration in cavefish and surface fish.
- https://cdn.elifesciences.org/articles/72463/elife-72463-fig6-figsupp1-data1-v2.csv
Figure 6—figure supplement 2

Swimming speed is not a significant predictor of nearby-interaction durations.
Swimming speeds and nearby-interaction durations before (A) and after (B) treatment with aripiprazole (N = 32 from eight groups: F1,18 = 2.1, p = 0.1622; and F1,18 = 0.1, p = 0.8081, respectively) were not significantly correlated in cavefish. Similarly, those of surface fish were not correlated (C, D) (N = 16 from four groups: F1,14 = 0.4, p = 0.5199; and F1,14 = 4.3, p = 0.0565, respectively). Red dashed lines: regression lines with the logarithmic transformation on the x-axis. Gray shades represent 95% confidence intervals of the regression lines.
-
Figure 6—figure supplement 2—source data 1
Nearby-interaction durations were significantly longer in the actual fish than in the simulated random data in the aripiprazole treatment.
- https://cdn.elifesciences.org/articles/72463/elife-72463-fig6-figsupp2-data1-v2.csv
Scheme 1
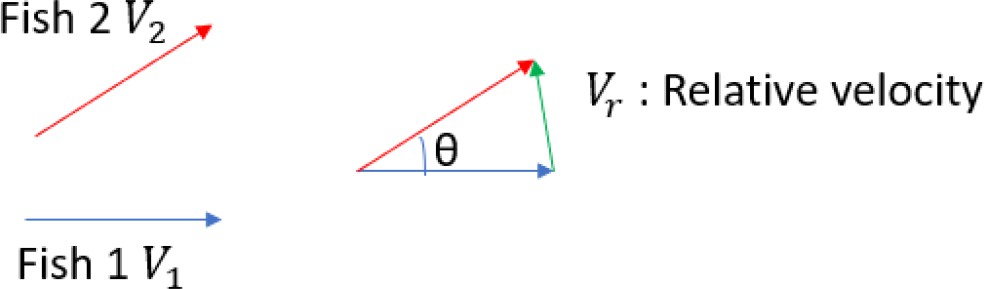
Fish 1 and Fish 2 are swimming in velocities of and , respectively.
Then, to simplify the calculation, suppose that the two fish swim with the average velocity, , the average of the relative velocity between two fish is given by and (see above).
Scheme 2
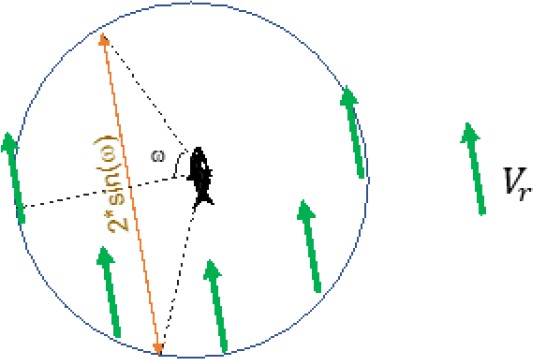
By using relative velocity, we can think as that one fish of a pair is still.
Then, while another fish passing by a 5 cm radius of the first fish (circle), this fish travels 5 × 2 × sin(ω) cm (orange arrow).
Videos
Video 1
Swimming patterns of four surface fish in dark conditions (unfamiliar environment).
Video 2
Swimming patterns of four cavefish in dark conditions (unfamiliar environment).
Video 3
Swimming patterns of four surface fish in dark conditions.
The arena was illuminated with infrared light. Fish did not respond to the visual stimulus—a moving object (unfamiliar environment).
Video 4
Swimming patterns of four surface fish in lighted conditions (unfamiliar environment).
Tables
Key resources table
| Reagent type (species) or resource | Designation | Source or reference | Identifiers | Additional information |
|---|---|---|---|---|
| Strain, strain background (Astyanax mexicanus) | Surface (epigean) population | Yoshizawa lab descendant of William R Jeffery lab at Univ Maryland College Park US | SFe; SFg | DOI:10.1126/science.289.5479.631 |
| Strain, strain background (Astyanax mexicanus) | Cave (hypogean) population | Yoshizawa lab descendant of Richard Borowsky lab at New York Univ. US | PAby | DOI:10.1101/pdb.prot5093 |
| Chemical compound, drug | Aripiprazole | Sellek Chemicals | S1975 | |
| Chemical compound, drug | Gentamicin | MilliporeSigma | G1914 | |
| Software, algorithm | MATLAB | MathWorks | R2020a | |
| Software, algorithm | Python | Python | Python 3.7.4 | |
| Software, algorithm | idTracker | Pérez-Escudero et al., 2014 | idTracker-beta | https://github.com/idTracker/idTracker/tree/Beta |
| Chemical compound, drug | 4-Di-2-Asp | MilliporeSigma | D3418 |
Additional files
-
Supplementary file 1
Detailed statistical scores for Figures 2, 3 and 6 and their figure supplements.
- https://cdn.elifesciences.org/articles/72463/elife-72463-supp1-v2.xlsx
-
Transparent reporting form
- https://cdn.elifesciences.org/articles/72463/elife-72463-transrepform1-v2.docx
-
Source data 1
- https://cdn.elifesciences.org/articles/72463/elife-72463-supp2-v2.zip
Download links
A two-part list of links to download the article, or parts of the article, in various formats.
Downloads (link to download the article as PDF)
Open citations (links to open the citations from this article in various online reference manager services)
Cite this article (links to download the citations from this article in formats compatible with various reference manager tools)
Social-like responses are inducible in asocial Mexican cavefish despite the exhibition of strong repetitive behavior
eLife 10:e72463.
https://doi.org/10.7554/eLife.72463


