Tradeoff breaking as a model of evolutionary transitions in individuality and limits of the fitness-decoupling metaphor
- Philosophy Department, Macquarie University, Australia
- Department of Philosophy & Charles Perkins Centre, The University of Sydney, Australia
- Department of Evolutionary Theory, Max Planck Institute for Evolutionary Biology, Germany
- Centre d'Écologie Fonctionnelle et Évolutive (CEFE), CNRS, France
- Laboratoire Biophysique et Évolution, CBI, ESPCI Paris, Université PSL, CNRS 75005 Paris, France, France
- Department of Microbial Population Biology, Max Planck Institute for Evolutionary Biology, Germany
- Institute of Microbiology, Kiel University, Germany
Figures
Box 1—figure 1

Valid fitness comparisons require measures over the same set of events (same environment and timescale).
Invalid comparisons: (a, c, e). Valid comparisons: (b, d, f).
Figure 1
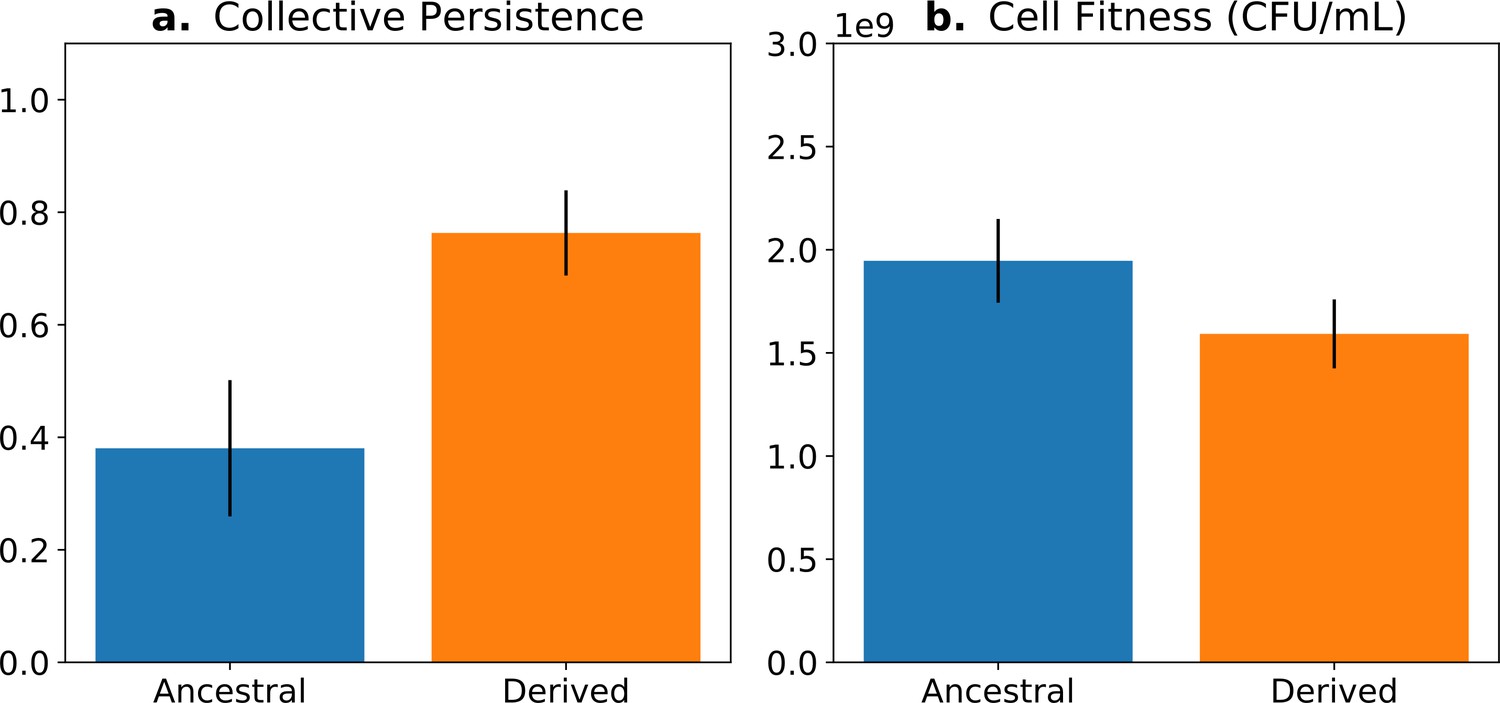
Fitness-decoupling observation in the Pseudomonas system.
Comparison of collective-level persistence (measured as the proportion of collective persistence after one generation when competed against an ancestral reference strain) and cell (particle) fitness (measured as the number of cells comprising a collective) for ancestral (blue) and derived (orange) populations under a regime designed to promote an evolutionary transition in individuality. Error bars represent standard errors of the mean (based on n = 15 ancestral and n = 14 derived lineages, respectively). Redrawn from Hammerschmidt et al., 2014 (Fig. 2), for ease of comparison with Figure 5. Protocol described and statistical analysis performed in Hammerschmidt et al., 2014, showing statistical significance between ancestral and derived collective persistence/cell fitness. Dataset published as Rose et al., 2018.
Figure 2
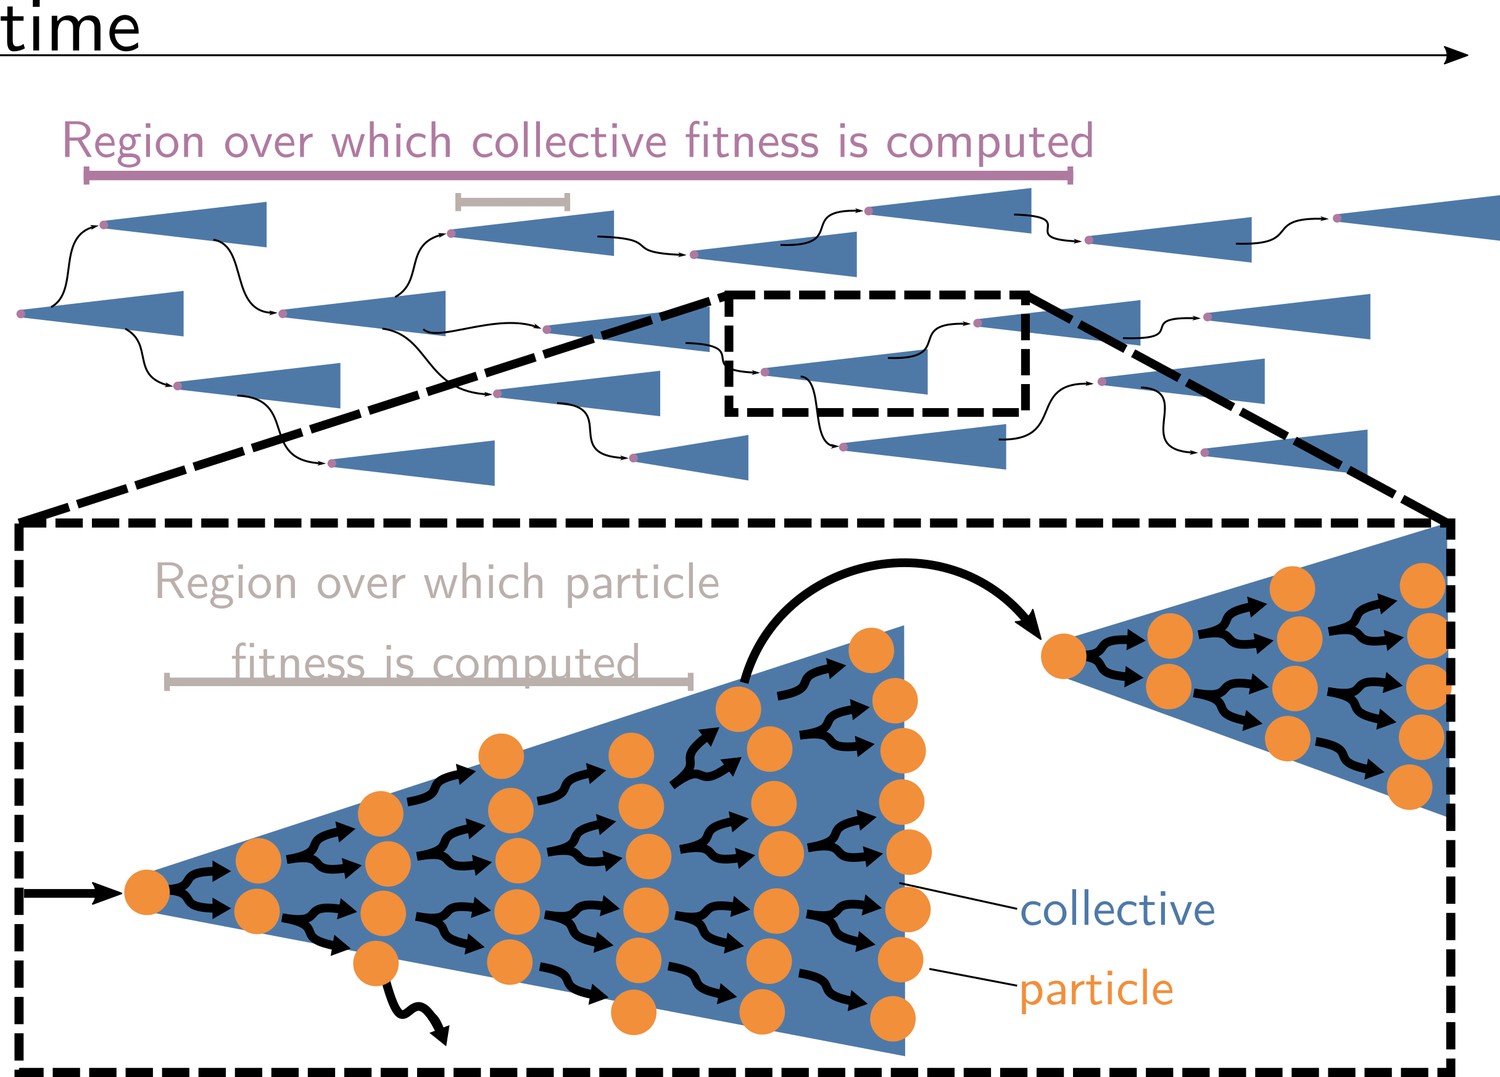
Collective and particle fitnesses are not measured over the same environment.
During an evolutionary transition in individuality, there are two levels of organisation: collectives (blue triangles) are composed of particles (orange disks). Both levels have their own genealogy (black arrows). Collective fitness is computed by considering one or several full collective generations (purple timeline), while particle fitness is computed within each collective development (grey timeline). As a result, they may exhibit opposing dynamics (increasing for collective and decreasing for particle fitness), giving rise to the fitness-decoupling observation.
Figure 3
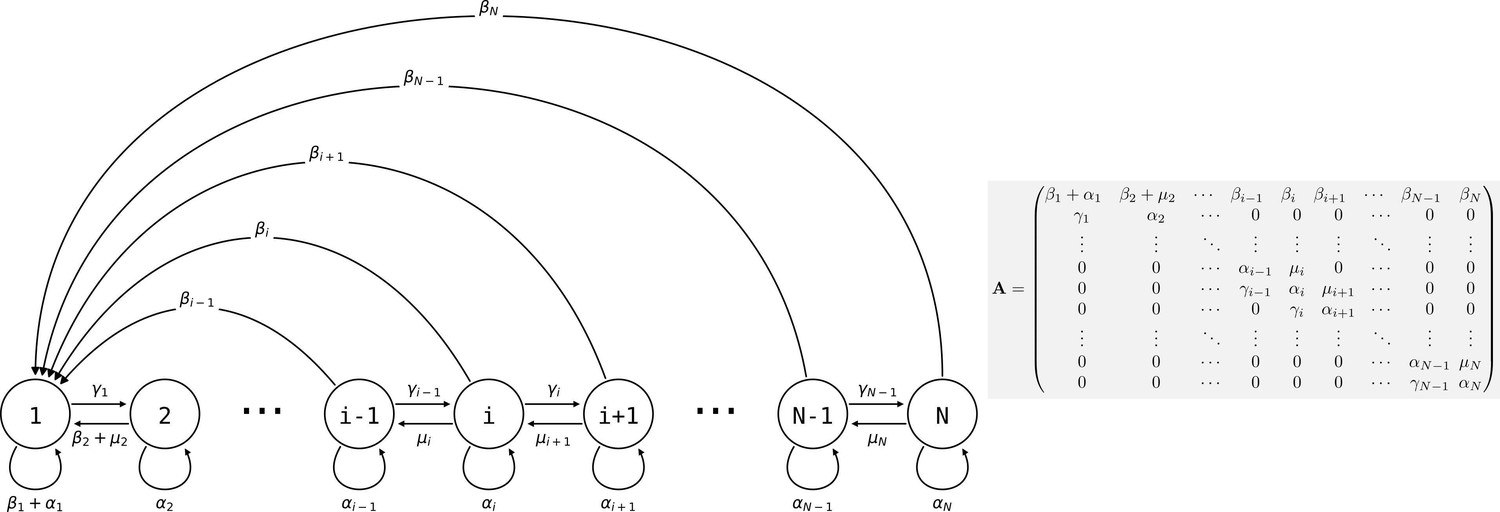
Life cycle of collectives as a size–class population projection model.
Circles represent a size class of collectives; arrows represent the flow of individuals between size classes. At each time step, collectives of size class i can grow (if i < N), shrink, or stay the same size. They also leave propagules of size class 1. See main text for details.
Figure 4
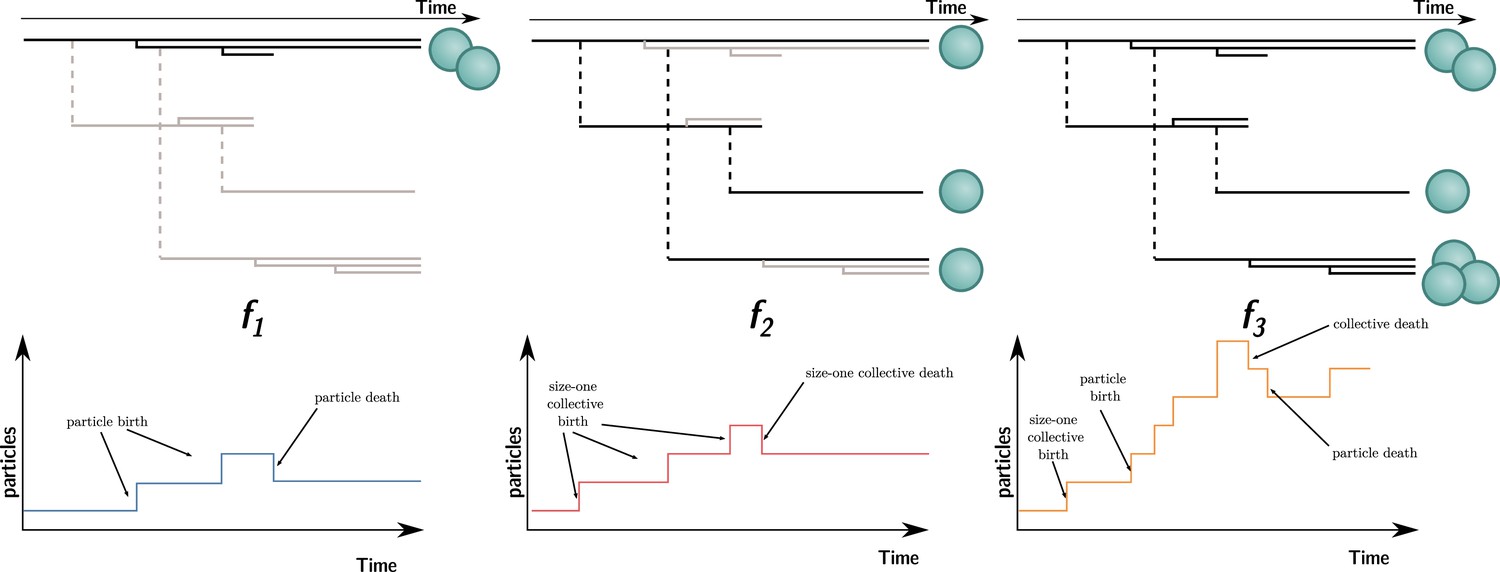
Three ways to compute particle fitness ( , , and ) in a lineage starting from a single particle.
Top: each solid horizontal line represents the life span of a particle. The vertical axis has no unit and only represents population structure. Particles within the same collectives are represented as a series of horizontal lines close to one another (isolated particles count as monoparticle collectives). Each dashed vertical line connects a parental collective to its offspring (which starts as a single cell). Greyed-out elements for and indicate the processes that are omitted during the fitness calculation. Bottom: the time series below each example shows how particles are tallied. In the case of , between-collective events are ignored. Thus, the two particles are the only ones relevant for its computation, whereas, in the case of , within-collective birth–deaths and their effects are ignored. Thus, the three particles (i.e., monoparticle collectives) are relevant for its computation. Finally, in the case of , the full lineage is used. Thus, all six particles must be taken into account for its computation.
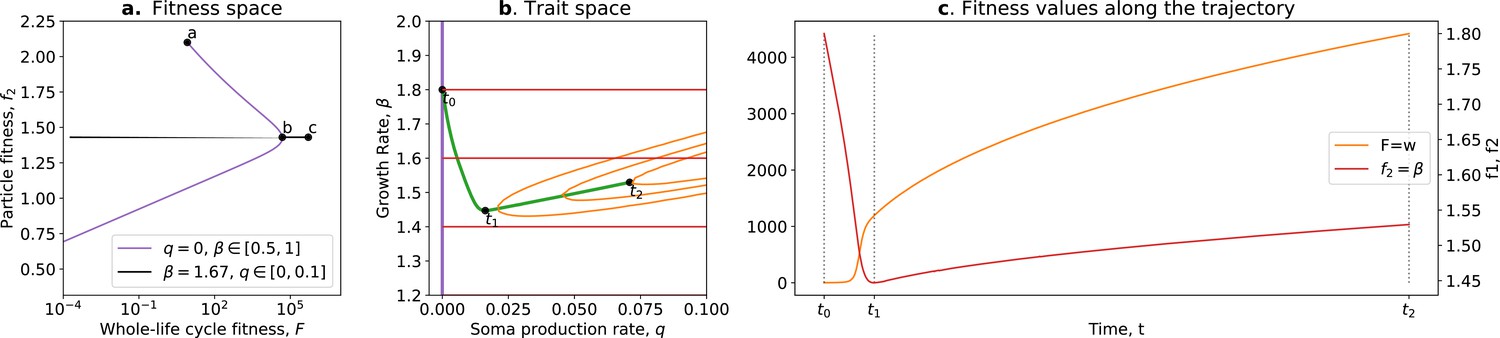
Figure 5

The tradeoff model can reproduce the fitness-decoupling observation.
(a) Values of andf2 as a function of the trait . (b) Ancestral and derived values of whole life cycle fitness (). (c) Ancestral and derived values of counterfactual fitness (). The expected evolutionary trajectory from ancestral (θ0) to derived (θ*) trait value (green arrow in (a)) results in an increase of and a decrease of , reproducing the fitness-decoupling observation of Figure 1. Parameters: , , and .
Figure 6
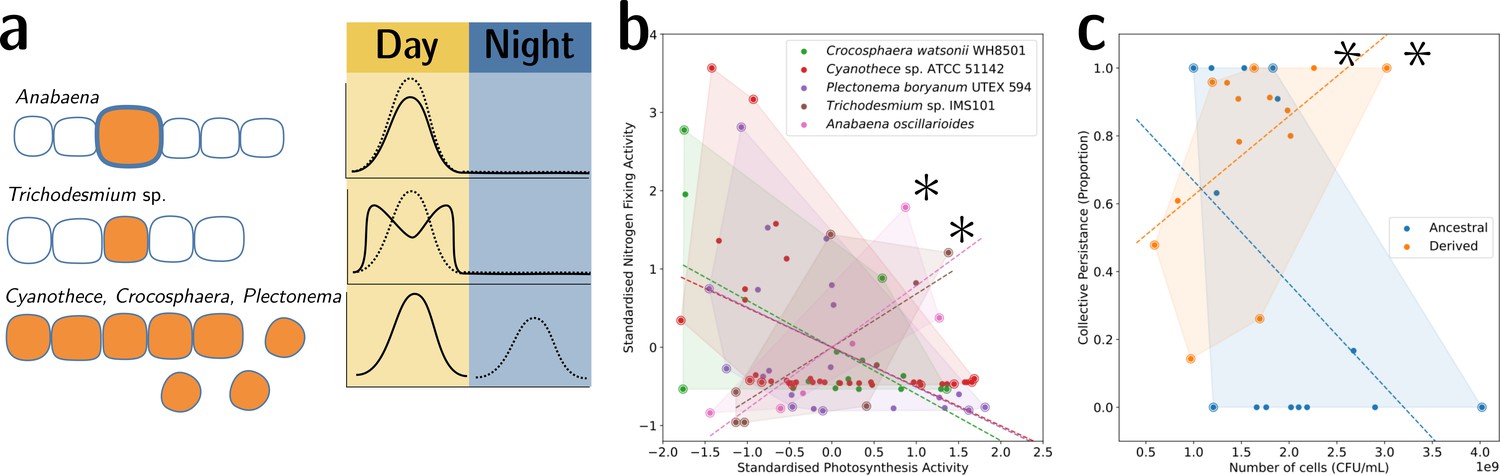
Tradeoff-breaking lineages can be inferred experimentally.
(a) Morphological and physiological N2-fixing adaptations for different cyanobacteria. Orange shaded areas indicate nitrogenase localisation. Daily rhythm of photosynthesis (solid line) and N2-fixation (dashed line) (modified from Figure 2 of Berman-Frank et al., 2003). (b) Tradeoff between photosynthesis activity and nitrogenase activity in cyanobacteria (data taken from Colón-López et al., 1997; Mohr et al., 2013; Misra and Tuli, 2000; Berman-Frank et al., 2001; Popa et al., 2007 and standardised). The shaded area for a given species corresponds to the convex hull of observations. Assuming a representative sampling, it stands for the expected range of traits accessible for this species. Dashed lines are least-square linear regressions of the observations of each species; asterisks indicate potential tradeoff-breaking observations because they depart notably from the tradeoff pattern displayed by most species. (c) Tradeoff between collective persistence and cell number in Pseudomonas fluorescens for ancestral and derived lineages (Hammerschmidt et al., 2014; asterisks indicate tradeoff-breaking observations in two lineages). Dataset published as Rose et al., 2018.
Figure 7
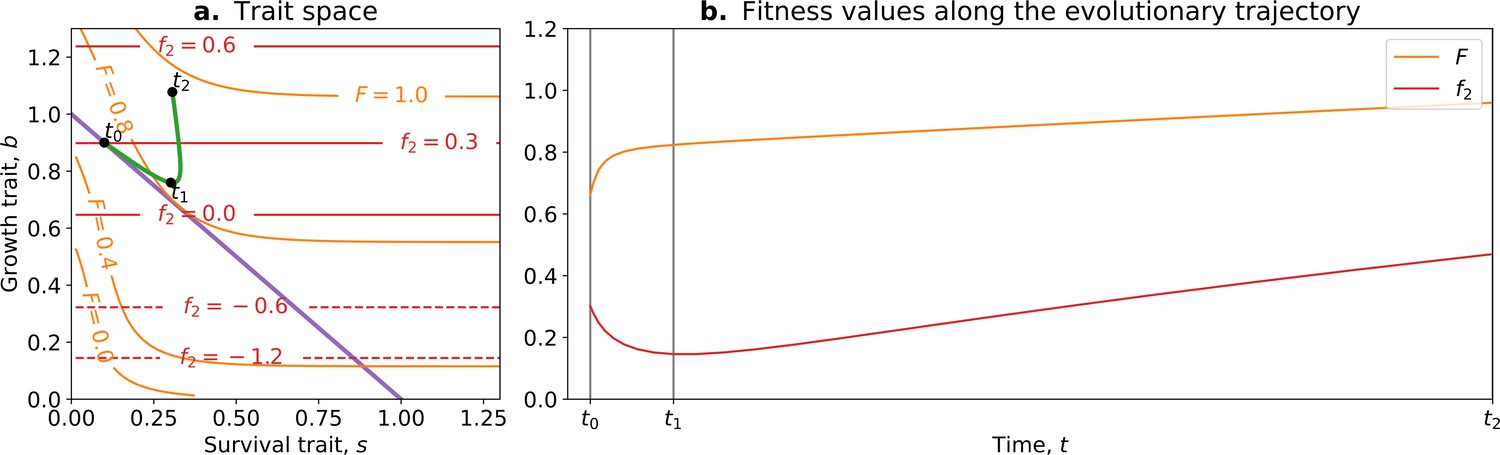
Tradeoff-breaking mutations do not fit the fitness-decoupling observation.
(a) Trait space with isolines of fitness. An example of a possible evolutionary trajectory is shown in green. (b) Particle (counterfactual; in red) and collective fitness ( in orange) values along the example evolutionary trajectory (in green). The strict tradeoff from Section 3 and Figure 5 is shown in purple. The times marked by vertical lines in (b) correspond to the dots in (a). The evolutionary trajectory can be separated into two phases once collectives have been formed: a fast-paced phase (before ) that closely follows the purple tradeoff in (a) and a slower phase (after ) that breaks away from it and leads to the tradeoff-breaking observation. Note that a fitness-decoupling observation can only be made in the fast-paced phase of the trajectory (before ), as represented in (b). Parameters: , , , .
Box 2—figure 1
Tradeoff breaking in the ecological scaffolding scenario.
(a) Values of and accessible to the organism when and only can mutate (purple) and values of and accessible to the organism when only can mutate and is such that is maximum for (black); (b) trait space with isolines of fitness ( in red, in orange), with an example of evolutionary trajectory in green (ancestral tradeoff represented in purple). (c) and values along the example evolutionary trajectory. The times marked by vertical lines in (c) correspond to the dots in (b). Note that and have opposed dynamics from to (fitness-decoupling observation) and both increase from to . Rare mutations on q allow breaking away from the ancestral tradeoff line (tradeoff-breaking observation). Parameters: ; ; ; ; ; .
Box 3—figure 1

Ratcheting and tradeoff breaking.
(a) Values of and accessible to organisms when and is free (purple), and when and is free (black). (b) Trait space with isolines of fitness ( in red, in orange) with an example of evolutionary trajectory in green (ancestral tradeoff represented in purple). (c) Fitness values for (in brown), , and , in addition to the stable proportion of G (in blue) along the example evolutionary trajectory. The times marked by vertical lines in (c) correspond to the dots in (b). Note that and have opposed dynamics from to (fitness-decoupling observation), and both increase after . Rare mutations on allow breaking away from the ancestral tradeoff line (tradeoff-breaking observation) after . Parameters: ; .
Figure 8

An adaptive scenario for evolutionary transitions in individuality as a consequence of the trait-based approach.
(1) Collective formation of particles occurs through an event that does not change the focal traits. (2) Optimisation ‘on the tradeoff’, where the traits are selected within the constraints passed down from the ancestral organism. (3) Tradeoff breaking, where mutations that are not bound by the ancestral constraints enable tradeoff breaking. Fitness-decoupling observations are expected in the second phase but not in the third. Note that the second phase might be shortened or even bypassed depending on the mutational path (this second route ‘immediate tradeoff breaking’ contrasts with the previously described first route ‘fast-slow dynamics’). This framework can be used to interpret a diversity of experimental and mathematical model systems as shown with the examples: P. fluorescens from Hammerschmidt et al., 2014, S. cerevisiae from Ratcliff et al., 2015, ecological scaffolding from Black et al., 2020, and ratchet model from Libby et al., 2016.
Additional files
Download links
A two-part list of links to download the article, or parts of the article, in various formats.
Downloads (link to download the article as PDF)
Open citations (links to open the citations from this article in various online reference manager services)
Cite this article (links to download the citations from this article in formats compatible with various reference manager tools)
Tradeoff breaking as a model of evolutionary transitions in individuality and limits of the fitness-decoupling metaphor
eLife 11:e73715.
https://doi.org/10.7554/eLife.73715


