IL-37 expression reduces acute and chronic neuroinflammation and rescues cognitive impairment in an Alzheimer’s disease mouse model
- Department of Cellular Neurobiology, Zoological Institute, Germany
- Neuroinflammation and Neurodegeneration Group, Helmholtz Centre for Infection Research, Germany
- BRICS - Braunschweig Integrated Centre of Systems Biology, Germany
- Genome Analytics Group, Helmholtz Center for Infection Research, Germany
- Department of Computational Biology of Infection Research, Helmholtz Centre for Infection Research, Germany
- Department of Medicine, University of Colorado Denver, United States
- Department of Medicine, Radboud University, Medical Center, Netherlands
Figures
Figure 1 with 1 supplement

Primary microglial cells from IL-37tg mice showed decreased pro-inflammatory cytokine release after stimulation by LPS.
(A) WT and IL-37tg primary microglial cells (P3-5) were plated and stimulated without LPS or with LPS. Cells were treated for 6 hr (B) and 24 hr (B–E). Cells from homozygous transgenic animals released less pro-inflammatory cytokines IL-6 (C), TNF- (D) and IL-1β (E) under different LPS concentration (B-E n=4–9). (F) IL37 mRNA was analyzed in IL-37tg microglial cells at specific intervals after addition of LPS. (G) Levels of IL-6 were measured from the same cells as in (F) and were detectable only after 24 hr (n=3). (H) Levels of IL-6 were measured in WT after addition of increasing concentrations of recombinant IL-37b and 100 ng LPS (H n=6–18). Data are presented as mean ± SEM. * p<0.05, ** p<0.01, *** p<0.001 compared to WT. (B+F + H: 1-way ANOVA with multiple comparison; C-E+G: t-test).
-
Figure 1—source data 1
Release of pro-inflammatory cytokines by microglia after LPS stimulation.
- https://cdn.elifesciences.org/articles/75889/elife-75889-fig1-data1-v2.xlsx
Figure 1—figure supplement 1

Pro-inflammatory cytokine release by primary astrocytes after LPS stimulation.
(A–B) Primary astrocytes respond to an LPS stimulus (100 ng/ml for 24 hr) with increased levels of the pro-inflammatory cytokines IL-6 (A) and TNF-α (B). In contrast to microglial cells, astrocytes from hIL-37tg mice showed no reduction in these two pro-inflammatory cytokines (n=5-10).
-
Figure 1—figure supplement 1—source data 1
Release of pro-inflammatory cytokines by astrocytes after LPS stimulation.
- https://cdn.elifesciences.org/articles/75889/elife-75889-fig1-figsupp1-data1-v2.xlsx
Figure 2
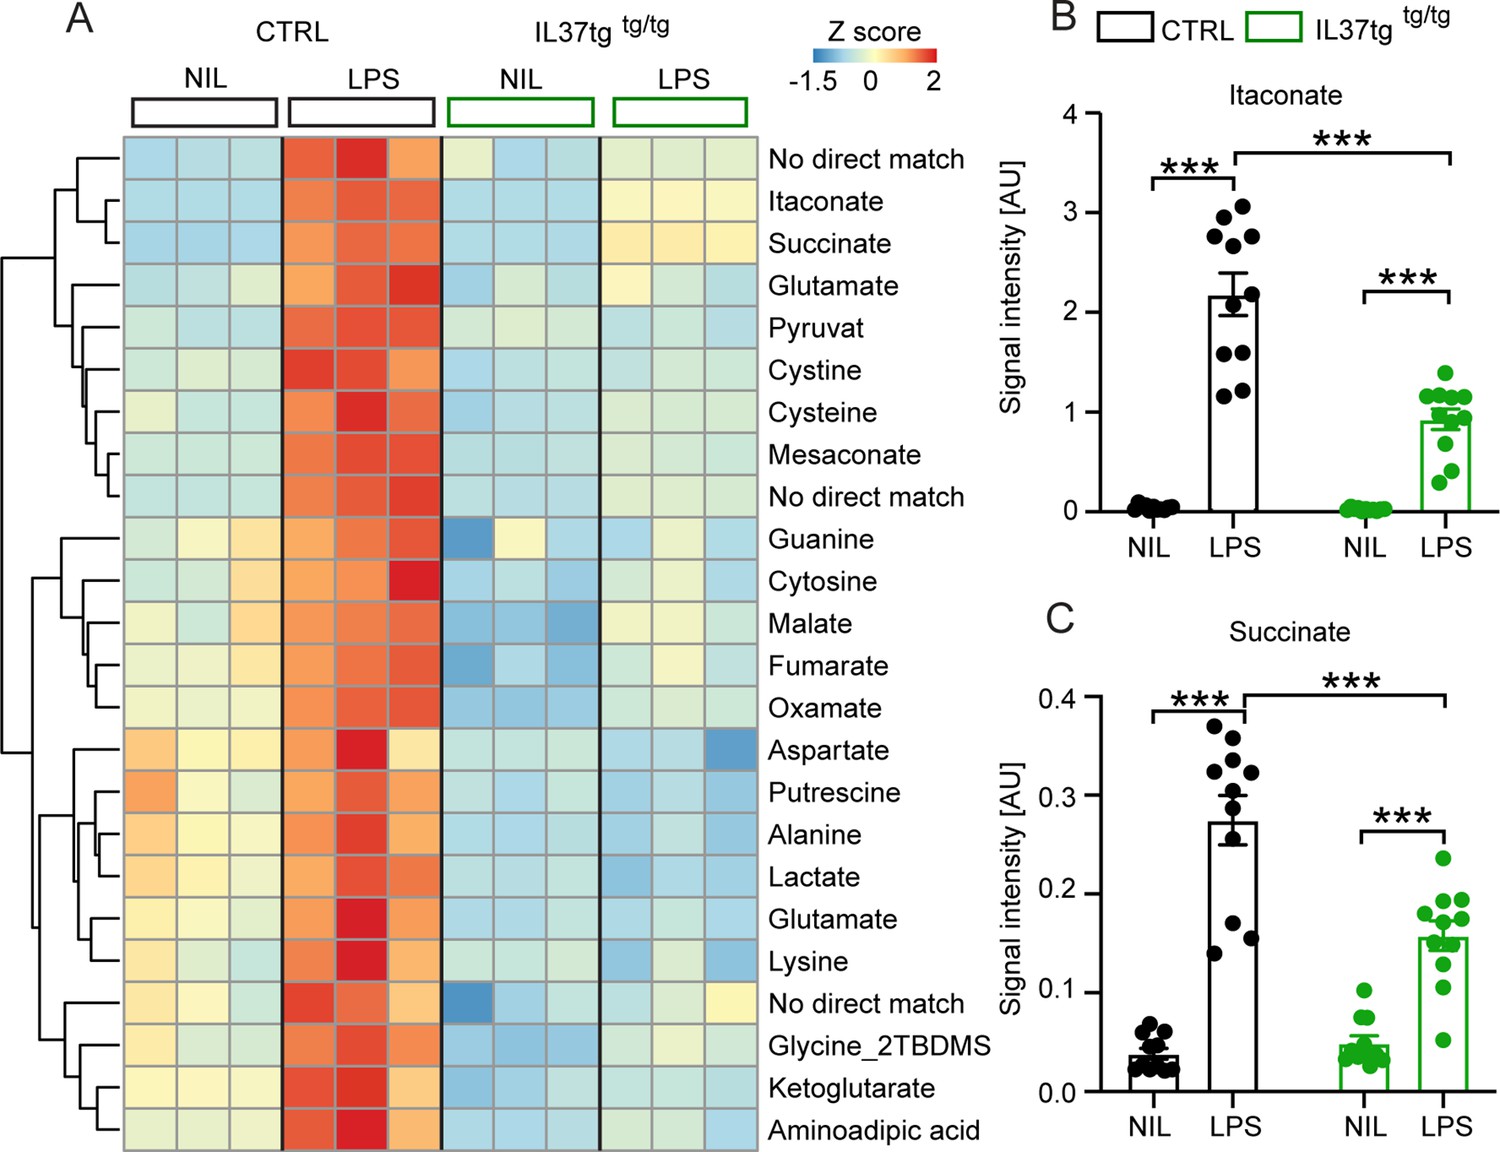
Primary microglial cells isolated from IL-37tg mice exhibited reduced levels of inflammation-associated intracellular metabolites after stimulation with LPS.
WT and IL-37tg microglia were stimulated with 10 ng/ml LPS (based on highly sensitive metabolomics assessments). Metabolomic analysis was performed on these cells. (A) Heatmap of identified significantly altered metabolites after or without LPS stimulation (described as Z-score). (B–C) Significant effects in WT, treated with LPS, were seen with respect to itaconate (B) and succinate (C), whereas these changes were significantly reduced in IL-37tg microglial cells treated with LPS compared with WT cells (n=11). Data are presented as mean ± SEM. *** p<0.001 (two-way ANOVA with multiple comparison).
-
Figure 2—source data 1
Inflammation-associated intracellular metabolites in primary microglia after LPS stimulation.
- https://cdn.elifesciences.org/articles/75889/elife-75889-fig2-data1-v2.xlsx
Figure 3 with 2 supplements

IL-37tg mice showed decreased pro-inflammatory cytokine release and less activated microglia after the stimulus of LPS.
(A) WT and IL-37tg mice were stimulated with saline or LPS. (B) IL-37tg animals exhibited significantly less weight loss compared to WT mice. However, IL-37tg mice also had a significant weight change compared to saline treated mice (n=10–22). Microglial cell activation was analyzed by FACS method. (C–D) Microglial cells were identified as CD11b+ and CD45low cells and analyzed for CD68 expression. IL-37tg mice had a lower percentage of cells with CD68 expression compared with WT mice after LPS stimulation (n=4) (C–D). (E) In addition, WT mice exhibited a significant increase in IL-1β levels after LPS treatment, whereas IL-37tg mice did not (n=6–8). (F–I) Morphological analysis of microglial cells showed an increased number of IBA-1-positive cells in WT animals treated with LPS compared with saline-treated animals. In contrast, there is no increased IBA-1-positive cell number in IL-37tg animals after LPS stimulation (n=9–18; n=18–30 cells for processes). (J) Representative images of IBA-1-positive cells (red) and DAPI (blue); scale bar 40 µm. Data are shown as mean ± SEM. * p<0.05, ** p<0.01, *** p<0.001, (B-I: 2-way ANOVA with multiple comparison).
-
Figure 3—source data 1
Neuroinflammatory status of mouse brain after systemic LPS challenge.
- https://cdn.elifesciences.org/articles/75889/elife-75889-fig3-data1-v2.xlsx
Figure 3—figure supplement 1

Pro-inflammatory cytokines in brain lysates after peripheral LPS challenge.
(A–B) Pro-inflammatory cytokines IL-6 and TNF-α were measured in brain lysates from mice treated with LPS or saline (control). WT Mice showed slightly increased levels of IL-6 after LPS compared with mice treated with saline, whereas hIL-37tg mice did not show increased IL-6 levels (A) (n=7-10); TNF-α levels were not altered in both WT and hIL-37tg mice after LPS challenge (B) (n=3-5).
-
Figure 3—figure supplement 1—source data 1
Pro-inflammatory cytokines in mouse brain after systemic LPS challenge.
- https://cdn.elifesciences.org/articles/75889/elife-75889-fig3-figsupp1-data1-v2.xlsx
Figure 3—figure supplement 2

FACS analysis of brain cells after peripheral LPS administration.
(A–B) Fluorescent activated cell sorting (FACS) method was used to analyze microglial activation with respect to CD68 expression (n=4). In forward/side scatter (FSC/SSC), the region of interest (ROI) was selected (A) and analyzed for two monocyte markers (CD11b and CD45) (B). (C–J) CD68 expressing cells were analyzed in microglia (CD11b+/CD45low) (C–E), macrophages (CD11b+/CD45high) (F–H), and leukocytes (CD11b-/CD45high) (I–J). (K) The number of cells in the different populations is shown in the experimental groups.
Figure 4
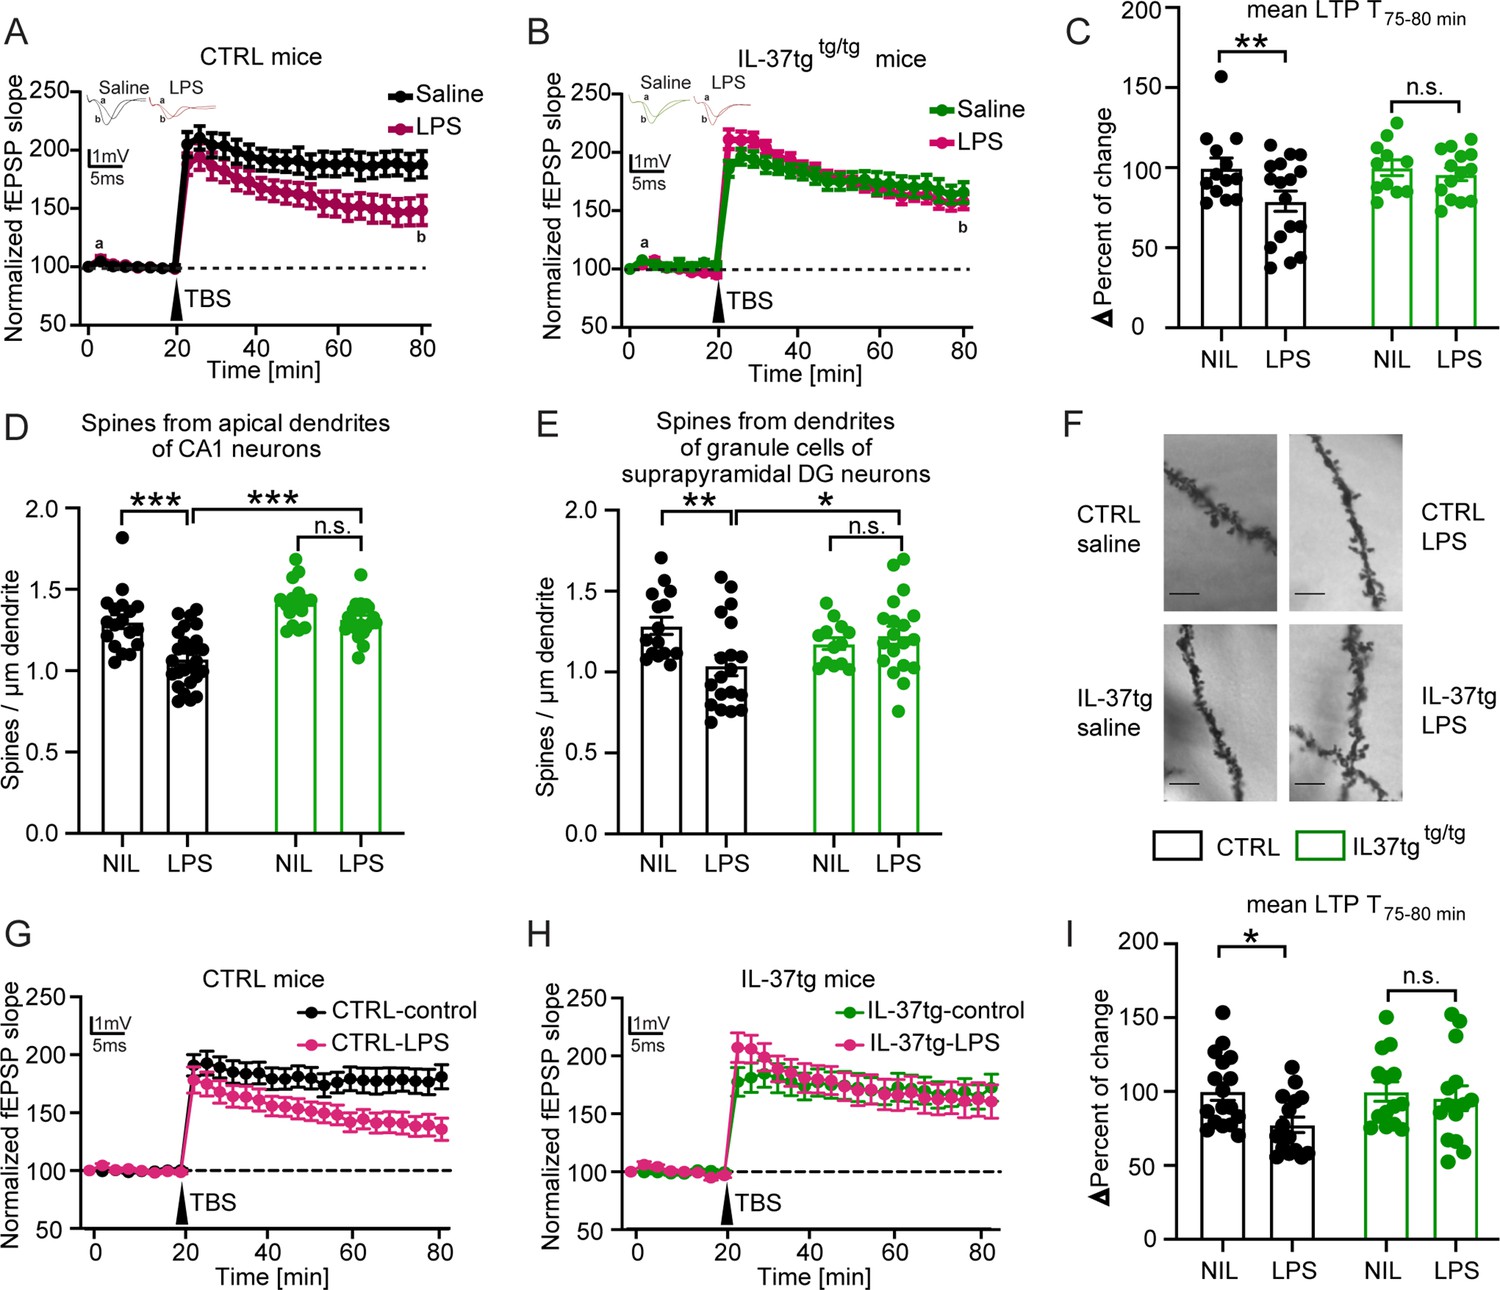
IL-37tg mice showed rescued synaptic plasticity and restored loss of spine density after stimulation by LPS compared with WT animals.
(A) WT animals stimulated with LPS showed significant impairment of theta burst stimulation-induced LTP (TBS) compared with WT, which were treated with saline. (B) In contrast, IL-37tg mice showed no significant impairment of LTP after LPS treatment. (C) Mean LTP magnitude (average of 55–60 min after TBS) was significantly lower in WT mice treated with LPS, while IL-37tg mice showed no significant differences (n of mice 3–4; n of acute slices 11–17). (D–F) Spine density in apical dendrites of the CA1 hippocampal neurons and in the superior DG neurons was significantly decreased in WT mice treated with LPS, whereas spine density of IL-37tg animals treated with LPS was not affected (n of mice 3–4; n of dendrites 13–25) (D and E). (F) Representative images of dendritic spines of hippocampal CA1 neurons in the tested groups were shown; scale bar 5 µm. (G) WT acute slices stimulated with LPS showed significant impairment of TBS-induced LTP compared with WT acute slices treated with ACSF. (H) In contrast, acute slices from IL-37tg mice showed no significant impairment of LTP after LPS treatment. (I) Mean LTP magnitude (mean of 55–60 min after TBS) was significantly lower in acute slices from WT mice treated with LPS, whereas slices from IL-37tg mice showed no significant differences (n of mice 3–4; n of acute slices 14–17). Data are presented as mean ± SEM. * p<0.05, *** p<0.001, (A-I: two-way ANOVA with multiple comparison).
-
Figure 4—source data 1
Assessment of synaptic plasticity after LPS challenge.
- https://cdn.elifesciences.org/articles/75889/elife-75889-fig4-data1-v2.xlsx
Figure 5 with 1 supplement
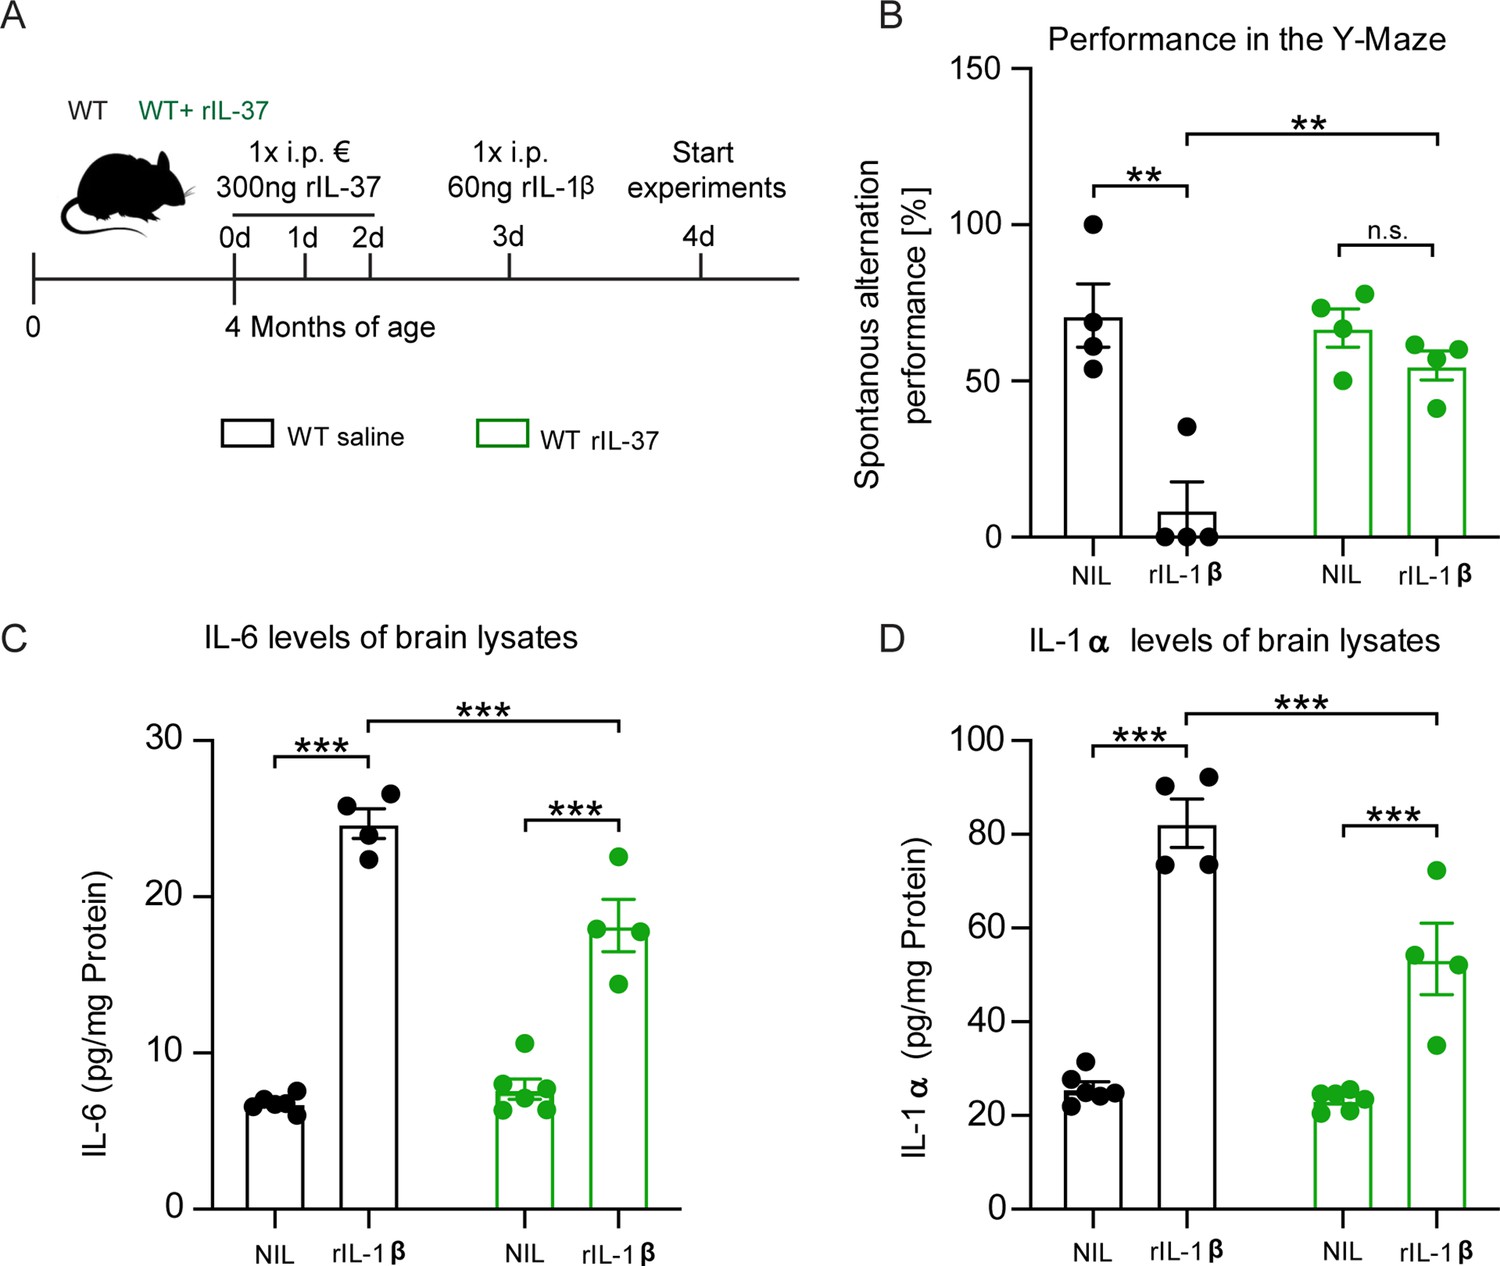
Injection of recombinant IL-37 into WT mice showed restoration of cognitive deficits and reduced release of pro-inflammatory cytokines after IL-1β-mediated immunostimulation.
(A) WT mice were pretreated with either saline or rIL-37 for three consecutive days and then injected with saline or IL-1β. (B) WT mice pretreated with saline and then stimulated with IL-1β failed to perform the Y-maze test, whereas WT mice pretreated with rIL-37 and then stimulated with IL-1β performed the test without deficits (n=4). (C and D) Although the pro-inflammatory cytokine levels of IL-6 and IL-1α were significantly increased in stimulated WT mice pretreated with rIL-37 compared with the control group, the mice treated with rIL-37 showed a significant decrease in cytokine levels after immunostimulation with IL-1β compared with saline treated group (n=4–6). Data are presented as mean ± SEM. ** p<0.01, *** p<0.001, (B-D: two-way ANOVA with multiple comparison).
-
Figure 5—source data 1
Suppressive effect of rIL-37 on the inflammatory response induced by IL-1β.
- https://cdn.elifesciences.org/articles/75889/elife-75889-fig5-data1-v2.xlsx
Figure 5—figure supplement 1

Pro-inflammatory cytokines in brain lysates after peripheral pretreatment with recombinant IL-37 followed by LPS challenge.
(A–C) IL-1β (A), IL-6 (B), and TNF-α (C) measured in control and LPS-treated WT or rIL-37-pretreated WT mice (n=3-4).
-
Figure 5—figure supplement 1—source data 1
Pro-inflammatory cytokine levels induced by LPS in the brain of rIL-37 treated mice.
- https://cdn.elifesciences.org/articles/75889/elife-75889-fig5-figsupp1-data1-v2.xlsx
Figure 6 with 2 supplements
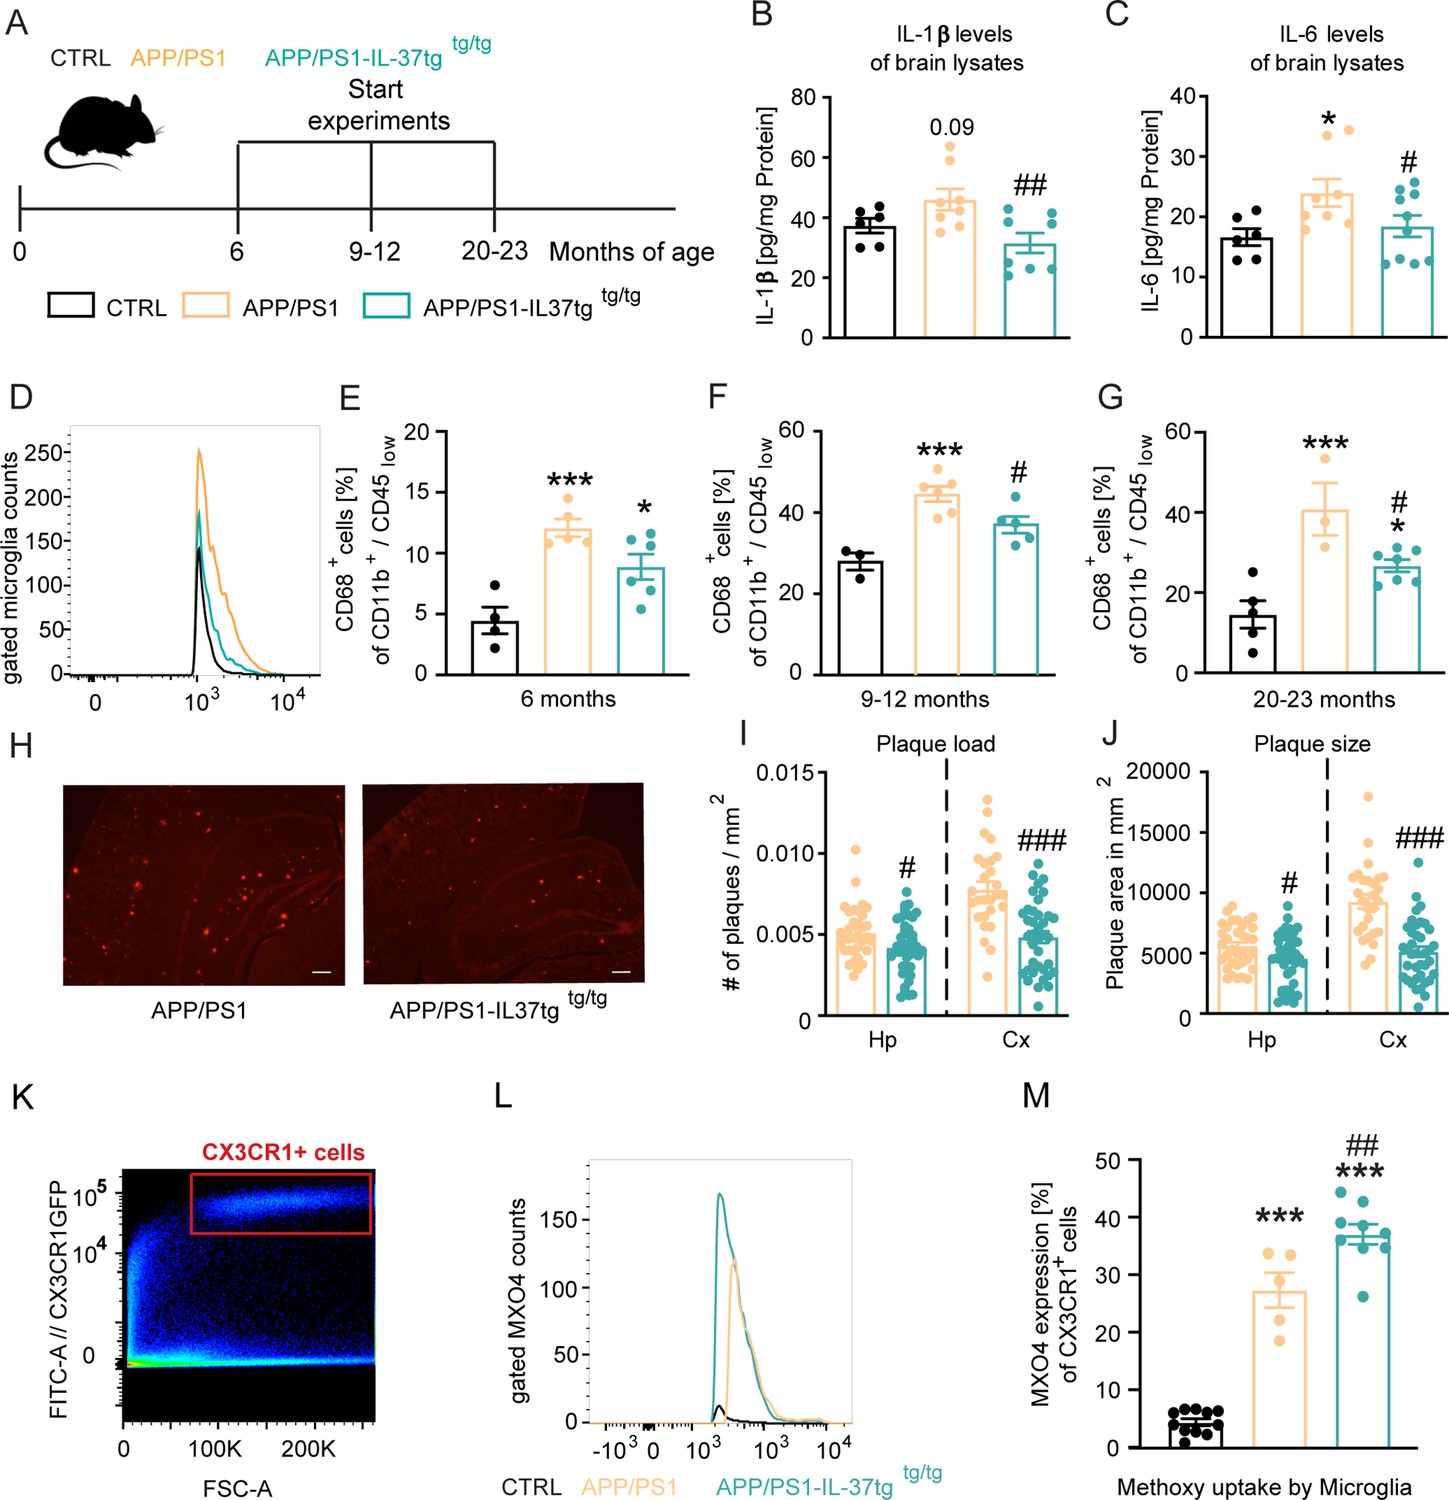
APP/PS1-IL37tg double transgenic mice showed lower pro-inflammatory cytokine expression and reduced activation of microglia, as well as lower numbers of amyloid plaques compared with APP/PS1 mice.
(A) WT, APP/PS1, and APP /PS1-IL37tg mice were analyzed at 6, 9–12, and 20–23 months of age. (B–C) Pro-inflammatory cytokine levels of IL-6 and IL-1β (although for IL-1β was not statistically significant) were increased in 9–12 months old APP/PS1 mice compared with WT mice, whereas APP/PS1-IL37tg mice showed no increase in pro-inflammatory cytokines (n=6–10). (D–G) Microglial cells were identified as CD11b+ and CD45low cells and analyzed for CD68 expression. Nine to 12-month-old APP/PS1 mice showed a significantly increased percentage of cells with CD68 expression compared with WT mice, whereas APP/PS1-IL37tg mice did not show a significant increase (D and F). Although 6- and 20–23 month-old APP/PS1-IL37tg mice had a significantly higher amount of CD68-expressing cells compared with WT mice, the percentage of CD68-expressing cells was reduced compared with APP/PS1 animals (6 months: n=4–6; 9–12 months: n=3–6; 20–23 months: n=3–7). (H–J) Plaque analysis showed significantly lower plaque burden (I) and reduced plaque size (J) in the hippocampal (Hp) and cortex (Cx) regions compared between APP/PS1-IL37tg mice and APP/PS1 (n=27–42). Representative image of Congo red staining in 30 µm sections; scale bar 500 µm (H). (K–M) Aβ uptake by microglial cells by measuring single cells in FACS system. Gating strategy for positive Cx3CR1-GFP cells and positive staining for MXO4 (K–L). Quantified analysis of Aβ uptake showing significantly higher uptake in APP/PS1-IL37tg cells compared with APP/PS1 cells (n=5–11) (M). Data are presented as mean ± SEM. * p<0.05, ** p<0.01, *** p<0.001 compared to WT, # p<0.05, ## p<0.01, ### p<0.001 compared to APP/PS1. (B-G and M: one-way ANOVA with multicolumn comparison; I-J: t-test).
-
Figure 6—source data 1
Neuroinflammatory status in the brain of APP/PS1 mice.
- https://cdn.elifesciences.org/articles/75889/elife-75889-fig6-data1-v2.xlsx
Figure 6—figure supplement 1

Congo red staining of brain sections from APP/PS1 and APP /PS1-IL37 mice.
(A–B) Plaque staining in the cortex area of APP/PS1 mice (A) and APP/PS1-IL37tg mice (B). A single plaque is shown in the lower right inset. (C–D) Plaque staining in the hippocampal region of APP/PS1 mice (C) and APP/PS1-IL37tg mice (D). Individual plaques are shown in the lower left inset (scale bar 200 µm).
Figure 6—figure supplement 2

FACS analysis of microglial cells regarding their Methoxy-X04 uptake.
(A–C) Gating strategy of CX3CR1-GFP+cell. (D–E) Gating strategy for MX04-(neg) and MX04+(pos) cells depending on the Pacific-Blue-Methoxy-X04 signal. (G–I) Cell counts of MX04- and MX04 + cells in WT, APP/PS1 and APP/PS1-IL37tg (n=5-11).
Figure 7 with 1 supplement
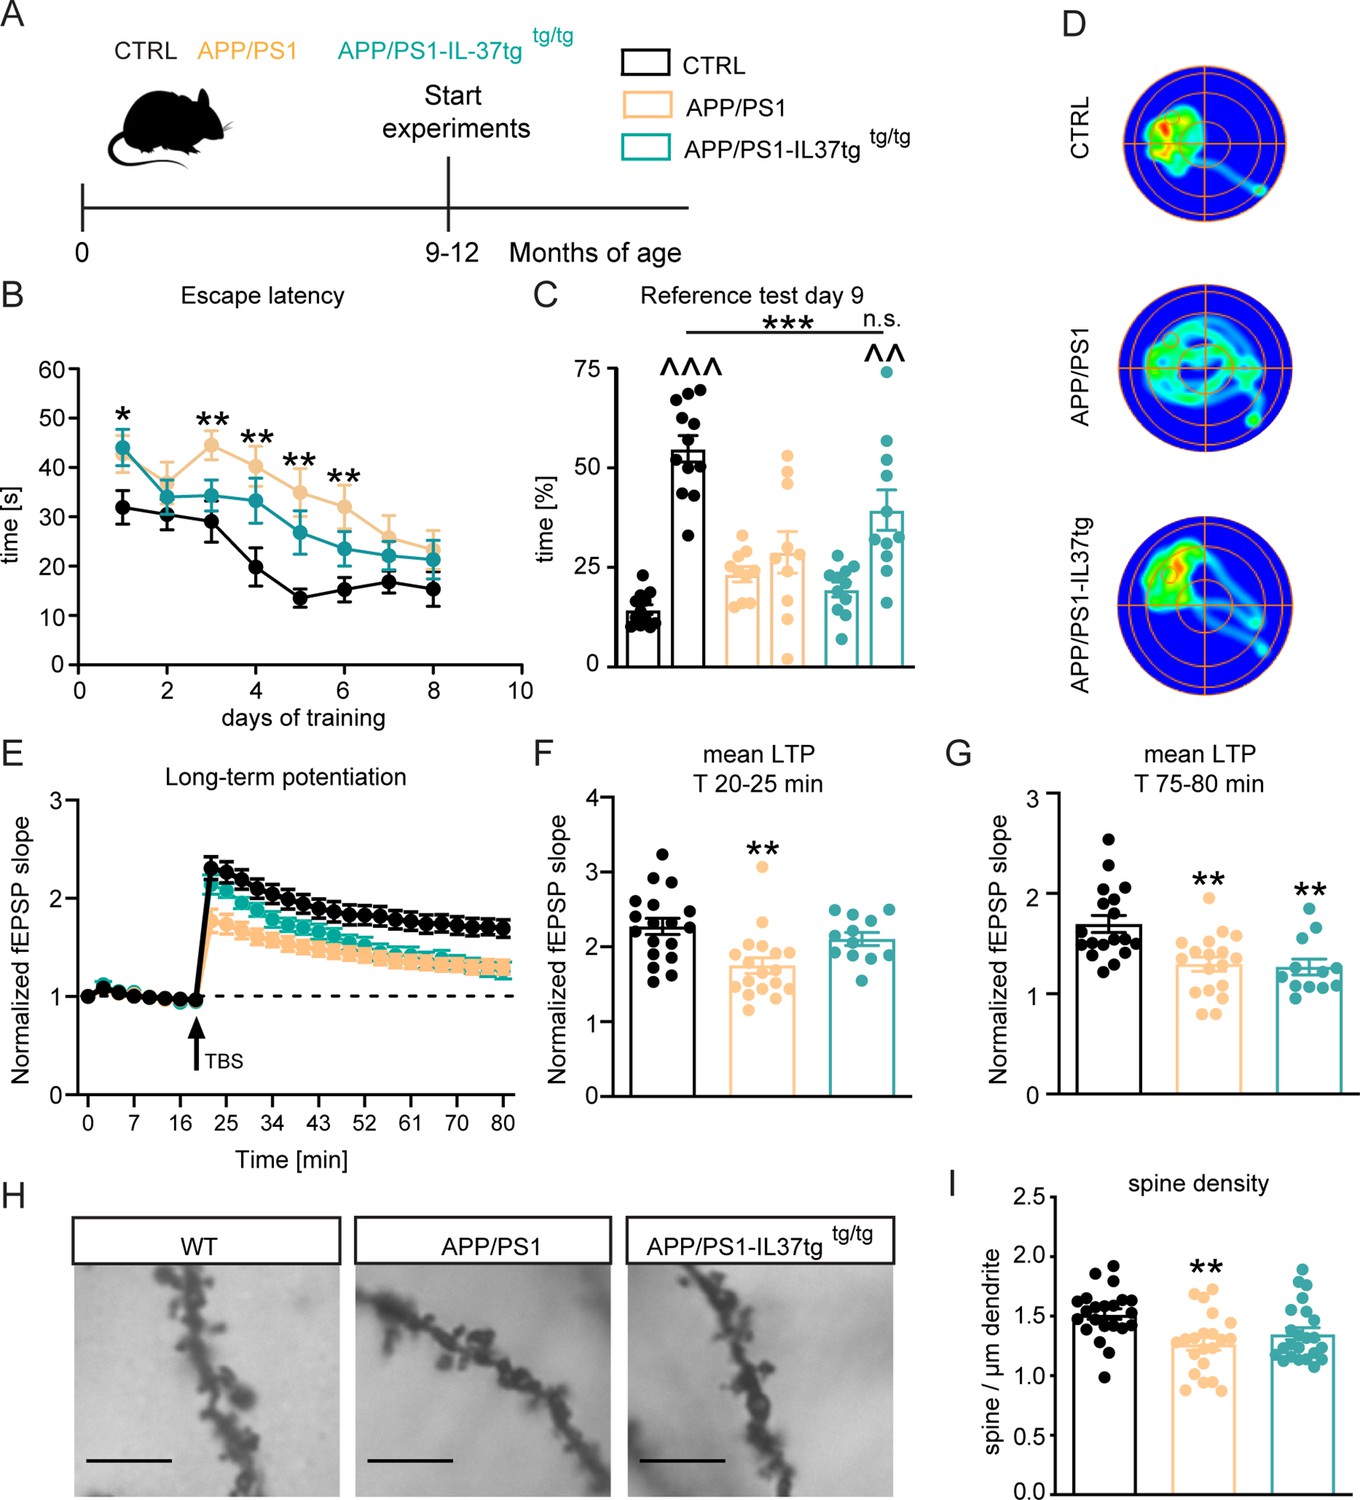
APP/PS1-IL37tg double transgenic mice showed improvements in behavioral tests and synaptic plasticity compared with APP/PS1 mice.
(A) WT, APP/PS1 and APP/PS1-IL37tg mice were analyzed at 9–12 months of age. (B–D) The cognitive deficits of APP/PS1 mice in the spatial learning test of the Morris Water Maze could be restored in APP/PS1-IL37tg animals. WT APP/PS1 and APP/PS1-IL37tg mice showed learning behavior during the training phase of the spatial learning test. APP/PS1 animals showed higher escape latency during acquisition on day 3–6 compared to WT mice (B). WT Mice and APP/PS1-IL37tg mice show a significant preference for the target quadrant (TQ), whereas APP/PS1 mice showed no preference (C). Representative heat maps of mice from each group demonstrated the results of the reference test (D) (n=10–12). (E–G) The LTP deficits in APP/PS1 mice could be rescued in APP/PS1-IL37tg mice in the induction phase (20–25 min). However, LTP deficits were not restored in APP/PS1-IL37tg animals in the maintenance phase (75–80 min) (n of animals 3–4; n of slices 12–18). (H–I) Dendritic spine density was significantly reduced in APP/PS1 animals compared to WT, whereas there was no significant reduction in spine density in APP/PS1-IL37tg (n=21–23), scale bar 5 µm. Data are presented as mean ± SEM. * p<0.05, ** p<0.01, *** p<0.001 compared to WT, ^^ p<0.01, ^^^ p<0.001 compared to NT (non-target quadrants); (B+E: two-way ANOVA with multiple comparison; C: t-test; C-I: one-way ANOVA with multiple comparison).
-
Figure 7—source data 1
Assessment of spatial learning and synaptic plasticity in APP/PS1 mice.
- https://cdn.elifesciences.org/articles/75889/elife-75889-fig7-data1-v2.xlsx
Figure 7—figure supplement 1

Age of the trained mice in the behavioral experiment.
Average age of each genotype trained in the Morris water maze is displayed (n=10-12).
-
Figure 7—figure supplement 1—source data 1
Age range of mice trained in the Morris water maze.
- https://cdn.elifesciences.org/articles/75889/elife-75889-fig7-figsupp1-data1-v2.xlsx
Figure 8 with 1 supplement
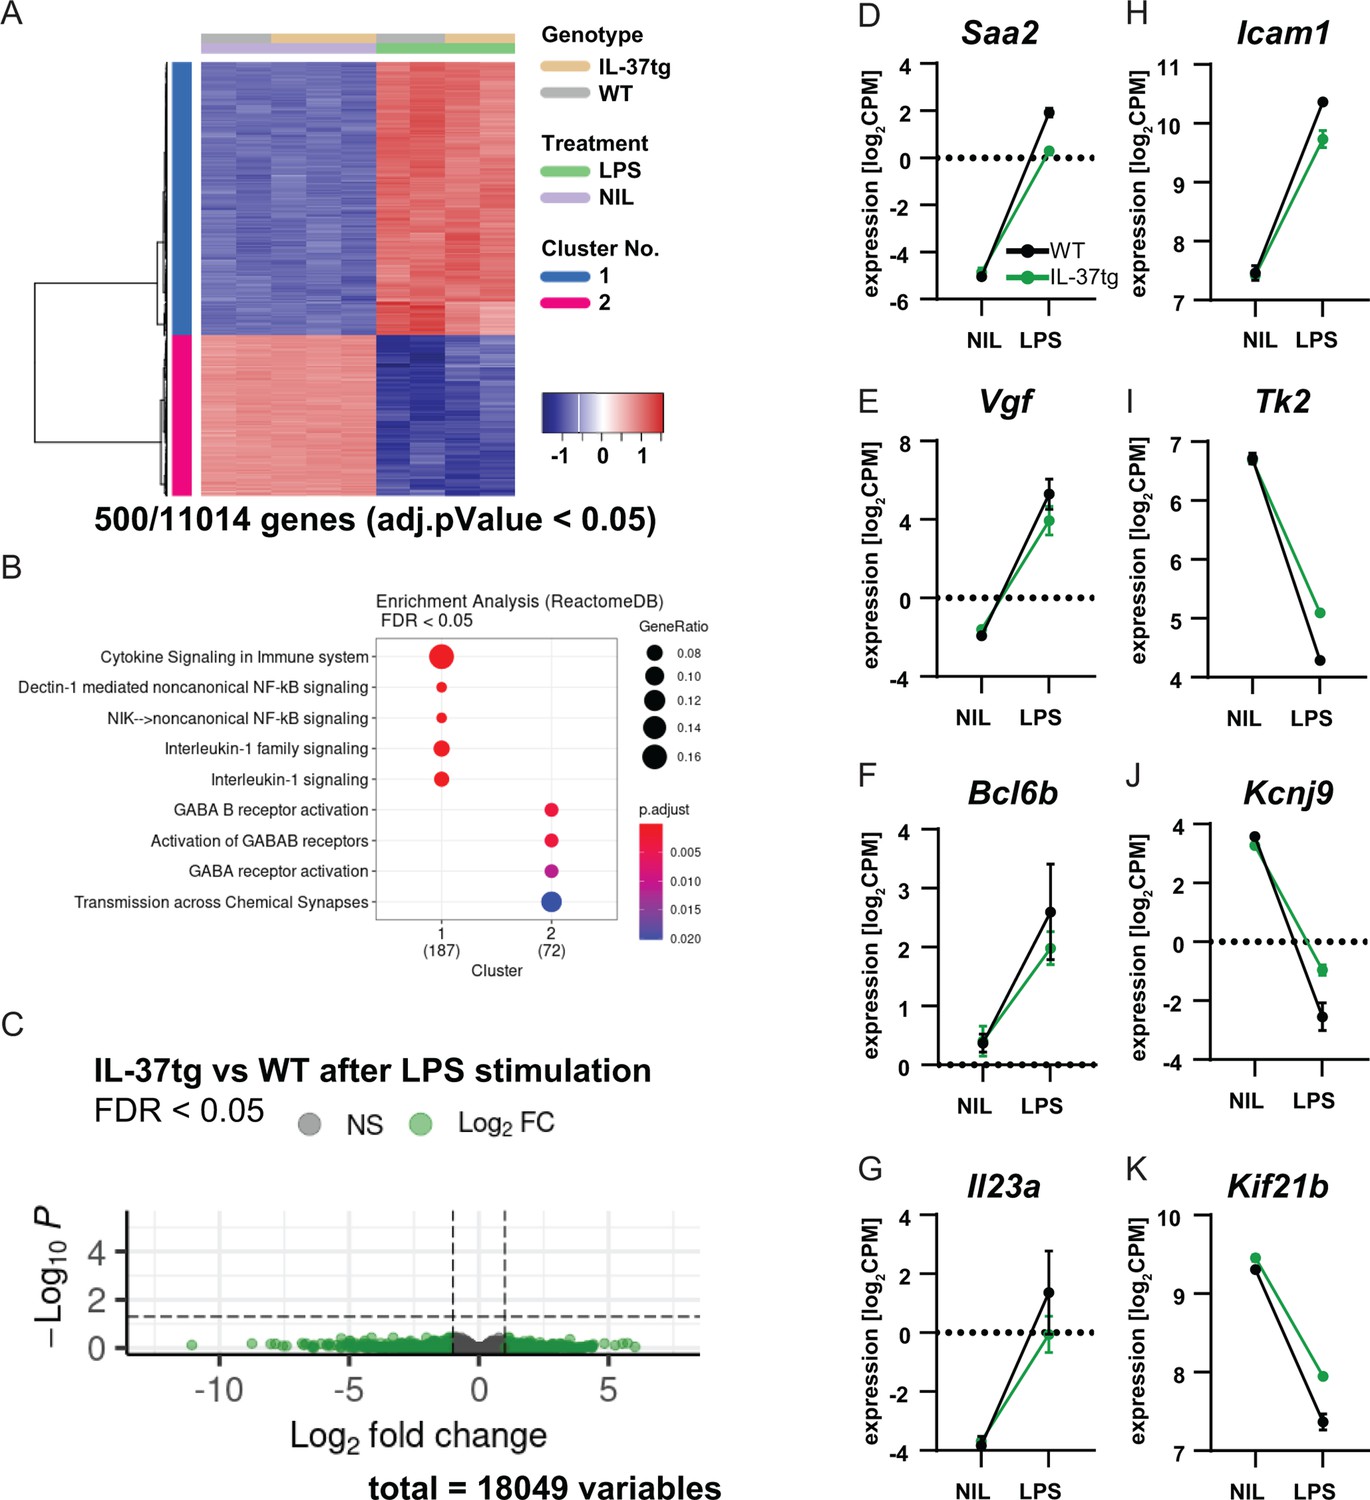
RNA sequencing of microglia isolated from WT and IL-37tg mice after LPS challenge in vivo.
(A) Heatmap shows z-normalized gene expression profiles of the 500 most highly regulated genes (out of 11014 genes with adjusted pValue <0.05). Two clusters of co-regulated genes were identified, representing up- and down-regulated genes after LPS treatment. Each column shows expression data of individual mouse transcriptomes. (B) Gene Set Enrichment Analysis (GSEA) was performed for the 500 most up-regulated genes, which are also shown in the heat map. Each cluster (1 and 2) was tested for enriched gene sets defined by the Reactome Pathway Database (https://reactome.org/). The number of genes that could be linked to gene sets in the Reactome Pathway Database is indicated under each cluster name. The terms for the major gene sets are shown. The size of the circles corresponds to the ratio of genes found in each gene set. Significance of enrichment is expressed by a blue-red color code. (C) Differential expression comparing WT and IL-37tg after LPS stimulation is shown by the Volcano plot. Log2FC and the corresponding adjusted pValue are shown for each gene analyzed (18,049 in total). The dashed lines show the limits for significant gene regulation: –1 1, FDR <0.05. (D–K) Changes in gene expression after LPS injection in WT and IL-37tg mice for candidate genes are shown (n=2-3).
-
Figure 8—source data 1
RNA sequencing data of microglia isolated from mice after systemic LPS challenge.
- https://cdn.elifesciences.org/articles/75889/elife-75889-fig8-data1-v2.xlsx
Figure 8—figure supplement 1
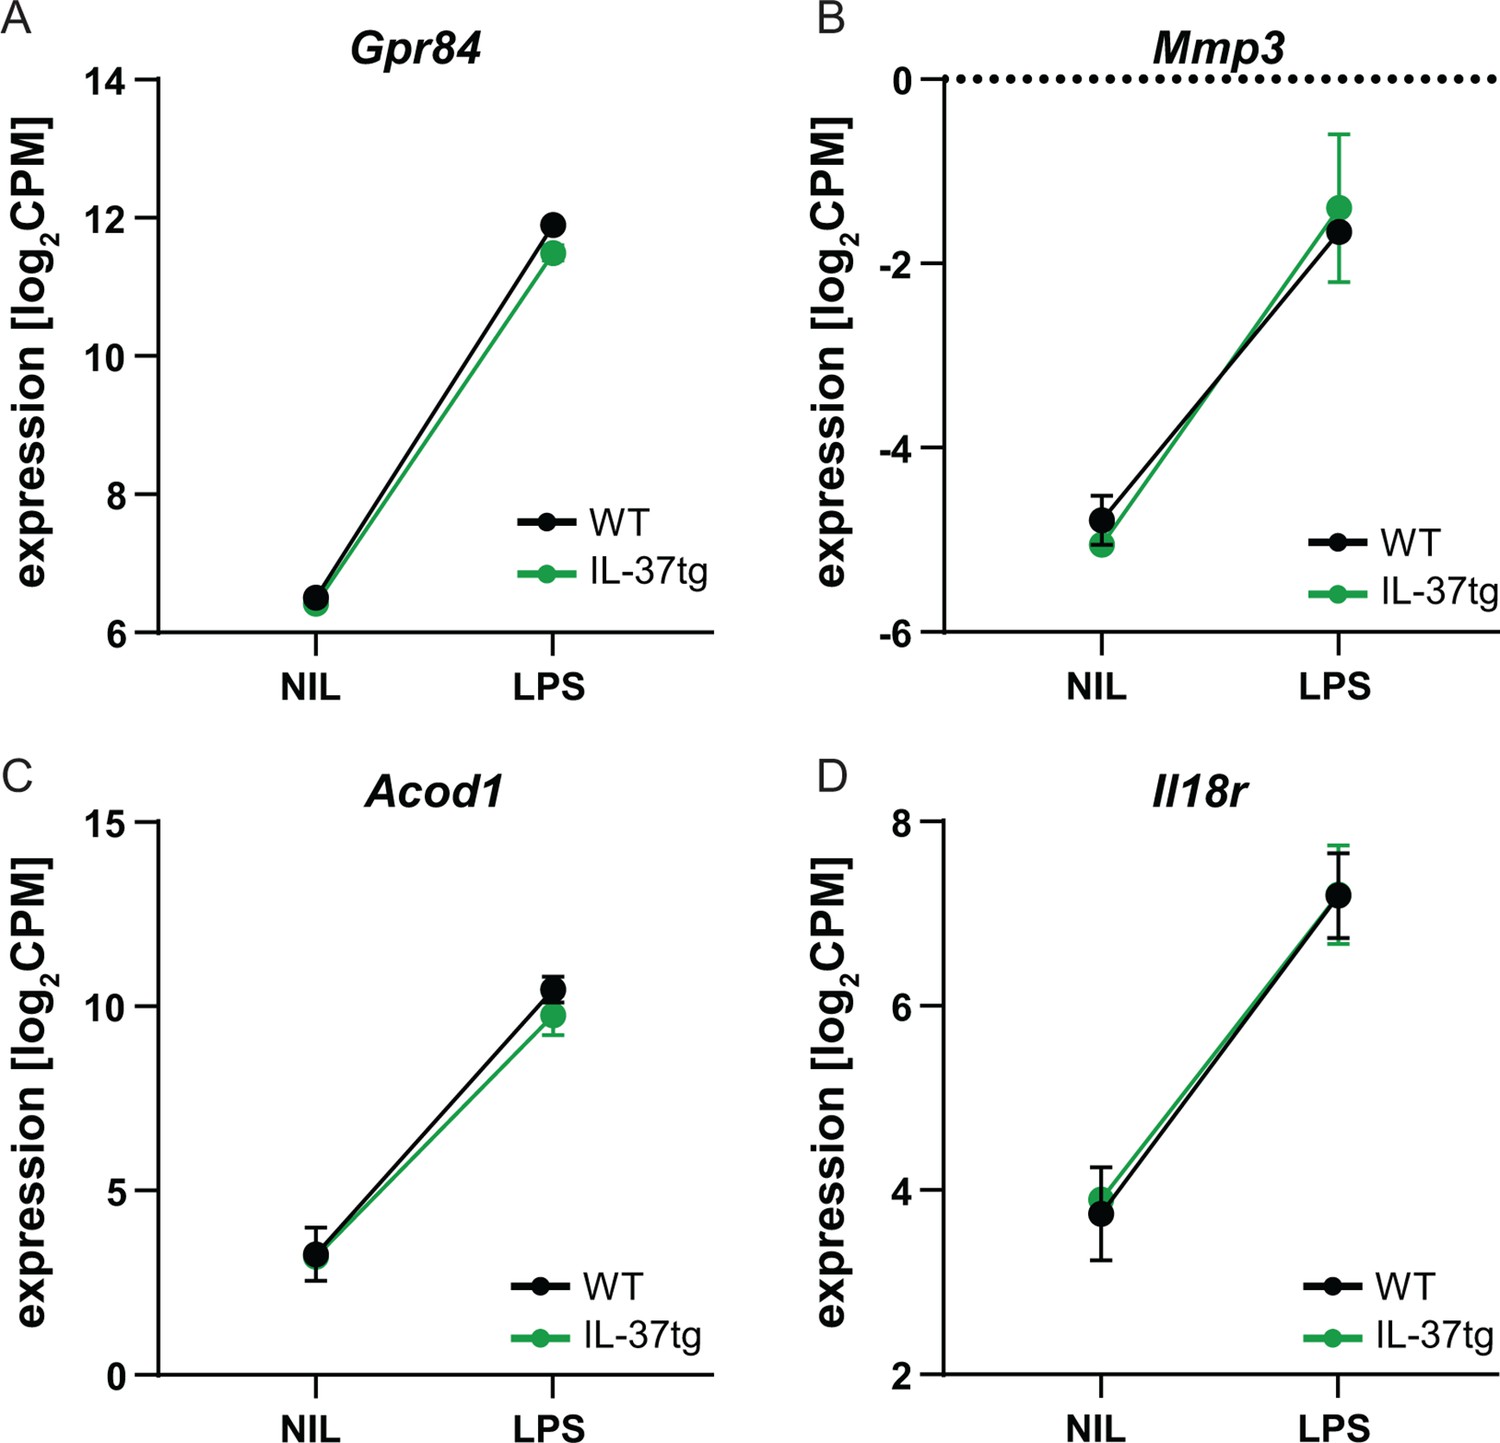
RNA sequencing of microglia isolated from WT and IL-37tg mice after LPS challenge in vivo.
(A–D) The changes in expression levels after LPS injection in WT and IL-37tg mice for the candidate genes are shown (n=2-3).
-
Figure 8—figure supplement 1—source data 1
Expression levels of candidate genes in microglia isolated from mice after systemic LPS challenge.
- https://cdn.elifesciences.org/articles/75889/elife-75889-fig8-figsupp1-data1-v2.xlsx
Tables
Key resources table
| Reagent type (species) or resource | Designation | Source or reference | Identifiers | Additional information |
|---|---|---|---|---|
| antibody | Anti-IBA1 (Rabbit polyclonal) | Synaptic Systems | Cat#234003, RRID:AB_10641962 | 1:1000 |
| antibody | Cy2 AffiniPure Goat Anti-Rabbit IgG (H+L) (Rabbit polyclonal) | Jackson ImmunoResearch Laboratories | Cat# 111-225-144, RRID:AB_2338021 | 1:500 |
| antibody | Cy3 AffiniPure Goat Anti-Mouse IgG +IgM (H+L) (Mouse polyclonal) | Jackson ImmunoResearch Laboratories | Cat#115-165-068, RRID:AB_2338686 | 1:500 |
| antibody | Cy3 AffiniPure Goat Anti-Rabbit IgG (H+L) (Rabbit polyclonal) | Jackson ImmunoResearch Laboratories | Cat#111-165-144, RRID:AB_2338006 | 1:500 |
| antibody | mouse CD68-PE Clone REA835 (mouse monoclonal) | Miltenyi Biotec | Cat# 130-112-856 | 1:50 |
| antibody | mouse CD11b-PerCP-Vio700 Clone REA592 (mouse monoclonal) | Miltenyi Biotec | Cat# 130-113-809 | 1:50 |
| antibody | mouse CD45-APC (mouse monoclonal) | Miltenyi Biotec | Cat# 130-110-798 | 1:50 |
| chemical compound, drug | Bovine Serum Albumin | Sigma-Aldrich | Cat# A7906 | |
| chemical compound, drug | CaCl2 | Applichem | Lot: 4U010421 | |
| chemical compound, drug | cOmplete Protease Inhibitor Cocktail | Sigma-Aldrich | Cat# 04693116001 | |
| chemical compound, drug | DAPI | Sigma-Aldrich | Cat# D9542 | |
| chemical compound, drug | D-glucose | Roth | Art.-Nr. HN06.3 | |
| chemical compound, drug | Evans Blue tetrasodium salt | Tocris | Cat# 0845 | |
| chemical compound, drug | Fluoro-Gel mounting medium | Electron Microscopy Sciences | Cat# 17985–10 | |
| chemical compound, drug | GBSS | Sigma-Aldrich | G9779-500ML | |
| chemical compound, drug | Gibco DMEM | Fisher Scientific | Cat# 31885023 | |
| chemical compound, drug | Gibco Fetal Bovine Serum | Fisher Scientific | Cat# 11573397 | |
| chemical compound, drug | Gibco HBSS 10 X | Fisher Scientific | Cat# 14065049 | |
| chemical compound, drug | Gibco L-Glutamine | Fisher Scientific | Cat# 15410314 | |
| chemical compound, drug | Glycine | Applichem | Cat# A1067 | |
| chemical compound, drug | KCl | Applichem | Lot: 0000574737 | |
| chemical compound, drug | KH2PO4 | Applichem | Lot: 4Q016683 | |
| chemical compound, drug | Methoxy-XO4 | Abcam | ab142818 | |
| chemical compound, drug | MgSO4 | Applichem | Lot: 3E000057 | |
| chemical compound, drug | NaCl | Applichem | Lot: 8Q012497 | |
| chemical compound, drug | NaHCO3 | Roth | Art.-Nr. HN01.1 | |
| chemical compound, drug | Permount Mounting Medium | Fisher Scientific | Cat# SP15-100 | |
| chemical compound, drug | Poly-L-lysine solution | Sigma-Aldrich | CAS# 25988-63-0 | |
| peptide, recombinant protein | Recombinant IL-37 | Moretti et al., 2014 | N/A | |
| peptide, recombinant protein | Recombinant IL-1β | Kim et al., 2013 | N/A | |
| chemical compound, drug | Triton X-100 Molecular Biology grade BC | Applichem | Cat# A4975 | |
| chemical compound, drug | Trypsin-EDTA Solution 10 X | Sigma-Aldrich | CAS Nr. 9002-07-7 | |
| chemical compound, drug | TWEEN 20 | Sigma-Aldrich | Cat# P9416 | |
| commercial assay or kit | Biozym Blue Probe qPCR Kit Separate ROX | Biozym | Cat# 331456 S | |
| commercial assay or kit | FD Congo-Red Solution Kit | FD NeuroTechnologies, Inc. | Cat# PS108 | |
| commercial assay or kit | FD Rapid GolgiStain Kit | FD NeuroTechnologies, Inc. | Cat# PK401 | |
| commercial assay or kit | High-Capacity cDNA Reverse Transcription Kit | Thermo Fisher | Cat# 4368814 | |
| commercial assay or kit | Macherey-Nagel NucleoSpin RNA | Thermo Fisher | Product Code 15373604 | |
| commercial assay or kit | pegGOLD TriFast | Avantor | N/A | |
| commercial assay or kit | ProtoScript II First Strand cDNA Synthesis Kit | New England Biolabs Inc. | Cat# E6560 | |
| strain, strain background (Mus musculus) | B6;C3-Tg(APPswe,PSEN1dE9)85Dbo/Mmjax mice | The Jackson Laboratory | Cat# 005864 | |
| strain, strain background (Mus musculus) | C57BL/6 J OlaHsd mice | Harlan-Winkelmann or Janvier | Cat# 057 (H-W) | |
| strain, strain background (Mus musculus) | Human Interleukin-37 transgenic mice | Nold et al., 2010 | N/A | |
| software, algorithm | ANY-maze | Stoelting | RRID:SCR_014289 https://www.stoeltingco.com/ | |
| software, algorithm | FlowJo | FlowJo | https://www.flowjo.com/solutions/flowjo | |
| software, algorithm | ImageJ | Wane Rasband NIH, USA | N/A | |
| software, algorithm | IntraCell Version 1.5 | (C)2000 Institute for Neurobiology Magdeburg | N/A | |
| software, algorithm | Prism 8 | GraphPad | https://www.graphpad.com/scientific-software/prism/ | |
| software, algorithm | Video Mot 2 | TSE Systems | https://www.tse-systems.com | |
| software, algorithm | G*Power Version 3.1.9.4 | Heinrich Heine University Düsseldorf, Germany | http://www.psychologie.hhu.de/arbeitsgruppen/allgemeine-psychologie-und-arbeitspsychologie/gpower.html |
Table 1
Statistical table.
| Figure | Name | Test | Multi-comparison | |||
|---|---|---|---|---|---|---|
| 1B | 100 ng/ml 6 hr | One-way ANOVA | F(2,9)=2,428; p=0.1434 | Tukey’s | 0,8947 | WT vs. HET |
| 0,1460 | WT vs. HOM | |||||
| 100 ng/ml 24 hr | One-way ANOVA | F(2,11)=7,941; p=0.0073 | Tukey’s | 0,0539 | WT vs. HET | |
| 0,0067 | WT vs. HOM | |||||
| 1 µg/ml 6 hr | One-way ANOVA | F(2,9)=12,74; p=0.0024 | Tukey’s | 0,0090 | WT vs. HET | |
| 0,0037 | WT vs. HOM | |||||
| 1 µg/ml 24 hr | One-way ANOVA | F(2,11)=3,915; p=0.0520 | Tukey’s | 0,3586 | WT vs. HET | |
| 0,0426 | WT vs. HOM | |||||
| 1C | IL-6 10 ng/ml | ttest | t=1,742 df = 16; p=0.1007 | WT vs. IL37tg | ||
| IL-6 100 ng/ml | ttest | t=3,597 df = 16; p=0.0024 | WT vs. IL37tg | |||
| IL-6 1 µg/ml | ttest | t=5,127 df = 16; p=0.0001 | WT vs. IL37tg | |||
| 1D | TNF-α 10 ng/ml | ttest | t=3,376 df = 16; p=0.0038 | WT vs. IL37tg | ||
| TNF-α 100 ng/ml | ttest | t=6,774 df = 16; p<0.0001 | WT vs. IL37tg | |||
| TNF-α 1 µg/ml | ttest | t=6,264 df = 16; p<0.0001 | WT vs. IL37tg | |||
| 1E | IL-1β 10 ng/ml | ttest | t=2,390 df = 16; p=0.0295 | WT vs. IL37tg | ||
| IL-1β 100 ng/ml | ttest | t=5,027 df = 16; p=0.0001 | WT vs. IL37tg | |||
| IL-1β 1 µg/ml | ttest | t=5,852 df = 16; p<0.0001 | WT vs. IL37tg | |||
| 1F | IL-37 mRNA | One-way ANOVA | F(7,15)=2,629; p=0.0550 | Fisher’s LSD | 0.0171 | 0 hr vs. 1 hr |
| 0.0086 | 0 hr vs. 4 hr | |||||
| 0.0238 | 0 hr vs. 24 hr | |||||
| 1G | IL-6 | ttest | t=20,39 df = 4; p<0.0001 | WT vs. IL37tg | ||
| 1H | rIL-37 100 ng/ml | One-way ANOVA | F(2,30)=5,135; p=0.0121 | Tukey’s | 0.1675 | WT vs. 100 ng |
| 0.0133 | WT vs. 500 ng | |||||
| rIL-37 1 µg/ml | One-way ANOVA | F(2,30)=3,512; p=0.0426 | Tukey’s | 0.2457 | WT vs. 100 ng | |
| 0.0498 | WT vs. 500 ng | |||||
| 2B | Itaconate Treatment | Two-way ANOVA | F(1,20)=174,9; p<0.0001 | Bonferroni’s | <0.0001 | WT NIL vs. LPS |
| <0.0001 | IL37 NIL vs. LPS | |||||
| Itaconate Genotype | Two-way ANOVA | F(1,20)=27,55; p<0.0001 | Bonferroni’s | >0.9999 | NIL WT vs. IL37 | |
| <0.0001 | LPS WT vs. IL37 | |||||
| 2C | Succinate Treatment | Two-way ANOVA | F(1,20)=98,40; p<0.0001 | Bonferroni’s | <0.0001 | WT NIL vs. LPS |
| 0.0005 | IL37 NIL vs. LPS | |||||
| Succinate Genotype | Two-way ANOVA | F(1,20)=17,01; p=0.0005 | Bonferroni’s | >0.9999 | NIL WT vs. IL37 | |
| <0.0001 | LPS WT vs. IL37 | |||||
| 3B | Body weight Treatment | Two-way ANOVA | F(1,17)=220,5; p<0.0001 | Bonferroni’s | <0.0001 | WT NIL vs. LPS |
| <0.0001 | IL37 NIL vs. LPS | |||||
| Body weight Genotype | Two-way ANOVA | F(1,41)=1,486; p=0.2299 | Bonferroni’s | >0.9999 | NIL WT vs. IL37 | |
| 0.0139 | LPS WT vs. IL37 | |||||
| 3D | CD68 Treatment | Two-way ANOVA | F(1,6)=19,52; p=0.0045 | Bonferroni’s | 0.0017 | WT NIL vs. LPS |
| >0.9999 | IL37 NIL vs. LPS | |||||
| CD68 Genotype | Two-way ANOVA | F(1,6)=48,42; p=0.0004 | Bonferroni’s | 0.0167 | NIL WT vs. IL37 | |
| <0.0001 | LPS WT vs. IL37 | |||||
| 3E | IL-1β Treatment | Two-way ANOVA | F(1,7)=9,399;p=0.0182 | Bonferroni’s | 0.0244 | WT NIL vs. LPS |
| 0.7541 | IL37 NIL vs. LPS | |||||
| IL-1β Genotype | Two-way ANOVA | F(1,7)=3,182;p=0.0935 | Bonferroni’s | >0.9999 | NIL WT vs. IL37 | |
| 0.0366 | LPS WT vs. IL37 | |||||
| 3F | Iba1 CA1 Treatment | Two-way ANOVA | F(1,25)=5,222;p=0.0311 | Bonferroni’s | 0.0024 | WT NIL vs. LPS |
| >0.9999 | IL37 NIL vs. LPS | |||||
| Iba1 CA1 Genotype | Two-way ANOVA | F(1,34)=4,951;p=0.0328 | Bonferroni’s | >0.9999 | NIL WT vs. IL37 | |
| 0.0027 | LPS WT vs. IL37 | |||||
| 3G | Processes CA1 Treatment | Two-way ANOVA | F(1,46)=1,066; p=0.3073 | Bonferroni’s | >0.9999 | WT NIL vs. LPS |
| 0.6229 | IL37 NIL vs. LPS | |||||
| Processes CA1 Genotype | Two-way ANOVA | F(1,58)=1,238; p=0.2704 | Bonferroni’s | 0.5670 | NIL WT vs. IL37 | |
| >0.9999 | LPS WT vs. IL37 | |||||
| 3H | Iba1 Cortex Treatment | Two-way ANOVA | F(1,25)=15,97; p=0.0005 | Bonferroni’s | 0.0002 | WT NIL vs. LPS |
| 0.3234 | IL37 NIL vs. LPS | |||||
| Iba1 Cortex Genotype | Two-way ANOVA | F(1,34)=5,159; p=0.0296 | Bonferroni’s | >0.9999 | NIL WT vs. IL37 | |
| 0.0054 | LPS WT vs. IL37 | |||||
| 3I | Processes Cortex Treatment | Two-way ANOVA | F(1,104)=9,865; p=0.0022 | Bonferroni’s | 0.1401 | WT NIL vs. LPS |
| 0.0232 | IL37 NIL vs. LPS | |||||
| Processes Cortex Genotype | Two-way ANOVA | F(1,104)=0,119; p=0.7308 | Bonferroni’s | >0.9999 | NIL WT vs. IL37 | |
| 0.8147 | LPS WT vs. IL37 | |||||
| 4A | LTP WT | Two-way ANOVA | F(1,28)=4,459; p=0.0438 | Fisher’s LSD Time point 43–80 | <0.05 | WT NIL vs. LPS |
| 4B | LTP IL37 | Two-way ANOVA | F(1,23)=0,085; p=0.7734 | IL37 NIL vs. LPS | ||
| 4C | LTP last 5 min Treatment | Two-way ANOVA | F(1,22)=7,887;p=0.0102 | Bonferroni’s | 0.0043 | WT NIL vs. LPS |
| >0.9999 | IL37 NIL vs. LPS | |||||
| LTP last 5 min Genotype | Two-way ANOVA | F(1,29)=1,552; p=0.2228 | ||||
| 4D | Spines CA1 Treatment | Two-way ANOVA | F(1,32)=22,81; p<0.0001 | Bonferroni’s | <0.0001 | WT NIL vs. LPS |
| 0.1145 | IL37 NIL vs. LPS | |||||
| Spines CA1 Genotype | Two-way ANOVA | F(1,44)=26,68; p<0.0001 | Bonferroni’s | 0.0657 | NIL WT vs. IL37 | |
| <0.0001 | LPS WT vs. IL37 | |||||
| 4E | Spines DG Treatment | Two-way ANOVA | F(1,26)=3,307; p=0.0805 | Bonferroni’s | 0.0062 | WT NIL vs. LPS |
| >0.9999 | IL37 NIL vs. LPS | |||||
| Spines DG Genotype | Two-way ANOVA | F(1,36)=0,529; p=0.4718 | Bonferroni’s | 0.5222 | NIL WT vs. IL37 | |
| 0.0295 | LPS WT vs. IL37 | |||||
| 4G | LTP WT | Two-way ANOVA | F(1,30)=4,925; p=0.0342 | Fisher’s LSD Time point 39–80 | <0.05 | WT NIL vs. LPS |
| 4H | LTP IL37 | Two-way ANOVA | F(1,26)=0,01395; p=0.9069 | IL37 NIL vs. LPS | ||
| 4I | LTP last 5 min Treatment | Two-way ANOVA | F(1,27)=4,613; p=0.0409 | Bonferroni’s | 0.0285 | WT NIL vs. LPS |
| >0.9999 | IL37 NIL vs. LPS | |||||
| LTP last 5 min Genotype | Two-way ANOVA | F(1,29)=1,747; p=0.1966 | ||||
| 5A | Y-Maze Treatment | Two-way ANOVA | F(1,6)=18,25; p=0.0052 | Bonferroni’s | 0.0046 | WT NIL vs. IL1 |
| 0.7313 | IL37 NIL vs. IL1 | |||||
| Y-Maze pre-treatment | Two-way ANOVA | F(1,6)=9,899; p=0.0199 | Bonferroni’s | >0.9999 | NIL WT vs. IL37 | |
| 0.0024 | IL1 WT vs. IL37 | |||||
| 5B | IL-6 Treatment | Two-way ANOVA | F(1,16)=264,6; p<0.0001 | Bonferroni’s | <0.0001 | WT NIL vs. IL1 |
| <0.0001 | IL37 NIL vs. IL1 | |||||
| IL-6 pre-treatment | Two-way ANOVA | F(1,16)=10,27; p=0.0055 | Bonferroni’s | 0.8327 | NIL WT vs. IL37 | |
| 0.0004 | IL1 WT vs. IL37 | |||||
| 5C | IL-1α Treatment | Two-way ANOVA | F(1,16)=132,0; p<0.0001 | Bonferroni’s | <0.0001 | WT NIL vs. IL1 |
| <0.0001 | IL37 NIL vs. IL1 | |||||
| IL-1α pre-treatment | Two-way ANOVA | F(1,16)=17,47; p=0.0007 | Bonferroni’s | >0.9999 | NIL WT vs. IL37 | |
| 0.0003 | IL1 WT vs. IL37 | |||||
| 6B | IL-1β | One-way ANOVA | F(2,19)=5,224; p=0.0156 | Fisher’s LSD | 0.0903 | WT vs. APP |
| 0.2480 | WT vs. APP-IL37 | |||||
| 0.0046 | APP vs. APP-IL37 | |||||
| 6C | IL-6 | One-way ANOVA | F(2,21)=3,600; p=0.0452 | Fisher’s LSD | 0.0220 | WT vs. APP |
| 0.5264 | WT vs. APP-IL37 | |||||
| 0.0466 | APP vs. APP-IL37 | |||||
| 6E | CD68 9–12 m | One-way ANOVA | F(2,11)=14,39; p=0.0008 | Bonferroni’s | 0.0008 | WT vs. APP |
| 0.0529 | WT vs. APP-IL37 | |||||
| 0.04494 | APP vs. APP-IL37 | |||||
| 6F | CD68 6 m | One-way ANOVA | F(2,12)=13,45; p=0.0009 | Bonferroni’s | 0.0007 | WT vs. APP |
| 0.0263 | WT vs. APP-IL37 | |||||
| 0.0985 | APP vs. APP-IL37 | |||||
| 6G | CD68 20–23 m | One-way ANOVA | F(2,12)=13,38; p=0.0009 | Bonferroni’s | 0.0007 | WT vs. APP |
| 0.0359 | WT vs. APP-IL37 | |||||
| 0.0383 | APP vs. APP-IL37 | |||||
| 6I | Plaque load Hp | ttest | t=2,403 df = 74; p=0.0187 | APP vs. APP-IL37 | ||
| Plaque load Cx | ttest | t=4,953 df = 63; p<0.0001 | APP vs. APP-IL37 | |||
| 6J | Plaque size Hp | ttest | t=2,296 df = 74; p=0.0245 | APP vs. APP-IL37 | ||
| Plaque size Cx | ttest | t=5,949 df = 63; p<0.0001 | APP vs. APP-IL37 | |||
| 6G | Abeta uptake | One-way ANOVA | F(2,22)=136; p<0.0001 | Bonferroni’s | 0.0001 | WT vs. APP |
| 0.0001 | WT vs. APP-IL37 | |||||
| 0.0026 | APP vs. APP-IL37 | |||||
| 7B | Latency WT | One-way ANOVA | F(7,88)=5,842; p<0.0001 | WT | ||
| Latency APP | One-way ANOVA | F(7,72)=3,477; p=0.0029 | APP | |||
| Latency APP-IL37 | One-way ANOVA | F(7,80)=4,445; p=0.0003 | APP-IL37 | |||
| Latency | 2-way ANOVA | F(2,30)=10,50; p=0.0003 | Fisher’s LSD Day 1 | <0.05 | WT vs. APP | |
| Day 3–6 | <0.01 | |||||
| 7C | PT WT | ttest | t=11,45 df = 22; p<0,0001 | NT vs. TQ | ||
| PT APP | ttest | t=0,9874 df = 18; p=0.3365 | NT vs. TQ | |||
| PT APP-IL37 | ttest | t=3,705 df = 20; p=0.0014 | NT vs. TQ | |||
| PT TQs | One-way ANOVA | F(2,30)=8,415; p=0.0013 | Turkey‘s | 0.0009 | WT vs. APP | |
| 0,0505 | WT vs. APP-IL37 | |||||
| 7E | LTP | Two-way ANOVA | F(2,45)=9,286; p=0.0004 | Fisher’s LSD Time point 21–80 | <0.0005 | WT vs. APP |
| Fisher’s LSD Time point 41–80 | <0.05 | WT vs. APP-IL37 | ||||
| 7F | Mean LTP 20–25 min | One-way ANOVA | F(2,45)=7,090; p=0.0021 | Turkey‘s | 0.0016 | WT vs. APP |
| 0.5444 | WT vs. APP-IL37 | |||||
| 7G | Mean LTP 75–80 min | One-way ANOVA | F(2,45)=9,354; p=0.0004 | Turkey‘s | 0.0014 | WT vs. APP |
| 0.0023 | WT vs. APP-IL37 | |||||
| 7I | Spine density | One-way ANOVA | F(2,63)=6.318;p=0.0032 | Turkey‘s | 0.0026 | WT vs. APP |
| 0.0536 | WT vs. APP-IL37 |
Additional files
Download links
A two-part list of links to download the article, or parts of the article, in various formats.
Downloads (link to download the article as PDF)
Open citations (links to open the citations from this article in various online reference manager services)
Cite this article (links to download the citations from this article in formats compatible with various reference manager tools)
IL-37 expression reduces acute and chronic neuroinflammation and rescues cognitive impairment in an Alzheimer’s disease mouse model
eLife 11:e75889.
https://doi.org/10.7554/eLife.75889


