Vicia faba SV channel VfTPC1 is a hyperexcitable variant of plant vacuole Two Pore Channels
- Julius-Maximilians-Universität (JMU), Biocenter, Department of Molecular Plant Physiology and Biophysics, Germany
- School of Life Sciences, Zhengzhou University, China
- Universidad de Talca, Faculty of Engineering, Center of Bioinformatics, Simulation and Modeling, Chile
- University of California San Francisco, Department of Biochemistry and Biophysics, United States
- Julius-Maximilians-Universität (JMU), Biocenter, Theodor-Boveri-Institute, Department of Biotechnology and Biophysics, Germany
- Ludwig Maximilians-Universität, Faculty of Medicine, Walther Straub Institute of Pharmacology and Toxicology, Germany
- Department of Cell Biology and Molecular Genetics, University of Maryland, United States
Abstract
To fire action-potential-like electrical signals, the vacuole membrane requires the two-pore channel TPC1, formerly called SV channel. The TPC1/SV channel functions as a depolarization-stimulated, non-selective cation channel that is inhibited by luminal Ca2+. In our search for species-dependent functional TPC1 channel variants with different luminal Ca2+ sensitivity, we found in total three acidic residues present in Ca2+ sensor sites 2 and 3 of the Ca2+-sensitive AtTPC1 channel from Arabidopsis thaliana that were neutral in its Vicia faba ortholog and also in those of many other Fabaceae. When expressed in the Arabidopsis AtTPC1-loss-of-function background, wild-type VfTPC1 was hypersensitive to vacuole depolarization and only weakly sensitive to blocking luminal Ca2+. When AtTPC1 was mutated for these VfTPC1-homologous polymorphic residues, two neutral substitutions in Ca2+ sensor site 3 alone were already sufficient for the Arabidopsis At-VfTPC1 channel mutant to gain VfTPC1-like voltage and luminal Ca2+ sensitivity that together rendered vacuoles hyperexcitable. Thus, natural TPC1 channel variants exist in plant families which may fine-tune vacuole excitability and adapt it to environmental settings of the particular ecological niche.
Editor's evaluation
Plant intracellular ion channels are poorly understood. In this manuscript, patch-clamp is used to define functional differences between two cation channels present in the vacuole. The authors present valuable findings that indicated a calcium-biding site is responsible for increased excitability in the vacuole of the faba bean plant. The experimental evidence presented is convincing and findings have practical implications for the subfield of plant electrophysiology.
https://doi.org/10.7554/eLife.86384.sa0Introduction
Soon after the patch-clamp technique was first applied to plant cells (for review see Hedrich and Marten, 2011; Schroeder and Hedrich, 1989), the slow vacuolar (SV) channel was identified as a calcium-regulated, voltage-dependent cation channel (Allen and Sanders, 1996; Amodeo et al., 1994; Bethke and Jones, 1994; Colombo et al., 1988; Hedrich and Neher, 1987; Pottosin et al., 2001; Ward and Schroeder, 1994, for review see Pottosin and Dobrovinskaya, 2022; Ward, 2022). The SV channel is similarly permeable for Na+ and K+, and in principle also to Ca2+. However, the physiological relevance of a potential Ca2+ permeability in planta is highly controversial (for review see Hedrich et al., 2018; Pottosin and Dobrovinskaya, 2022), a view further supported – among other studies – by recent molecular dynamics (MD) simulations (Navarro-Retamal et al., 2021). About two decades after the discovery of SV channels, Peiter et al., 2005 revealed that the Arabidopsis thaliana SV channel is encoded by the single copy gene TPC1. Since then, the AtTPC1 channel has become a model for understanding the physiological role and function of SV/TPC1 channels in higher plants. Studies on AtTPC1 mutant plants suggest that TPC1 is not responsible for global Ca2+ responses but contributes to long-distance electrical and Ca2+ signaling under salt stress conditions and is an essential player in vacuole excitability (Bellandi et al., 2022; Choi et al., 2014; Evans et al., 2016; Jaślan et al., 2019; Ranf et al., 2008, for review see Hedrich et al., 2018; Pottosin and Dobrovinskaya, 2022).
Within the tree of live, there are TPC1-like sequences in animals and plants (see for review Jaślan et al., 2020; Kintzer and Stroud, 2018). During land plant evolution characteristic structural fingerprints of TPC1-type channels remained unchanged from mosses to flowering plants (Dadacz-Narloch et al., 2011; Dreyer et al., 2021; Hedrich et al., 1988). Recently, both the crystal and cryoEM structure of the Arabidopsis AtTPC1 channel and thus the molecular topology of this vacuolar cation channel became available (Dickinson et al., 2022; Guo et al., 2016; Kintzer and Stroud, 2016; Ye et al., 2021). AtTPC1 is formed by a dimer whose monomers consist of two tandem Shaker-like cassettes, each with six transmembrane domains (TM1–6), connected by a cytoplasmic loop with two EF hands. Calcium binding to the EF hands is necessary for SV/TPC1 channel activation at elevated cytosolic Ca2+ levels (Guo et al., 2016; Schulze et al., 2011; Ye et al., 2021). Structural 3D motif comparison and point mutation analysis identified the major voltage-sensing domain (VSD) required for depolarization-dependent activation in each monomer in the first four transmembrane segments of the second Shaker-like cassette (Guo et al., 2016; Jaślan et al., 2016). CryoEM structures further suggested that activation of VSD2 is required for Ca2+ activation of the EF hand domain (Ye et al., 2021). In contrast, channel activation is strongly suppressed when the Ca2+ level in the vacuolar lumen reaches 1 mM and more (Guo et al., 2016; Jaślan et al., 2019). Luminal Ca2+ can bind to three non-canonical calcium-binding sites each formed by three acidic residues in AtTPC1 (site 1: D240, D454, and E528; site 2: E239, D240, and E457; site 3: E605, D606, and D607; Dickinson et al., 2022; Guo et al., 2016; Kintzer and Stroud, 2016). Site 1/2 residues are located in luminal linker regions between transmembrane domains while site 3 residues are found in the luminal pore entrance. Among them, sites 1 and 3 play key roles in voltage gating and luminal Ca2+ inhibition.
Screening a chemically induced Arabidopsis mutant collection for individuals producing elevated amounts of the wound hormone jasmonate (JA) identified the TPC1 mutant fou2 (fatty acid oxygenation upregulated 2) (Bonaventure et al., 2007a). Interestingly, the fou2 channel behaves like a hyperactive TPC1 channel (Beyhl et al., 2009; Bonaventure et al., 2007a) and opens already close to the vacuole resting voltage which is around –30 mV (Wang et al., 2015). In contrast, wild-type AtTPC1 becomes active only upon depolarization. The hypersensitivity of the fou2 TPC1 channel toward voltage confers hyperexcitability to the vacuole and results from a mutation of the negatively charged glutamate at position 454 to the uncharged asparagine (D454N) (Bonaventure et al., 2007a; Jaślan et al., 2019). This TPC1 site is directed toward the vacuole lumen and is part of the non-canonical Ca2+ sensor site 1 (Dadacz-Narloch et al., 2011; Guo et al., 2016; Kintzer and Stroud, 2016). Therefore, the block of channel activity by elevated luminal Ca2+ levels, typical for wild-type TPC1, is greatly attenuated in the fou2 mutant (Lenglet et al., 2017). Consequently, fou2 vacuoles must experience episodes in which the membrane potential is short circuited. As a result, fou2 plants appear wounded and produce large amounts of jasmonate (Bonaventure et al., 2007a). Interestingly, strong membrane depolarizations triggered by current injection into healthy Arabidopsis leaves strongly activated the JA pathway, suggesting a link between vacuolar membrane potential and activation of JA synthesis (Mousavi et al., 2013). However, this link between TPC1-dependent vacuolar excitability and changes to electrical signaling of the plasma membrane and JA production remains to be explored (for review see Pottosin and Dobrovinskaya, 2022). Functional studies in the context of the fou2 mutation site showed that additional luminal amino acids other than the central Ca2+-binding sites like D454 are involved in luminal Ca2+ sensing, for example the adjacent E457 from Ca2+ sensor site 2 (Dadacz-Narloch et al., 2011; Guo et al., 2016; Kintzer and Stroud, 2016). Neutralization of E457 desensitized AtTPC1 toward vacuolar Ca2+ but unlike the fou2 mutation did not additionally promote channel opening (Dadacz-Narloch et al., 2011).
The TPC1 channels from Vicia faba and A. thaliana are historically established prototypes of the SV channel. Nevertheless, only AtTPC1 but not VfTPC1 has been identified at the molecular level so far. To fil this gap, we cloned VfTPC1 and analyzed its electrical properties in the background of the AtTPC1-loss-of-function Arabidopsis mutant. Despite similarities of the fava bean channel with its Arabidopsis homolog, both TPC1s showed also astonishing differences in voltage- and luminal Ca2+-dependent properties. In search for the structural reasons for this divergence, we could pinpoint three polymorphic sites within two luminal Ca2+ coordinating regions. When these polymorphic sites were implemented into the Arabidopsis TPC1 channel, AtTPC1 was converted into a hyperactive SV/TPC1 channel desensitized to luminal Ca2+, mimicking the properties of VfTPC1 and the AtTPC1 mutant fou2. Natural polymorphic TPC1 channel variants, like VfTPC1, with differences in key properties might be employed by some plant species to better meet their needs in specific environmental situations.
Results
VfTPC1 is a native TPC1 channel variant with a low luminal Ca2+ sensitivity
In our search for natural TPC1 channel variants, we noticed that SV currents had been recorded from V. faba guard cell vacuoles even under unnatural high luminal Ca2+ loads (50 mM; Ward and Schroeder, 1994). Considering that hardly any AtTPC1/SV currents were recorded in A. thaliana mesophyll vacuoles even at a lower luminal Ca2+ level such as 10 mM (Lenglet et al., 2017), the TPC1 channel variants of V. faba and A. thaliana seem to differ in their Ca2+ sensitivity. In contrast to TPC1 from A. thaliana (Peiter et al., 2005), the VfTPC1 gene has not yet been identified. To gain insights into the molecular structure and function of VfTPC1, we isolated RNA from fava bean. Following RNA-seq and de novo transcriptome assembly, we identified a single VfTPC1 transcript, just as in A. thaliana (Peiter et al., 2005). After VfTPC1 was cloned and fused to an eYFP tag, mesophyll protoplasts isolated from the Arabidopsis TPC1-loss-of-function mutant attpc1-2 were transiently transformed with the fava bean TPC1 channel. Similar to TPC1 from Arabidopsis (Figure 1) and other plant species (Dadacz-Narloch et al., 2013), VfTPC1 was found to localize exclusively to the vacuole membrane as visualized by the fluorescent eYFP signal (Figure 1). In whole-vacuole patch-clamp experiments with such fluorescent mesophyll vacuoles, macroscopic outward-rectifying SV/TPC1-like currents were elicited upon depolarizing voltage pulses (Figure 2). However, compared to AtTPC1, VfTPC1 channels differed in kinetics, voltage dependence, and luminal calcium sensitivity (Figures 2—5).
Figure 1
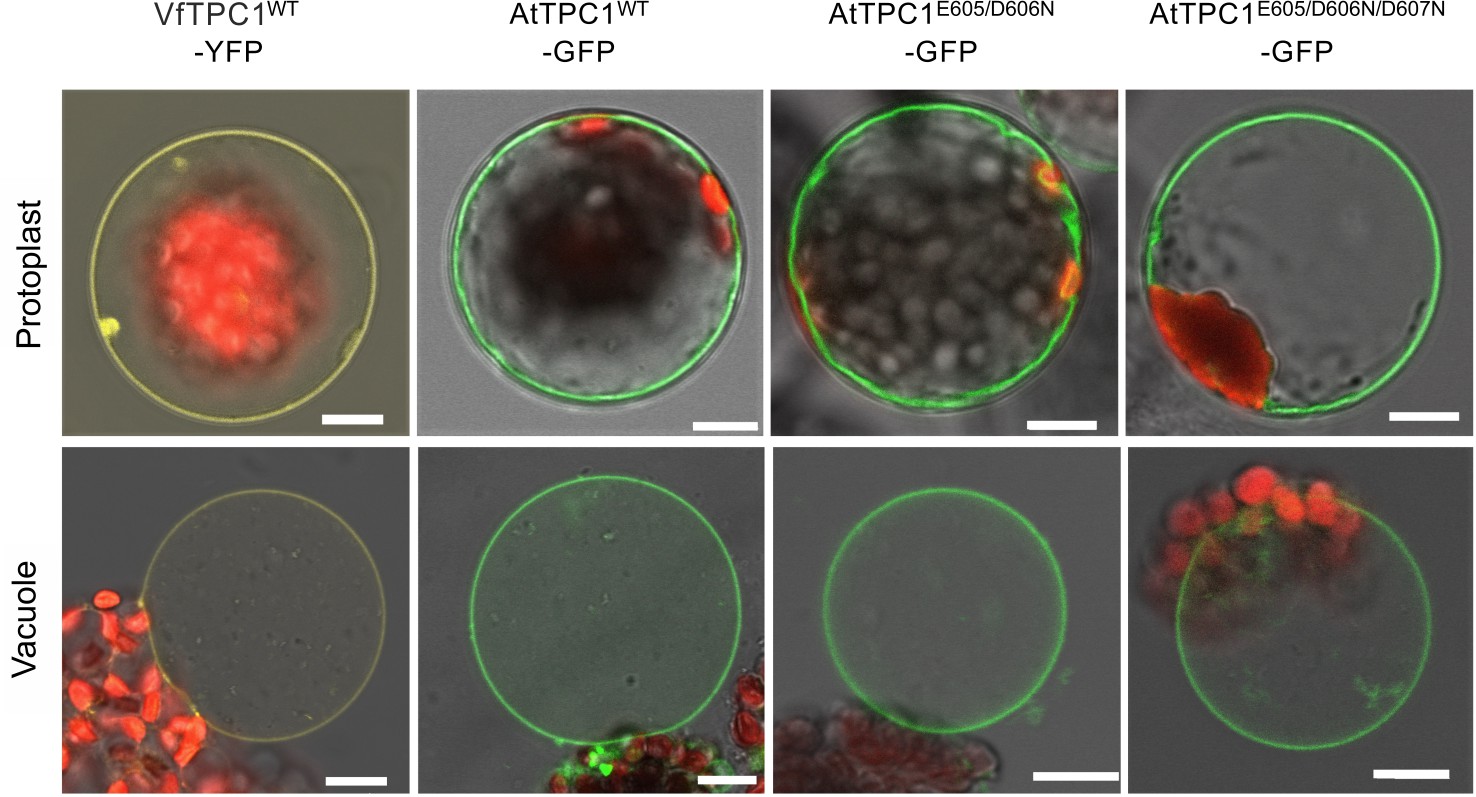
Vacuolar targeting of TPC1 channel variants.
Mesophyll protoplasts from the Arabidopsis thaliana mutant tpc1-2 after transient transformation with the respective GFP/YFP-tagged TPC1 channel construct and released vacuoles. Wild-type TPC1 constructs are indicated by WT. Bright field and fluorescent images were merged. Red fluorescence corresponds to chloroplast autofluorescence. The yellow and green fluorescence represent the YFP and GFP fluorescence, respectively. Scale bars = 10 µm.
Figure 2 with 1 supplement see all
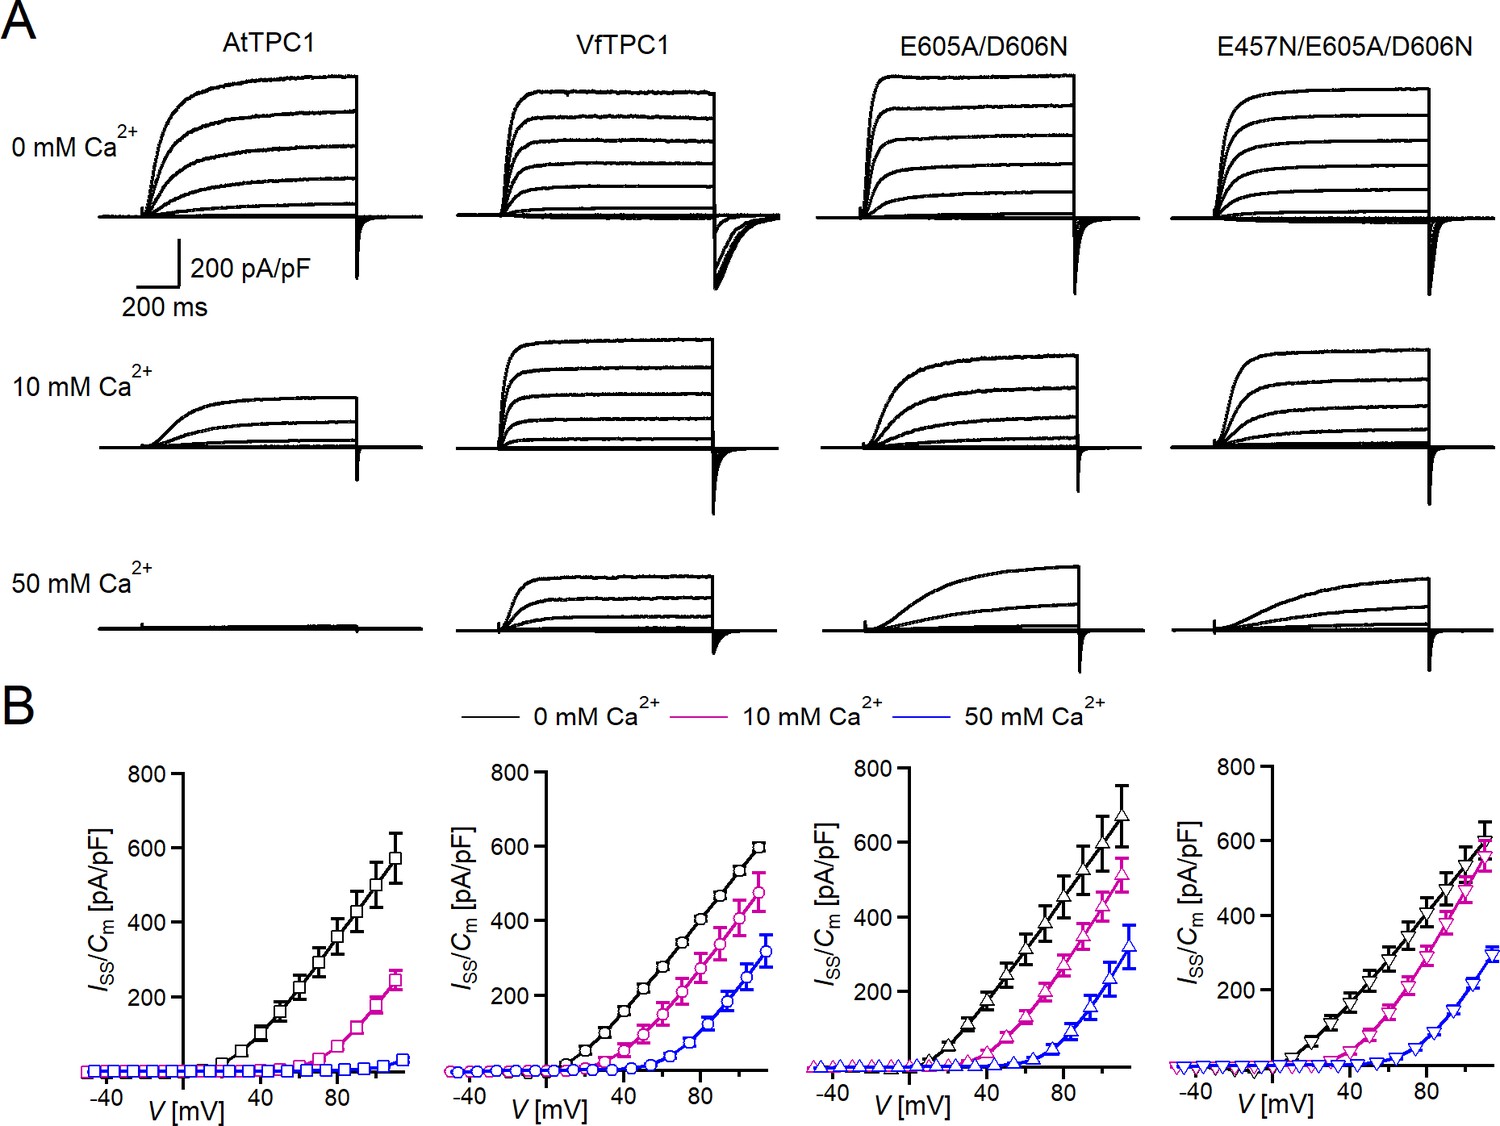
Effect of voltage and luminal Ca2+ on TPC1/SV currents of Vicia faba and Arabidopsis thaliana channel variants.
(A) Macroscopic TPC1/SV current recordings from mesophyll vacuoles liberated from A. thaliana protoplasts isolated from the TPC1-loss-of-function mutant attpc1-2 and transformed with different TPC1 channel types. E605A/D606N and E457N/E605A/D606N represent AtTPC1 channel mutants. AtTPC1 and VfTPC1 denote wild-type TPC1 channels from A. thaliana and V. faba, respectively. TPC1/SV currents elicited upon depolarizing voltages pulses in the range −80 to +110 mV in 20 mV increments at indicated luminal Ca2+ concentrations are shown. Before and after these voltage pulses, the membrane was clamped to the holding voltage of −60 mV. (B) Normalized TPC1/SV steady-state currents (Iss/Cm) derived from current recordings under different luminal Ca2+ conditions as those shown in (A) were plotted against the clamped membrane voltage (V). Symbols represent means ± SE. Squares = AtTPC1 wild type with n0/10Ca = 5, n50Ca = 4; circles = VfTPC1 wild type with n0Ca = 5, n10/50Ca = 6; upright triangles = AtTPC1-E605A/D606N with n0/10Ca = 5, n50Ca = 4; reversed triangles = AtTPC1-E457N/E605A/D606N with n0/10Ca = 5, n50Ca = 4. In (B), AtTPC1 wild-type data at 0 and 10 mM Ca2+ are identical to those shown in Dickinson et al., 2022; Creative Commons Attribution-Non Commercial-NoDerivatives License 4.0; CC BY-NC-ND. Experiments in (A, B) were performed under symmetric K+ conditions (150 mM) with 1 mM cytosolic Ca2+ and luminal Ca2+ at the indicated concentration. For further details on the voltage pulse protocol and solutions, see Materials and methods.
-
Figure 2—source data 1
Quantification of normalized steady-state current amplitudes of Arabidopsis thaliana TPC1 channel variants and Vicia faba TPC1 expressed in the Arabidopsis mutant attpc1-2.
- https://cdn.elifesciences.org/articles/86384/elife-86384-fig2-data1-v1.xlsx
Figure 3
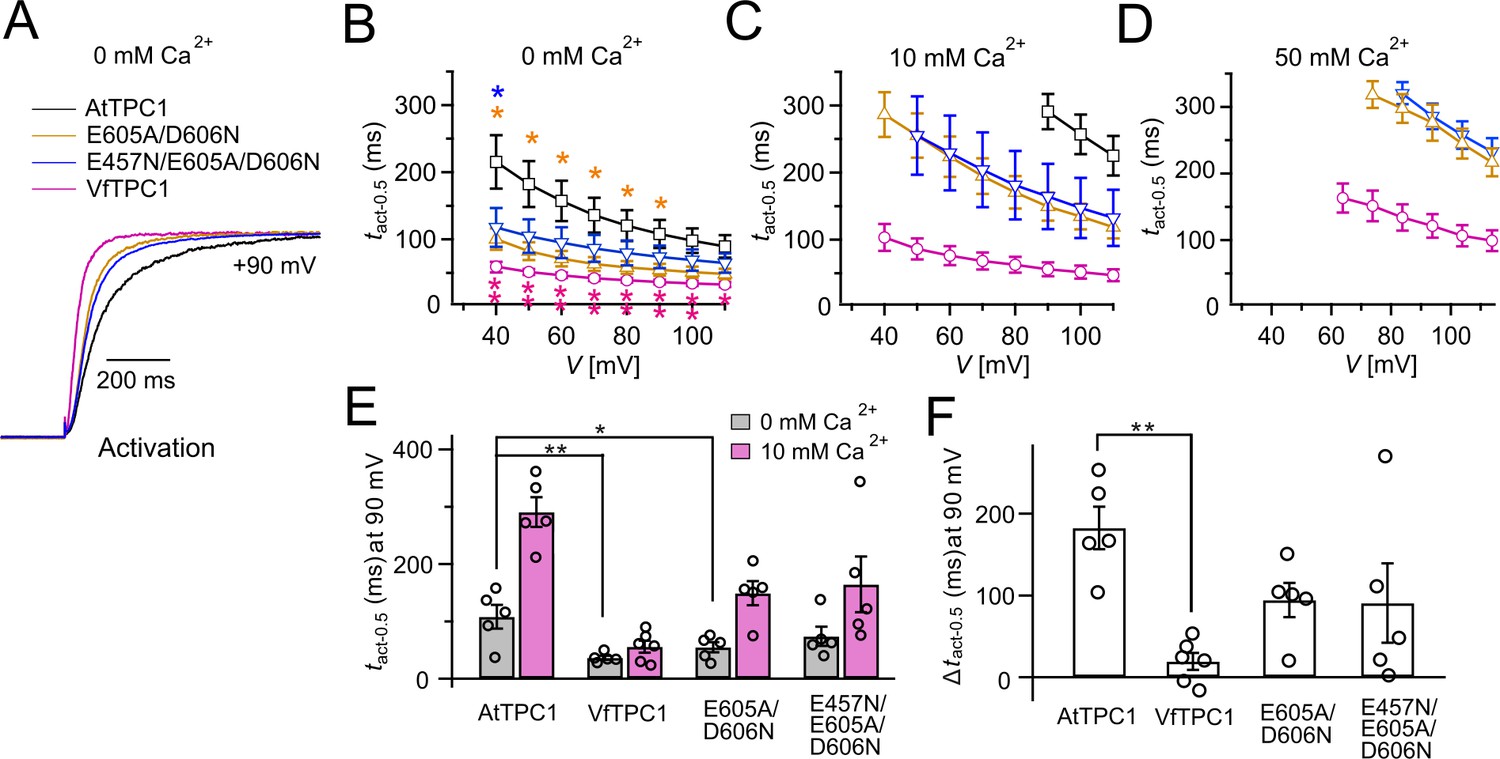
Half-activation times of TPC1 channel variants.
(A) Representative current relaxation induced upon a voltage pulse from the holding voltage of −60 to +90 mV at 0 mM luminal Ca2+. Normalized current responses of the vacuoles equipped with one of the indicated TPC1 channel variants were superimposed. (B–D) Half-activation times (tact-0.5) of the voltage-induced TPC1 currents at indicated luminal Ca2+ concentrations. In (B), stars denote that the tact-0.5 values of VfTPC1 (magenta), the ATPC1 double mutant E605A/D606N (yellow), and AtTPC1 triple mutant (blue) significantly differ from AtTPC1 wild type (one-way analysis of variance [ANOVA] together with a Dunnett’s post hoc comparison test; *p < 0.05; **p < 0.01). (E) Comparison of half-activation times determined at +90 mV for 0 and 10 mM luminal Ca2+. tact-0.5 values under 0 mM luminal Ca2+ were tested for significant differences with one-way ANOVA combined with a Dunnett’s post hoc comparison test (*p < 0.05; **p < 0.01). (F) The differences in the half-activation times from (E) between 0 and 10 luminal Ca2+ (one-way ANOVA together with a Dunnett’s post hoc comparison test; **p < 0.01). In (B–F) the number of experiments (n) was identical with Figure 2B, and data are represented as means ± SE. In (E, F), individual data points were additionally inserted as open black circles into the bar chart. Experiments in (A–F) were performed with vacuoles from attpc1-2 mesophyll protoplasts transiently transformed with the indicated TPC1 channel variants. Symmetric K+ conditions (150 mM) were used with 1 mM cytosolic Ca2+ and luminal Ca2+ at indicated concentration. For details on the voltage pulse protocol and solutions, see Materials and methods.
-
Figure 3—source data 1
Quantification of current activation kinetics of Arabidopsis thaliana TPC1 channel variants and Vicia faba TPC1 expressed in the Arabidopsis mutant attpc1-2.
- https://cdn.elifesciences.org/articles/86384/elife-86384-fig3-data1-v1.xlsx
Figure 4
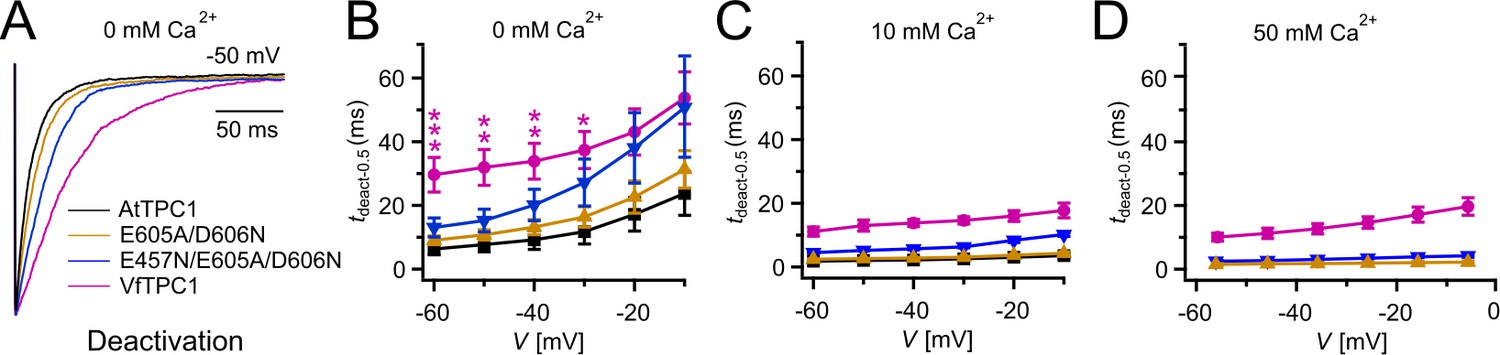
Half-deactivation times of TPC1 channel variants.
(A) Representative current relaxation induced upon a voltage pulse from +80 mV (VfTPC1) or +100 mV (AtTPC1 channel variants) to −50 mV at 0 mM luminal Ca2+. Normalized current responses of the vacuoles equipped with one of the indicated TPC1 channel variants were superimposed. (B–D) Half-deactivation times (tdeact-0.5) of the TPC1-mediated slow vacuolar (SV) currents at indicated luminal Ca2+ concentrations plotted against the respective membrane voltages. In (B), stars denote significant differences between VfTPC1 and AtTPC1 wild type (one-way analysis of variance [ANOVA] together with a Dunnett’s post hoc comparison test; *p < 0.05; **p < 0.01; ***p < 0.001). In (B–D), data represent means ± SE, and the number of experiments (n) was as follows: AtTPC1 wild type n0Ca = 5, n10Ca = 3; VfTPC1 wild type n0/10Ca = 4, n50Ca = 6; AtTPC1-E605A/D606N n0 /50Ca = 4, n10Ca = 5; AtTPC1-E457N/E605A/D606N n0/10Ca = 5, n50Ca = 4. Experiments in (A–D) were performed with vacuoles from attpc1-2 mesophyll protoplasts transiently transformed with the indicated TPC1 channel variants. Symmetric K+ conditions (150 mM) were used with 1 mM cytosolic Ca2+ and luminal Ca2+ at the indicated concentration. For details on the double-voltage pulse protocol and solutions, see Materials and methods.
-
Figure 4—source data 1
Quantification of current deactivation kinetics of Arabidopsis thaliana TPC1 channel variants and Vicia faba TPC1 expressed in the Arabidopsis mutant attpc1-2.
- https://cdn.elifesciences.org/articles/86384/elife-86384-fig4-data1-v1.xlsx
Figure 5
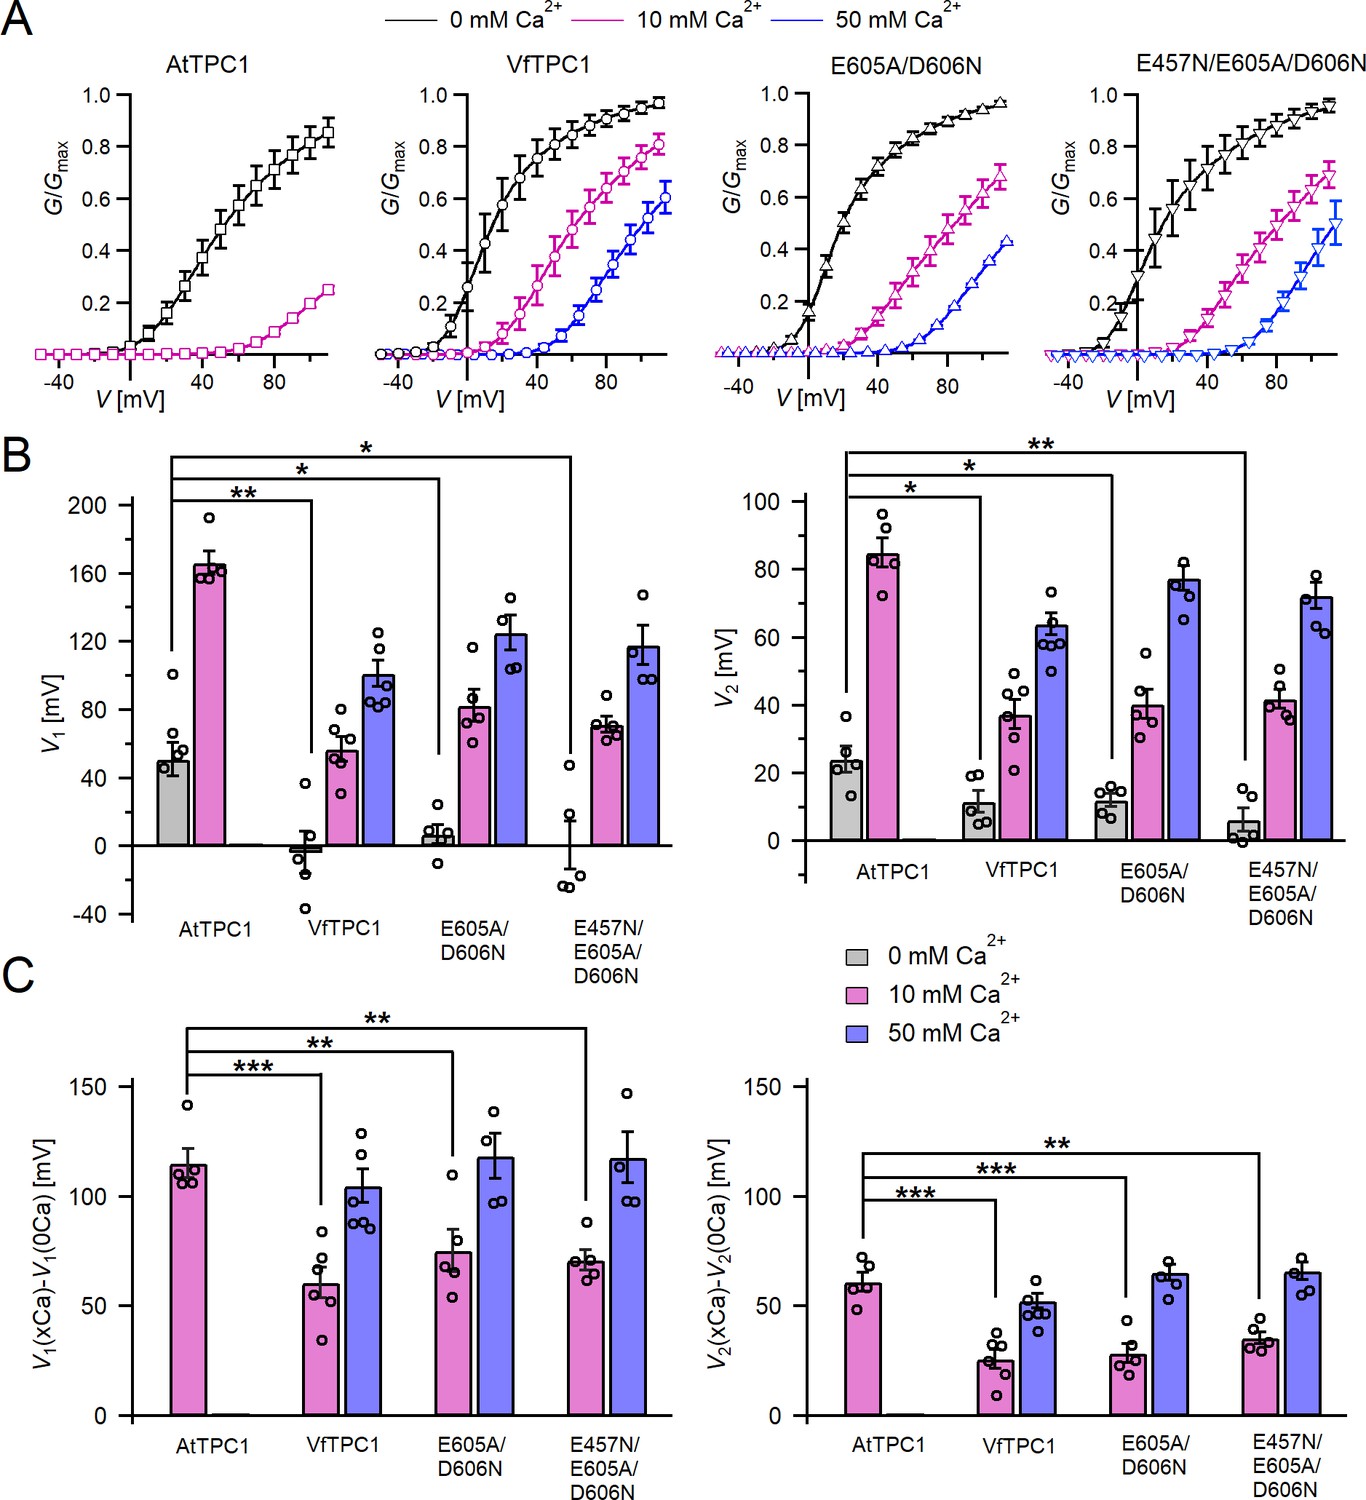
Channel activity of Vicia faba and Arabidopsis thaliana TPC1 channel variants in response to membrane voltage and luminal Ca2+.
(A) Conductance–voltage plots (G/Gmax(V)) determined for the different TPC1 channel variants as a measure for their relative open-channel probability under indicated luminal Ca2+ conditions. Best fits of the G/V plots to a double Boltzmann function are given by the solid lines. Squares = AtTPC1 wild type, circles = VfTPC1 wild type, upright triangles = AtTPC1-E605A/D606N, reversed triangles = AtTPC1-E457N/E605A/D606N. (B) The midpoint voltages V1 (left) and V2 (right) derived from the fits of the G/V plots shown in (A) are given for the different channel variants at the indicated Ca2+ condition. To test for significant differences between the V1/2 values under 0 mM luminal Ca2+, a statistical analysis was performed with one-way analysis of variance (ANOVA) combined with a Dunnett’s post hoc comparison test (*p <0 .05, **p < 0.01). (C) The differences in the midpoint voltages V1 (left) and V2 (right) shown in (B) between 0 and 10 and if available between 0 and 50 luminal Ca2+ are shown. The changes in V1/2 values related to a rise from 0 to at 10 Ca2+ were statistically analyzed with one-way ANOVA together with a Dunnett’s post hoc comparison test (**p < 0.01; ***p <0 .001). In (B) and (C), individual data points were inserted as open black circles into the bar chart. In (A–C), the number of experiments (n) was as follows: AtTPC1 wild type n0/10Ca = 5; VfTPC1 wild type with n0Ca = 5, n10/50Ca = 6; AtTPC1-E605A/D606N n0/10Ca = 5, n50Ca = 4; AtTPC1-E457N/E605A/D606N n0/10Ca = 5, n50Ca = 4. Data in (A–C) represent means ± SE. AtTPC1 wild-type data at 0 and 10 mM Ca2+ are identical to those shown in Dickinson et al., 2022 (Creative Commons Attribution-NonCommercial-NoDerivatives License 4.0; CC BY-NC-ND). Experiments in (A–C) were performed with vacuoles from attpc1-2 mesophyll protoplasts transiently transformed with the indicated TPC1 channel variants. Symmetric K+ conditions (150 mM) were used with 1 mM cytosolic Ca2+ and luminal Ca2+ at the indicated concentration. For details on the analysis of tail current recordings, the associated pulse protocol and solutions, see Materials and methods.
-
Figure 5—source data 1
Quantification of normalized conductance/voltage curves of Arabidopsis thaliana TPC1 channel variants and Vicia faba TPC1 expressed in the Arabidopsis mutant attpc1-2.
- https://cdn.elifesciences.org/articles/86384/elife-86384-fig5-data1-v1.xlsx
In the presence of physiological-like luminal Mg2+ (2 mM) (Shaul, 2002) but absence of luminal Ca2+, the current activation was faster and the current deactivation slower with VfTPC1 than with AtTPC1 (Figures 2A—4A, B). A closer look at the current–voltage curves further revealed that in addition to outward currents, inward currents were also triggered by voltages in the range of −40 and 0 mV, but only from vacuoles harboring VfTPC1 and not AtTPC1 (Figure 2—figure supplement 1). This points to a shift in the voltage activation threshold for VfTPC1 channel opening by about 30 mV to more negative voltages. For further quantification of this effect, the voltage-dependent relative open-channel probability curves (G/Gmax(V)) were determined for both TPC1 channel variants (Figure 5A). They were fitted with a double Boltzmann equation describing the voltage-dependent channel transitions between two closed and one open state (C2 C1 O) (Jaślan et al., 2016; Pottosin et al., 2004). From these fits the midpoint voltages V2 and V1 were derived (Figure 5B), showing in particular, a significant difference in midpoint voltage V1 of VfTPC1 (−3.5 ± 12.3 mV, n = 5) and AtTPC1 (51.2 ± 9.6 mV, n = 5). These results confirm that VfTPC1, unlike AtTPC1, activates near the vacuolar resting membrane voltage (Figure 5B).
When the luminal Ca2+ concentration was increased from 0 to 10 mM Ca2+, the activation kinetics of AtTPC1 was strongly slowed down (Figure 3B, C, E, F). However, this effect was much less pronounced for VfTPC1. At +90 mV, for example, the half-activation time increased by about 170% for AtTPC1, but only 53% for VfTPC1 (Figure 3A–C, E, F). Even more impressive was the fact that AtTPC1 currents were suppressed by about 50% at 10 mM luminal Ca2+ and completely vanished at 50 mM luminal Ca2+ (Figure 2), the concentration used in the very early work on SV currents from fava bean (Ward and Schroeder, 1994). In contrast, the VfTPC1 current densities at zero and 10 mM luminal Ca2+ were similar in magnitude, and at 50 mM Ca2+ the VfTPC1 current density still reached about 50% of the level measured under luminal Ca2+-free conditions. The strongly reduced susceptibility of VfTPC1 currents to inhibitory luminal Ca2+ ions was associated with a significantly reduced inhibitory effect on voltage activation (Figure 5). Compared to 0 mM Ca2+, at 10 mM Ca2+ the V1 and V2 values increased by about 115 and 61 mV for AtTPC1, but only by about 61 and 26 mV for VfTPC1, respectively (Figure 5B, C). A rise from 10 to 50 mM luminal Ca2+ caused a further positive-going shift of the VfTPC1 activation voltage curve (G/Gmax(V)), indicated by a 1.7- and 1.6-fold rise in V1 and V2, respectively (Figure 5B). AtTPC1 currents, however, were so small at 50 mM luminal Ca2+ (Figure 2) that activation voltage curves (G/Gmax(V)) could not be resolved reliably. Together these findings document that VfTPC1 is much less susceptible to inhibitory luminal Ca2+ than AtTPC1.
Fabaceae and Brassicaceae TPC1 channels are polymorphic in luminal Ca2+-sensing motifs
To gain insights into the functional domains of these Brassicaceae and Fabaceae TPC1 channel proteins underlying their different response to membrane voltage and luminal Ca2+, we aligned not only the AtTPC1 and VfTPC1 but also other TPC1-like amino acid sequences of these plant families. Focusing on charged residues at the three sites that are involved in luminal Ca2+ coordination and sensitivity in AtTPC1 (Figure 5; Dadacz-Narloch et al., 2011; Dickinson et al., 2022; Kintzer and Stroud, 2016), we found that these sites were highly conserved among the Brassicaceae TPC1s. Only two of the 12 TPC1 variants tested (BrTPC1 and LeTPC1) exhibit a neutralizing substitution at sites homologous to residue D606 at the luminal pore entrance of AtTPC1. In contrast, most TPC1 types of the Fabaceae species show one up to three non-conservative variations of the residues. Eleven of the 14 Fabaceae TPC1 channels harbor a non-charged asparagine or glutamine instead of the negatively charged glutamate at sites homologous to AtTPC1-E456 or -E457 (Figure 6). Remarkably, this E456Q/E457N polymorphism was additionally accompanied by the neutralization of one or two negatively charged residues at site 3 within the luminal pore entrance in all Fabaceae TPC1 channels, with the exception of Bauhinia tomentosa BtTPC1 (Figure 6). In this regard, the Fabaceae TPC1 channels group in two clusters, containing either one or two non-charged residues (Ala/Val, Asn) at the homologous sites to AtTPC1-E605 and -D606 (Figure 6—figure supplement 1). The fava bean TPC1 channel belongs to a triple-polymorphism subgroup, containing alanine and asparagine at sites homologous to the Ca2+ sensor sites 2 and 3 of AtTPC1 (Figure 6; AtTPC1-E457/E605/D606; VfTPC1-N458/A607/N608).
Figure 6 with 1 supplement see all
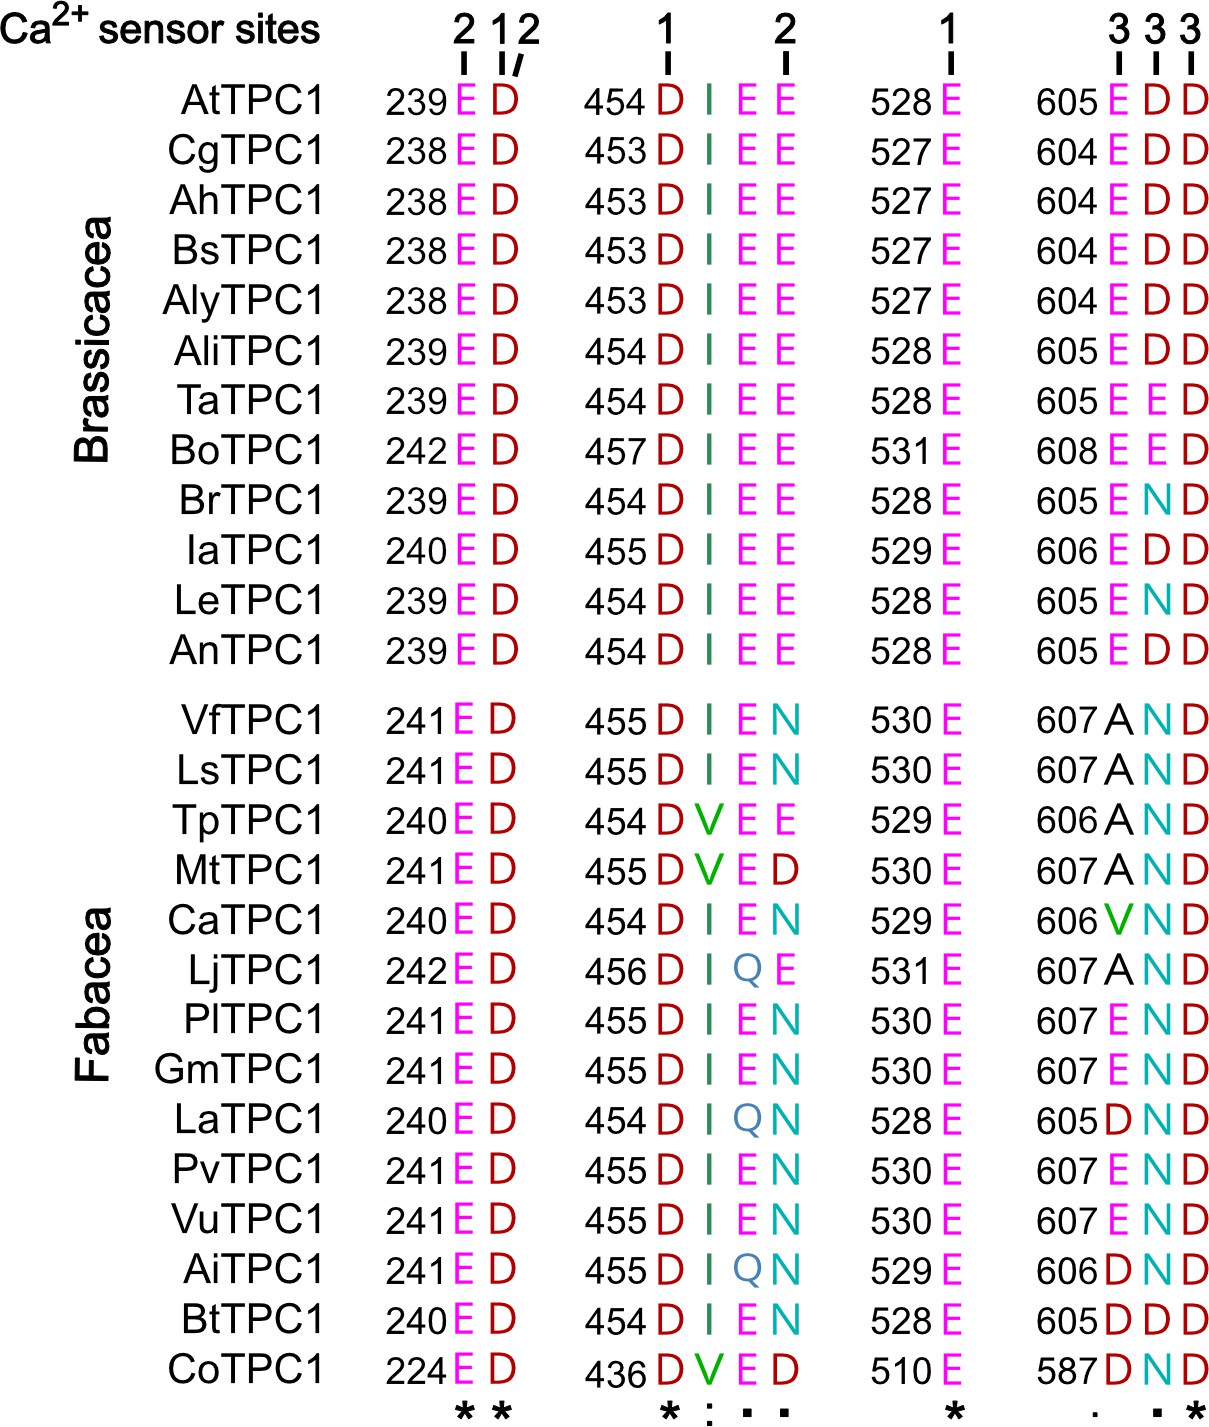
Polymorphism of functional TPC1 channel domains with a role in luminal Ca2+ coordination.
Sections of an amino acid sequence alignment of Brassicacea and Fabacea TPC1 channels in the region of the three Ca2+ sensor sites. The numbers above the residues of AtTPC1 indicate to which Ca2+ sensor site they contribute. A different color code was used for different amino acids. An asterisk marks 100% conserved residues across the sequences while a colon (:) indicates a conservative and a dot (.) denotes a non-conservative substitution. TPC1 sequences from following species were used: Arabidopsis thaliana (AtTPC1), Capsella grandiflora (CgTPC1), Arabidopsis halleri (AhTPC1), Boechera stricta (BsTPC1), Arabidopsis lyrata (AlyTPC1), Alyssum linifolium (AliTPC1), Thlaspi arvense (TaTPC1), Brassica oleracea (BoTPC1), Brassica rapa (BrTPC1), Iberis amara (IaTPC1), Lepidium sativum (LeTPC1), Arabis nemorensis (AnTPC1), Vicia faba (VfTPC1), Lathyrus sativus (LsTPC1), Trifolium pratense (TpTPC1), Medicago truncatula (MtTPC1), Cicer arietinum (CaTPC1), Lotus japonicus (LjTPC1), Phaseolus lunatus (PlTPC1), Glycine max (GmTPC1), Lupinus albus (LaTPC1), Phaseolus vulgaris (PvTPC1), Vigna unguiculata (VuTPC1), Arachis ipaensis (AiTPC1), Bauhinia tomentosa (BtTPC1), and Copaifera officianalis (CoTPC1). Amino acid sequences and their sources are listed in Figure 6—source data 1.
-
Figure 6—source data 1
Amino acid sequences of plant TPC1 channels and their accession numbers.
- https://cdn.elifesciences.org/articles/86384/elife-86384-fig6-data1-v1.xlsx
The polymorphic AtTPC1 double mutant E605A/D606N mimics the VfTPC1 channel features
To clarify whether these three polymorphic sites are responsible for the different gating behavior of the two TPC1 channel variants, a series of site-directed mutagenesis was initiated in both VfTPC1 and AtTPC1. This resulted in the triple VfTPC1 mutant N458E/A607E/N608D and the double, triple AtTPC1 mutants E605A/D606N and E457N/E605A/D606N, respectively. When transiently expressed in the background of the attpc1-2 mutant (Figure 1 and Figure 7A), all these channel mutants were localized in the vacuole membrane and gave rise to the typical SV/TPC1 channel currents (Figures 2A and 7B). When the two VfTPC1 channel variants were examined with respect to their voltage dependence and luminal Ca2+ sensitivity, no significant differences were found between VfTPC1 wild type and its triple mutant (Figure 7C–G). In contrast, the AtTPC1 mutants differed in some respects from AtTPC1 wild type. Compared to AtTPC1 wild type, the double but not the triple AtTPC1 mutant activated significantly faster under luminal Ca2+-free conditions (Figure 3). The lack of effect on activation of the AtTPC1 triple mutant is likely related to the attenuating influence of the mutated residue E457N, because Dadacz-Narloch et al., 2011 showed that the activation kinetics of the single AtTPC1 mutant E457N were slowed down. The deactivation of both, the double and triple AtTPC1 mutants, however, was not much affected and was more AtTPC1- than VfTPC1-like (Figure 4), suggesting that other functional domains than Ca2+ sensor site 3 determines the deactivation behavior of TPC1 channels. This view is also supported by the fact that deactivation of the PpTPC1a channel from the moss Physcomitrella patens was slower than that of AtTPC1, although all three luminal Ca2+ sensor sites 1–3 were functional (Figure 8) and resulted in AtTPC1-like luminal Ca2+ sensitivity and voltage dependence of PpTPC1a (Dadacz-Narloch et al., 2011). In addition, in the absence of luminal Ca2+, the current voltage curves (Iss/Cm(V)) and even more so the activation voltage curves (G/Gmax(V)) of the double and triple AtTPC1 mutants appeared shifted to more negative voltages by about 30 mV compared to wild-type AtTPC1 (Figures 2B and 5A, Figure 2—figure supplement 1). The changed voltage dependence of both AtTPC1 mutants was reflected in V1 and V2 values similar to VfTPC1 (Figure 5B). When the two AtTPC1 mutants faced 10 mM luminal Ca2+, again the current and activation voltage curves as well as the V1, V2 values resembled those of VfTPC1 (Figures 2B and 5). The fact that AtTPC1 channels carrying the VfTPC1 polymorphisms (i.e., double or triple residue substitutions) exhibit a low luminal Ca2+ susceptibility is best displayed by the channel behavior to 50 mM Ca2+. Under such high luminal Ca2+ loads, almost no SV/TPC1 currents were observed with wild-type AtTPC1 (Figure 2). The current and voltage activation curves (Iss/Cm(V), G/Gmax(V)) of the AtTPC1 mutants and VfTPC1, however, showed similar strong SV channel activity even at this extreme luminal Ca2+ level (Figures 2B and 5). Thus, the E605A/D606N exchange is already sufficient to provide AtTPC1 with the voltage and Ca2+ sensitivity of VfTPC1. The additional E457N replacement in the AtTPC1 E605A/D606N mutant background, however, did not further affect the transition from an Arabidopsis-like to a VfTPC1-like gating behavior, nor did it further reduce luminal Ca2+ sensitivity. Dadacz-Narloch et al., 2011 reported that neutral residues at site 457 (E → N/Q) in AtTPC1 made the channel significantly less sensitive to luminal Ca2+ but attenuated voltage-dependent activation compared to wild-type channels, as midpoint voltages (V1, V2) were shifted to more positive values. Thus, the hyperactivity of the native V. faba TPC1 channel is most likely related to the altered Ca2+ sensor site 3 rather than to Ca2+ sensor site 2. Considering further the similar luminal Ca2+ sensitivity of E605A/D606N and E457N/E605A/D606N (Figure 5C), the two Ca2+ sensor sites 2 and 3 with their residues E457 and E605/D606, respectively, do not have additive effects on channel gating.
Figure 7
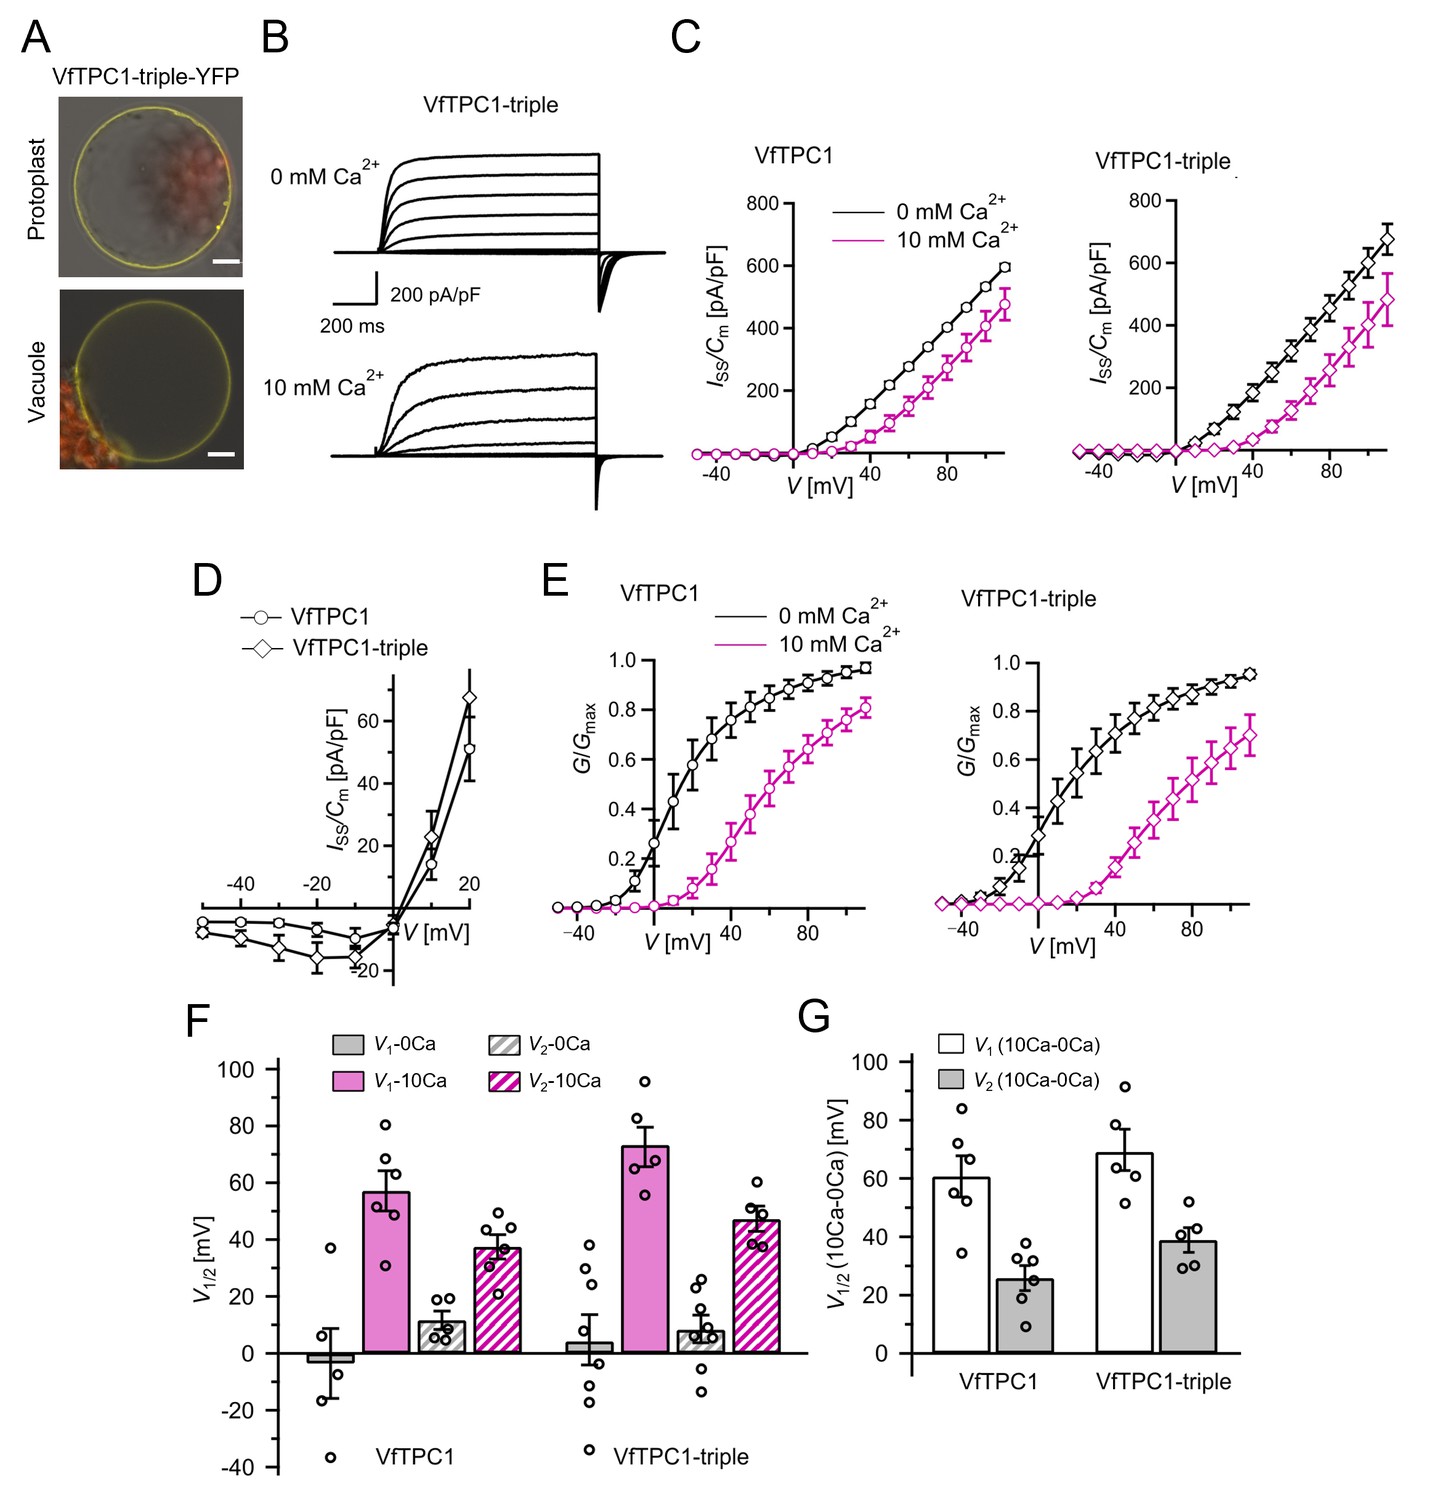
The voltage and luminal Ca2+ dependence of the VfTPC1 triple mutant N458E/A607E/N608D.
(A) Mesophyll vacuoles released from attpc1-2 mesophyll protoplasts after transient transformation with eYFP-tagged VfTPC1 triple mutant construct. Bright field and fluorescent images were merged. Red and yellow fluorescence corresponds to chloroplast autofluorescence and eYFP fluorescence, respectively. Scale bars = 10 µm. (B) Macroscopic TPC1 current recordings from attpc1-2 mesophyll vacuoles transformed with the VfTPC1 triple mutant. (C) Normalized steady-state currents (Iss/Cm(V)) determined for the indicated VfTPC1 channel variant and plotted against the clamped membrane voltages in the presence (10 mM) and absence of luminal Ca2+. (D) Enlarged section of the current–voltage curves (Iss/Cm(V)) for VfTPC1 channel variants shown in (C) at 0 mM luminal Ca2+. (E) Normalized conductance–voltage curves (G/Gmax(V)) of VfTPC1 channel variants in the presence and absence of luminal Ca2+. (F) Midpoint activation voltages V1/2 are given for the different channel variants at the indicated Ca2+ condition. VfTPC1 triple mutant with n0Ca = 8 and n10Ca = 5; VfTPC1 wild type with n0Ca = 5, n10Ca = 6. The data of VfTPC1 wild type in (C–G) are identical to those in Figures 2 and 5 and Figure 2—figure supplement 1 and were shown only for better direct comparison. Data points in (C–G) represent means ± SE. In (F) and (G), individual data points were inserted as open black circles into the bar chart. According to the statistical analysis (t-test), the V1/V2 values at 0 mM Ca2+ (F) and the Ca2+-induced shift in V1/V2 values (G) between VfTPC1 wild-type and the VfTPC1 triple mutant were not significantly different, as the p-values were > 0.05. For details of the statistical analysis, see . Source data for patch-clamp data of the VfTPC1 triple mutant are provided in while those of VfTPC1 wild type are found in Figure 2—source data 1 and Figure 5—source data 1.
-
Figure 7—source data 1
Quantification of normalized steady-state current/voltage curves and normalized conductance/voltage curves of Vicia faba TPC1 triple mutant expressed in the Arabidopsis mutant attpc1-2.
- https://cdn.elifesciences.org/articles/86384/elife-86384-fig7-data1-v1.xlsx
Figure 8
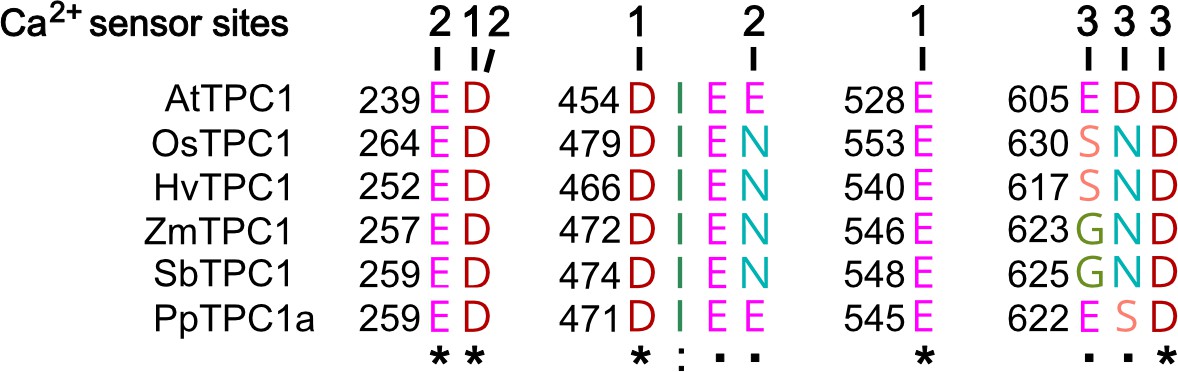
Amino acid sequence comparison of TPC1 channels from different species in the region of the three Ca2+ sensor sites.
The numbers above the residues of AtTPC1 indicate to which Ca2+ sensor site they contribute. A different color code was used for different amino acids. An asterisk marks 100% conserved residues across the sequences while a colon (:) indicates a conservative and a dot (.) denotes a non-conservative substitution. TPC1 sequences from following species were used: Arabidopsis thaliana (AtTPC1), Oryza sativa (OsTPC1), Hordeum vulgaris (HvTPC1), Zea mays (ZmTPC1), Sorghum bicolor (SbTPC1), and Physcomitrella patens (PpTPC1a). Amino acid sequences and their sources are listed in Figure 6—source data 1.
3D topology of VfTPC1 and AtTPC1 triple mutant mimics that of fou2
In an attempt to determine the structural basis for the functional differences between V. faba and A. thaliana TPC1, we aimed to determine the cryoEM structure of VfTPC1, expressed and purified by similar conditions to that of AtTPC1 (Dickinson et al., 2022). Surprisingly, the biochemical behavior of VfTPC1 was significantly different than that of AtTPC1 and we were unable to recover any usable material after purification. Hence, we constructed a homology model of VfTPC1 using our high-resolution cryoEM structure of Ca2+-bound AtTPC1-D454N (fou2) as a template (Figure 9, Supplementary file 1). From our previous structures of wild-type AtTPC1 and fou2 (Dickinson et al., 2022; Kintzer and Stroud, 2016), we determined that the luminal pore entrance operates an inhibitory Ca2+ sensor (site 3) that is coupled to the functional VSD2. In the wild-type and fou2 structures, the three luminal acidic residues (E605, D606, and D607) of site 3 line the conduction pathway upstream of the selectivity filter (Figure 9—figure supplement 1). In the wild-type crystal structure, E605 binds a divalent metal on the symmetry axis. In our high-resolution structure of fou2 (Dickinson et al., 2022), we showed that these residues rearrange to interact with the hydration shell around a bound metal in the selectivity filter and that D606 in fou2 moves to the position of E605 in the wild-type structure, suggesting that both acidic residues regulate channel function. In our homology model of VfTPC1, neutralization of the acidic residues A607 and N608 in the luminal pore entrance (equivalent to E605 and D606 in AtTPC1) clearly alters the electrostatics of the pore. These substitutions almost certainly prevent the pore entrance from binding the inhibitory Ca2+ observed in the wild-type structure (Figure 9A, Figure 9—figure supplement 1), and from interacting with the water network in the pore as seen in fou2 (Dickinson et al., 2022). Recent MD simulations with AtTPC1 (Navarro-Retamal et al., 2021) additionally indicated that the E605/D606 motif is structurally very flexible and adapts according to the direction of ion flow. This may suggest a valve-like regulatory mechanism: The efflux from the cytosol to the lumen stabilizes the position found in the hyperactive fou2 mutant, that is, the open channel. In contrast, influx from the lumen to the cytosol drives the E605/D606 loop toward the pore, fostering channel closing. The MD simulations further suggest a Ca2+-dependent interaction between the E605/D606 motif and a Ca2+ coordination site at the luminal entrance of the selectivity filter (D269/E637; in VfTPC1: D271/E639). Higher luminal Ca2+ increases the probability of Ca2+ to occupy the coordination site which stabilized the E605/D606 motif in the pore-facing conformation. Neutralizing E605A/D606N mutations would reduce electrostatic interactions and result in channels that open with less activation energy. This effect could explain how an altered Ca2+-binding site at the luminal pore entrance of VfTPC1 – compared with AtTPC1 – shifts the voltage activation threshold to more negative values. The difference in the voltage activation profile between AtTPC1 and VfTPC1 may have been further enhanced by a luminal Mg2+ effect on the intact luminal pore E605/D606 motif of AtTPC1 wild type. Like Ca2+, also luminal Mg2+ inhibits the AtTPC1 channel but with a much lower efficiency than Ca2+ (Dadacz-Narloch et al., 2011; Pottosin et al., 2004).
Figure 9 with 1 supplement see all
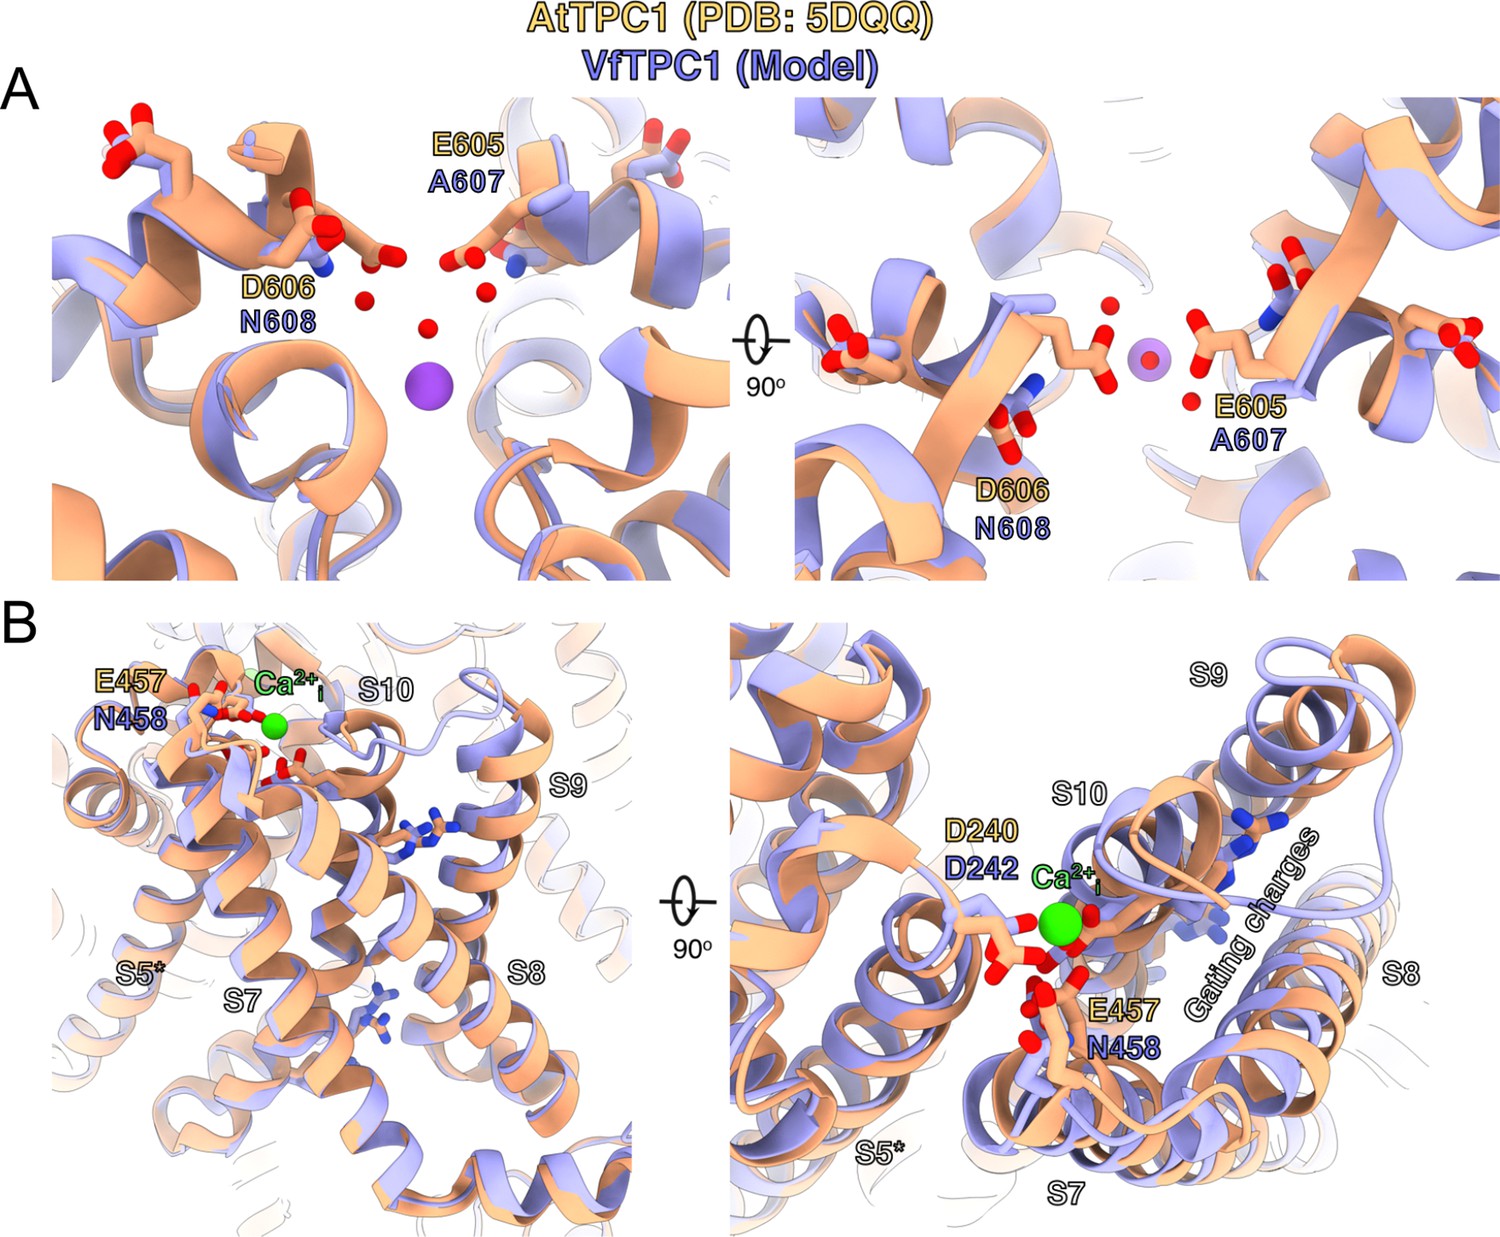
Structural comparison between wild-type AtTPC1 structure (beige color) and a VfTPC1 homology model (purple) depicts the functional consequences of sequence divergence.
(A) Left: side view from in the plane of the membrane of the Ca2+ site showing the external (luminal) pore entry at the top. Right: top view from the external (luminal) surface of the Ca2+ site (90° from the left-side image) showing positions of key pore mouth residues. The central purple spheres represent Na+ ions. Red spheres are waters, as observed in the cryoEM structure of fou2 (Dickinson et al., 2022). (B) Coordination of the luminal Ca2+-binding site (green sphere) on voltage-sensing domain (VSD2). Left: side view from the plane of the membrane of the voltage sensor domain, looking in toward the vertical axis of the pore. S8 helix is closest to the viewing direction. Right: top view from the external surface of the voltage sensor domain. The image is rotated 90° to obtain the top view from the left panel, and rotated in plane of the page such that S8 is on the right side. The gating charges on helix S10 are indicated by labeling. The model is provided by Supplementary file 1. An overview of the structure seen from the plane of the membrane is shown in Figure 9—figure supplement 1.
Mutation of AtTPC1 pore motif E605/D606 does neither affect SV channel permeability nor conductance
Since the pore residues E605 and D606 of AtTPC1 are located at the luminal pore entrance relatively close to the selectivity filter (Figure 9, Figure 9—figure supplement 1; Kintzer et al., 2018), we investigated their contribution to the TPC1 cation permeability (Na+, K+, Ca2+). The cation selectivity of AtTPC1 was first studied under bi-ionic conditions in the animal HEK cell expression system (Guo et al., 2017) that target TPC1 to the plasma membrane (Figure 10A; Guo et al., 2016). Therefore, for comparison and easy replacement of the bath medium at the luminal side of TPC1 channels, we also used TPC1-expressing HEK cells. To enable current recordings with AtTPC1 even under high external Ca2+ conditions (Figure 10E), the AtTPC1 channel mutant D240A/D454A/E528A (Guo et al., 2017) harboring a damaged luminal Ca2+ sensor site 1 in the presence of a wild-type pore region was used. The relative permeability ratio PK/Ca/PNa of AtTPC1 was not affected by disruption of Ca2+ sensor site 3 (E605A/D606A) or Ca2+ sensor site 1 (D240A/D454A/E528A) (Table 1, Figure 10, Figure 10—figure supplement 1), the latter being in well agreement with Guo et al., 2017. In comparison to the AtTPC1 channel variants, VfTPC1 was characterized by a similar relative cation permeability. Thus, the luminal pore motif E605/D606 does not participate in control of the TPC1 channel selectivity.
Figure 10 with 1 supplement see all
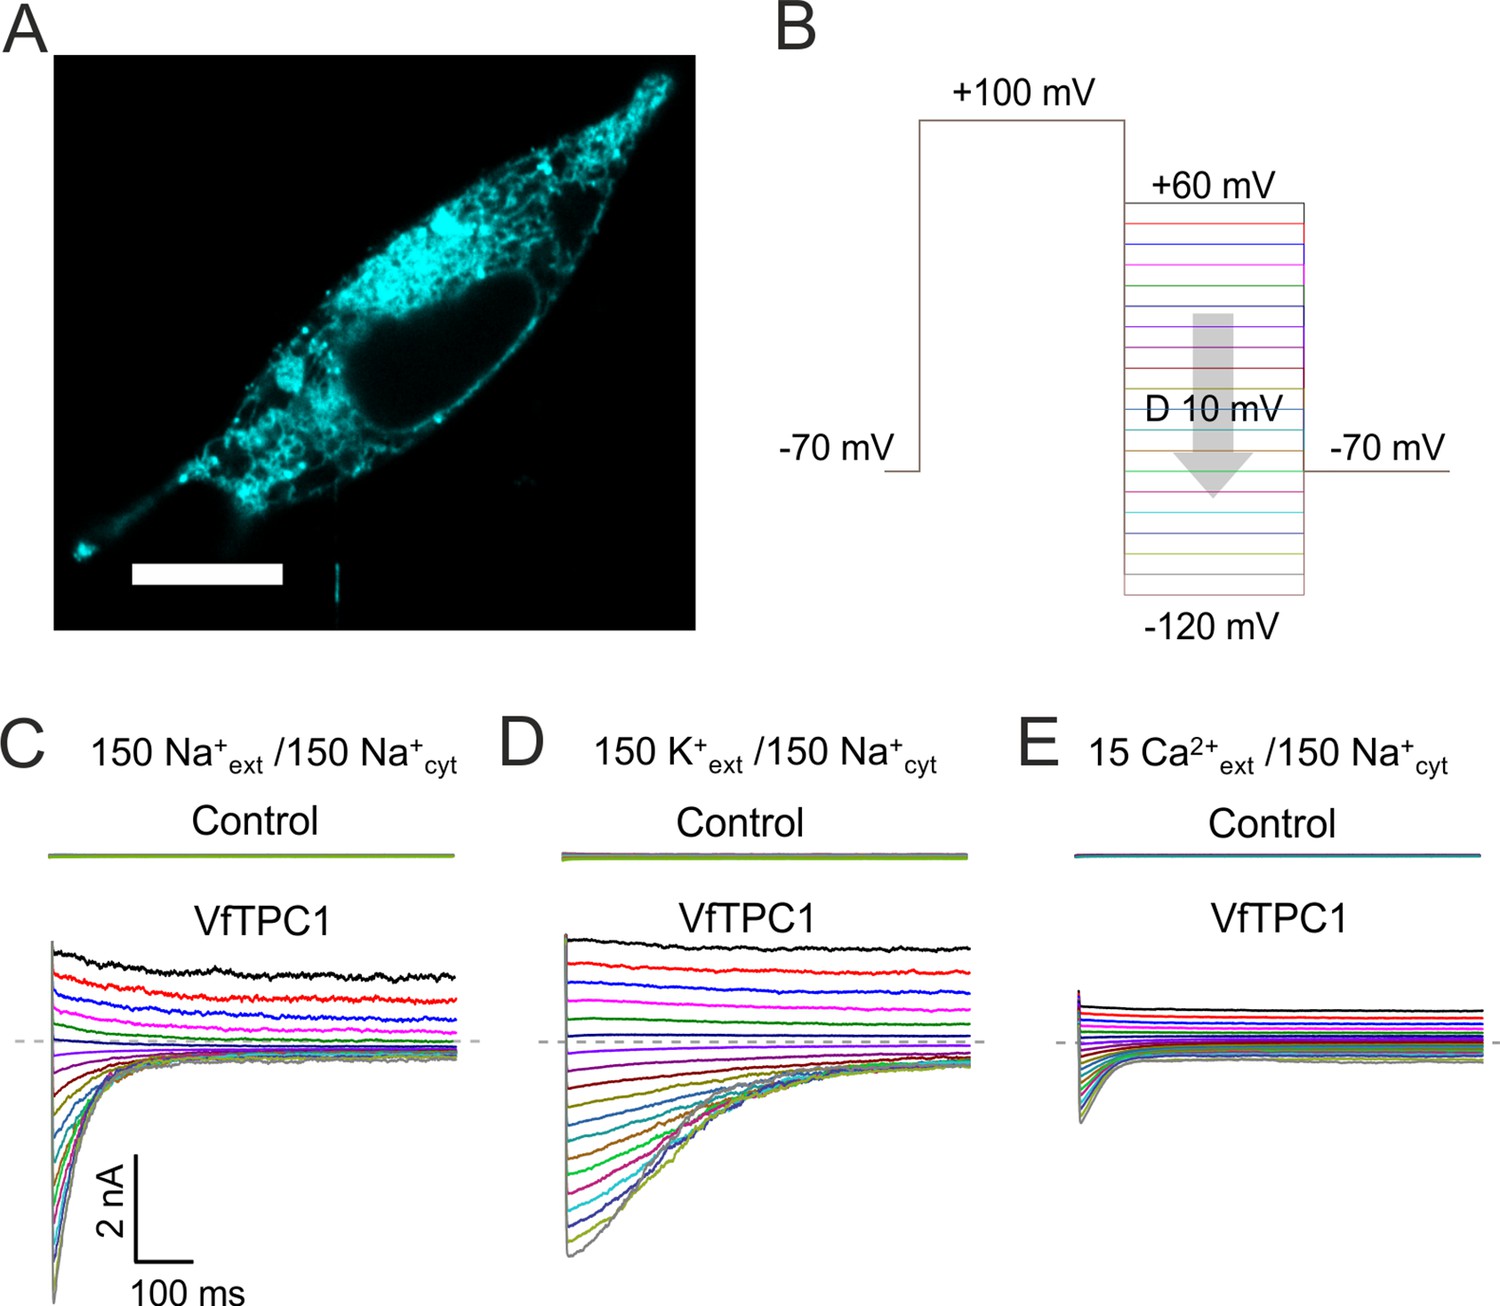
Characterization of VfTPC1 expressed in HEK293 cells.
(A) Confocal laser scanning microscope image of a HEK293 cell expressing eYFP-VfTPC1. Note, that most fluorescence is observed in intracellular membranes but is also present in the plasma membrane. Scale bar = 10 µm. (B–E) Electrophysiologcial characterization of non-transfected (control) and VfTPC1-transfected HEK293 cells by whole-cell patch-clamp techniques. (B) Schematic overview of the protocol used during analysis including an initial activation step (−70 to +100 mV) and a subsequent voltage gradient (+60 to −120 mV) for determining the voltage dependency of TPC1. (C–E) Typical tail current responses of the same control or the same VfTPC1-transfected HEK cell to voltage pulses in different extracellular solutions (in mM) as indicated. The concentration of cytosolic Na+ was always 150 mM. The dashed gray lines indicate the zero current level. For further details of the double-pulse protocol and patch-clamp solutions, see Materials and methods. Total number of control experiments was n = 15, n = 4, and n = 4 with external Na+, K+, and Ca2+, respectively. Note that, on the one hand, the smaller tail currents under external Ca2+-based conditions (E) compared to external Na+- or K+-based conditions (C, D) can be attributed to the 10-fold lower Ca2+ concentration compared with Na+ or K+ concentration. On the other hand, these smaller tail currents under Ca2+ conditions (E) also are in line with recent molecular dynamics (MD) simulations (Navarro-Retamal et al., 2021) suggesting that Ca2+ cannot permeate the channel better than K+ or Na+. This is further supported by (1) the very small single-channel conductance under Ca2+-based solute conditions compared to K+-based solute conditions and (2) the reduced single-channel conductance at a high luminal Ca2+ addition under K+-based solute conditions (Ward and Schroeder, 1994; Figure 11C).
Table 1
Relative cation permeability of TPC1 channel variants determined from the reversal potential under bi-ionic conditions in TPC1-expressing HEK cells.
| Channel variant | PK/PNaMean ± SD (n) | PCa/PNaMean ± SD (n) |
|---|---|---|
| AtTPC1 wild type | 0.75 ± 0.08 (5)*** | - |
| AtTPC1E605A/D606A | 0.85 ± 0.14 (6)** | 5.43 ± 0.69 (4) |
| AtTPC1D240A/D454A/E528A | 0.85 ± 0.09 (5)** | 5.50 ± 0.45 (4) |
| VfTPC1 wild type | 1.18 ± 0.11 (4) | 5.92 ± 0.52 (4) |
-
Significant differences of PK/PNa between AtTPC1 channel variants and VfTPC1 (**p < 0.01; ***p < 0.001) determined with one-way analysis of variance (ANOVA) together with a Dunnett’s post hoc comparison test. The relative permeability ratios (PK/ca/PNa) obtained for AtTPC1 wild type and the AtTPC1 mutant D240A/D454A/E528A were similar to those published in Guo et al., 2017. Note that a similar relative permeability ratio PK/PNa of 0.77 ± 0.05 (mean ± SD, n = 3) was also determined from TPC1 current relaxations (Figure 10—figure supplement 1) recorded from wild-type mesophyll vacuoles of Arabidopsis thaliana.
-
Table 1—source data 1
Quantification of relative cation permeability of TPC1 channel variants.
- https://cdn.elifesciences.org/articles/86384/elife-86384-table1-data1-v1.xlsx
BK channels are Ca2+-activated K+ channels with large conductance, similar to TPC1 (Barrett et al., 1982). A negative charge ring at the pore entrance promotes the single-channel conductance of BK channels (Brelidze et al., 2003). To examine whether the negatively charged residues at the luminal pore entrance of AtTPC1 may play a similar role as in BK channels, single-channel currents were recorded (Figure 11A). Under symmetric K+ conditions (100 mM) a single-channel conductance of about 80 pS was determined for AtTPC1 wild type (Figure 11B, C). With respect to the dimeric structure of TPC1, the neutralizations in the AtTPC1 double mutant E605A/D606A resulted in the removal of a total of four negative charges at the luminal pore entrance. Nevertheless, the unitary conductance of the mutant remained unchanged. Moreover, VfTPC1 had a threefold higher unitary conductance than AtTPC1 (250 pS, Figure 11; SchulzLessdorf and Hedrich, 1995), despite its neutral luminal pore residues at the homologous sites to AtTPC1 (E605, D606). These facts indicate that, in contrast to the AtTPC1-D269/E637 (VfTPC1-D271/E639) Ca2+ coordination site at the luminal entrance of the selectivity filter (Navarro-Retamal et al., 2021), these luminal polymorphic pore residues of Ca2+ sensor site 3 apparently do not contribute to the conductance of TPC1.
Figure 11
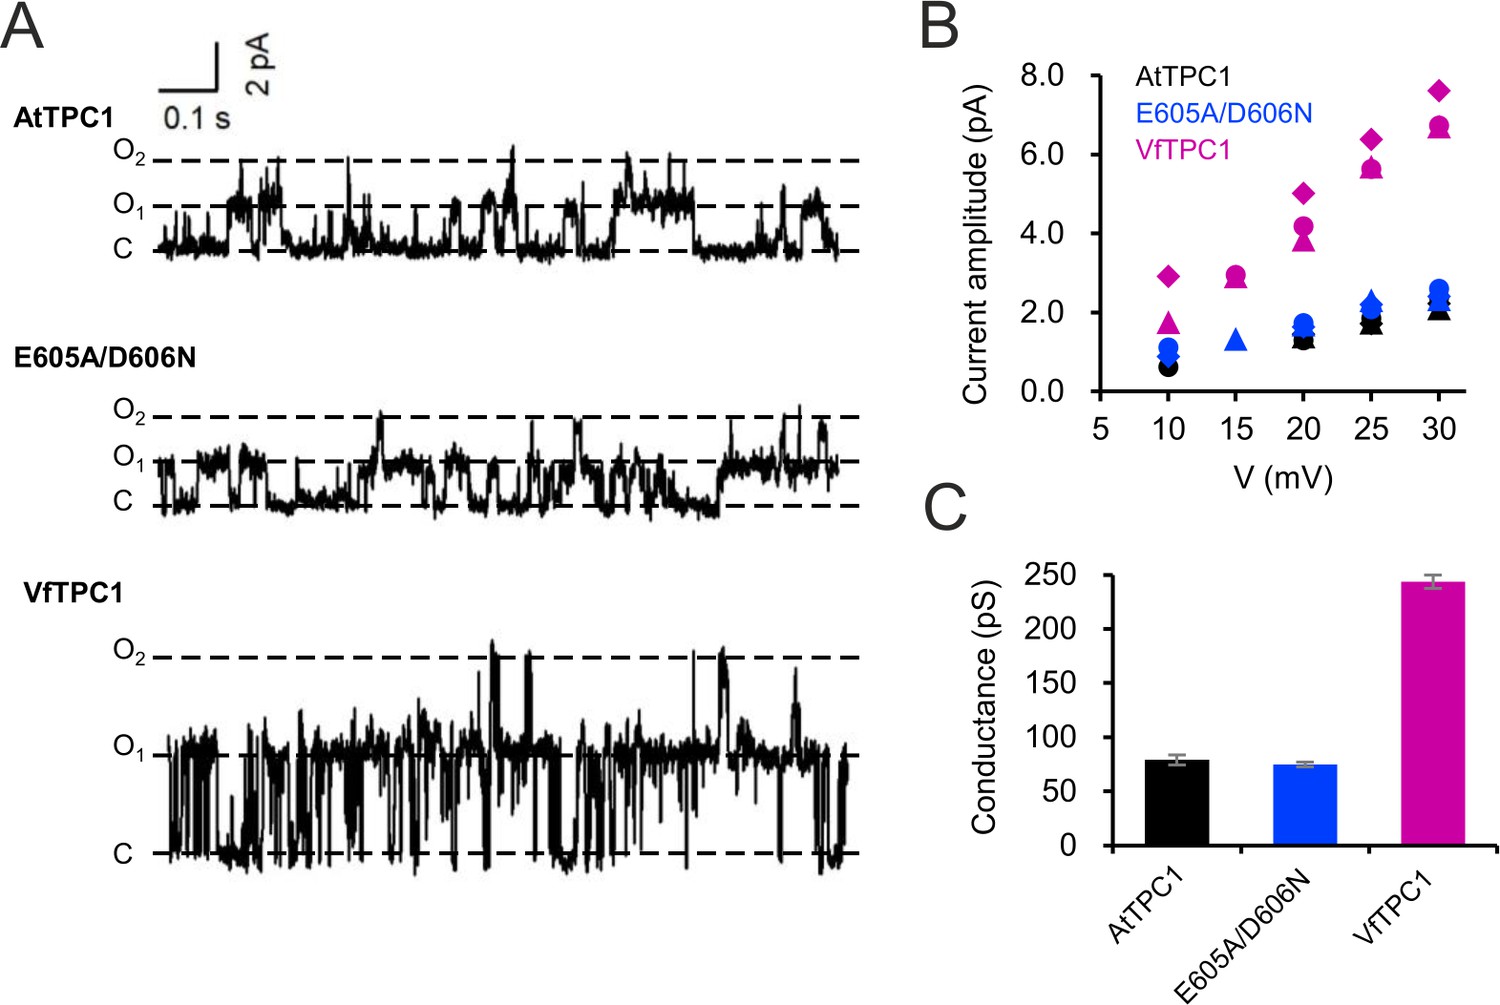
Single-channel analysis of TPC1 channel variants.
(A) Single-channel currents of indicated TPC1 channel variants evoked at +25 mV. The current level C indicates at which all channels were closed, while at current level O1 and O2 one or two TPC1 channels were open. (B) Single-channel current amplitudes determined for indicated TPC1 channel variants plotted against the respective voltages. The channel variants are shown in different color codes. Each different symbol of the same color corresponds to an individual experiment. (C) Bar diagram (means ± SE) gives the unitary conductance of different TPC1 channel variants derived from the linear regression fit of the individual experiments. The number of experiments was n = 3 for each channel variant. Experiments in (A–C) were performed with vacuoles from attpc1-2 mesophyll protoplasts transiently transformed with the indicated TPC1 channel variants. Symmetric K+ conditions (100 mM) were used with 0 and 0.5 mM Ca2+ at the luminal and cytosolic side of the vacuole membrane, respectively. For more details on patch-clamp solutions, see Materials and methods.
-
Figure 11—source data 1
Quantification of single-channel conductance of TPC1 channel variants.
- https://cdn.elifesciences.org/articles/86384/elife-86384-fig11-data1-v1.xlsx
Vacuoles with VfTPC1 and AtTPC1 triple mutant are hyperexcitable
The increased activity of the AtTPC1 channel mutant fou2 leads to a hyperexcitability of the vacuole (Jaślan et al., 2019). Here, the membrane polarization was measured at physiological 0.2 mM luminal Ca2+ (Schönknecht, 2013) with vacuoles equipped with either VfTPC1, AtTPC1 wild type or the triple AtTPC1 mutant E457N/E605A/D606N. For TPC1-dependent vacuolar excitation, depolarizing current pulses of increasing amplitudes in the range of 10–1000 pA were temporarily injected from a resting voltage of −60 mV (Figure 12; Figure 12—figure supplement 1A–C; Figure 12—source data 1; Jaślan et al., 2019). After the depolarizing current stimulus, the vacuole membrane equipped with VfTPC1 channels remained depolarized at a voltage of about 0 mV (i.e., at the equilibrium potential for K+) during the entire subsequent recording period of 10 s, regardless of the stimulus intensity (Figure 12, Figure 12—source data 1). In contrast, when AtTPC1-equipped vacuoles were challenged with even the highest current stimulus (1 nA), the post-stimulus voltage remained depolarized for only a short period (tplateau ~ 0.4 s, Figure 12—source data 1) before relaxation to the resting voltage occurred. In comparison to AtTPC1 wild type, the presence of the AtTPC1 triple mutant in the vacuole membrane strongly prolonged the lifetime of the depolarized post-stimulus voltage-plateau phase at all current stimuli (Figure 12). Except of one vacuole, all other five AtTPC1-triple mutant vacuoles already responded to the lowest current pulses such as 10, 30, or 70 pA with sustained post-stimulus depolarization over the entire recording period (Figure 12—source data 1). Thus, AtTPC1-triple mutant vacuoles were also hyperexcitable, behaving very much like the VfTPC1 vacuoles. The further analysis of the corresponding TPC1 currents of these vacuoles revealed, that at this physiological luminal Ca2+ concentration (0.2 mM), the voltage activation threshold of both, VfTPC1 and the AtTPC1 triple mutant E457N/E605A/D606N, was close to the resting membrane voltage. In comparison, AtTPC1 wild type showed a significant shift of the voltage activation threshold toward positive voltages (Figure 12—figure supplement 1E, F). This points to a positive correlation between the vacuolar hyperexcitability and the shifted voltage activation threshold of the hyperactive TPC1 channels (Figure 12, Figure 12—figure supplement 1D–F).
Figure 12 with 1 supplement see all
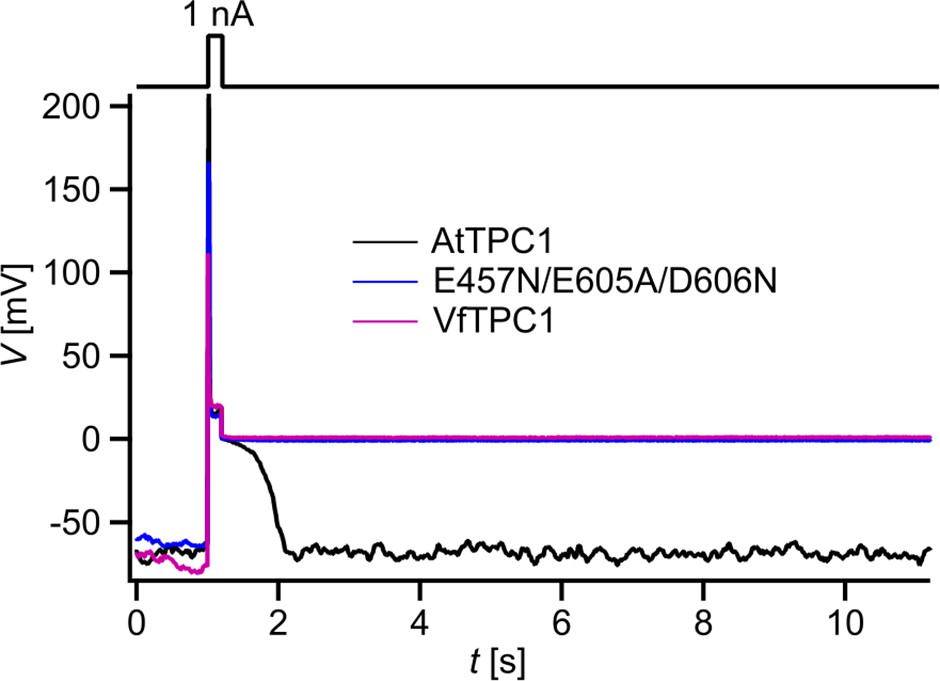
Dependency of vacuole excitability on TPC1 channel variants.
Superimposed voltage responses (lower panel) of individual attpc1-2 vacuoles equipped with either VfTPC1 wild type (magenta), AtTPC1 wild type (black), or AtTPC1-triple mutant E457N/E605A/D606N (blue) after transient transformation, to current injection of 1 nA (upper panel). Number of experiments for each channel type was n = 6. Lifetimes of the post-stimulus depolarization phase from each individual experiment are given in Figure 12—source data 1. Please note, the corresponding current responses from the same TPC1-expressing vacuoles are shown in Figure 12—figure supplement 1D–F. All experiments were carried out under symmetric K+ conditions (150 mM) at 0.2 mM luminal free Ca2+ and 1 mM Ca2+ together with 2 mM Mg2+ at the cytosolic side of the membrane. For more details on patch-clamp solutions, see Materials and methods.
-
Figure 12—source data 1
TPC1-dependent lifetime of the post-stimulus depolarization phase.
- https://cdn.elifesciences.org/articles/86384/elife-86384-fig12-data1-v1.pdf
-
Figure 12—source data 2
Quantification of voltage- and current-clamp data shown in Figure 12—figure supplement 1B–F.
- https://cdn.elifesciences.org/articles/86384/elife-86384-fig12-data2-v1.xlsx
In the following we used a computational model to simulate activation of voltage-dependent TPC1-mediated vacuole excitability (Figure 13; Jaślan et al., 2019). Under standard conditions (Figure 13, blue) a current stimulus induced a typical excitation as observed in whole-vacuole patch-clamp experiments (Figures 12 and 13B). In the simulation too, the duration of the post-stimulus voltage-plateau phase (tplateau) was found to depend on the stimulus strength (Figure 13C, E). The voltage activation threshold of TPC1 had an additional influence on tplateau. A negatively shifted TPC1 activation curve (Figure 13A, black) provoked that the vacuole membrane remained in the excited state after stimulation (Figure 13B, black). A positively shifted TPC1 activation curve (Figure 13A, pink), however, shortened the plateau phase and thus the time course of the excited state (Figure 13B, D, pink). As a consequence, the slope of the linear relationship between tplateau and stimulus strength was reduced (Figure 13E). Thus, effectors regulating the voltage activation threshold of TPC1 (e.g., Ca2+) tune the sensitivity of the vacuole membrane and shape the duration of the excited state. In comparison to AtTPC1-expressing vacuoles, those equipped with VfTPC1 or the AtTPC1 triple mutant, which both activate more negatively, are hyperexcitable (Figure 12).
Figure 13
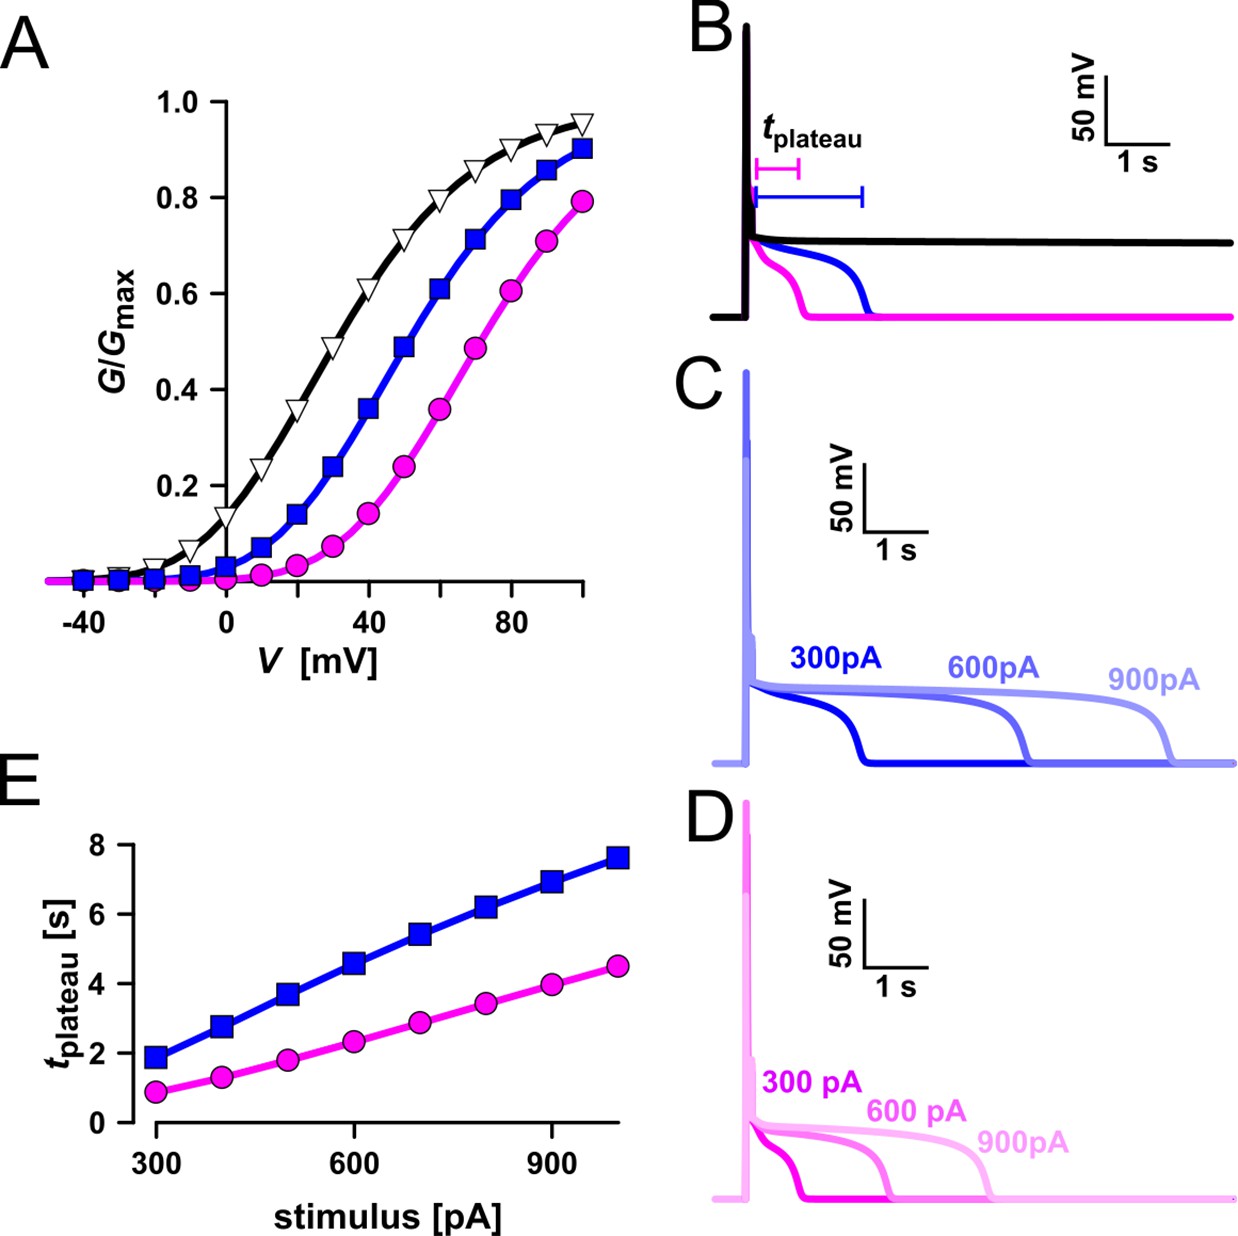
Simulation of vacuolar electrical excitability with three different TPC1 variants.
(A) Gating characteristics (G/Gmax) of three different TPC1-type channels. (B) Simulation of vacuolar electrical excitability with the different TPC1 variants. Excitation was induced by a 300-pA pulse of 100 ms duration. (C) Overlay of the electrical response of the vacuole having the blue-type TPC1 to 100 ms pulses of 300, 600, and 900 pA. (D) Overlay of the electrical response of the vacuole having the red-type TPC1 to 100 ms pulses of 300, 600, and 900 pA. (E) Dependency of the length of the post-stimulus plateau phase on the stimulus strength.
-
Figure 13—source data 1
Quantification of computationally simulated excitability shown in Figure 13.
- https://cdn.elifesciences.org/articles/86384/elife-86384-fig13-data1-v1.xlsx
Discussion
We identified the fabaceae prototype VfTPC1 channel from V. faba as a TPC1 channel variant with gating behavior that is clearly distinct from the A. thaliana AtTPC1 channel of Brassicaceae. In the Arabidopsis background, VfTPC1 activates near vacuolar resting membrane voltage (~−30 mV; Wang et al., 2015) and is significantly less sensitive to luminal Ca2+ than AtTPC1 (Figure 5). The dual polymorphism of two residues within the Ca2+ sensor site 3 in the luminal pore entrance is most likely responsible for this different gating behavior, because double loss-of-function mutations in Ca2+ sensor site 3 of AtTPC1 resulted in VfTPC1-like AtTPC1 channels. Reverse mutations, however, did not convert the features of VfTPC1 to AtTPC1, suggesting that additional structural adaptations have evolved and counteract these efforts to gain function in terms of greater voltage and luminal Ca2+ dependence. However, reverse gain-of-function approaches with plant ion channels also failed before (Michard et al., 2005; Johansson et al., 2006). Earlier (Dickinson et al., 2022), we proposed that Ca2+ sensor site 3 in AtTPC1 is formed by three negatively charged residues (E605, D606, and D607). Here, we have now found that E605 and D606 play the most important role within this triad of site 3 in gating control in AtTPC1 (Figure 5). Neutral residues at this site, as naturally already present in VfTPC1 (A607/N608; Figure 6), uncouple luminal Ca2+ coordination from gating (Figure 5).
VfTPC1 versus AtTPC1: what is the rule and what is the exception?
A. thaliana is the model plant for plant molecular genetics and physiology. Is the AtTPC1 structure–function relation reference for all plant SV channels? Obviously not! In comparison to AtTPC1, VfTPC1 is hyperactive and less sensitive toward luminal Ca2+ (Figures 2 and 5 and Figure 2—figure supplement 1). In fact, these VfTPC1 features may be even more widespread in the plant kingdom, because TPC1 channels from some other plant species like for example Lotus japonicus, Oryza sativa, and Hordeum vulgare also exhibit the neutralizing triple-polymorphism characteristic of VfTPC1 in the luminal Ca2+ sensor sites 2 and 3 (Figures 6 and 8). In well agreement with this triple polymorphism, the fabacean TPC1 channel from L. japonicus shows a VfTPC1-like gating behavior and low luminal Ca2+ sensitivity as TPC1 currents can still be recorded at 50 mM luminal Ca2+ (see Appendix 1—figure 1). Similarly, voltage- and Ca2+-dependent TPC1 current responses from mesophyll vacuoles of the monocots O. sativa and H. vulgare appear also to exhibit a lower luminal Ca2+ sensitivity and higher probability to open at more negative voltages, respectively (Dadacz-Narloch et al., 2013; Lenglet et al., 2017; Pottosin et al., 1997). Such luminal pore polymorphism, feeding back on gating behavior of TPC1 channels, could allow species to adapt the electrical properties of the vacuole to given individual environmental settings. In support of this hypothesis population-based evolutionary genomic approaches have pinpointed a polymorphic pore residue – other than the E605/D606 motif – in the vicinity of the TPC1 selectivity filter of Arabidopsis arenosa populations adapted to non-serpentine and serpentine soils (Arnold et al., 2016; Konečná et al., 2021; Turner et al., 2010). Serpentine barrens are characterized by skewed Ca2+/Mg2+ ratios and elevated heavy metals, often combined with low nutrient availability and drought conditions. While the functional consequences of this polymorphism for ion permeation remain elusive and subject to future studies, these results suggest that TPC1 channels are also involved in control of ion homeostasis in addition to a possible contribution to the vacuolar Ca2+ homeostat (Dindas et al., 2021; see below). Of note, this residue is also polymorphic in the legume clade of TPC1 channels. In legumes, rhizobia-triggered nodule formation depends on Ca2+ signals and is accompanied by a pronounced K+ loss from the vacuole during the life span of infected cells (Fedorova et al., 2021). It is tempting to speculate that the peculiar luminal Ca2+ tolerance of legume TPC1 type promote nodule formation and control ion homeostasis during nodule development. This hypothesis can be tested by generating TPC1-loss-of-function mutants in the model legumes Lotus and Medicago.
The complex relationship between TPC1 and Ca2+
In well agreement with experiments with V. faba vacuoles (Ivashikina and Hedrich, 2005; Ward and Schroeder, 1994), our cation replacement experiments with TPC1-expressing HEK cells demonstrate the principal ability of VfTPC1 and AtTPC1 to conduct not only K+ and Na+ but also Ca2+ ions. Although relative permeability ratios of PCa/PNa ≈ 5:1 (Table 1) may suggest a high calcium permeability, the reduced single-channel conductance measured with Ca2+ (Ward and Schroeder, 1994) support the recent mechanistic explanation that relative permeabilities of TPC1s do not correlate with the actual Ca2+ conductivity (Navarro-Retamal et al., 2021). Under physiological, plant cell-like Ca2+ and K+ concentrations and gradients, the fava bean SV/TPC1 channel was predominately conducting K+ (SchulzLessdorf and Hedrich, 1995, for review see Hedrich and Marten, 2011; Hedrich et al., 2018; Pottosin and Dobrovinskaya, 2022). This permeation profile is consistent with the K+-starvation transcriptome and the elevated vacuolar Ca2+ content of Arabidopsis leaves equipped with hyperactive fou2 TPC1 channels (Beyhl et al., 2009; Bonaventure et al., 2007b). The latter suggests that the luminal Ca2+-binding sites of TPC1 or, in other words, the susceptibility of TPC1 to block by elevated luminal Ca2+ may be the key for the Ca2+ storage capacity of the plant vacuole. At the same time, a much lower luminal Ca2+ sensitivity would then keep TPC1 functional even at high luminal vacuolar Ca2+ levels. Based on the observation that TPC1/SV channels are in principle permeable to Ca2+ under certain experimental conditions, it was speculated that TPC channels (similar to the animal field) are part of a Ca2+-induced Ca2+ release (CICR) network (Ward and Schroeder, 1994). Intruigingly, studies on TPC1 overexpressing and loss-of-function Arabidopsis mutants showed that the AtTPC1 activity modulates the speed and not the amplitude of traveling Ca2+ waves in roots triggered by salt stress (Choi et al., 2014). Quantitative analysis of local and distant Ca2+ waves in leaves elicited by wounding, however, excluded the role of TPC1 channels as a CICR element in the vacuole membrane (Bellandi et al., 2022). Alternatively, TPC1-triggered vacuole excitation could cause the release of Ca2+ from the vacuole to the cytosol via a Ca2+ homeostat (i.e., a combination of yet-to-be identified Ca2+ transporters, Dreyer, 2021) with a striking correlation between the duration of excitation and the amount of released Ca2+ (Dindas et al., 2021). In such a model scenario, the control of the voltage activation threshold of TPC1 by luminal Ca2+ (Figure 5) would directly influence the excitation duration of the vacuole membrane (Figures 12 and 13E) and Ca2+ release in turn. Without such a regulatory process, a higher luminal Ca2+ concentration would imply a larger transmembrane Ca2+ gradient and therefore the release of a larger Ca2+ quantum. Tuning of the TPC1 activity by luminal Ca2+ would thus have the potential to mitigate or even counterbalance the electro-chemical potential of a larger Ca2+ gradient. A higher luminal Ca2+ concentration downregulates TPC1 activity, which in turn would reduce the excitation duration and would result in a shortened Ca2+ release of larger amplitude. Since TPC1 channels are involved in certain Ca2+-dependent stress responses (Pottosin and Dobrovinskaya, 2022), such a scenario could be triggered by a cytosolic Ca2+ signal mediated by Ca2+-permeable channels of the plasma membrane or ER membrane. Given the involvement of TPK channels to vacuolar excitation (Jaślan et al., 2019), the increased cytosolic Ca2+ level could initially lead to the activation of TPK channels for initial depolarization of the vacuolar membrane. Consistent with the findings on the TPC1 activation sequence from recent molecular TPC1 structures (Dickinson et al., 2022; Ye et al., 2021), these two signals, voltage together with cytosolic Ca2+, could activate TPC1 channels and lead to further depolarization (Allen and Sanders, 1996) affecting the vacuolar Ca2+ homeostat. The TPC1-dependent activation of a vacuolar Ca2+ homeostat may also explain the wounding and retarded growth phenotype of the fou2 mutant (Bonaventure et al., 2007a) in comparison to Arabidopsis wild type. The presented model scenario could also be imagined for V. faba. Nevertheless, the absence of a retarded growth phenotype of these plants may point to species-specific differences. In view of the high impact of the TPC1 activation threshold on hormone homeostasis and plant growth, future research is now warranted on how V. faba plants can (1) prevent retarded growth and (2) benefit from a TPC1 channel variant with a greatly reduced luminal Ca2+ sensitivity for potentially better adaptation to their respective ecological niche.
Materials and methods
Plant materials and growth conditions
Request a detailed protocolA. thaliana wild type (Col0) and attpc1-2 mutant (Peiter et al., 2005) were grown in a growth chamber under short day conditions (8 hr light, 16 hr dark) with a day/night temperature regime of 22/16°C, a photon flux density of 150 µmol m−2 s−1 and a relative humidity of about 60%. V. faba and L. japonicus plants were grown in the greenhouse at a 16-hr day/8-hr dark photoperiod, a day/night temperature regime of 22/18°C and a light intensity of approximately 1250 µmol m−2 s−1.
RNA sequencing
Request a detailed protocolLeaves from 6- to 8-week-old V. faba plants were harvested and mesophyll RNA was extracted using the NucleoSpin Plant RNA extraction kit (Macherey-Nagel, Düren, Germany) according to the manufacturer’s instructions. For guard cell RNA extraction epidermal fragments were isolated using the blender method (Bauer et al., 2013; Raschke and Hedrich, 1989). Total RNA from three individual biological replicates was prepared and subjected to RNA-sequencing on an Illumina NextSeq500 platform. High-quality RNA-seq paired-end reads were quality checked using FastQC (version 0.11.6) and transcriptomes were de novo assembled individually using Trinity (version 2.5.1 Release). Finally, the TRAPID pipeline was employed for processing of assembled transcriptome data including transcript annotation (Bucchini et al., 2021). Based on AtTPC1 homology, identical VfTPC1 transcripts were identified in mesophyll and guard cell fractions, and the obtained sequence information was used to clone the VfTPC1 CDS by a PCR-based approach. The VfTPC1 mRNA sequence is deposited at GenBank under the following accession number: VfTPC1_mRNA MW380418.
Cloning and site-directed mutagenesis
Request a detailed protocolAfter the total RNA was extracted from mature leaves of V. faba and L. japonicus plants and reverse transcribed into complementary DNA (cDNA), VfTPC1 and LjTPC1 were amplified from the cDNA libraries, essentially as described by Dadacz-Narloch et al., 2013. For patch-clamp experiments with vacuoles, the cDNA coding sequences of the AtTPC1 channel variants were cloned into the modified pSAT6-eGFP-C1 vector (GenBank AY818377.1), whereas the coding sequences of the different VfTPC1 and LjTPC1 channel variants were cloned into the pSAT6-eYFP-C1 vector (GenBank DQ005469) using the uracil-excision-based cloning technique (Nour-Eldin et al., 2010), essentially as described by Dadacz-Narloch et al., 2011. The resulting TPC1-eGFP constructs were under the control of the 35 S promoter, and the TPC1-eYFP constructs were under the control of the ubiquitin promoter (UBQ10). For patch-clamp experiments with HEK cells, the eYFP coding sequence (Nagai et al., 2002) was fused without the stop codon to the 5′ end of the TPC1 cDNA coding sequences and then cloned together into the pcDNA3.1 vector (GenBank MN996867.1). In analogy to Dadacz-Narloch et al., 2011, a modified USER fusion method was used to introduce site-directed mutations in the wild-type AtTPC1 construct. The sequences of the primers used for subcloning and mutagenesis are listed in Supplementary file 2. All channel variants were tested for their sequences.
Transient protoplast transformation
Request a detailed protocolEssentially following the protocols from Sheen, 2002 and Yoo et al., 2007, mesophyll protoplasts were released from 6- to 7-week-old tpc1-2 Arabidopsis mutant plants and transiently transformed with the different TPC1 channel constructs. For channel expression, protoplasts were then stored in W5 solution (125 mM CaCl2, 154 mM NaCl, 5 mM KCl, 5 mM glucose, 2 mM MES (2-(N-Morpholino)ethanesulfonic acid)/Tris, pH 5.6, 50 μg ml−1 ampicillin) at 23°C in the dark for usually 2 days.
HEK cell transfection
Request a detailed protocolThe 293 embryonic renal epithelial cell line authenticated by STR profiling was acquired from ATCC (American Type Culture Collection, Manassas, VA, USA). During laboratory research use the cell line identity has been authenticated by microscopy and the cell culture was negatively tested for mycoplasms by Eurofins (Ebersberg, Germany). HEK293 cells were transfected with the respective eYFP-TPC1-fused constructs with Lipofectamine 2000 (Thermo Fisher, Waltham, USA) according to the manufacturer’s instructions. Cells were seeded 18–24 hr after transfection on glass coverslips (diameter 12 mm). Protein expression was verified on the single-cell level by the appearance of eYFP fluorescence in the plasma membrane upon excitation with a 473-nm laser.
Subcellular targeting
Request a detailed protocolVacuolar membrane localization of the expressed eGFP/eYFP-fused TPC1 channels was verified by imaging the fluorescence signal of transformed protoplasts and vacuoles with a confocal laser scanning microscope (TCS SP5, Leica, Mannheim, Germany) (Dadacz-Narloch et al., 2013). eGFP and eYFP were excited with an Argon laser at 490 and 514 nm, respectively, and the emission of fluorescence was monitored between 500 and 520 nm for eGFP and between 520 and 540 nm for eYFP. Red autofluorescence of chlorophyll was excited at 540 nm and acquired between 590 and 610 nm. For expression analysis in HEK293 cells, a confocal laser scanning microscope (SP700, Zeiss, Germany) equipped with three laser lines (488 nm: 10 mW, 555 nm: 10 mW, 639 nm: 5 mW) was used. Images were processed with ZEN software (ZEN 2012, Zeiss) or Fiji, Version ImageJ 1.50 (Schindelin et al., 2012).
Whole-vacuole patch-clamp experiments
Request a detailed protocolMesophyll vacuoles were liberated from A. thaliana wild-type protoplasts after their enzymatical isolation, essentially as described in Beyhl et al., 2009. Vacuoles were released from mesophyll protoplasts of the attpc1-2 mutant in the recording chamber 2 days after transformation using a vacuole release (VR) solution (Lagostena et al., 2017). The VR solution was modified and composed of 100 mM malic acid, 155 mM NMDG (N-methyl-D-glucamine), 5 mM EGTA (ethylene glycol-bis(β-aminoethyl ether)-N,N,N',N'-tetraacetic acid), 3 mM MgCl2, 10 mM HEPES(4-[2-hydroxyethyl]piperazine-1-ethanesulfonic acid)/Tris pH 7.5 and adjusted to 450 mOsmol kg−1 with D-sorbitol. The whole-vacuole configuration was then established either with wild-type vacuoles or TPC1-transformed vacuoles. The latter vacuoles were easily identified upon their eGFP- or eYFP-based fluorescence measured between 510 and 535 nm after excitation at 480 nm with a precisExcite HighPower LED lamp (Visitron Systems GmbH, Puchheim, Germany). Patch pipettes were prepared from Harvard glass capillaries (Harvard glass capillaries GC150T-10, Harvard Apparatus, UK) and typically had a resistance in the range of 1.4–3.1 MΩ. The membrane capacitance (Cm) of the individual vacuoles accessed and compensated in patch-clamp experiments ranged from 31.1 to 68.5 pF. When the seal was stable throughout the experiment, membrane currents and voltages were recorded with a sampling rate of 150 µs at a low-pass filter frequency of 2.9 or 3 kHz using an EPC10 or EPC800 patch-clamp amplifier, respectively (HEKA Electronic). Data were acquired with the software programs Pulse or Patchmaster (HEKA Electronic) and offline analyzed with IGORPro (Wave Metrics).
Voltage recordings were carried out with TPC1-transformed vacuoles in the current-clamp mode as described by Jaślan et al., 2019. Briefly, after adjusting the membrane voltage to −60 mV by injection of an appropriate current, current pulses were applied in the range of 10–1000 pA for 200 ms. In the voltage-clamp experiments, macroscopic currents were recorded in response to 1-s-lasting voltage pulses in the range of −80 to +110 mV in 10 mV increments applied from a holding voltage of –60 mV. Following each voltage pulse, the holding voltage of −60 mV was applied again. The total time interval between voltage pulses at holding voltage was 4 s. The corresponding current responses of each vacuole were analyzed with respect to the half-activation time (tact-0.5) and steady-state current amplitudes (Iss). The half-activation time (tact-0.5) was the time at which 50% of the steady-state current amplitude was reached. As a normalization measure for the membrane surface of the individual vacuole, the determined steady-state currents were divided by the respective compensated membrane capacitance (Cm). Conductance/voltage curves (G/Gmax(V)) were quantified from tail current experiments as a measure for the relative voltage-dependent open-channel probability. Following pre-pulse voltages in the range of −80 to +110 mV, instantaneous tail currents were determined at −60 mV. The midpoint voltages (V1, V2) and the equivalent gating charges (z1, z2) were derived by fitting the G/Gmax(V) curves with a double Boltzmann equation (Dickinson et al., 2022). After pre-activation of TPC1 currents upon a 300-ms-lasting instantaneous voltage pulse to either +80 mV (VfTPC1) or +100 mV (AtTPC1 channel variants), current relaxation was recorded for 200 ms at voltages ranging from −60 to 0 mV in 10 mV decrements. Before and after the double-voltage pulse, the membrane was clamped to the holding voltage of −60 mV. The total time interval between the double-voltage pulses at holding voltage was 4.3 s. The deactivation-half times (tdeact-0.5) were determined at which the initial tail current amplitude has declined by 50%.
In the voltage-clamp experiments of Figures 2—5 and Figure 7, Figure 2—figure supplement 1, Appendix 1—figure 1, the standard bath solution facing the cytoplasmic side of the vacuole membrane contained 150 mM KCl, 1 mM CaCl2, 10 mM HEPES (pH 7.5/Tris) and was adjusted with D-sorbitol to an osmolality of 520 mOsmol kg−1. The standard pipette solution at the luminal side of the tonoplast basically consisted of 150 mM KCl, 2 mM MgCl2, 10 mM HEPES (pH 7.5/Tris) and was adjusted with D-sorbitol to a final osmolality 500 mOsmol kg−1. The pipette solution was supplemented with 10 or 50 mM CaCl2 or adjusted to 0 mM Ca2 by addition of 0.1 mM EGTA. Current-clamp experiments (Figure 12, Figure 12—figure supplement 1A–C) and corresponding voltage-clamp experiments (Figure 12—figure supplement 1D–F) were performed on the same individual vacuoles. For these measurements, the standard bath medium additionally contained 2 mM MgCl2 and the pipette solution was adjusted to 0.2 mM free Ca2+ by addition of 4.1 mM EGTA and 4.3 mM Ca2+ (maxchelator/webmaxc/webmaxcS.htm). It should be noted that voltage- and current-clamp experiments with non-transformed A. thaliana attpc1-2 vacuoles as negative controls have been published previously by Jaślan et al., 2019; Jaślan et al., 2016, respectively.
Patch-clamp experiments with membrane patches
Request a detailed protocolVacuoles were isolated from transiently transformed protoplasts by perfusion with a solution containing 10 mM EGTA, 10 mM HEPES/Tris pH 7,5, adjusted to 200 mOsmol kg–1 with D-sorbitol. Excised membrane patches with the cytosolic side of the tonoplast facing the bath medium were formed from the whole-vacuole configuration. Single-channel fluctuations were recorded with a sampling rate of 100 µs at a low-pass filter frequency of 1 kHz using an EPC10 patch-clamp amplifier. Single-channel current amplitudes were determined from all-point histograms of the current recordings and plotted against the respective voltages. The single-channel conductance for each membrane patch was derived from linear regression of the current–voltage plot. The bath medium contained 100 mM KCl, 0.5 mM CaCl2, 10 mM HEPES (pH 7.5/Tris). The pipette medium consisted of 100 mM KCl, 2 mM MgCl2, 2 mM EGTA, 10 mM MES (pH 5.5/Tris). Both solutions were adjusted to 400 mOsmol kg−1 with sorbitol.
Patch-clamp experiments with HEK cells
Request a detailed protocolWhole-cell current recordings were performed at a setup described previously (Panzer et al., 2019). Data were acquired using Clampex 10.7 (Molecular devices, San Jose, USA) with 100 kHz sampling rate, low-pass filtered at 5 kHz, and analyzed with Clampfit 10.7 (Molecular devices) and OriginPro 2016 (Originlab, Northampton, USA). Pipette resistance (GB150F-8P, Scientific-Instruments, Hofheim, Germany) was 4–6 MΩ in standard bath solution. The standard pipette solution contained 150 mM NaCl, 2.5 mM MgCl2, 0.3 mM free Ca2+ (adjusted by 4.3 mM CaCl2 and 4 mM EGTA), 10 mM HEPES (pH 7.4/Tris). The standard bath solution was composed of 150 mM NaCl, 10 mM HEPES (pH 7.4/Tris). Under these experimental conditions bath and pipette solutions mimicked the vacuolar and cytosolic solute conditions, respectively. To determine the relative permeability ratio on the same HEK cell under bi-ionic cation conditions, the Na+-based bath medium was replaced by either a K+- or Ca2+-based solution. The K+-based bath medium contained 150 mM KCl, 10 mM HEPES (pH 7.4/Tris), and the Ca2+-based one consisted of 15 mM CaCl2, 120 mM NMDG-Cl, 10 mM HEPES (pH 7.4/Tris). Only cells were included in the analysis that exhibited stable seal conditions throughout the whole set of solution exchange.
For determination of the TPC1 ion selectivity, tail current experiments were conducted. After pre-activating the TPC1 channels by a voltage step from −70 mV (resting potential) to +100 mV for 500–1000 ms, the relaxation of the outward currents in response to hyperpolarizing voltage pulses was recorded either with 10 mV intervals reaching from +60 to −120 mV or in 5 mV decrements reaching from +30 to −40 mV to visualize and to analyze the reversal potentials, respectively. After the double-voltage pulse, the membrane was clamped again to the holding voltage of −70 mV. The total time interval between the double-voltage pulses at holding voltage was 3.4 s. In order to clearly assign the reversal potential to TPC1 currents, which are not contaminated by leakage currents, the slope of the tail currents was determined and plotted against the corresponding voltages. The reversal potential for each solute condition was then determined by interpolation the smallest negative and positive slope values. The shift in the reversal potential ΔVrev caused by the change of the external solution from either Na+ to K+ or Na+ to Ca2+ solution was used to estimate the relative permeability ratios PCa/PNa or PK/PNa essentially as described by Sun et al., 1997. For calculation of the K+ to Na+ permeability ratio (PK/PNa) the following Equation 1 was used (Hille, 1971):
(1)
where ΔVrev = VK - VNa, with the reversal potentials VK and VNa in K+- or Na+-based bath solution, respectively, and α = RT/F = 25.42 mV at 22°C. The relative permeability ratio PCa/PNa was calculated using Equation 2 derived from the extended Goldman–Hodgkin–Katz equation (Lewis, 1979):
(2)
where ΔVrev = VCa - VNa with the reversal potentials VCa and VNa in Ca2+- or Na+-based bath solution, respectively, and α has same meaning as above.
Voltage convention in patch-clamp experiments
Request a detailed protocolThe given membrane voltages refer to the cytosolic side of the vacuole membrane or HEK cell plasma membrane with zero potential on its luminal or extracellular side, respectively. In experiments with vacuoles performed in the presence of 50 mM luminal Ca2+ (Figures 2—5, and Appendix 1—figure 1), the membrane voltages were corrected offline by the corresponding liquid junction potential determined offline according to Neher, 1992 and Ward and Schroeder, 1994. Otherwise, no correction for the liquid junction potential was necessary.
Statistical analysis
Request a detailed protocolPatch-clamp experiments were conducted with individual vacuoles of attpc1-2 mutant plants, transformed with a specific channel construct, or wild-type plants under a given solute condition. Each individual vacuole patch-clamp experiment represents a biological replicate, that is the mesophyll vacuoles studied were derived from different plants. Experiments with individual HEK293 cells yielded from the same or different transfections were considered technical and biological replicates, respectively (Table 1—source data 1). Due to a common dataset, Iss/Cm(V) and G/Gmax(V) curves for wild-type AtTPC1 acquired under 0 and 10 mM luminal Ca2+ were identical to those shown in Dickinson et al., 2022. Electrophysiological data are given as means ± standard error or standard deviation as indicated in the figure legends or tables. The statistical analysis was performed using one-way analysis of variance (ANOVA) followed by the Dunnett’s post hoc comparison test. In order to test also the Ca2+-induced shifts in the V1/2 values for significant differences, the V1 and V2 mean values determined in the absence of luminal Ca2+ were subtracted from the individual V1 and V2 values, respectively, derived under 10 mM luminal Ca2+ conditions (Dickinson et al., 2022). In analogy, the Ca2+-induced change in the tact-0.5 values were analyzed for significant differences. Statistical analysis was done with Origin 2020 (OriginLab, Northampton, MA, USA) and SPSS 2020 (IBM, New York, USA).
3D modeling
Request a detailed protocolAn atomic model of VfTPC1 was generated using the homology modeling program MODELLER B (Webb and Sali, 2016), using the experimental AtTPC1 D454N (fou2) Ca2+-bound structure (Dickinson et al., 2022) as a reference (PDB: 7TBG). The model was then relaxed into the 2.5 Å resolution fou2-Ca2+ map (Dickinson et al., 2022) using ISOLDE (Croll, 2018) and used for atomic interpretation.
In silico experiments
Request a detailed protocolElectrical excitability of the vacuolar membrane was computationally simulated as described in detail before (Jaślan et al., 2019) involving a background conductance, voltage-independent K+ channels of the TPK-type and the time- and voltage-dependent cation channel TPC1 that confers excitability to the vacuolar membrane. Details are also provided in Supplementary file 3.
Appendix 1
Appendix 1—figure 1
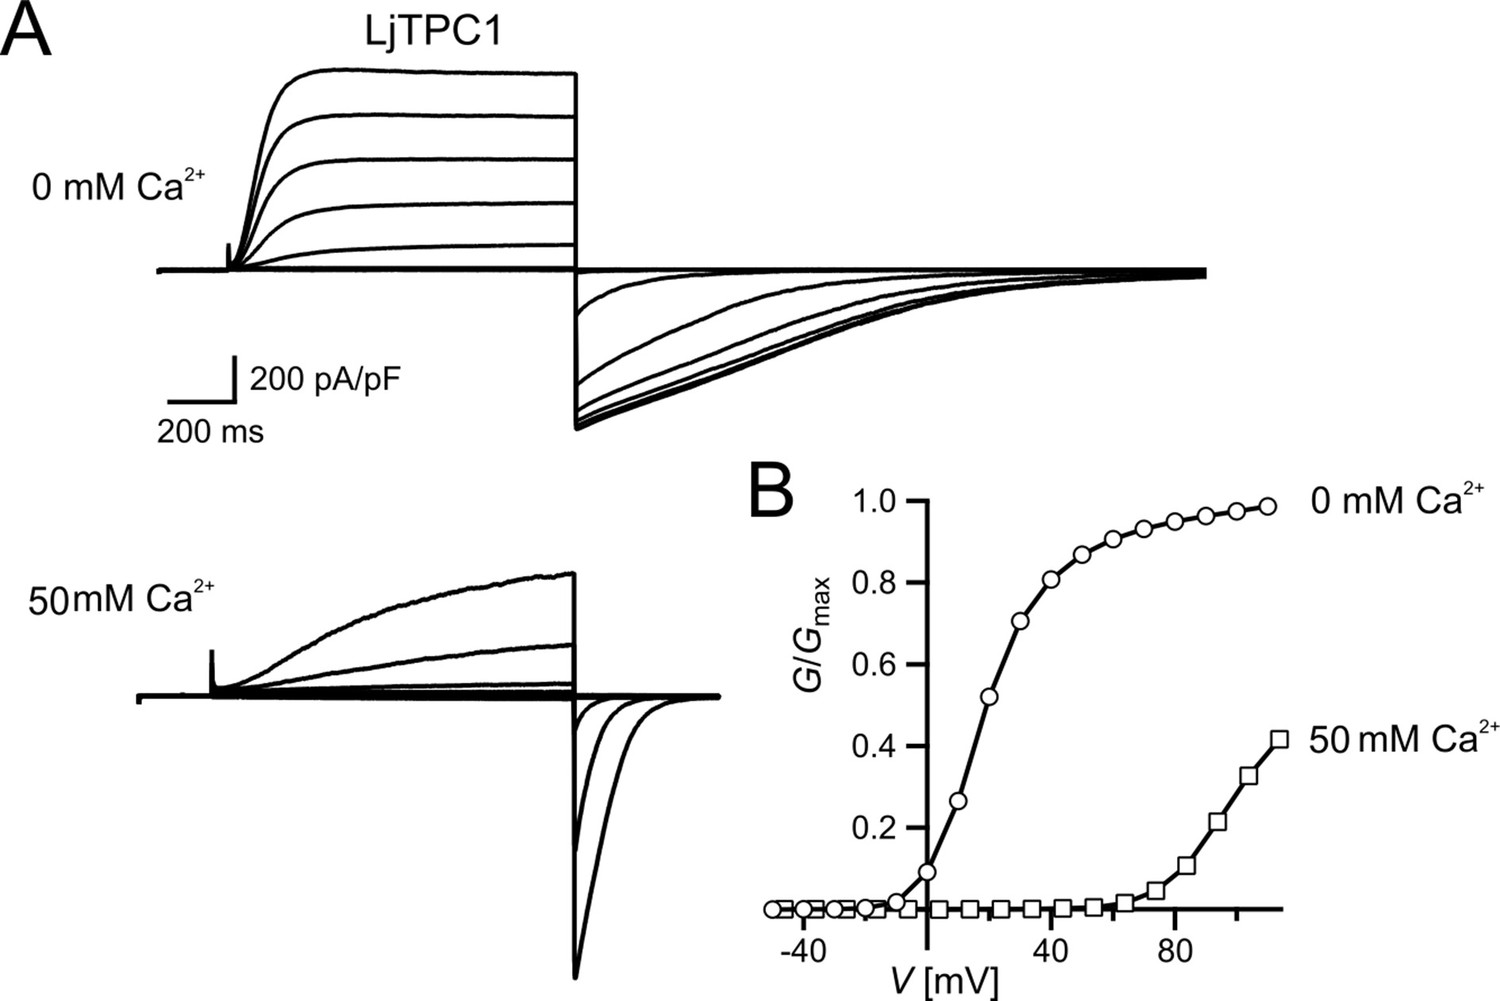
Similar voltage-dependent gating behavior of TPC1 from Lotus japonicus.
(A) Macroscopic TPC1 current recordings from individual mesophyll vacuoles at 0 and 50 mM luminal Ca2+ after transient transformation of Arabidopsis thaliana mesophyll protoplasts (attpc1-2) with LjTPC1 from L. japonicus TPC1 currents. Currents were elicited upon depolarizing voltages pulses in the range of −80 to +110 mV in 20 mV increments. Before and after these voltage pulses, the membrane was clamped to the holding voltage of −60 mV. The total time interval between voltage pulses at holding voltage was 4 s. (B) Normalized conductance–voltage plots (G/Gmax(V)) determined for the LjTPC1 currents shown in (A) in the absence and presence of luminal Ca2+ as indicated. Best fits of the G/V plots to a double Boltzmann function are given by the solid lines. Experiments were performed under symmetric K+ conditions (150 mM) with 1 mM cytosolic Ca2+ and luminal Ca2+ at indicated concentration. For more details on the voltage protocol and solutions, see Materials and methods. Source data are given in Appendix 1—figure 1—source data 1.
-
Appendix 1—figure 1—source data 1
Quantification of voltage-clamp data shown in Appendix 1—figure 1.
- https://cdn.elifesciences.org/articles/86384/elife-86384-app1-fig1-data1-v1.xlsx
Data availability
All data are included in the manuscript and supporting materials. Source data files were provided for the Figures 2—7 and 11, Appendix 1—figure 1, and Table 1; they contain numerical data to generate the figures. New sequencing data have been deposited at Genbank under the accession number VfTPC1_mRNA MW380418. Published protein structures were used for protein modeling in Figure 9 (PDB: 7TBG, 5DQQ) and Figure 9—figure supplement 1 (PDB: 5TUA). The homology model of VfTPC1 was provided by Supplementary file 1. For direct comparison, a small electrophysiological dataset published by Dickinson et al., 2022 were reused as indicated in the corresponding figure legends (Figures 2 and 5).
-
NCBI NucleotideID MW380418. Vicia faba var. faba vacuolar two pore Ca2+-channel (TPC1) mRNA, complete cds.
-
NCBI GenBankID 2258117146. Vicia faba var. faba vacuolar two pore Ca2+-channel (TPC1) mRNA, complete cds.
-
RCSB Protein Data BankID 5DQQ. Structure, inhibition and regulation of two-pore channel TPC1 from Arabidopsis thaliana.
-
RCSB Protein Data BankID 5TUA. Structure of a Na+-selective mutant of two-pore channel from Arabidopsis thaliana AtTPC1.
References
-
A cationic channel in the guard cell tonoplast of allium cepaPlant Physiology 105:999–1006.https://doi.org/10.1104/pp.105.3.999
-
Properties of single calcium-activated potassium channels in cultured rat muscleThe Journal of Physiology 331:211–230.https://doi.org/10.1113/jphysiol.1982.sp014370
-
Diffusion and bulk flow of amino acids mediate calcium waves in plantsScience Advances 8:eabo6693.https://doi.org/10.1126/sciadv.abo6693
-
Voltage-dependent channels permeable to K+ and Na+ in the membrane ofAcer pseudoplatanus vacuolesThe Journal of Membrane Biology 103:227–236.https://doi.org/10.1007/BF01993982
-
ISOLDE: a physically realistic environment for model building into low-resolution electron-density mapsActa Crystallographica. Section D, Structural Biology 74:519–530.https://doi.org/10.1107/S2059798318002425
-
On the cellular site of two-pore channel TPC1 action in the PoaceaeThe New Phytologist 200:663–674.https://doi.org/10.1111/nph.12402
-
A voltage-dependent Ca2+ homeostat operates in the plant vacuolar membraneThe New Phytologist 230:1449–1460.https://doi.org/10.1111/nph.17272
-
Nutrient cycling is an important mechanism for homeostasis in plant cellsPlant Physiology 187:2246–2261.https://doi.org/10.1093/plphys/kiab217
-
Potassium content diminishes in infected cells of Medicago truncatula nodules due to the mislocation of channels MtAKT1 and MtSKOR/GORKJournal of Experimental Botany 72:1336–1348.https://doi.org/10.1093/jxb/eraa508
-
Structure and Function of TPC1 Vacuole SV Channel Gains ShapeMolecular Plant 11:764–775.https://doi.org/10.1016/j.molp.2018.03.017
-
The permeability of the sodium channel to organic cations in myelinated nerveThe Journal of General Physiology 58:599–619.https://doi.org/10.1085/jgp.58.6.599
-
Voltage-dependent gating of SV channel TPC1 confers vacuole excitabilityNature Communications 10:2659.https://doi.org/10.1038/s41467-019-10599-x
-
Evolutionary Aspects of TRPMLs and TPCsInternational Journal of Molecular Sciences 21:4181.https://doi.org/10.3390/ijms21114181
-
On the structure and mechanism of two-pore channelsThe FEBS Journal 285:233–243.https://doi.org/10.1111/febs.14154
-
A unique voltage sensor sensitizes the potassium channel AKT2 to phosphoregulationThe Journal of General Physiology 126:605–617.https://doi.org/10.1085/jgp.200509413
-
Computational Analyses of the AtTPC1 (Arabidopsis Two-Pore Channel 1) Permeation PathwayInternational Journal of Molecular Sciences 22:10345.https://doi.org/10.3390/ijms221910345
-
Correction for liquid junction potentials in patch-clamp experimentsMethods in Enzymology 207:123–131.https://doi.org/10.1016/0076-6879(92)07008-c
-
USER cloning and USER fusion: the ideal cloning techniques for small and big laboratoriesMethods in Molecular Biology 643:185–200.https://doi.org/10.1007/978-1-60761-723-5_13
-
Conduction of monovalent and divalent cations in the slow vacuolar channelThe Journal of Membrane Biology 181:55–65.https://doi.org/10.1007/s0023200100073
-
MOLEonline: a web-based tool for analyzing channels, tunnels and pores (2018 update)Nucleic Acids Research 46:W368–W373.https://doi.org/10.1093/nar/gky309
-
Patch clamp measurements on isolated guard-cell protoplasts and vacuolesMethods in Enzymology 174:312–330.https://doi.org/10.1016/0076-6879(89)74025-8
-
Fiji: an open-source platform for biological-image analysisNature Methods 9:676–682.https://doi.org/10.1038/nmeth.2019
-
Involvement of ion channels and active transport in osmoregulation and signaling of higher plant cellsTrends in Biochemical Sciences 14:187–192.https://doi.org/10.1016/0968-0004(89)90272-7
-
Differential contribution of EF-hands to the CaThe Plant Journal 68:424–432.https://doi.org/10.1111/j.1365-313X.2011.04697.x
-
WebsiteA transient expression assay using Arabidopsis mesophyll protoplastsAccessed October 10, 2020.
-
On the structural basis for size-selective permeation of organic cations through the voltage-gated sodium channel: effect of alanine mutations at the DEKA locus on selectivity, inhibition by Ca2+ and H+, and molecular sievingThe Journal of General Physiology 110:693–715.https://doi.org/10.1085/jgp.110.6.693
-
Comparative Protein Structure Modeling Using MODELLERCurrent Protocols in Bioinformatics 54:5.https://doi.org/10.1002/cpbi.3
Article and author information
Author details
Carlos Navarro-Retamal

Funding
Deutsche Forschungsgemeinschaft (Koselleck award HE 1640/42-1)
- Rainer Hedrich
Deutsche Forschungsgemeinschaft (priority programs 'MAdLand - Molecular Adaptation to Land: Plant Evolution to Change' HE 1640/45-1)
- Rainer Hedrich
Deutsche Forschungsgemeinschaft (priority programs 'MAdLand - Molecular Adaptation to Land: Plant Evolution to Change' BE1867/9-1)
- Dirk Becker
China Scholarship Council (doctoral fellowship)
- Jinping Lu
Deutscher Akademischer Austauschdienst (STIPET fellowship)
- Jinping Lu
Comisión Nacional de Investigación Científica y Tecnológica (FONDEQUIP EQM160063)
- Ingo Dreyer
Anilio-Anid (ATE220043)
- Ingo Dreyer
Fondo Nacional de Desarrollo Científico y Tecnológico (3170434)
- Carlos Navarro-Retamal
Fondo Nacional de Desarrollo Científico y Tecnológico (1220504)
- Ingo Dreyer
The funders had no role in study design, data collection, and interpretation, or the decision to submit the work for publication.
Acknowledgements
We are grateful to Parathy Yogendran for transient transfection of HEK293 cells, Matthias Freund and Arthur Korte for support in statistical analysis and transcriptome assembly, respectively, and Armando Carpaneto for discussion. We also thank Heike M. Müller for support in RNA preparation.
Version history
- Preprint posted: December 23, 2021 (view preprint)
- Received: January 23, 2023
- Accepted: October 12, 2023
- Version of Record published: November 22, 2023 (version 1)
Copyright
© 2023, Lu et al.
This article is distributed under the terms of the Creative Commons Attribution License, which permits unrestricted use and redistribution provided that the original author and source are credited.
Metrics
-
- 307
- views
-
- 46
- downloads
-
- 0
- citations
Views, downloads and citations are aggregated across all versions of this paper published by eLife.
Download links
A two-part list of links to download the article, or parts of the article, in various formats.
Downloads (link to download the article as PDF)
Open citations (links to open the citations from this article in various online reference manager services)
Cite this article (links to download the citations from this article in formats compatible with various reference manager tools)
Vicia faba SV channel VfTPC1 is a hyperexcitable variant of plant vacuole Two Pore Channels
eLife 12:e86384.
https://doi.org/10.7554/eLife.86384
Further reading
-
- Plant Biology
Root gravitropic bending represents a fundamental aspect of terrestrial plant physiology. Gravity is perceived by sedimentation of starch-rich plastids (statoliths) to the bottom of the central root cap cells. Following gravity perception, intercellular auxin transport is redirected downwards leading to an asymmetric auxin accumulation at the lower root side causing inhibition of cell expansion, ultimately resulting in downwards bending. How gravity-induced statoliths repositioning is translated into asymmetric auxin distribution remains unclear despite PIN auxin efflux carriers and the Negative Gravitropic Response of roots (NGR) proteins polarize along statolith sedimentation, thus providing a plausible mechanism for auxin flow redirection. In this study, using a functional NGR1-GFP construct, we visualized the NGR1 localization on the statolith surface and plasma membrane (PM) domains in close proximity to the statoliths, correlating with their movements. We determined that NGR1 binding to these PM domains is indispensable for NGR1 functionality and relies on cysteine acylation and adjacent polybasic regions as well as on lipid and sterol PM composition. Detailed timing of the early events following graviperception suggested that both NGR1 repolarization and initial auxin asymmetry precede the visible PIN3 polarization. This discrepancy motivated us to unveil a rapid, NGR-dependent translocation of PIN-activating AGCVIII kinase D6PK towards lower PMs of gravity-perceiving cells, thus providing an attractive model for rapid redirection of auxin fluxes following gravistimulation.
-
- Plant Biology
Plant pathogens secrete proteins, known as effectors, that function in the apoplast or inside plant cells to promote virulence. Effector recognition by cell-surface or cytosolic receptors results in the activation of defence pathways and plant immunity. Despite their importance, our general understanding of fungal effector function and recognition by immunity receptors remains poor. One complication often associated with effectors is their high sequence diversity and lack of identifiable sequence motifs precluding prediction of structure or function. In recent years, several studies have demonstrated that fungal effectors can be grouped into structural classes, despite significant sequence variation and existence across taxonomic groups. Using protein X-ray crystallography, we identify a new structural class of effectors hidden within the secreted in xylem (SIX) effectors from Fusarium oxysporum f. sp. lycopersici (Fol). The recognised effectors Avr1 (SIX4) and Avr3 (SIX1) represent the founding members of the Fol dual-domain (FOLD) effector class, with members containing two distinct domains. Using AlphaFold2, we predicted the full SIX effector repertoire of Fol and show that SIX6 and SIX13 are also FOLD effectors, which we validated experimentally for SIX6. Based on structural prediction and comparisons, we show that FOLD effectors are present within three divisions of fungi and are expanded in pathogens and symbionts. Further structural comparisons demonstrate that Fol secretes effectors that adopt a limited number of structural folds during infection of tomato. This analysis also revealed a structural relationship between transcriptionally co-regulated effector pairs. We make use of the Avr1 structure to understand its recognition by the I receptor, which leads to disease resistance in tomato. This study represents an important advance in our understanding of Fol-tomato, and by extension plant–fungal interactions, which will assist in the development of novel control and engineering strategies to combat plant pathogens.


